Entropy Generation in Flow of Highly Concentrated Non-Newtonian Emulsions in Smooth Tubes

Abstract
: Entropy generation in adiabatic flow of highly concentrated non-Newtonian emulsions in smooth tubes of five different diameters (7.15–26.54 mm) was investigated experimentally. The emulsions were of oil-in-water type with dispersed-phase concentration (φ ) ranging from 59.61–72.21% vol. The emulsions exhibited shear-thinning behavior in that the viscosity decreased with the increase in shear rate. The shear-stress (τ ) versus shear rate (γ̇ ) data of emulsions could be described well by the power-law model: τ = Kγ̇n. The flow behavior index n was less than 1 and it decreased sharply with the increase in φ whereas the consistency index K increased rapidly with the increase in φ. For a given emulsion and tube diameter, the entropy generation rate per unit tube length increased linearly with the increase in the generalized Reynolds number ( Re_ n ) on a log-log scale. For emulsions with φ ≤ 65.15 % vol., the entropy generation rate decreased with the increase in tube diameter. A reverse trend in diameter-dependence was observed for the emulsion with φ of 72.21% vol. New models are developed for the prediction of entropy generation rate in flow of power-law emulsions in smooth tubes. The experimental data shows good agreement with the proposed models.PACS Codes: 5; 47; 821. Introduction
According to the Gouy-Stodola theorem, the rate of loss of work or available energy in a process is directly proportional to the total rate of entropy generation within and outside the control volume. The Gouy-Stodola theorem is expressed mathematically as [1]:
where Ẇlost is the rate of lost work, To is the surroundings temperature, and ṠG,total is the total rate of entropy generation within and outside the control volume. The greater the rate of entropy generation due to internal and external irreversibilities, the greater is the amount of energy that becomes unavailable for work [2–4]. Thus, it is important from a practical point of view to estimate the rate of entropy generation in a process in order to determine the thermodynamic efficiency of the process.
This article is related to entropy generation in flow of highly concentrated non-Newtonian emulsions of oil-in-water type in smooth tubes. The oil-in-water (designated as O/W) emulsions consist of oil droplets dispersed in a continuum of aqueous phase. Such emulsions are very important industrially [5]. For example, a large number of skincare and makeup creams marketed today are in the form of O/W emulsions. One important function of these creams is to prevent dryness of skin by replacing lost moisture and by keeping the skin hydrated over a period of time. The O/W emulsions are of considerable importance in the food industry as well. Examples of food emulsions (O/W type) are: milk, mayonnaise, coffee whiteners, and salad dressings. The dispersed-phase (oil droplets) concentration of food emulsions could range from low to very high. For example, milk consists of 3–4 volume percent of dispersed-phase whereas mayonnaise consists of more than 65 volume percent dispersed phase (oil droplets). The pipeline transportation of highly viscous crude oils in the form of O/W emulsions has also received special attention in recent years [6–8]. The transportation of highly viscous crude oils, such as bitumen and heavy oils, by pipelines is difficult, especially during cold weather. To facilitate the flow of highly viscous crude oils in pipelines, it is necessary to reduce their viscosity. This can be achieved by forming emulsions of O/W type with crude oil as the dispersed phase. The concept of crude oil transportation in the form of O/W emulsion has already been utilized commercially in a pipeline 21 km in length and 20 cm in diameter in California, and in a pipeline 238 km in length and 51 cm in diameter in Indonesia [7]. For emulsion pipelining to be economical, it is important to keep the dispersed-phase (oil) concentration of the emulsion as high as possible and, at the same time, maintain the emulsion viscosity at a reasonable level. However, concentrated O/W emulsions are known to exhibit non-Newtonian shear-thinning behavior.
In light of the industrial applications of emulsions just mentioned, it is of practical significance to investigate the production of entropy in emulsion flow in pipelines and other process equipment. In the past, a number of research articles have been published on simultaneous flow of oil and water in pipelines [7,9–22]. The published studies deal with topics such as: phase inversion in emulsion flow [9–12], droplet size and droplet size distribution in emulsion flow [13,14], flow patterns in concurrent flow of oil and water in pipelines [15–17], and pressure drop in pipeline flow of emulsions [7,16–22]. However, little or no attention has been given to the second law analysis and entropy generation in emulsion flows despite the practical significance of the problem.
This work is in continuation of our earlier study on the production of entropy in flow of emulsions in smooth tubes [23]. Our earlier study was restricted to entropy generation in flow of dilute to moderately concentrated water-in-oil (W/O) emulsions. The emulsions were Newtonian in nature. The key objective of the present work is to experimentally investigate the generation of entropy in flow of highly concentrated surfactant-stabilized oil-in-water (O/W) emulsions in different diameter tubes. These emulsions exhibited non-Newtonian shear-thinning behavior. Models are also developed for the prediction of entropy generation rate in flow of power-law emulsions in smooth tubes.
It should be pointed out that a number of interesting research articles have been published recently on heat transfer and entropy generation in flow of Newtonian and non-Newtonian fluids [24–33]. Several published articles also deal with the fluid mechanics, thermodynamics, and stability of non-Newtonian fluids in different configurations [34–36]. However, the published studies mostly deal with analytical solutions and simulations related to homogeneous fluids. To our knowledge, little or no experimental and theoretical work has been reported on entropy generation in flow of concentrated non-Newtonian emulsions in tubes.
2. Theoretical Background
Consider a control volume with multiple inlets and outlets. Let the control volume be in contact with N heat reservoirs at temperatures Ti ’s and the environment at To. Let the rates of heat transfer from heat reservoirs to the control volume be Q̇i ’s and from environment to the control volume be Q̇o. Let the temperatures of the control volume boundary portions in contact with the heat reservoirs and the environment be Tbi ’s and Tbo, respectively. Entropy balance on the control volume gives:
where ṁ is the mass flow rate, s is the specific entropy, ṠG is the rate of entropy generation, “In” refers to inlets, “Out” refers to outlets, and subscript “CV” refers to control volume. Doing entropy balance on the surroundings, one can write:
This equation could be re-cast as:
Adding the entropy balances for control volume and surroundings, the following result is obtained:
This equation could be re-cast as:
The thermodynamic efficiency η of a flow process is defined as the ratio of actual shaft work (Ẇsh ) produced to the maximum shaft work (Ẇsh,ideal) obtainable from a given change in the properties of the flow streams [2,4]. Thus:
Using the Gouy-Stodola theorem, the thermodynamic efficiency of a process can be expressed as:
According to the second law of thermodynamics, ṠG,total; > 0 for any irreversible process and therefore, the efficiency of a process expressed in Equation (8) is always less than one. Only in the limiting case of complete reversibility where the process is completely reversible without any internal and external irreversibilities, ṠG,total = 0 and the thermodynamic efficiency of the process is one.
Consider now the steady and adiabatic flow of fluid in a pipe. According to Equation (2):
For adiabatic incompressible flow in a horizontal pipe in the absence of any shaft work, the enthalpy change is zero (Δh = h2 − h1 = 0) according to the first law for open systems. Using the following fundamental thermodynamic relation:
it follows that:
where T is temperature, P is pressure, ρ is density, and dP / dx is pressure gradient in the direction of flow. Combining Equations (9) and (11), we obtain:
where is the rate of entropy generation per unit pipe length.
The Fanning friction factor f in pipe flow is defined as:
where D is the pipe diameter and V̄ is the average fluid velocity in pipe. From Equations (12) and (13), it follows that:
In pipeline flow of non-Newtonian power-law fluids, friction factor is related to the generalized Reynolds number Re_ n defined as:
where K and n are the power-law parameters which appear in the following power-law model of the fluid:
In this power law model, τ is the shear stress and γ̇ is the shear rate. The power-law parameter K is often referred to as “consistency index” and n is called “flow behavior index”. For Newtonian fluids, n =1 and K = μ (μ is the viscosity) and the generalized Reynolds number Re_ n reduces to the conventional Reynolds number. For pseudo-plastic (shear-thinning) fluids, n <1 and for dilatant (shear-thickening) fluids, n >1.
From Equations (14) and (15), it can be readily shown that:
where an is given as :
When the fluid is Newtonian, n =1, K = μ, an = μ, and the expression for entropy generation rate per unit pipe length reduces to :
where Re is the conventional Reynolds number defined as: Re = ρDV̄ /μ. Equation (19) was derived in our previous study [23] on entropy generation in pipeline flow of Newtonian emulsions.
For laminar flow of non-Newtonian power-law fluids in pipes, the friction factor is related to the generalized Reynolds number Re_ n as follows:
For turbulent flow of non-Newtonian power-law fluids in hydraulically smooth pipes, the friction factor is given by the following Dodge-Metzner equation [37]:
The Dodge-Metzner equation reduces to the well-known Prandtl-von Karman law in the special case of Newtonian fluids ( n =1, K =μ ):
The disadvantage of Equation (21) is that it is not explicit in f and has to be solved numerically. Dodge and Metzner [37] also proposed a Blasius-type equation explicit in f for non-Newtonian fluids:
where αn and βn are functions of n reported graphically. The plots of αn versus n and βn versus n can be described accurately by the following expressions:
The critical Reynolds number for transition from laminar to turbulent flow in power-law non-Newtonian fluids is given as [38]:
Substitution of the friction factor expressions from Equations (20) and (23) into Equation (17) leads to the following relations for entropy production in pipeline flow of non-Newtonian power-law fluids:
where an is given by Equation (18), αn by Equation (24), and βn by Equation (25). Equations (27) and (28) are the new predictive models for entropy generation per unit length in pipeline flow of non-Newtonian power-law fluids. These models could be applied to non-Newtonian (power-law) pseudo-homogeneous mixtures of two phases such as emulsions of oil and water. When the fluid is Newtonian, n =1, K =μ, these expressions reduce to:
Equations (29) and (30) were derived in our previous study [23] on entropy generation in pipeline flow of Newtonian emulsions.
3. Model Predictions
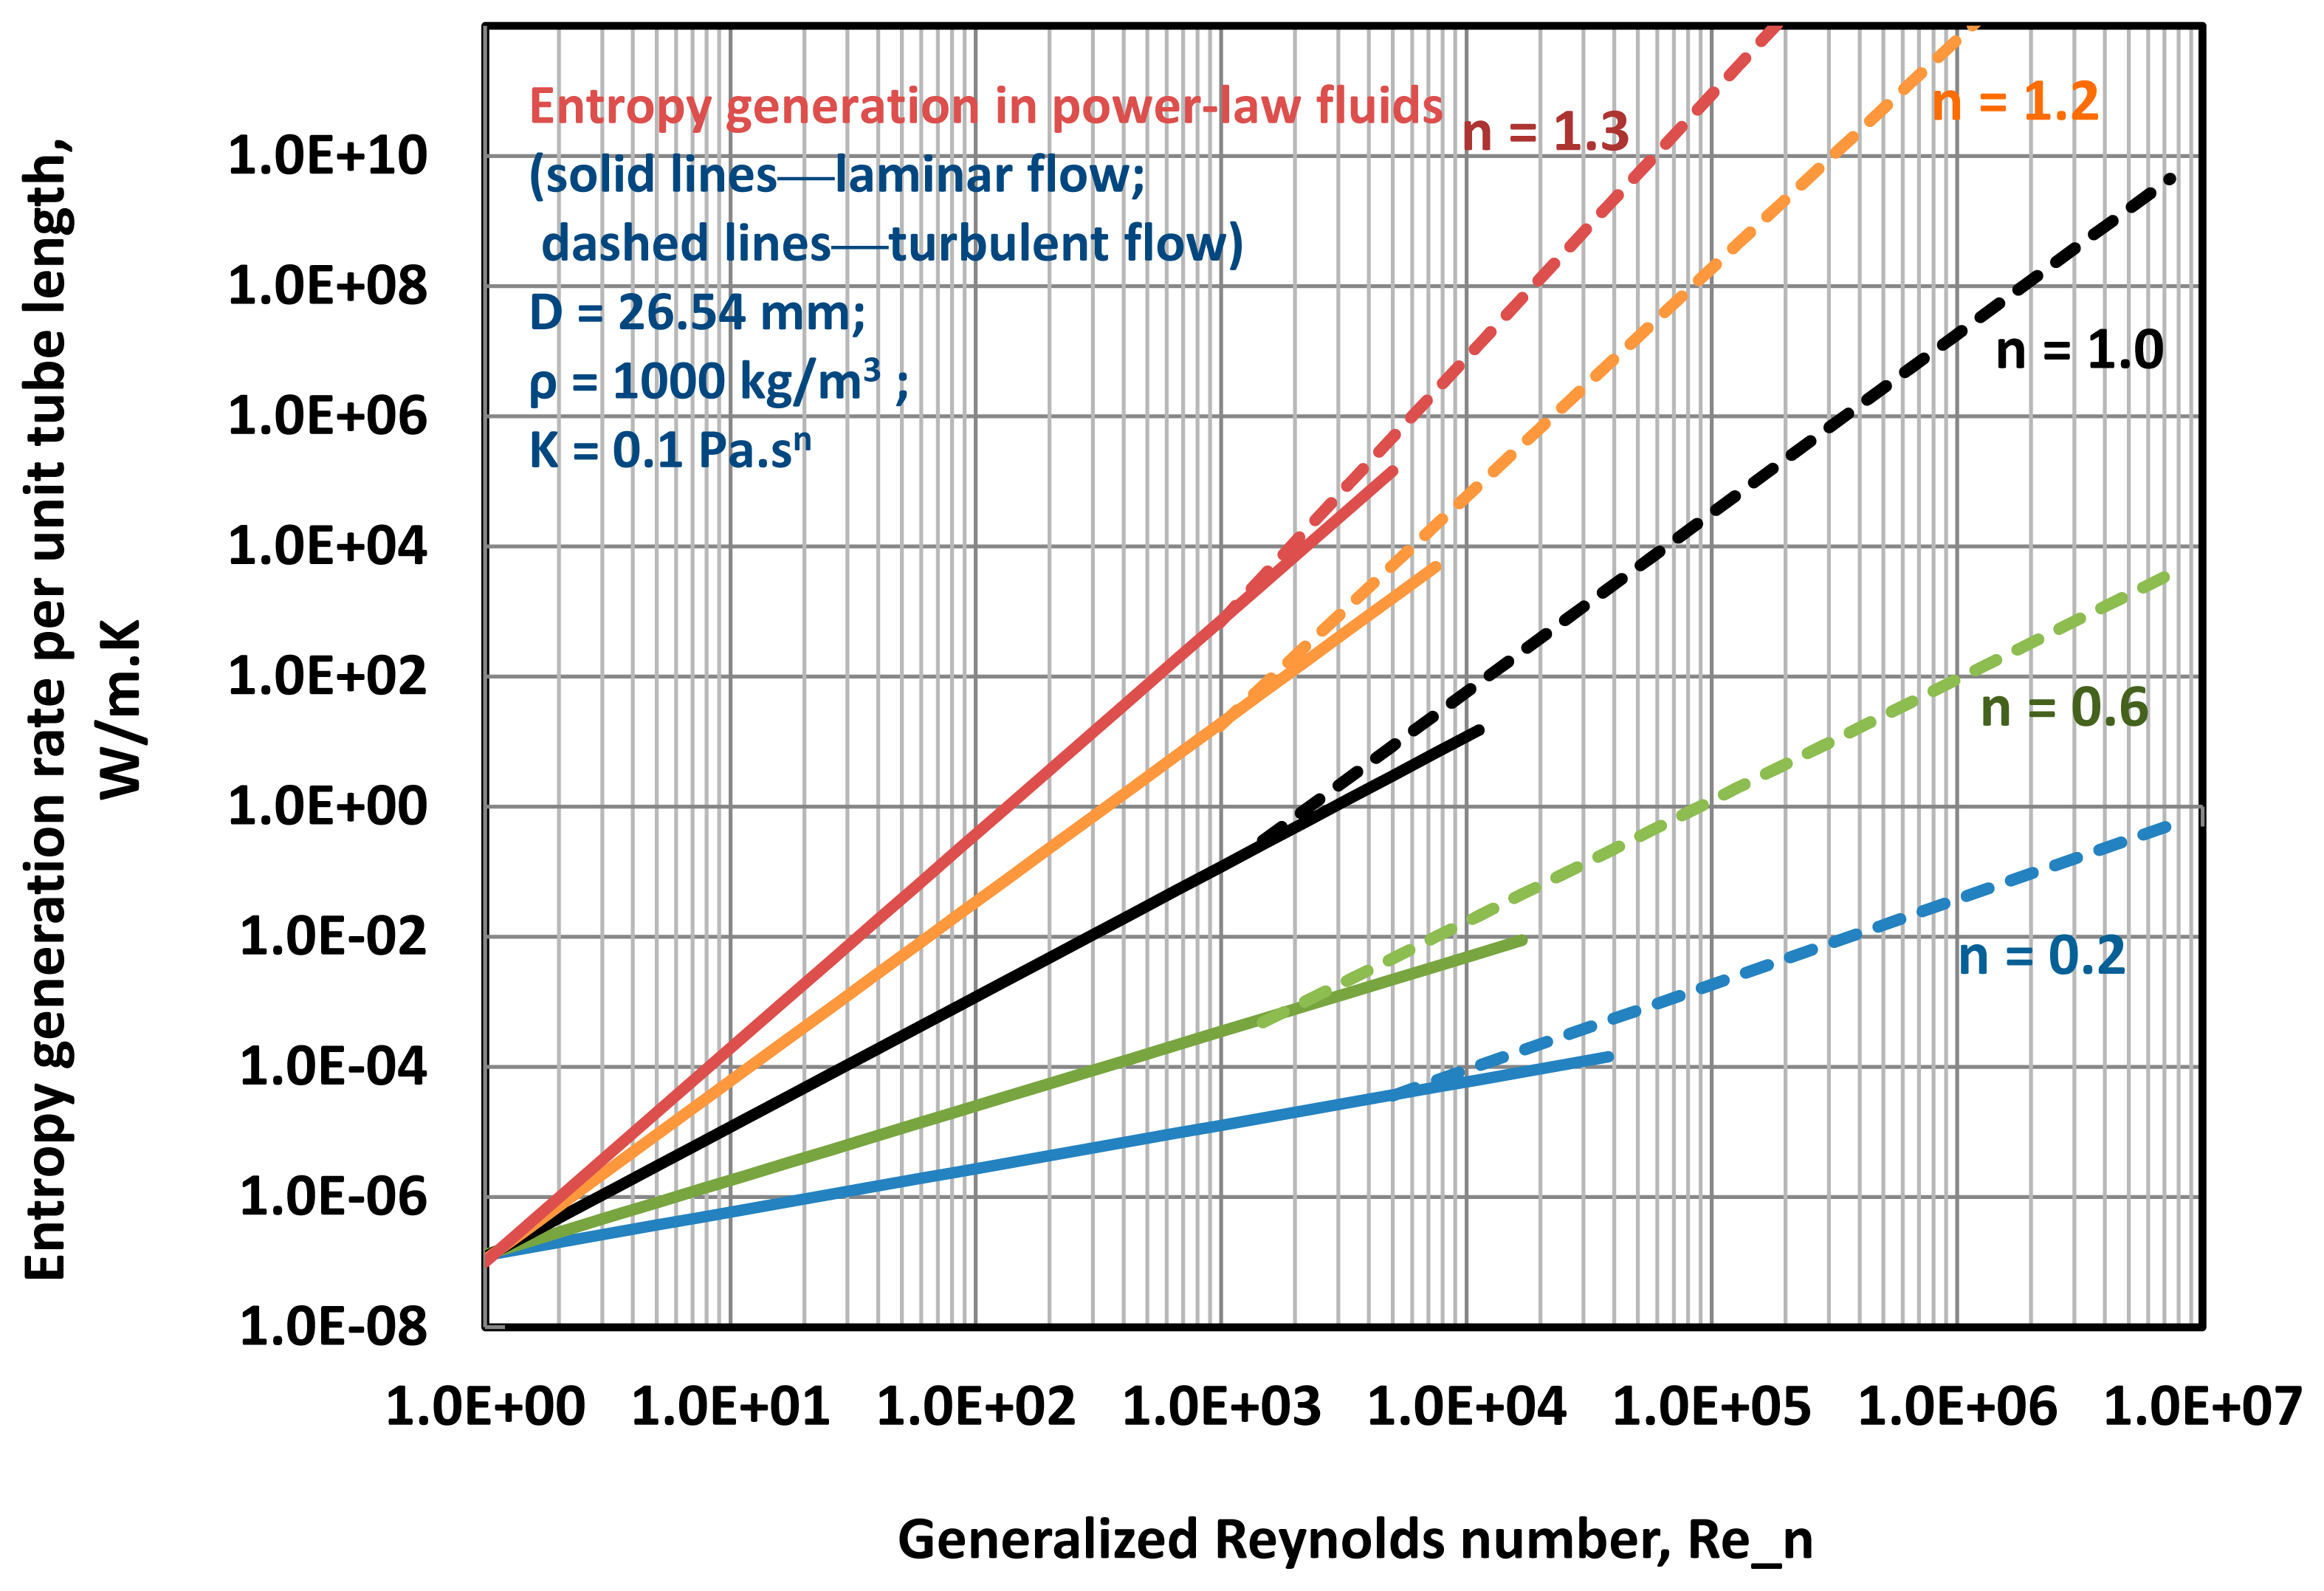
Figure 1 shows the effect of flow behavior index n on entropy generation rate in flow of non-Newtonian power-law fluids in a smooth tube. The plots of versus Re_ n are generated from model Equations (27) and (28) for different values of n. The tube diameter is 26.54 mm and the fluid properties are as follows: ρ =1000kg /m3 and K = 0.1 Pa.sn. The figure indicates that: (a) for a given value of n, the entropy generation rate increases linearly with the increase in generalized Reynolds number on a log-log scale, in both laminar and turbulent regimes. However, the slope in the turbulent regime is higher; (b) for a given value of Re_ n, the entropy generation rate per unit tube length increases with the increase in the value of the flow behavior index n. This indicates that flow of pseudo-plastic fluids ( n <1 ) is more efficient thermodynamically in comparison with dilatant fluids ( n >1).
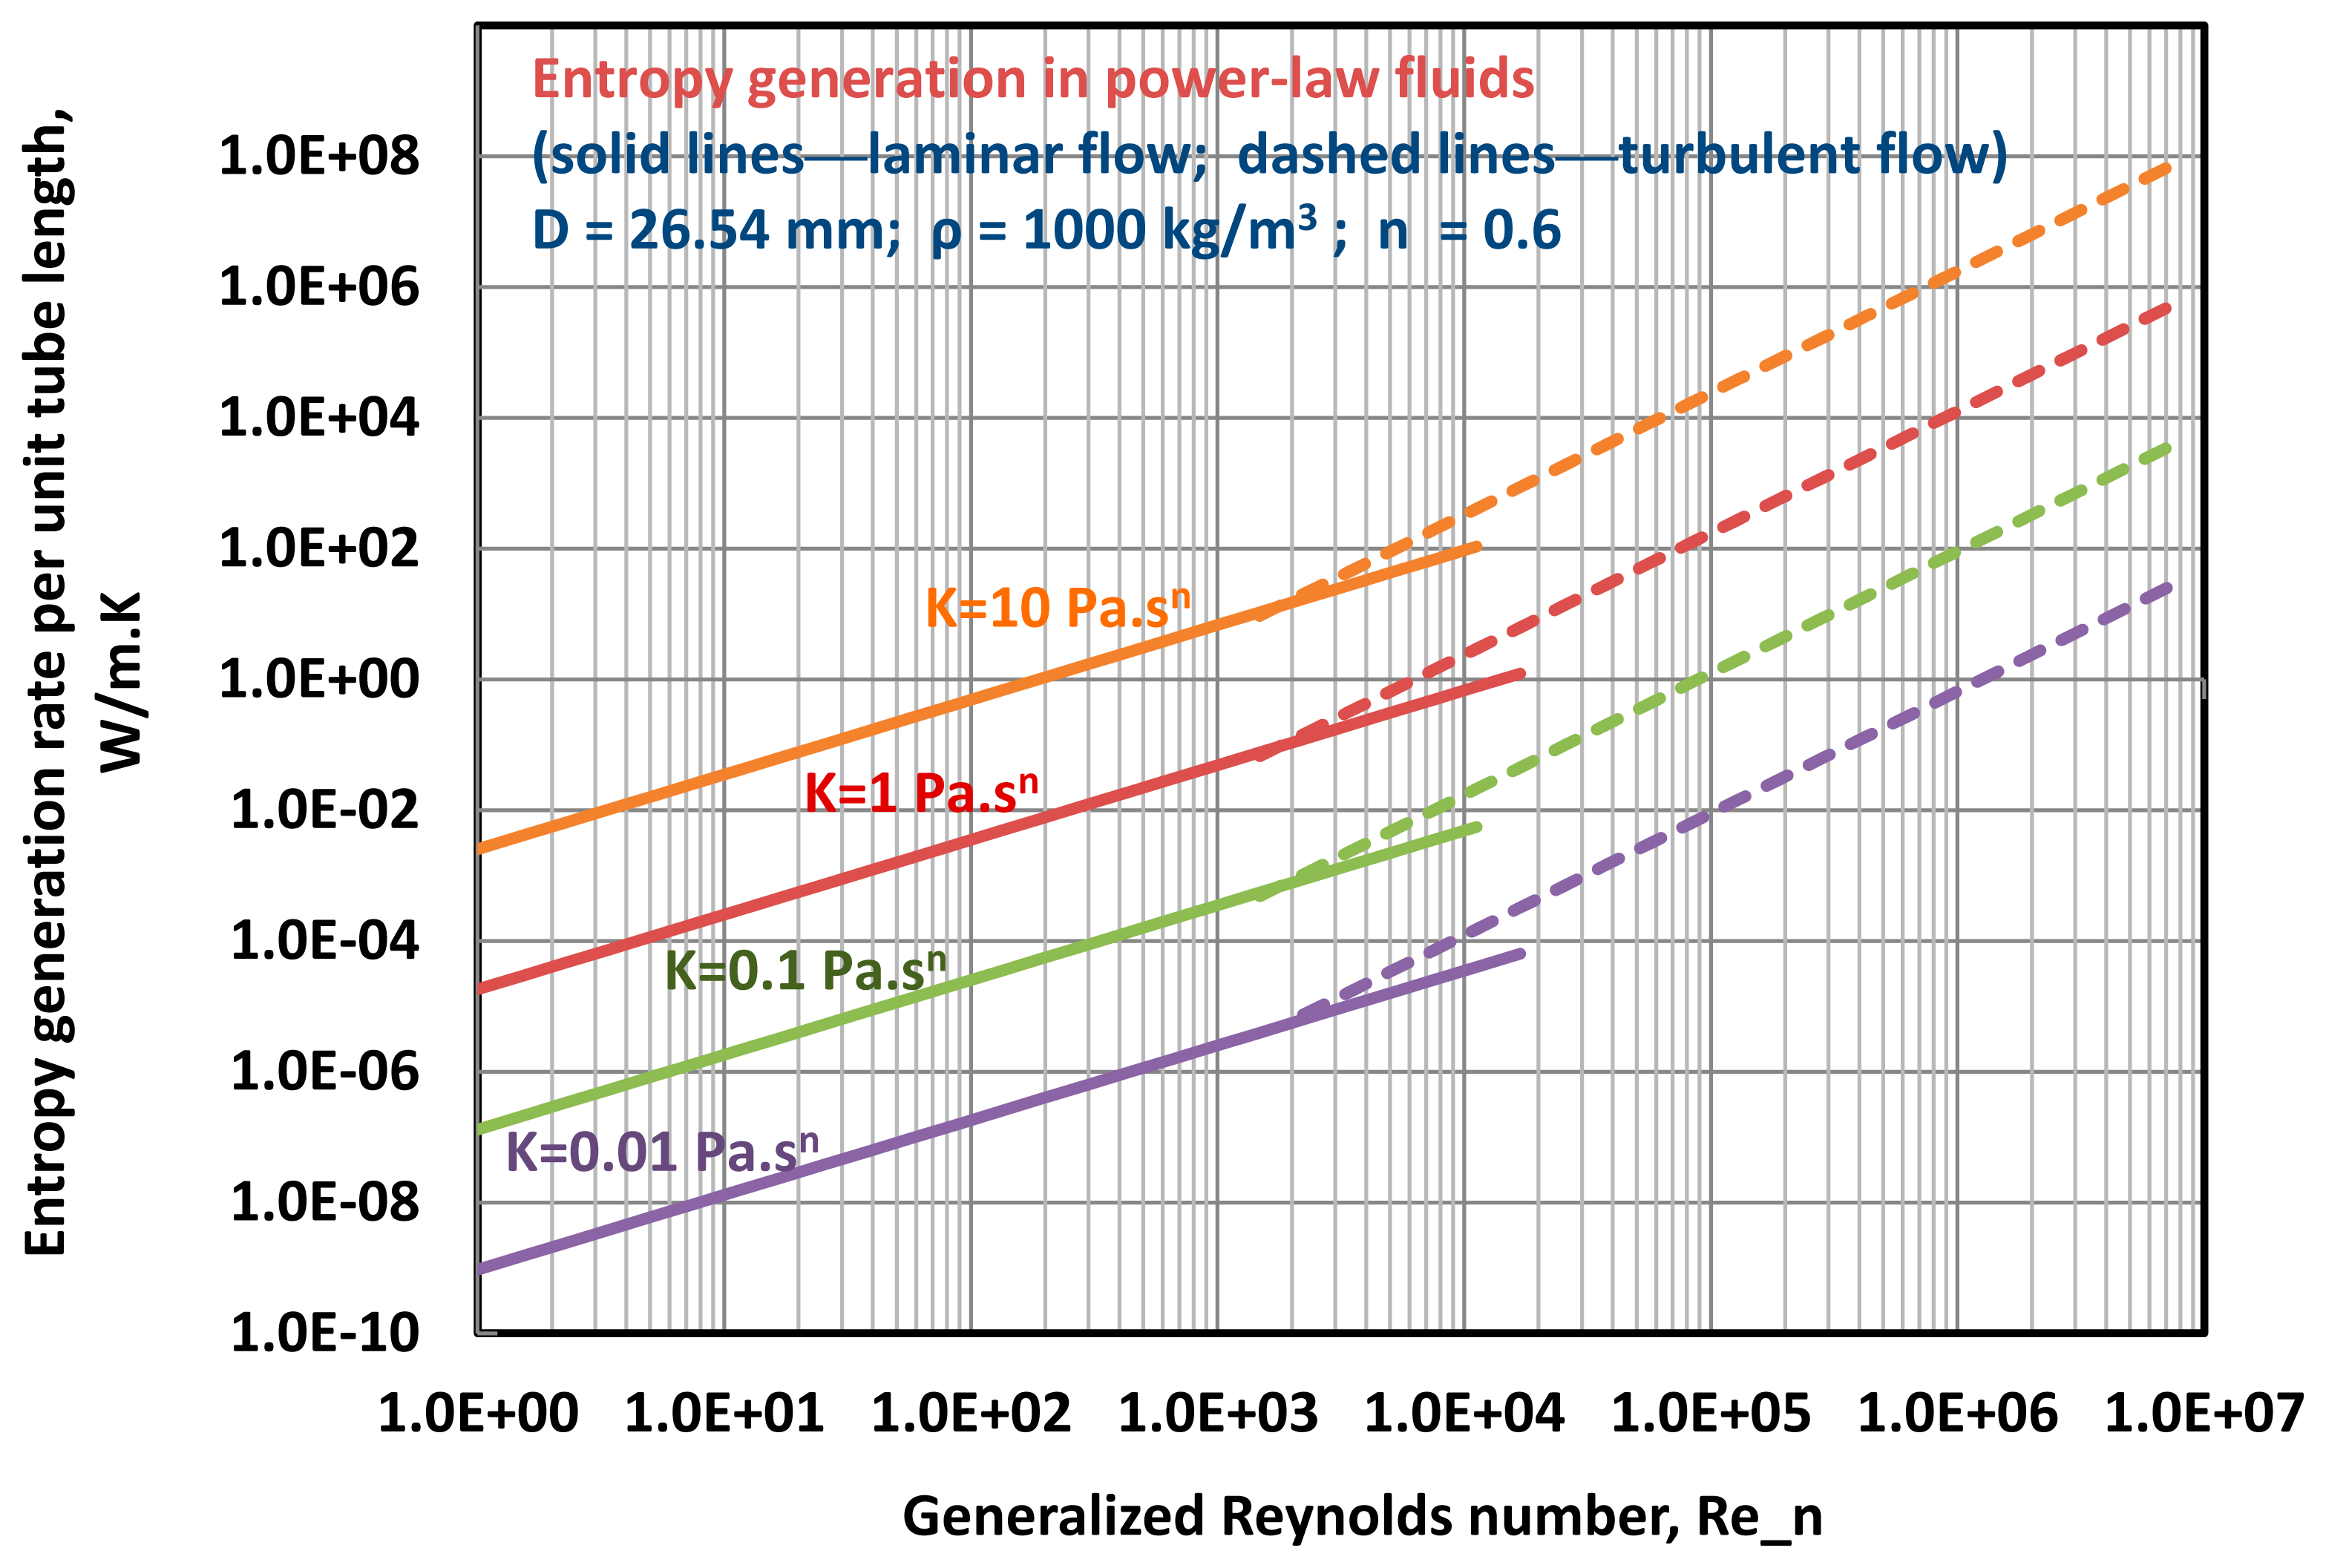
The influence of consistency index K on entropy generation rate in flow of power-law fluids in a smooth tube is shown in Figure 2. The plots of versus Re_ n shown in the figure are generated from model Equations (27) and (28) for different values of K. The tube diameter is 26.54 mm and the fluid properties are as follows: ρ =1000kg /m3 and n = 0.6. With the increase in K, a constant upward shift is observed in the plot of versus Re_ n. This indicates that for a given value of Re_ n, the entropy generation rate per unit tube length increases with the increase in K value.
4. Experimental Work
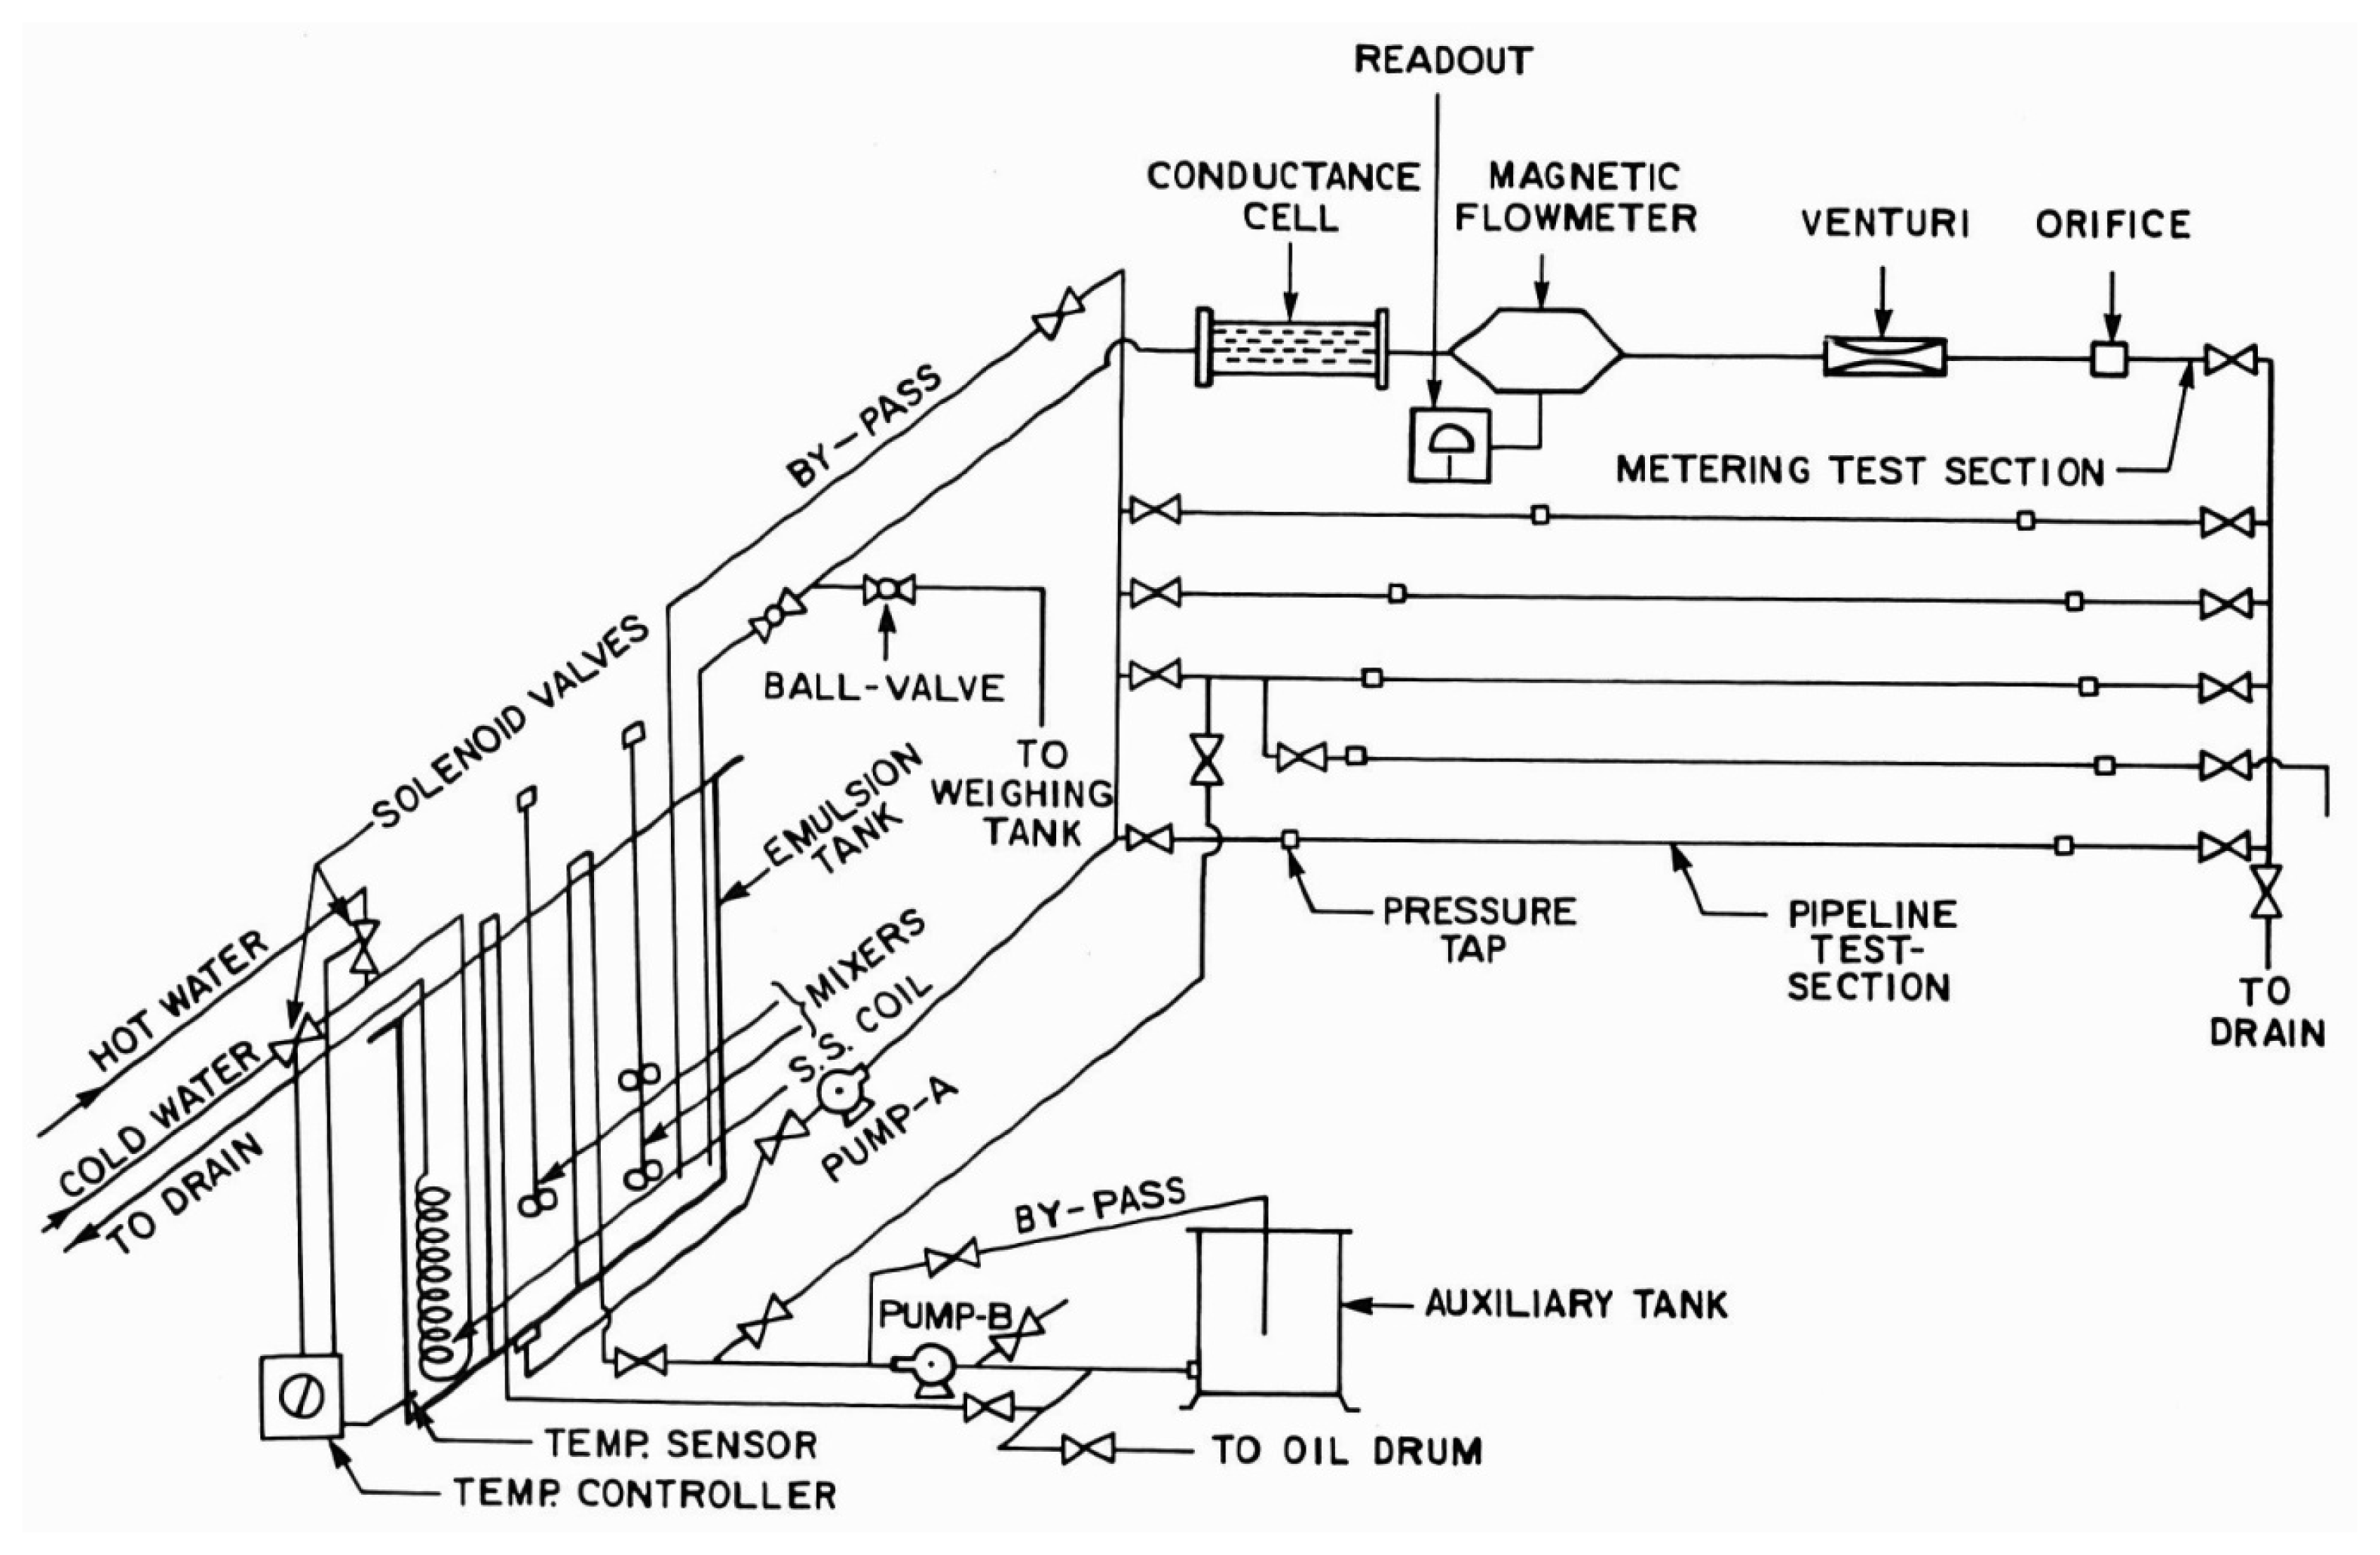
Figure 3 shows a schematic diagram of the flow rig that was designed and developed to experimentally investigate of the rate of entropy generation in flow of emulsions in smooth tubes. Five different diameter tubes (stainless steel, seamless) were installed horizontally. The various dimensions of the test sections are summarized in Table 1. The emulsions were prepared in a large mixing tank (capacity about 1 m3) equipped with baffles, two high shear mixers, heating/cooling coil, and a temperature controller. The emulsion from the mixing tank was circulated to the tube test sections, one at a time, by a centrifugal pump. From the tube test section, the emulsion was allowed to return to the mixing tank via the metering section where its flow rate was measured.
The pressure drops in various tubes were measured by means of pressure transducers. The output signals from the pressure transducers were recorded by a microcomputer data-acquisition system. Further details about the flow rig can be found in our earlier publication [23].
The emulsions were prepared using 1% by wt. surfactant solution in tap water and a refined mineral oil (Bayol-35). Triton X-100 (isooctylphenoxypolyethoxy ethanol) was used as a surfactant. This is a water soluble non-ionic surfactant. The oil had a density of 780 kg/m3 and a viscosity of 2.41 mPa.s at 25 °C. The oil-in-water emulsions of three different dispersed phase (oil) concentrations were prepared; the dispersed phase concentrations were 59.61%, 65.15%, and 72.21% by volume. The emulsions produced were highly stable with respect to coalescence.
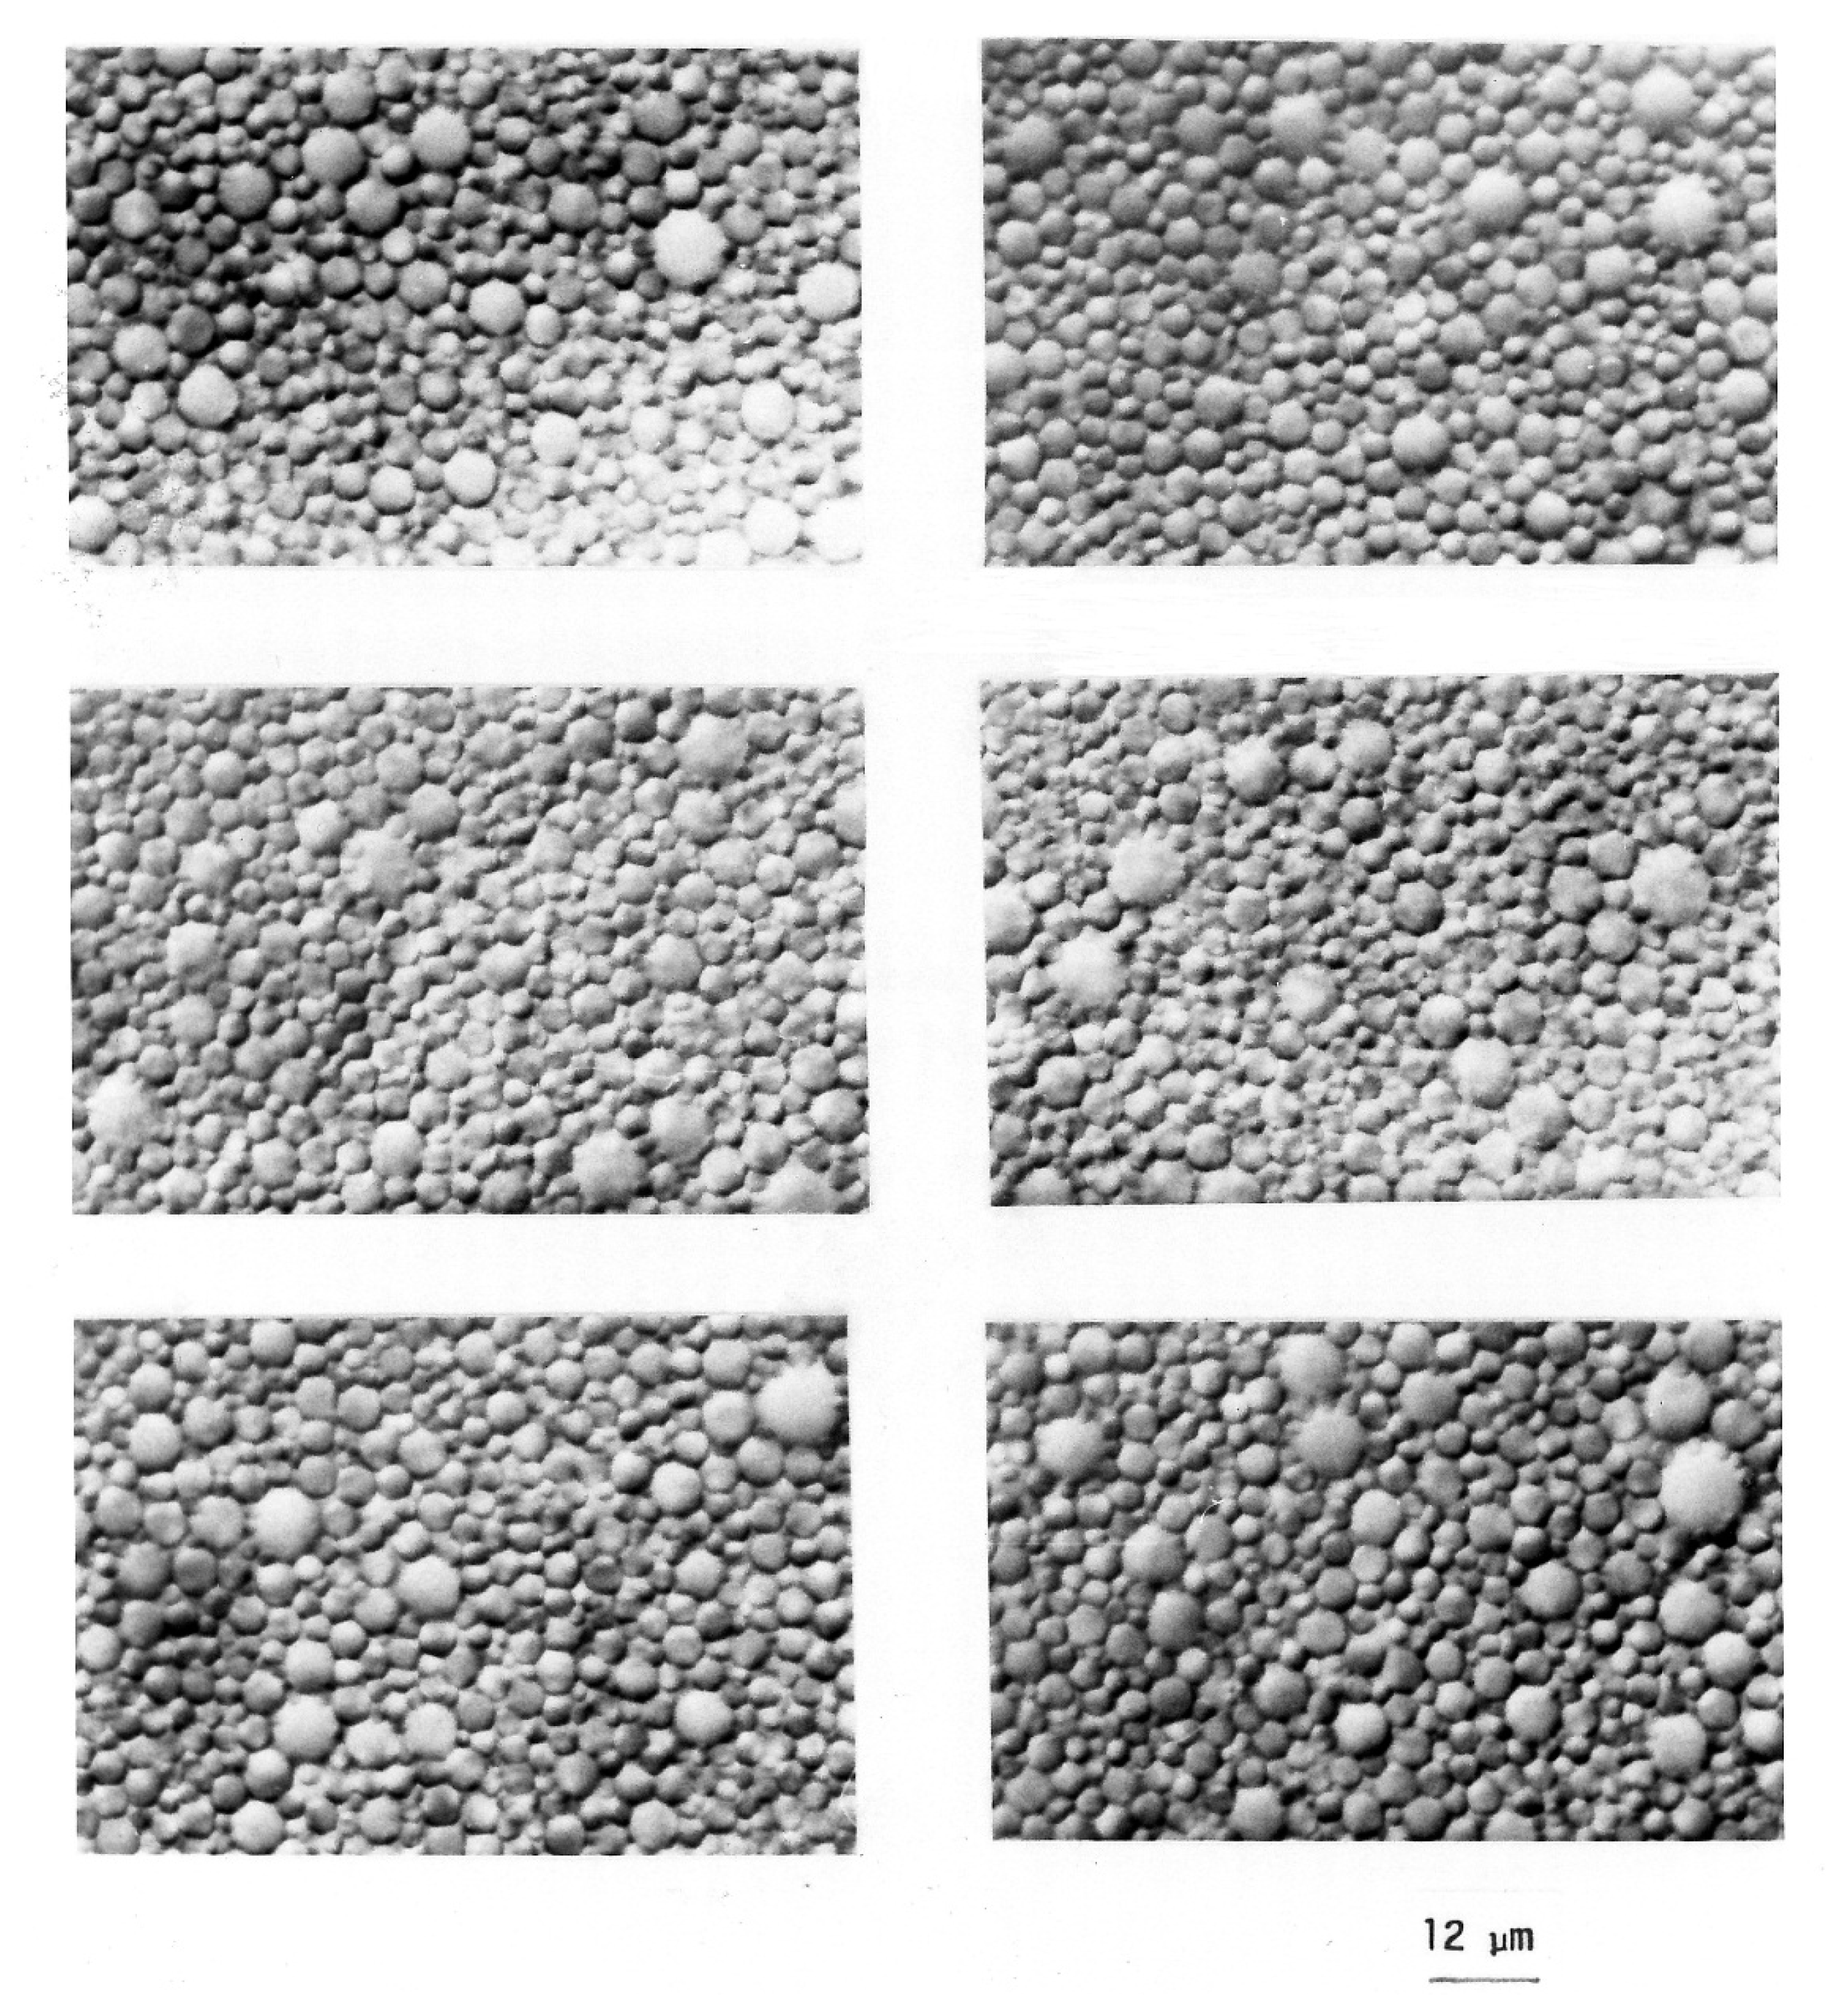
A Fann coaxial cylinder viscometer was used to determine the rheological behavior (shear stress versus shear rate) of emulsions. The droplet size information of emulsion was obtained by taking photomicrographs with a Zeiss optical microscope.
The experimental work was conducted at a constant temperature of 25 °C. The temperature was maintained constant in the flow loop with the help of a temperature controller installed in the mixing tank.
5. Experimental Results and Discussion
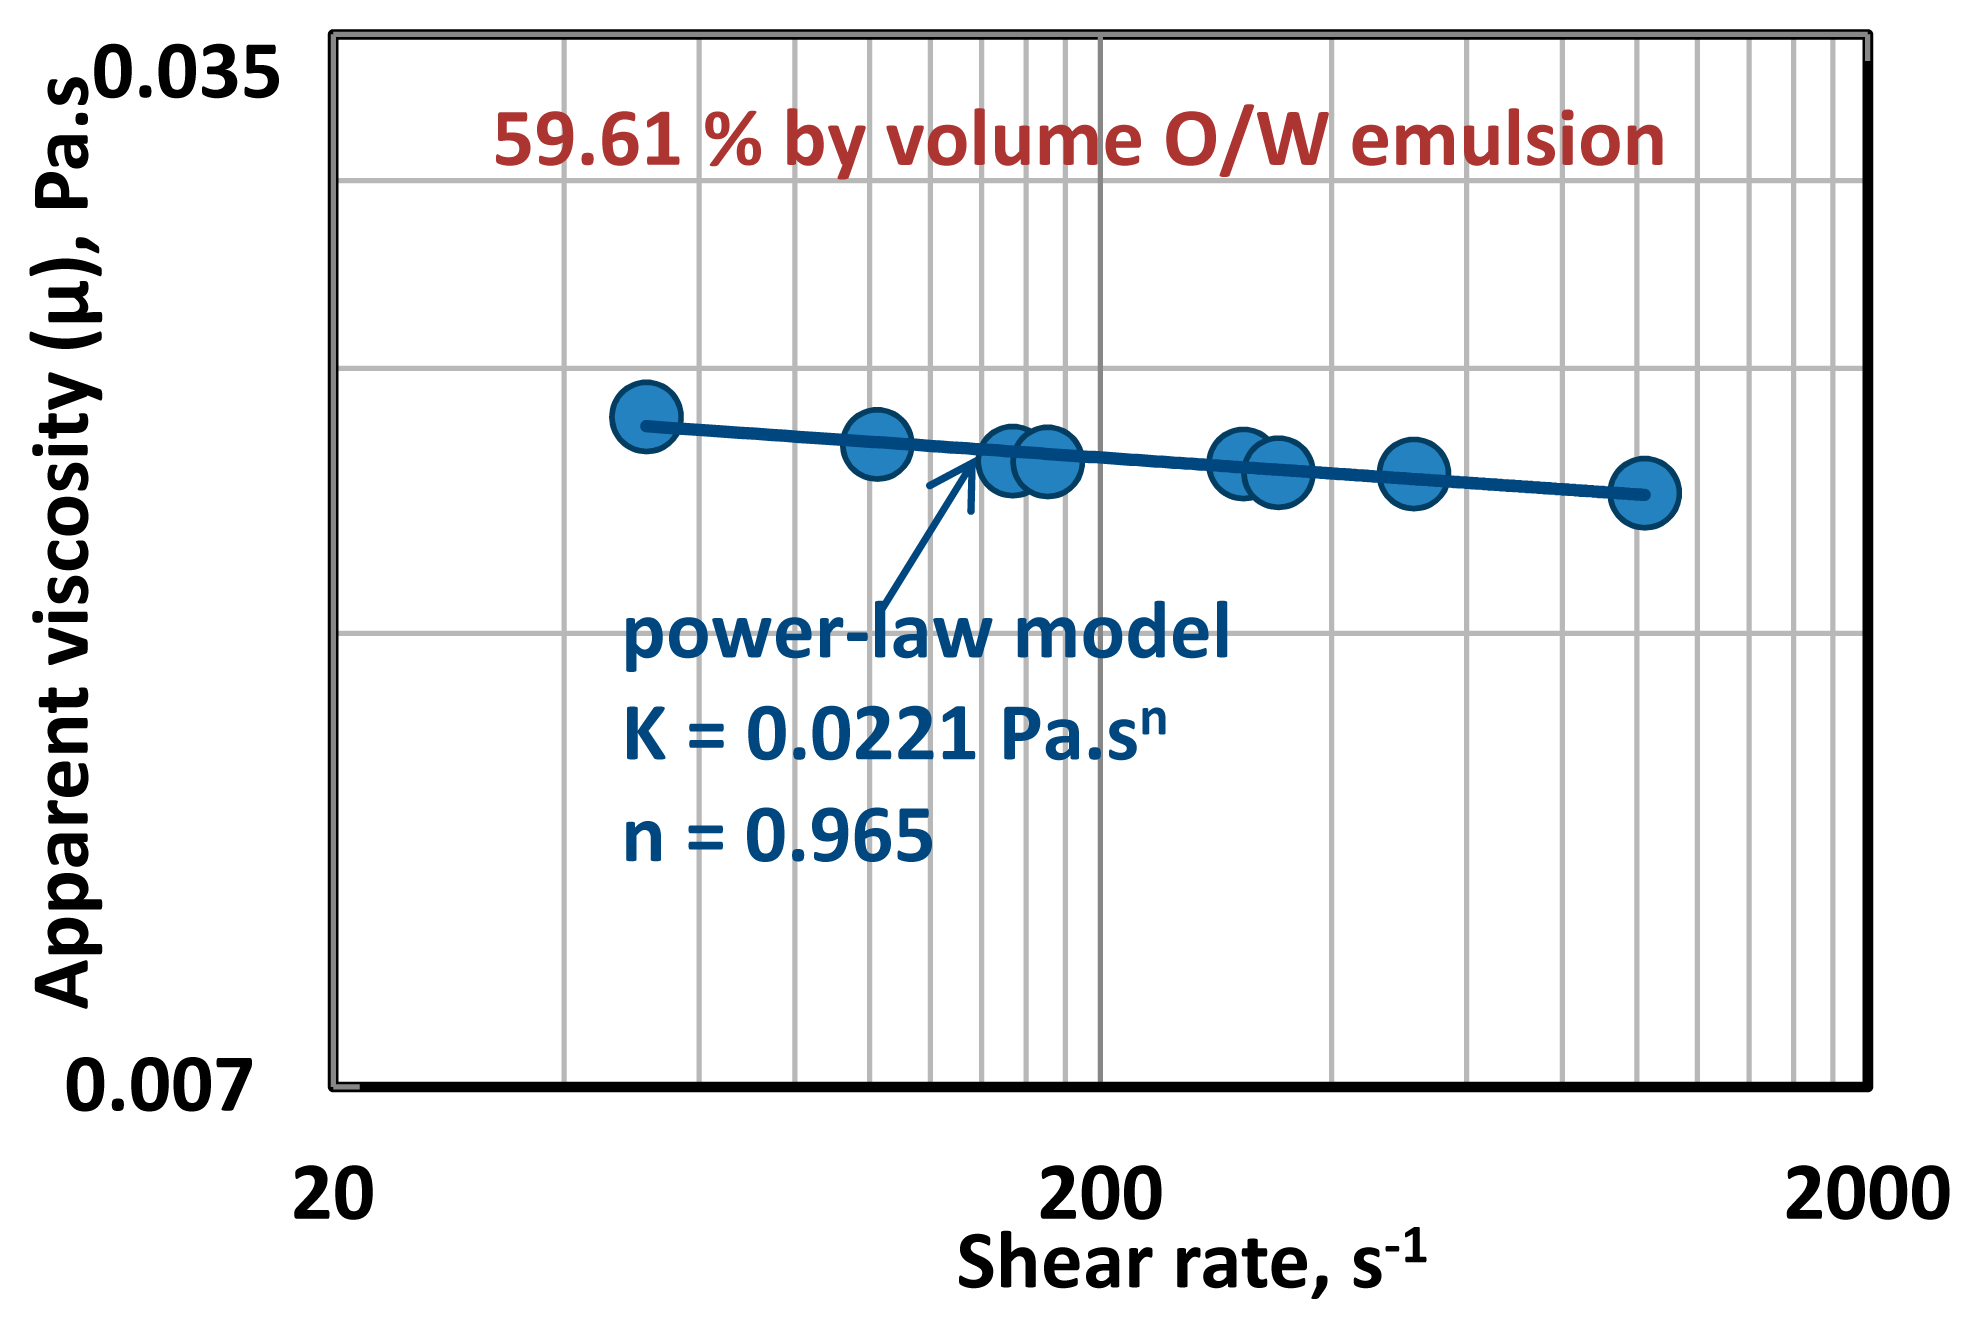
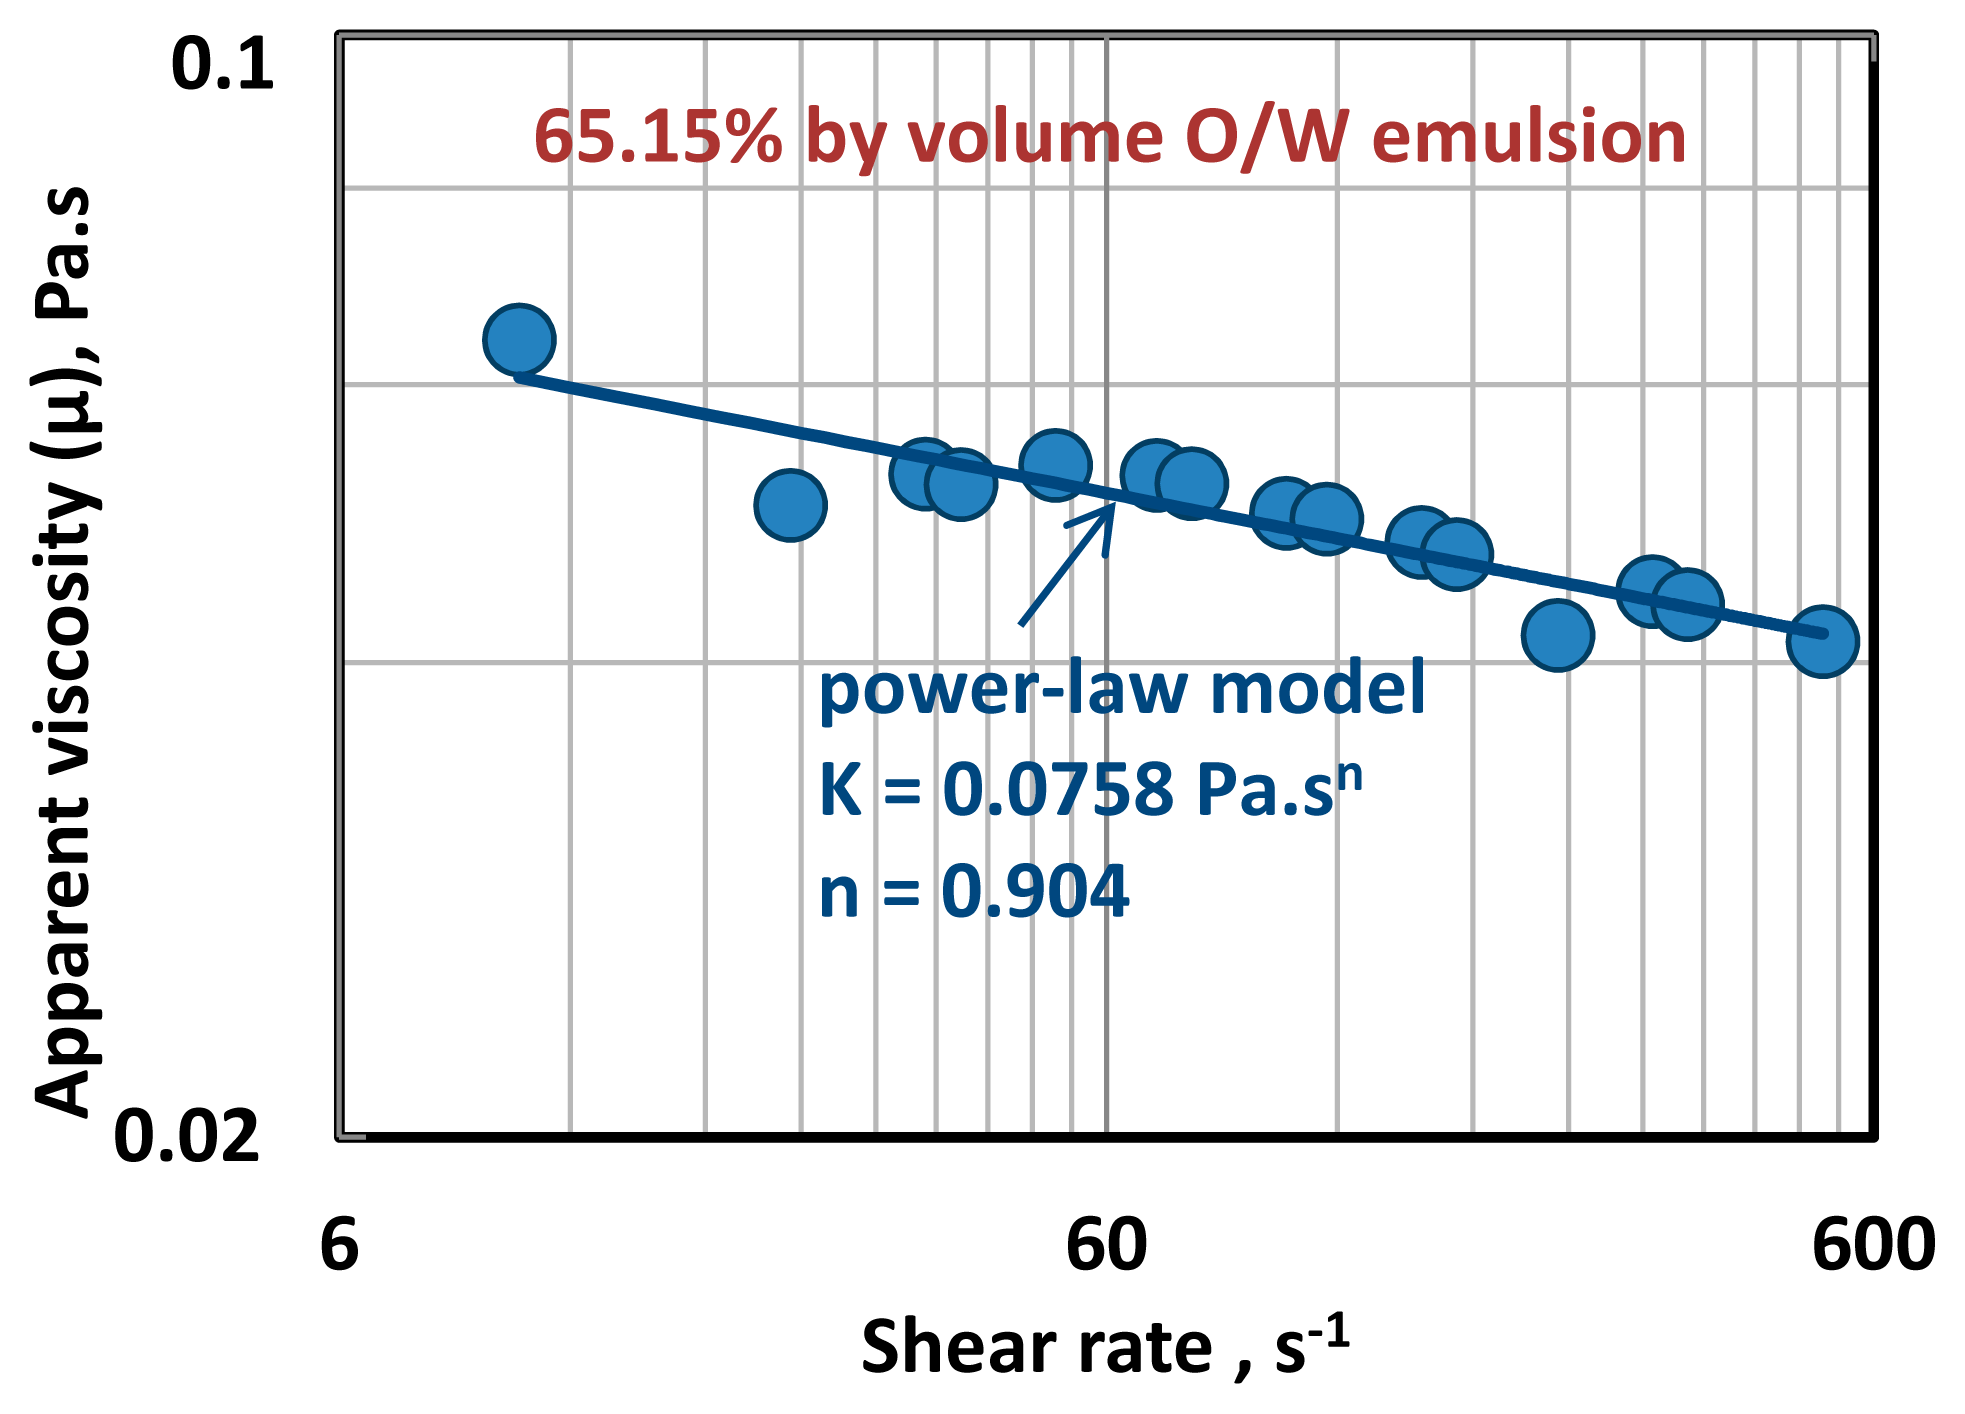
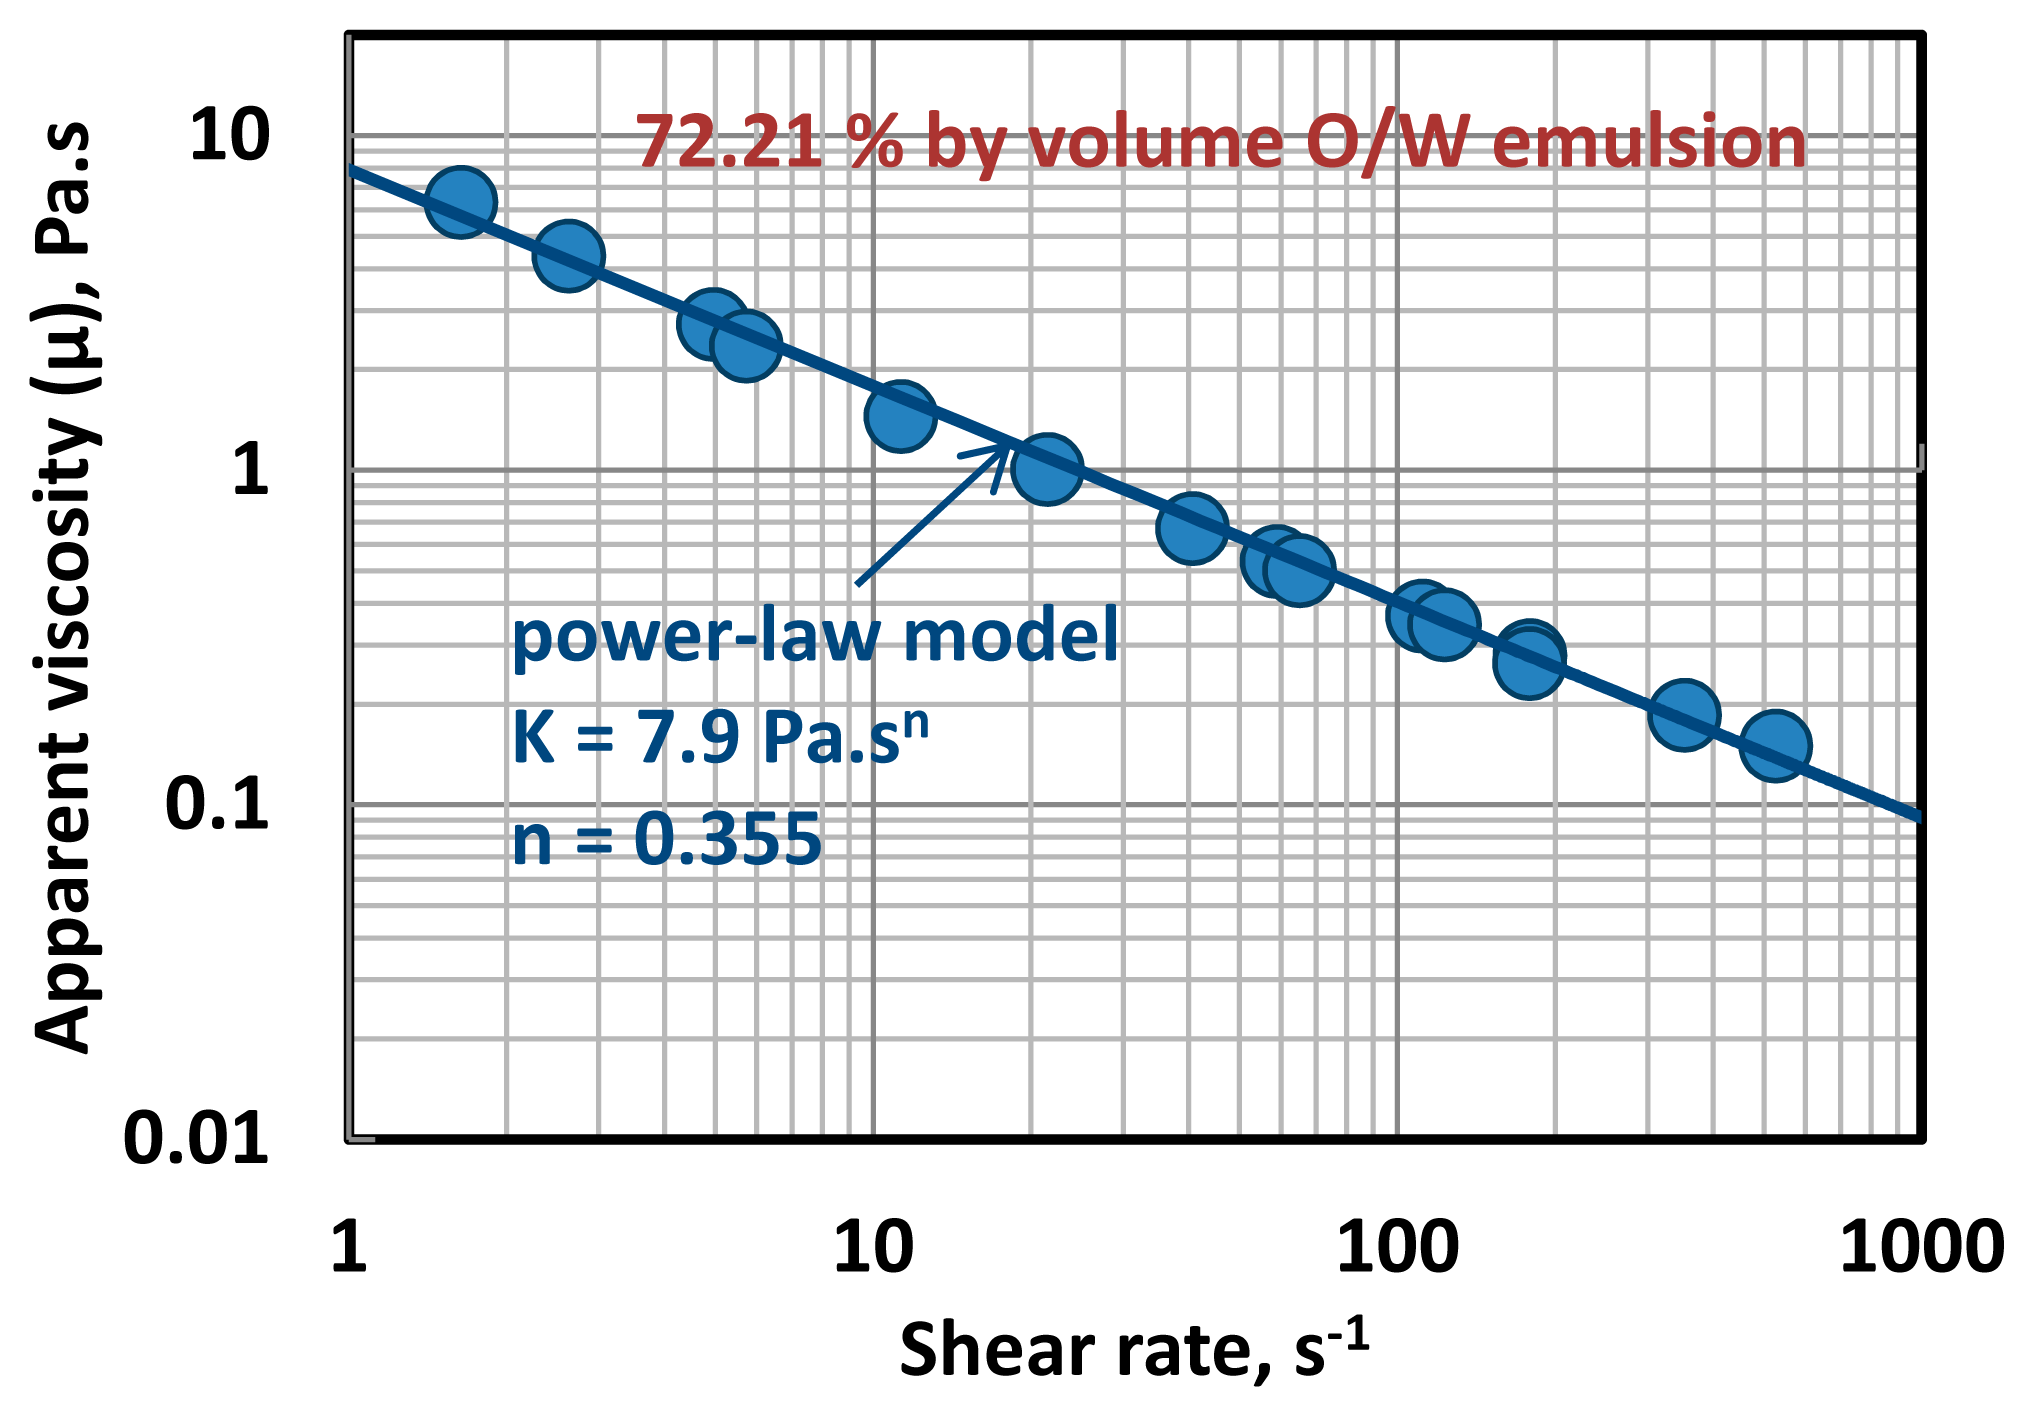
Figure 4 shows typical photomicrographs of oil droplets of an emulsion. The droplets are smaller than 12 μm in diameter. The viscosity versus shear rate plots of emulsions are shown in Figures 5–7.
The apparent viscosity μ, defined as the ratio of shear stress (τ ) to shear rate (γ̇ ), decreases with the increase in shear rate indicative of shear-thinning non-Newtonian behavior of emulsions. The plots of μ versus γ̇ follow a linear relationship on a log-log scale indicating that emulsions follow a power-law model (Equation (16)). Note that the power-law model (Equation (16)) could be expressed as:
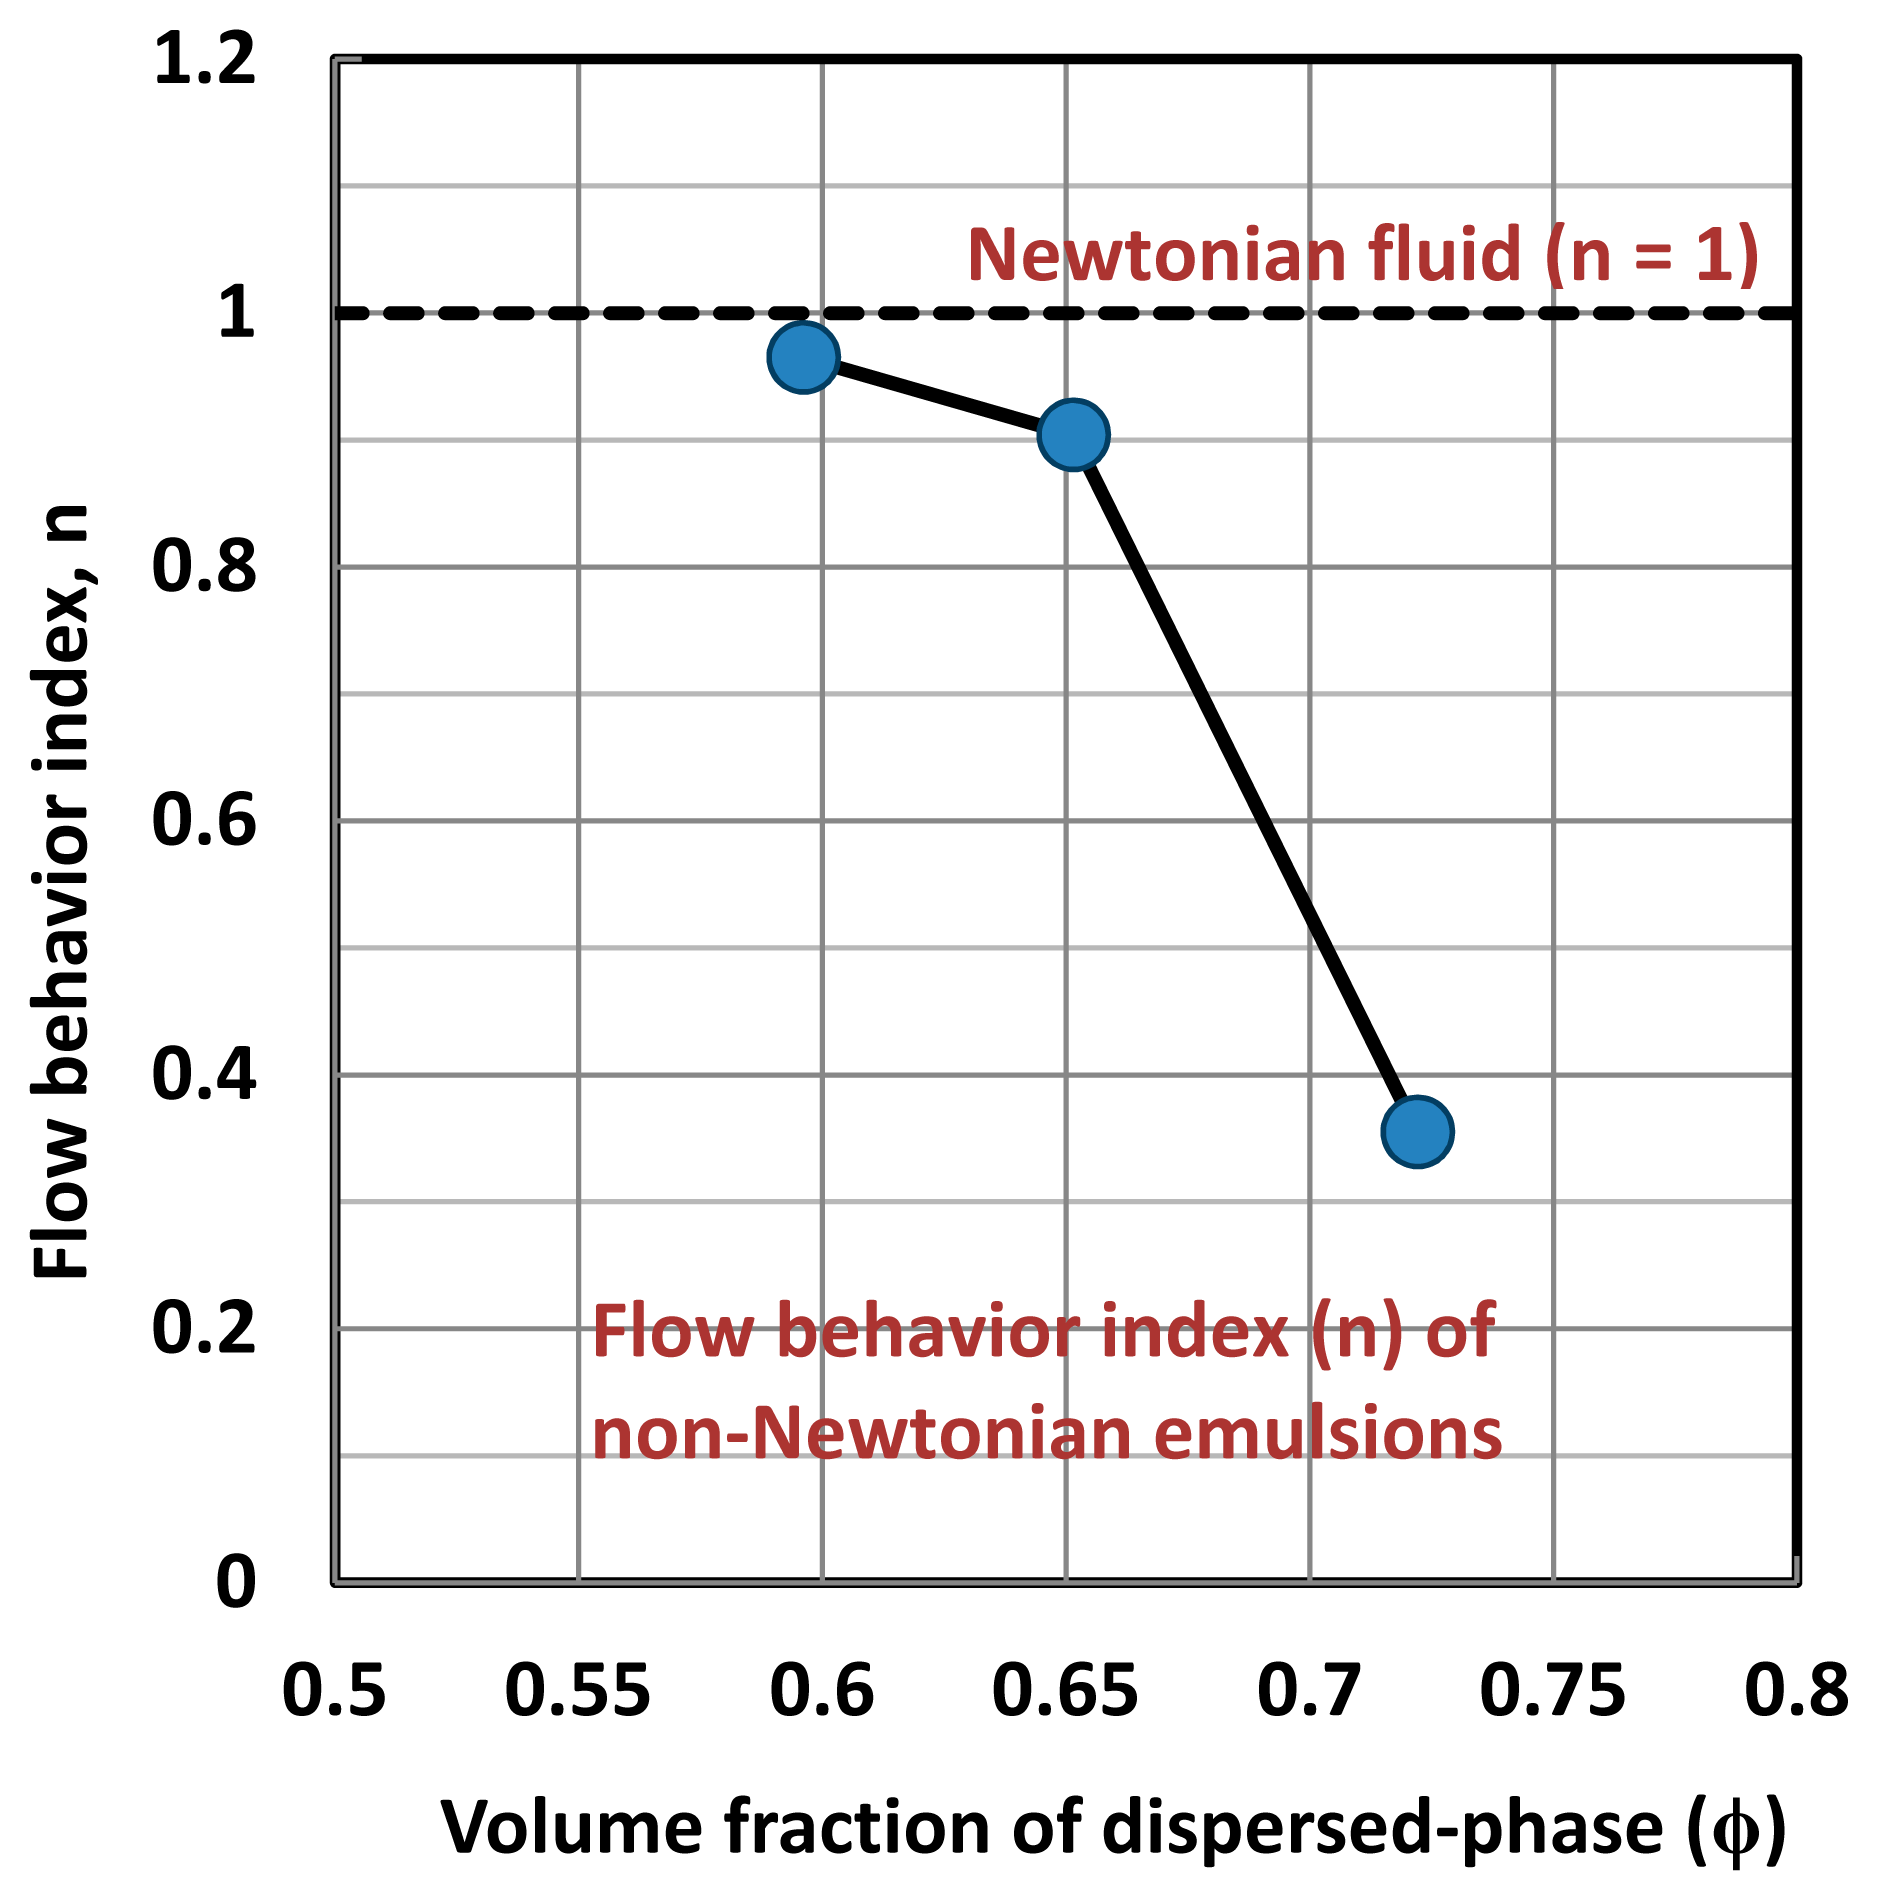
Thus, the slope is of μ versus γ̇ plot is negative, equal to – (1− n ). According to plots of Figures 5–7, the power-law index n decreases and the consistency index K increases with the increase in dispersed-phase (oil) concentration. The variations of n and K with the dispersed-phase concentration of emulsion can be seen more clearly in Figures 8 and 9. Interestingly, the power law constants n and K undergo dramatic changes when the oil concentration of the emulsion is increased from 65.15–72.21% vol.
Figure 10 shows the plots of versus Re_ n data for 59.61% vol. O/W emulsion in different diameter tubes. For a given diameter tube, the entropy generation rate increases linearly with the increase in the generalized Reynolds number ( Re_ n ) on a log-log plot. As expected, the slope of versus Re_ n plot is higher in the turbulent regime. With the increase in tube diameter, the entropy generation rate per unit tube length decreases at any given value of the generalized Reynolds number. Also, the experimental data shows excellent agreement with the predictions of the models. The solid lines shown in Figure 10 are the predictions of laminar model (Equation (27)) and the dashed lines represent the predictions of turbulent model (Equation (28)).
Figures 11 and 12 show the plots of versus Re_ n data for 65.15% and 72.21% vol. O/W emulsions, respectively. Due to the highly viscous nature of these emulsions, turbulent flow could not be achieved in our experiments and the data are restricted to laminar regime only. The plots of versus Re_ n data are linear (log-log scale) and the experimental data show good agreement with the predictions of the model, see Equation (27). It is interesting to note that in the case of 72.21% vol. O/W emulsion, the diameter dependence of entropy generation rate is opposite to that of the other emulsions with lower volume fraction of dispersed-phase. The entropy generation rate increases with the increase in tube diameter for 72.21% vol. O/W emulsion whereas the other emulsions with lower concentration exhibit a decrease in with the increase in tube diameter at a given Re_ n. According to the models, Equations (27) and (28):
When n = 0.5, Equation (32) predicts to be independent of the tube diameter. When n > 0.5, is expected to decrease with the increase in tube diameter as (4n − 2)/(2 − n) > 0; for Newtonian fluid ( n =1 ), (4n − 2)/(2 − n) = 2. When n < 0.5, is expected to increase with the increase in tube diameter as (4n − 2)/(2 − n) < 0 ; for the case of extreme pseudo-plasticity ( n = 0 ), (4n − 2)/(2 − n) = −1 and , that is, is directly proportional to the tube diameter.
Figures 13–15 confirm the diameter-dependence of expressed in Equation (32). The experimental data are now re-plotted as versus Re_ n. As expected, the experimental data for a given emulsion from different diameter tubes fall on the same curve. The solid lines shown in the figures are generated from the model equations: Equations (27) for laminar flow and Equation (28) for turbulent flow. There is good agreement between experimental data and model predictions.
Figure 16 compares the plots of versus Re_ n for different emulsions. The experimental data from all the tubes are included. At any given value of the generalized Reynolds number (Re_ n), the diameter-scaled entropy generation rate ( ) of O/W emulsion increases with the increase in the dispersed-phase (φ ) concentration. While the increase in entropy generation rate is modest when φ increases from 59.61–65.15% vol., a large increase in entropy generation rate is observed when φ increases from 65.15–72.21% vol.
At a high dispersed-phase concentration of 72.21% vol., the dispersed (oil) droplets of emulsion are jam packed and consequently the emulsion behaves as a very viscous material with high rates of entropy generation. The theoretical value of the dispersed-phase concentration corresponding to hexagonal close packing of spheres is 74% vol. Thus, emulsions are expected to behave more like a semi-solid material with significant yield stress when φ is increased above 74% vol.
6. Conclusions
Entropy production in adiabatic flow of non-Newtonian power-law emulsions of oil-in-water type in smooth tubes was investigated experimentally and theoretically. Based on this study, the following conclusions can be made: (a) for a given power-law emulsion ( K and n fixed), the entropy generation rate in a given diameter tube increases linearly with the increase in generalized Reynolds number on a log-log scale, in both laminar and turbulent regimes. However, the slope in the turbulent regime is higher; (b) at a given value of the generalized Reynolds number Re_ n, the entropy generation rate per unit tube length increases with the increase in the value of the flow behavior index n, keeping other factors ( K and D) constant; (c) at a given value of Re_ n, the entropy generation rate per unit tube length increases with the increase in K value, keeping other factors ( n and D ) constant; (d) the power-law constants ( n and K ) undergo dramatic changes when the dispersed-phase concentration of the O/W emulsion is increased from 65.15%–72.21% vol.; n drops whereas K rises sharply; (e) emulsions with dispersed-phase concentration (φ ) ≤ 65.15% exhibit inverse diameter-dependency in that the entropy generation rate decreases with the increase in tube diameter whereas emulsion with φ = 72.21% vol. shows direct diameter-dependency in that the entropy generation rate increases with the increase in tube diameter; (f) the diameter-scaled entropy generation rate increases sharply when φ is increased from 65.15%–72.21% vol.; and (g) the models proposed for entropy generation rate in flow of power-law fluids in tubes describe the experimental data for power-law emulsions reasonably well.
Acknowledgment
Financial support from the Natural Sciences and Engineering Research Council of Canada is appreciated.
Conflicts of Interest
The author declares no conflict of interest.
References
- Bejan, A. Entropy Generation Minimization: The Method of Thermodynamic Optimization of Finite-Size Systems and Finite-Time Processes; CRC Press: Boca Raton, FL USA, 1996; Volume Chapter 2. [Google Scholar]
- Abbott, M.M.; van Ness, H.C. Theory and Problems of Thermodynamics, 2nd ed; Schaum’s Outline Series; McGraw-Hill: New York NY, USA, 1989; Volume Chapter 8. [Google Scholar]
- Cengel, Y.; Boles, M. Thermodynamics: An Engineering Approach; McGraw-Hill: New York NY, USA, 2011. [Google Scholar]
- Smith, J.M.; van Ness, H.C.; Abbott, M.M. Introduction to Chemical Engineering Thermodynamics, 7th ed; McGraw-Hill: New York NY, USA, 2005; Volume Chapter 5. [Google Scholar]
- Pal, R. Rheology of Particulate Dispersions and Composites; CRC Press: Boca Raton, FL USA, 2007; Volume Chapter 8. [Google Scholar]
- Marsden, S.S.; Raghavan, R. A system for producing and transporting crude oil as an oil/water emulsion. J. Inst. Pet 1973, 59, 273–278. [Google Scholar]
- Zakin, J.L.; Pinaire, R.; Borgmeyer, M.E. Transportation of oils as oil-in-water emulsions. J. Fluids Eng 1979, 101, 100–104. [Google Scholar]
- Rimmer, D.P.; Gregoli, A.A.; Hamshar, J.A.; Yildrim, E. Pipeline emulsion transportation for heavy oils. In Emulsions: Fundamentals and Applications in the Petroleum Industry; Schramm, L.L., Ed.; ACS Series 231; ACS: Washington DC, USA, 1992; pp. 295–312. [Google Scholar]
- Brauner, N.; Ullmann, A. Modeling of phase inversion phenomenon in two-phase pipe flows. Int. J. Multiph. Flow 2008, 28, 1177–1204. [Google Scholar]
- Piela, K.; Delfos, R.; Ooms, G.; Westerweel, J.; Oliemans, R.V.A.; Mudde, R.F. Experimental investigation of phase inversion in an oil-water flow through a horizontal pipe loop. Int. J. Multiph. Flow 2006, 32, 1087–1099. [Google Scholar]
- Piela, K.; Delfos, R.; Ooms, G.; Westerweel, J.; Oliemans, R.V.A. On the phase inversion process in an oil-water flow. Int. J. Multiph. Flow 2008, 34, 665–677. [Google Scholar]
- Xu, J.Y.; Li, D.H.; Guo, J.; Wu, Y.X. Investigations of phase inversion and frictional pressure gradient in upward and downward oil-water flow in vertical pipes. Int. J. Multiph. Flow 2010, 36, 930–939. [Google Scholar]
- Simmons, M.J.H.; Azzopardi, B.J. Drop size distribution in dispersed liquid-liquid pipe flow. Int. J. Multiph. Flow 2001, 27, 843–859. [Google Scholar]
- Liao, Y.; Lucas, D. A literature review of theoretical models for drop and bubble breakup in turbulent dispersions. Chem. Eng. Sci 2009, 64, 3389–3406. [Google Scholar]
- Jana, A.K.; Das, G.; Das, P.K. Flow regime identification of two-phase liquid-liquid upflow through vertical pipe. Chem. Eng. Sci 2006, 61, 1500–1515. [Google Scholar]
- Joseph, D.D.; Bai, R.; Chen, K.P.; Renardy, Y.Y. Core-annular flows. Annu. Rev. Fluid Mech 1997, 29, 65–90. [Google Scholar]
- Joseph, D.D.; Renardy, Y.Y. Fundamentals of Two-Fluid Dynamics. Part II: Lubricated Transport, Drops and Miscible Liquids; Interdisciplinary applied mathematics series, Volume 4; Springer-Verlag: New York, NY, USA, 1993. [Google Scholar]
- Lu, Y.; He, L.; He, Z.; Wang, A. A study of pressure gradient characteristics of oil-water dispersed flow in horizontal pipe. Energy Procedia 2012, 16, 1111–1117. [Google Scholar]
- Pal, R. Pipeline flow of unstable and surfactant-stabilized emulsions. AIChE J 1993, 39, 1754–1764. [Google Scholar]
- Pal, R. Emulsion flow in pipelines. Int. J. Multiph. Flow 1989, 15, 1011–1017. [Google Scholar]
- Hwang, C.Y.J.; Pal, R. Flow of two-phase oil/water mixtures through sudden expansions and contractions. Chem. Eng. J 1997, 68, 157–163. [Google Scholar]
- Pal, R. On the flow characteristics of highly concentrated oil-in-water emulsions. Chem Eng. J 1990, 43, 53–57. [Google Scholar]
- Pal, R. Entropy production in pipeline flow of dispersions of water in oil. Entropy 2014, 16, 4648–4661. [Google Scholar]
- Rastogi, S.K.; Poulikakos. Second law optimization of forced convection of non-Newtonian fluids in ducts. J. Thermophys. Heat Trans 1992, 6, 540–543. [Google Scholar]
- Saouli, S.; Aiboud-Saouli, S. Entropy generation in channel flow for non-Newtonian Fluids with viscous dissipation effect. Res. J. Appl. Sci 2007, 2, 900–907. [Google Scholar]
- Jankowski, T.A. Minimizing entropy generation in internal flows by adjusting the shape of the cross-section. Int. J. Heat Mass Trans 2009, 52, 3439–3445. [Google Scholar]
- Shamshiri, M.; Khazaeli, R.; Ashrafizaadeh, M.; Mortazavi, S. Heat transfer and entropy generation analyses associated with mixed electrokinetically induced and pressure-driven power-law microflows. Energy 2012, 42, 157–169. [Google Scholar]
- Escandon, J.; Bautista, O.; Mendez, F. Entropy generation in purely electroosmotic flows of non-Newtonian fluids in a microchannel. Energy 2013, 55, 486–496. [Google Scholar]
- Lopez de Haro, M.; Cuevas, S.; Beltran, A. Heat transfer and entropy generation in the parallel plate flow of a power-law fluid with asymmetric convective cooling. Energy 2014, 66, 750–756. [Google Scholar]
- Mahian, O.; Kianifar, A.; Kleinstreuer, C.; Al-Nimr, M.A.; Pop, I.; Sahin, A.Z. A review of entropy generation in nanofluid flow. Int. J. Heat Mass Trans 2013, 65, 514–532. [Google Scholar]
- Sahin, A.Z. Entropy generation in turbulent liquid flow through a smooth duct subjected to constant wall temperature. Int. J. Heat Mass Trans 2000, 43, 1469–1478. [Google Scholar]
- Moghaddami, M.; Mohammadzade, A.; Esfehani, E.A.V. Second law analysis of nanofluid flow. Energy Convers. Manag 2011, 52, 1397–1405. [Google Scholar]
- Singh, P.K.; Anoop, K.B.; Sundararajan, T.; Das, S.K. Entropy generation due to flow and heat transfer in nanofluids. Int. J. Heat Mass Trans 2010, 53, 4757–4767. [Google Scholar]
- Ellahi, R. The thermodynamics, stability, applications and techniques of differential type: A review. Rev. Theor. Sci 2014, 2, 116–123. [Google Scholar]
- Ellahi, R. The effects of MHD and temperature dependent viscosity on the flow of non-Newtonian nanofluid in a pipe: Analytical solutions. Appl. Math. Model 2013, 37, 1451–1467. [Google Scholar]
- Zeeshan, A.; Ellahi, R. Series solutions for nonlinear partial differential equations with slip boundary conditions for non-Newtonian MHD fluid in porous space. Appl. Math. Inf. Sci 2013, 7, 253–261. [Google Scholar]
- Dodge, D.W.; Metzner, A.B. Turbulent flow of non-Newtonian systems. AIChE J 1959, 5, 189–204. [Google Scholar]
- Mishra, P.; Tripathi, G. Transition from laminar to turbulent flow of purely viscous non-Newtonian fluids in tubes. Chem. Eng. Sci 1971, 26, 915–921. [Google Scholar]


|
Table 1. Various dimensions of tube test sections. |
| Tube inside diameter [mm] | Entrance length [m] | Length of test section [m] | Exit length [m] |
|---|---|---|---|
| 7.15 | 1.07 | 3.05 | 0.46 |
| 8.89 | 0.89 | 3.35 | 0.48 |
| 12.60 | 1.19 | 2.74 | 0.53 |
| 15.80 | 1.65 | 2.59 | 0.56 |
| 26.54 | 3.05 | 1.22 | 0.67 |
© 2014 by the authors; licensee MDPI, Basel, Switzerland This article is an open access article distributed under the terms and conditions of the Creative Commons Attribution license (http://creativecommons.org/licenses/by/3.0/).
Share and Cite
Pal, R. Entropy Generation in Flow of Highly Concentrated Non-Newtonian Emulsions in Smooth Tubes. Entropy 2014, 16, 5178-5197. https://doi.org/10.3390/e16105178
Pal R. Entropy Generation in Flow of Highly Concentrated Non-Newtonian Emulsions in Smooth Tubes. Entropy. 2014; 16(10):5178-5197. https://doi.org/10.3390/e16105178
Chicago/Turabian StylePal, Rajinder. 2014. "Entropy Generation in Flow of Highly Concentrated Non-Newtonian Emulsions in Smooth Tubes" Entropy 16, no. 10: 5178-5197. https://doi.org/10.3390/e16105178