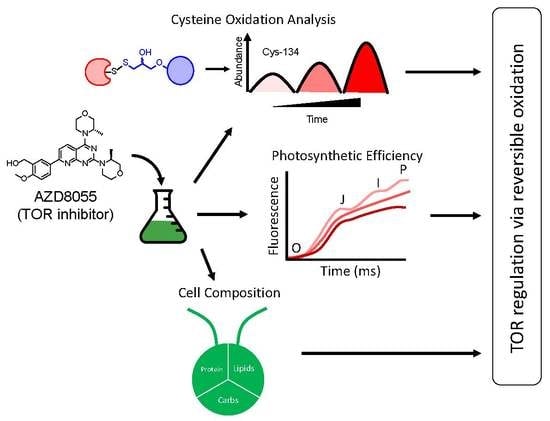
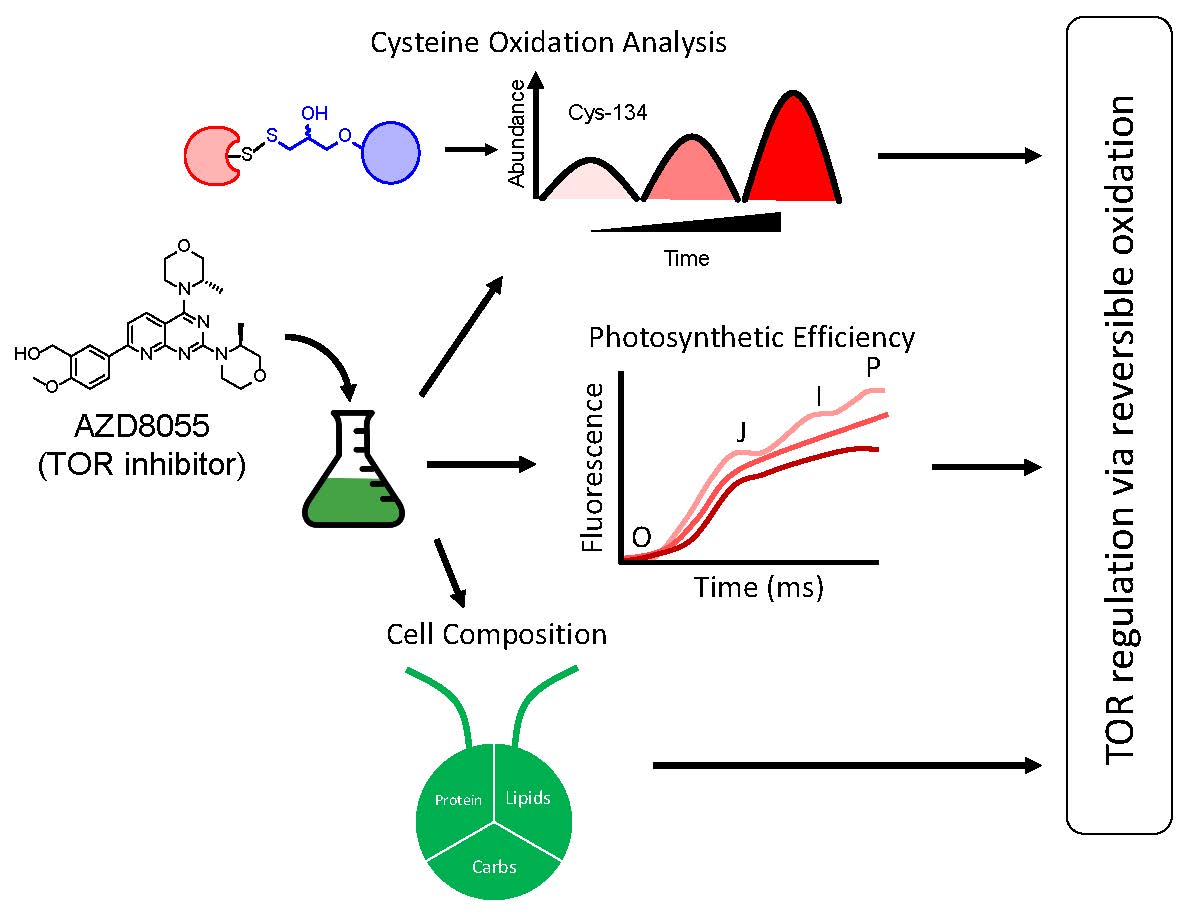
Inhibition of TOR in Chlamydomonas reinhardtii Leads to Rapid Cysteine Oxidation Reflecting Sustained Physiological Changes

 , , ,
, , ,
Abstract
:
1. Introduction
2. Materials and Methods
2.1. Strain, Culture Growth and Treatment Conditions
2.2. Spectroscopic Cell Density and Cell Diameter
2.3. Pigment Extraction
2.4. Cell Dry Weight Measurement
2.5. Lipid Analysis
2.6. Biochemical Composition
2.7. Chlorophyll Fluorescence Induction in Vivo
2.8. Pulse Amplitude Modulated (PAM) Fluorescence
2.9. Protein Extraction for Proteomics Analyses
2.10. Global Proteomics
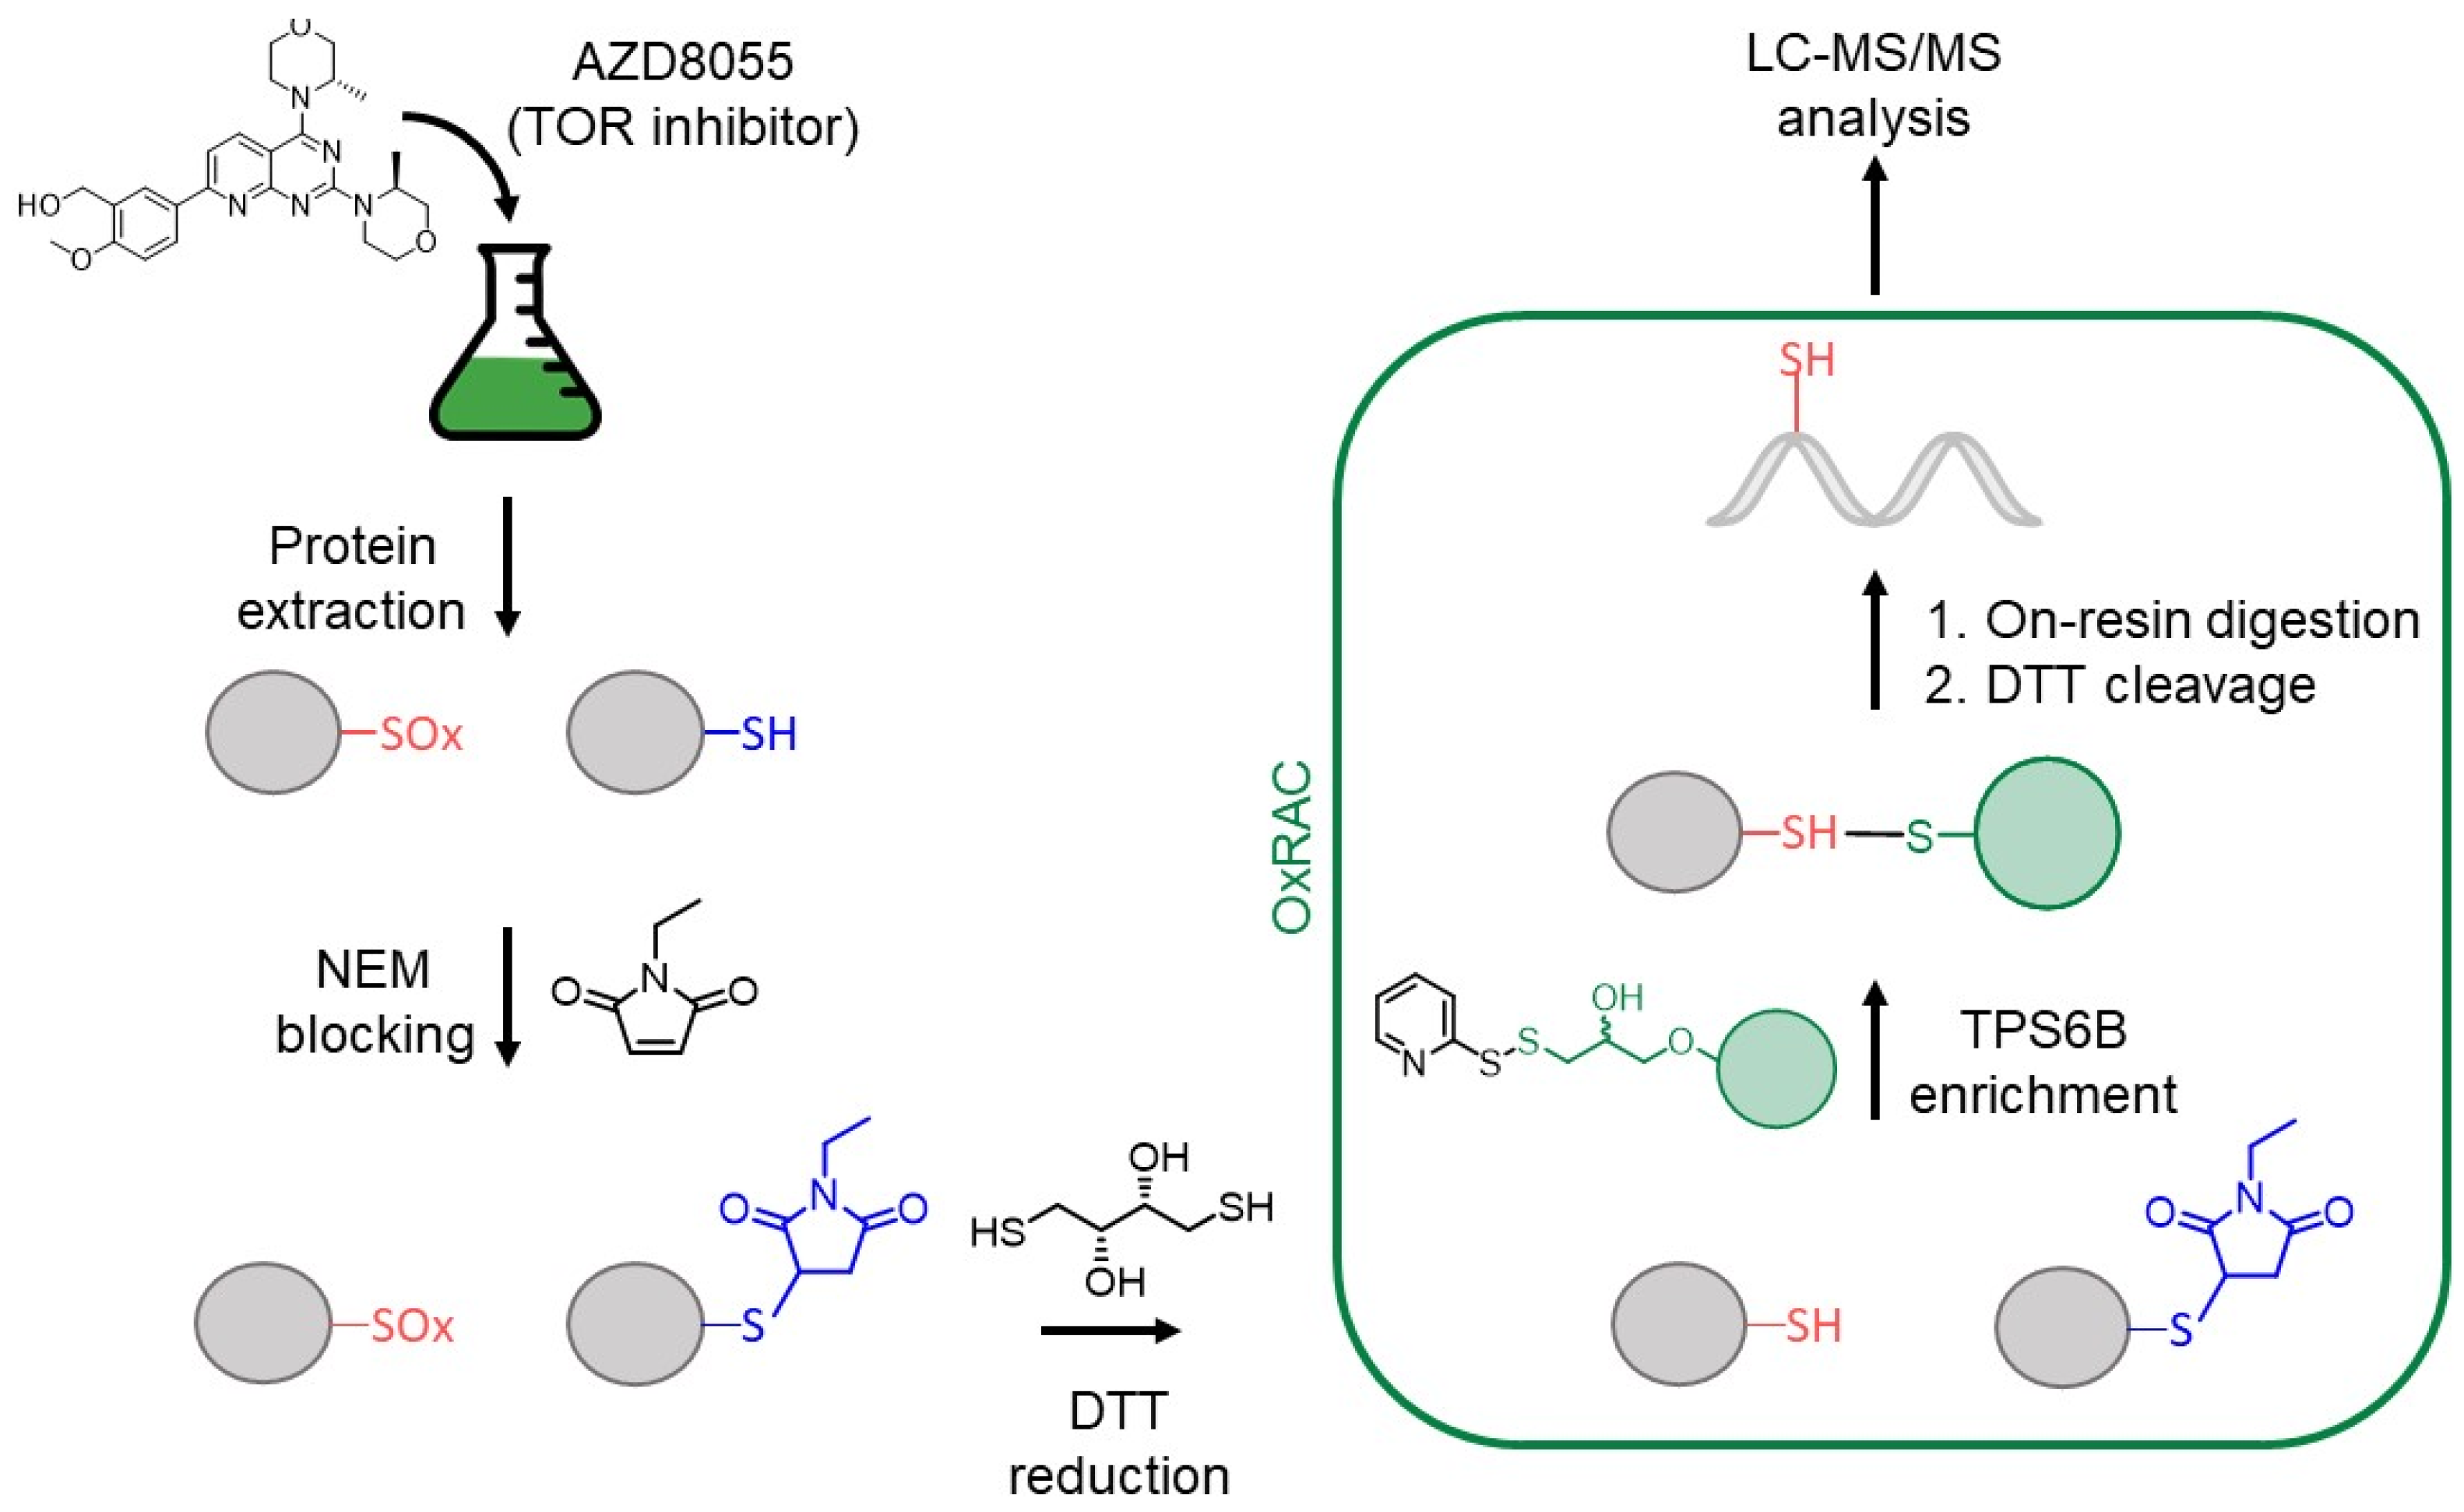
2.11. Oxidized Cys Enrichment
2.12. Solid-Phase Extraction
2.13. LC-MS/MS Analysis
2.14. Database Searching and Label-Free Quantification
2.15. Data Analysis and Statistics
2.16. Data Availability
3. Results
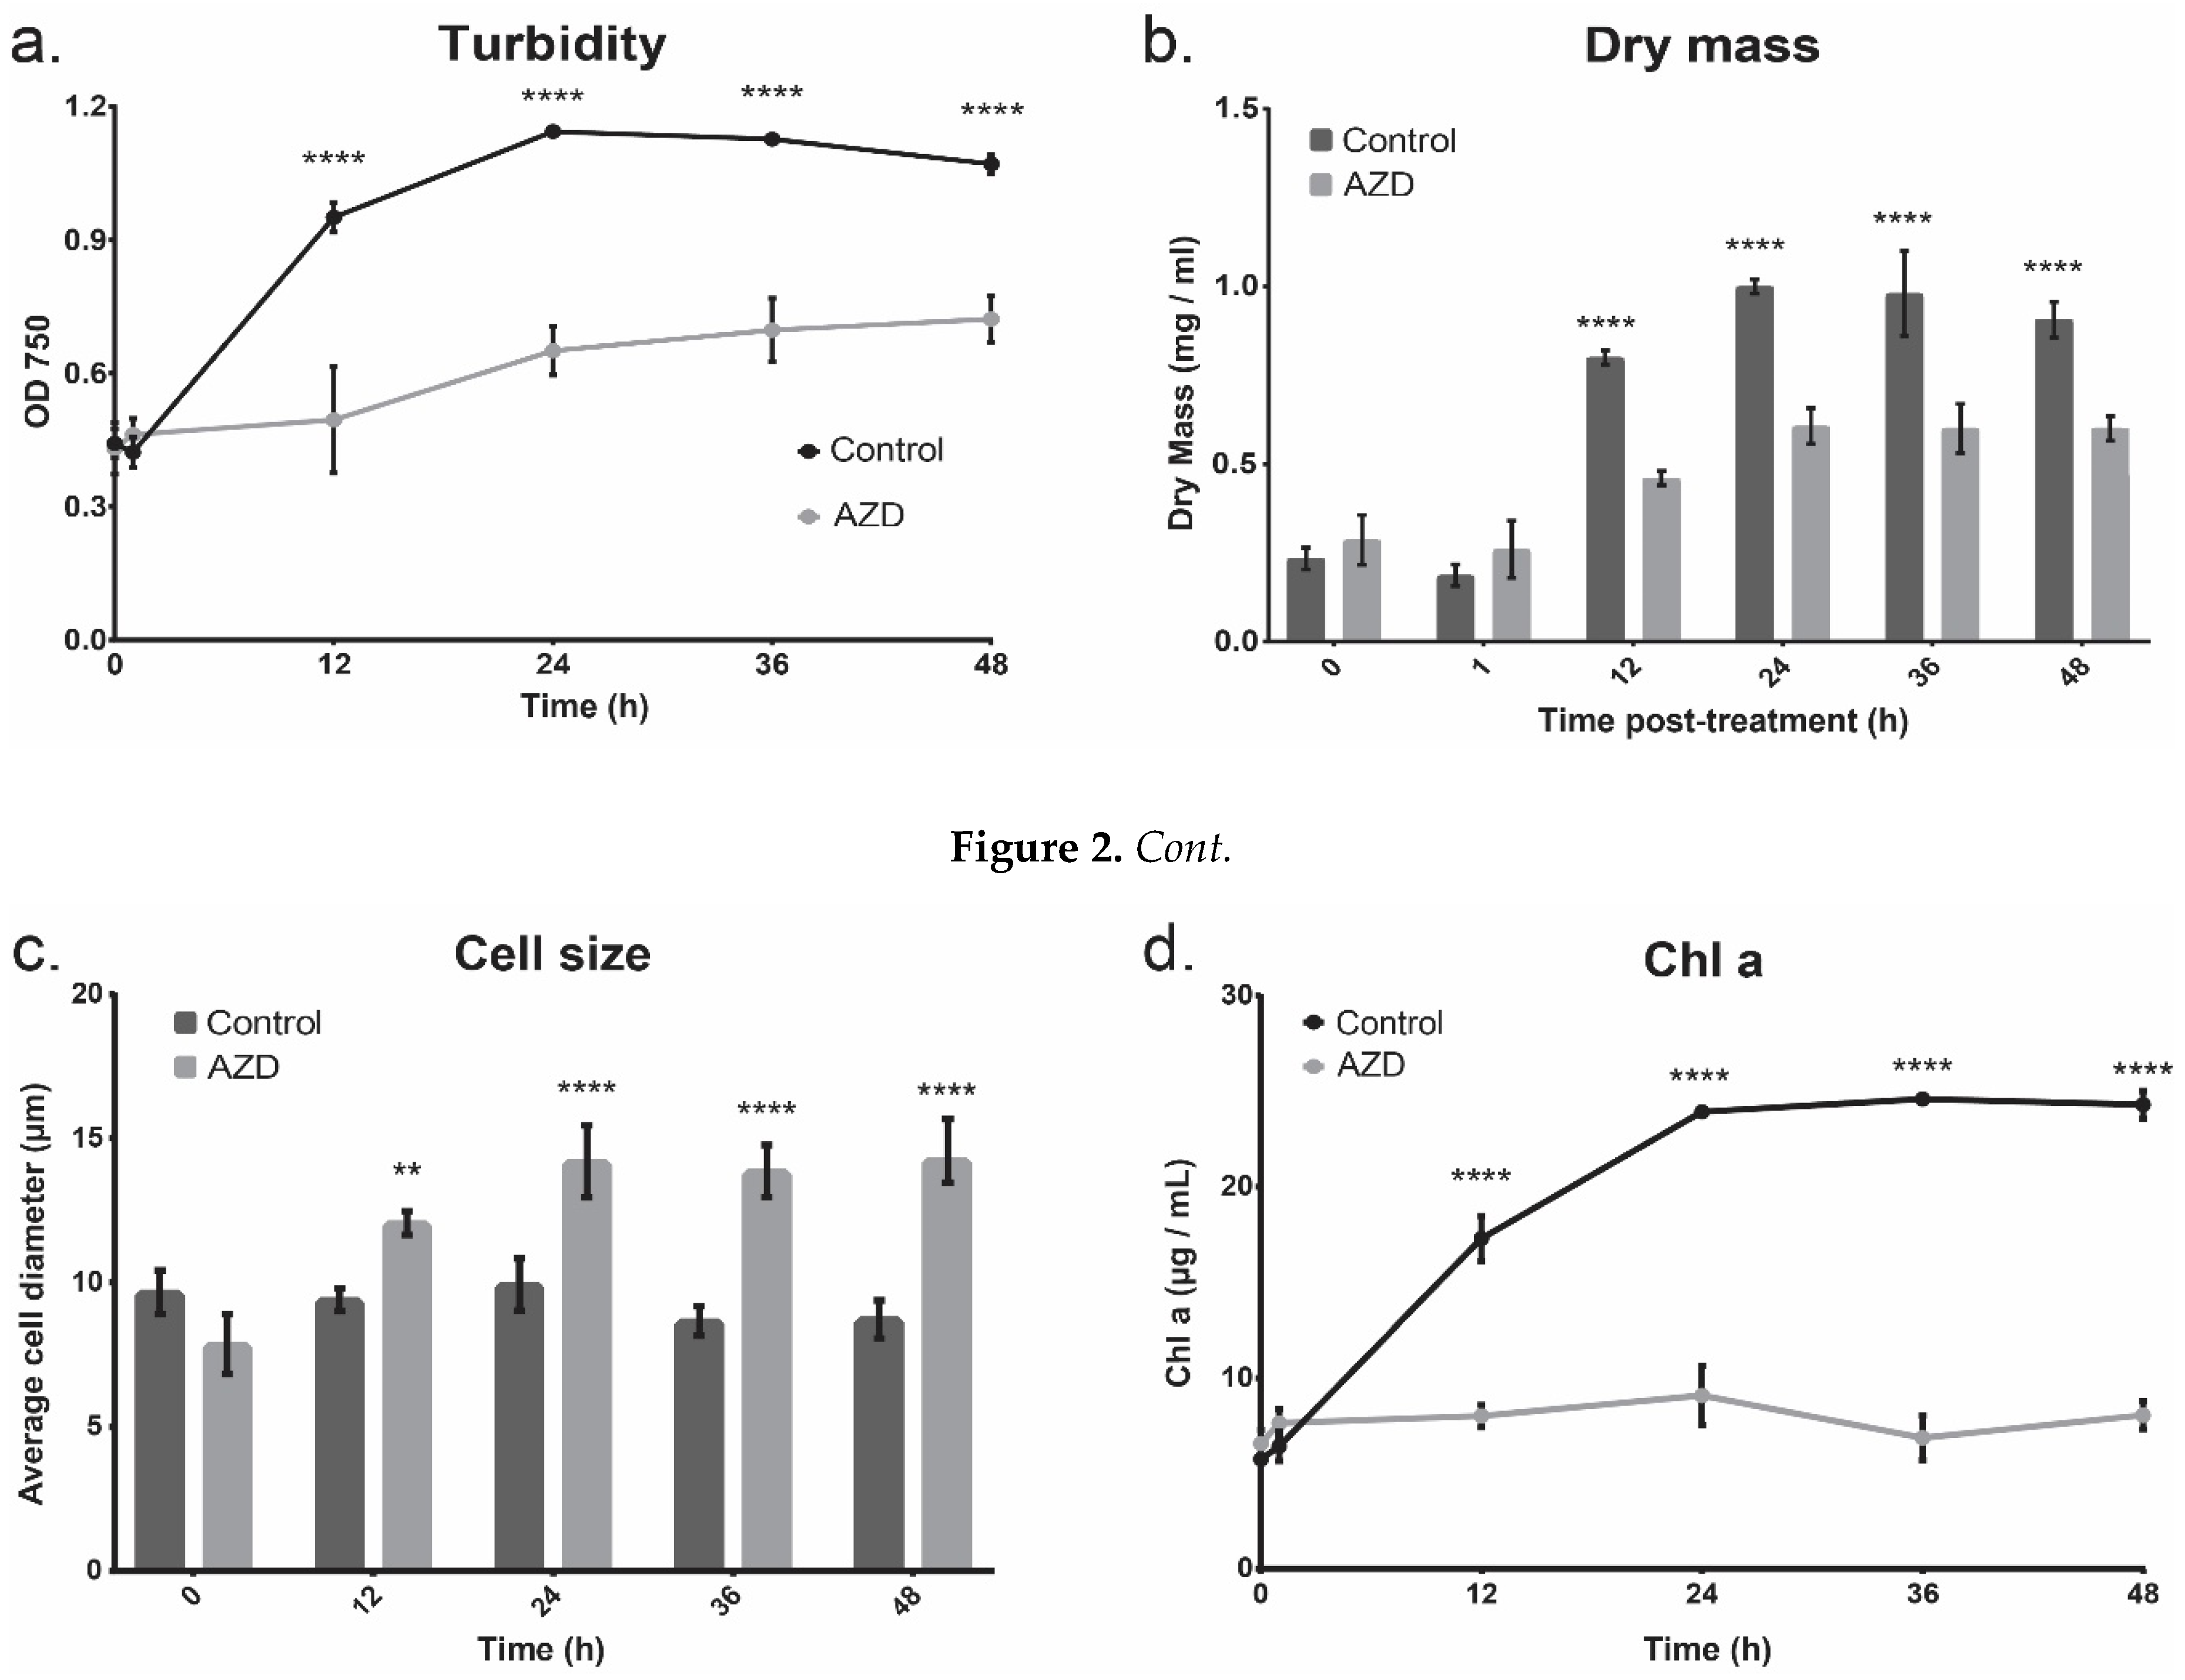
3.1. Cell Growth
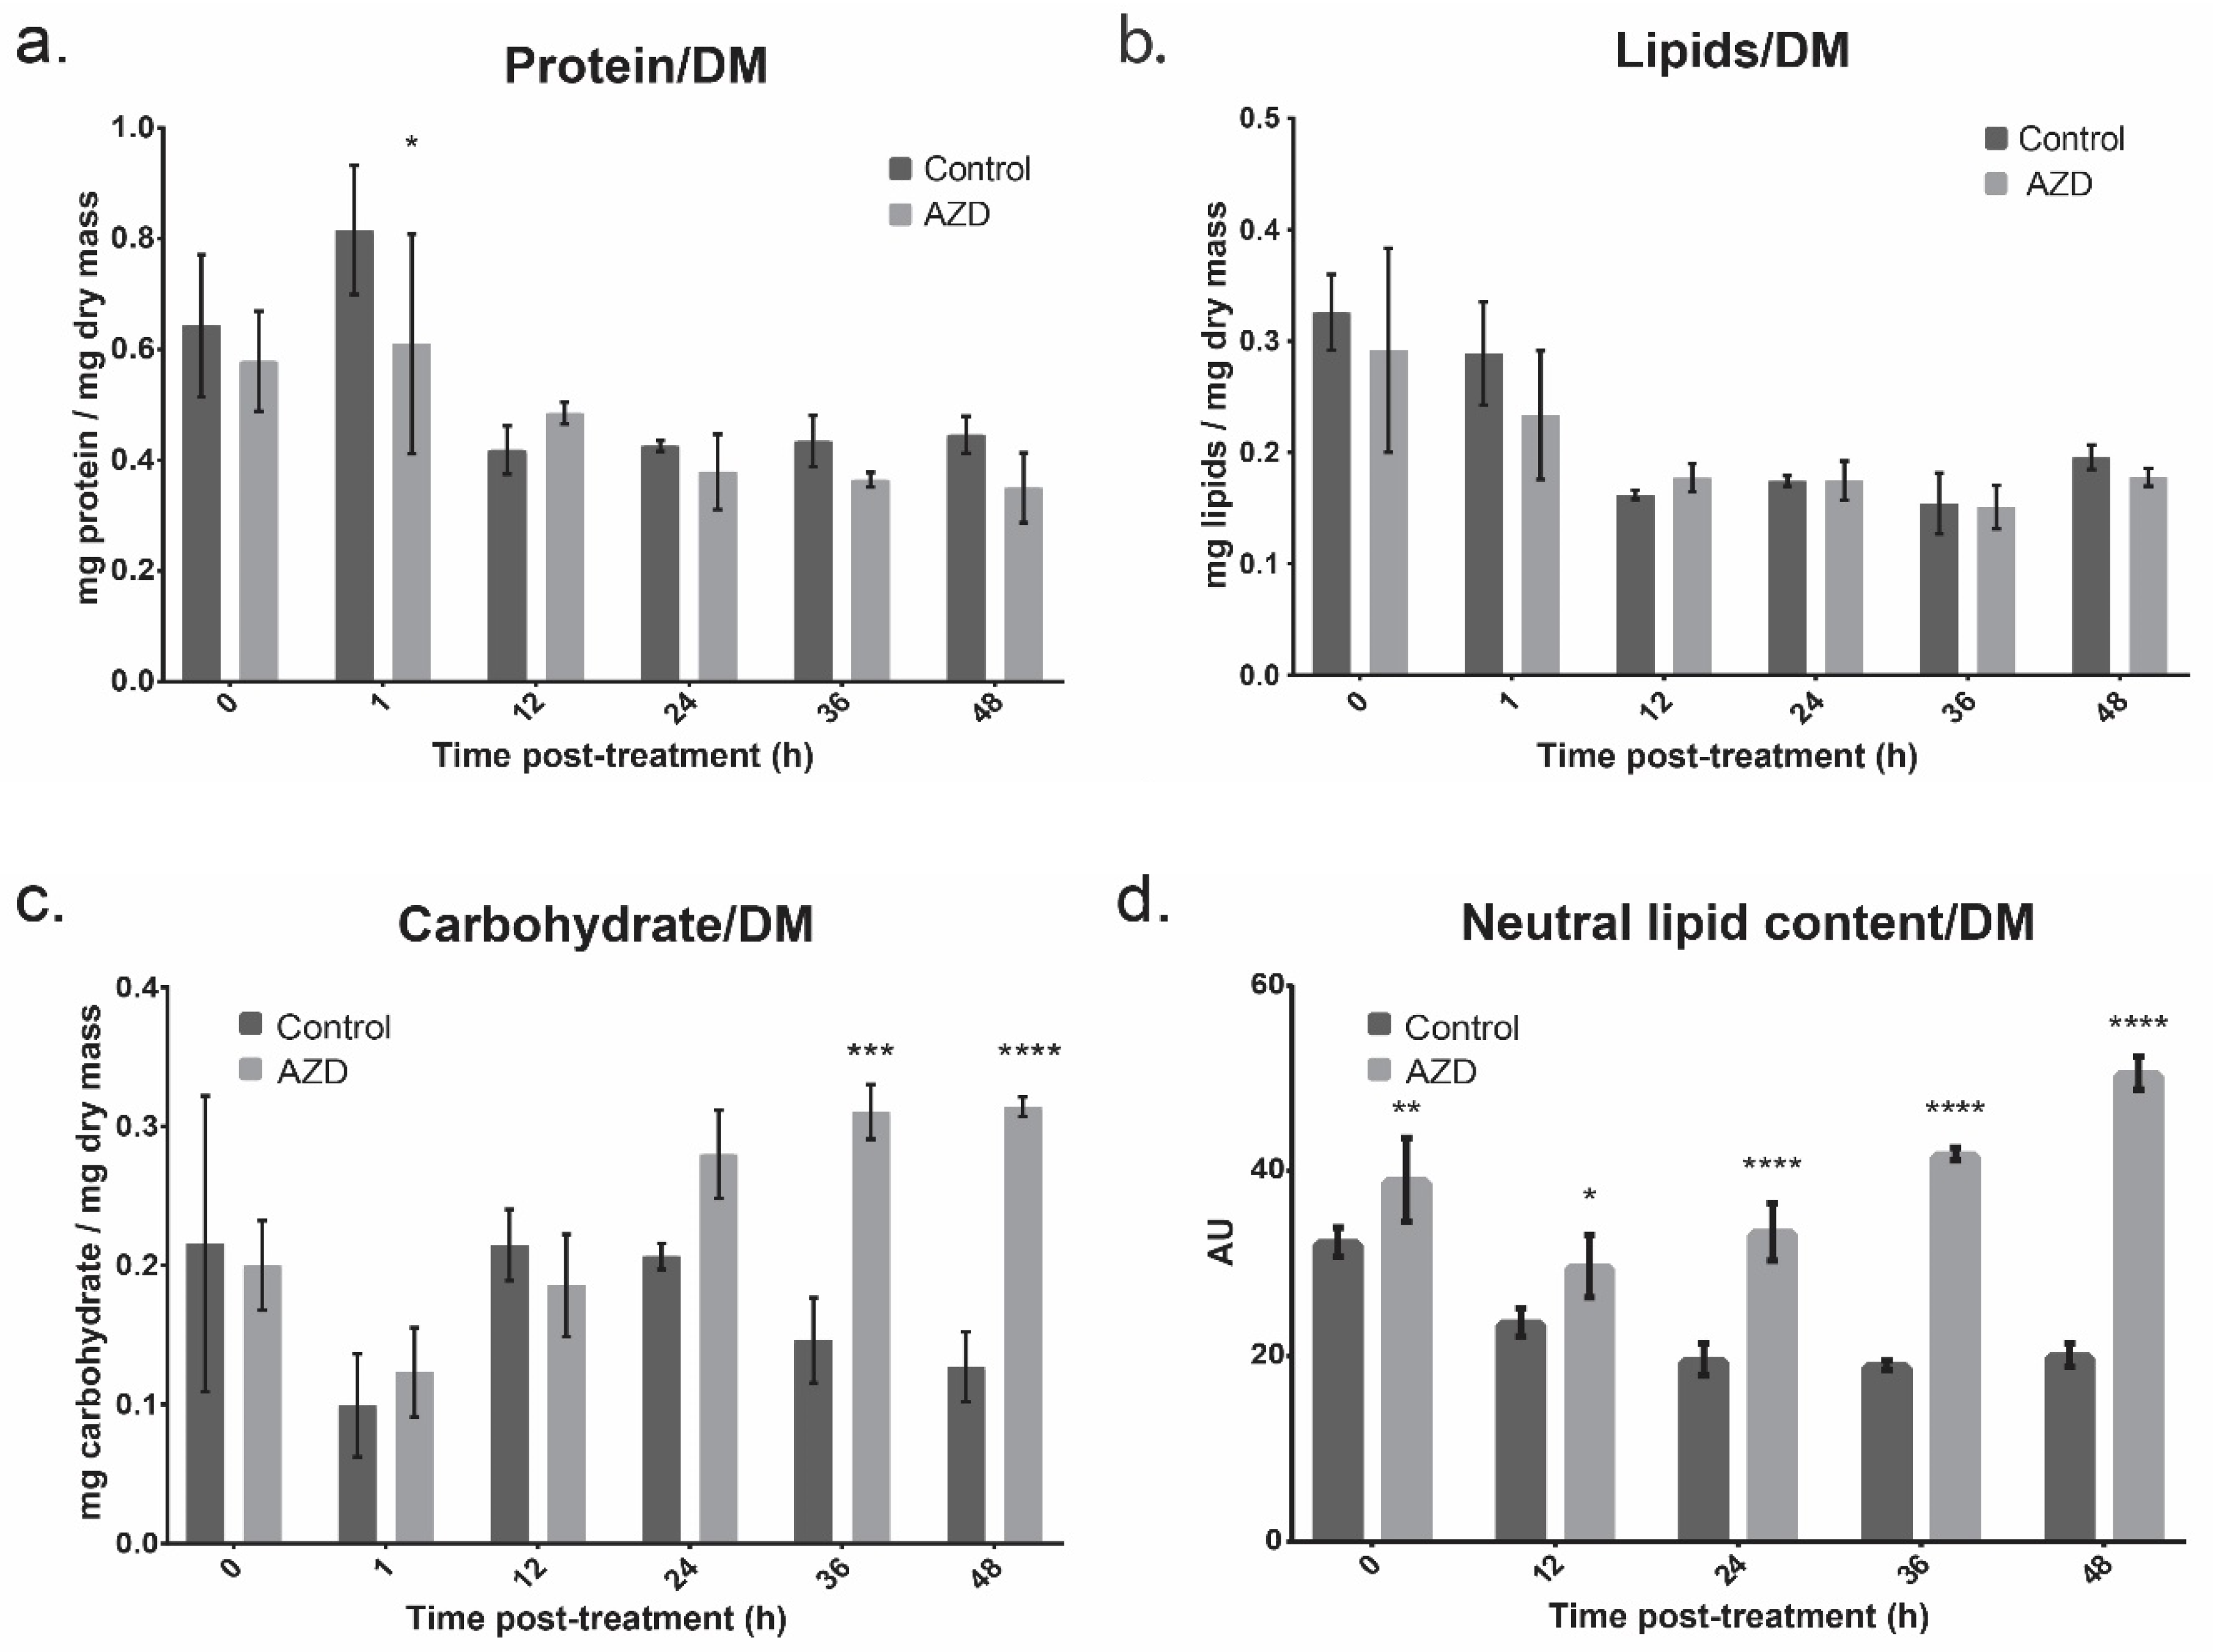
3.2. Bulk Cell Composition
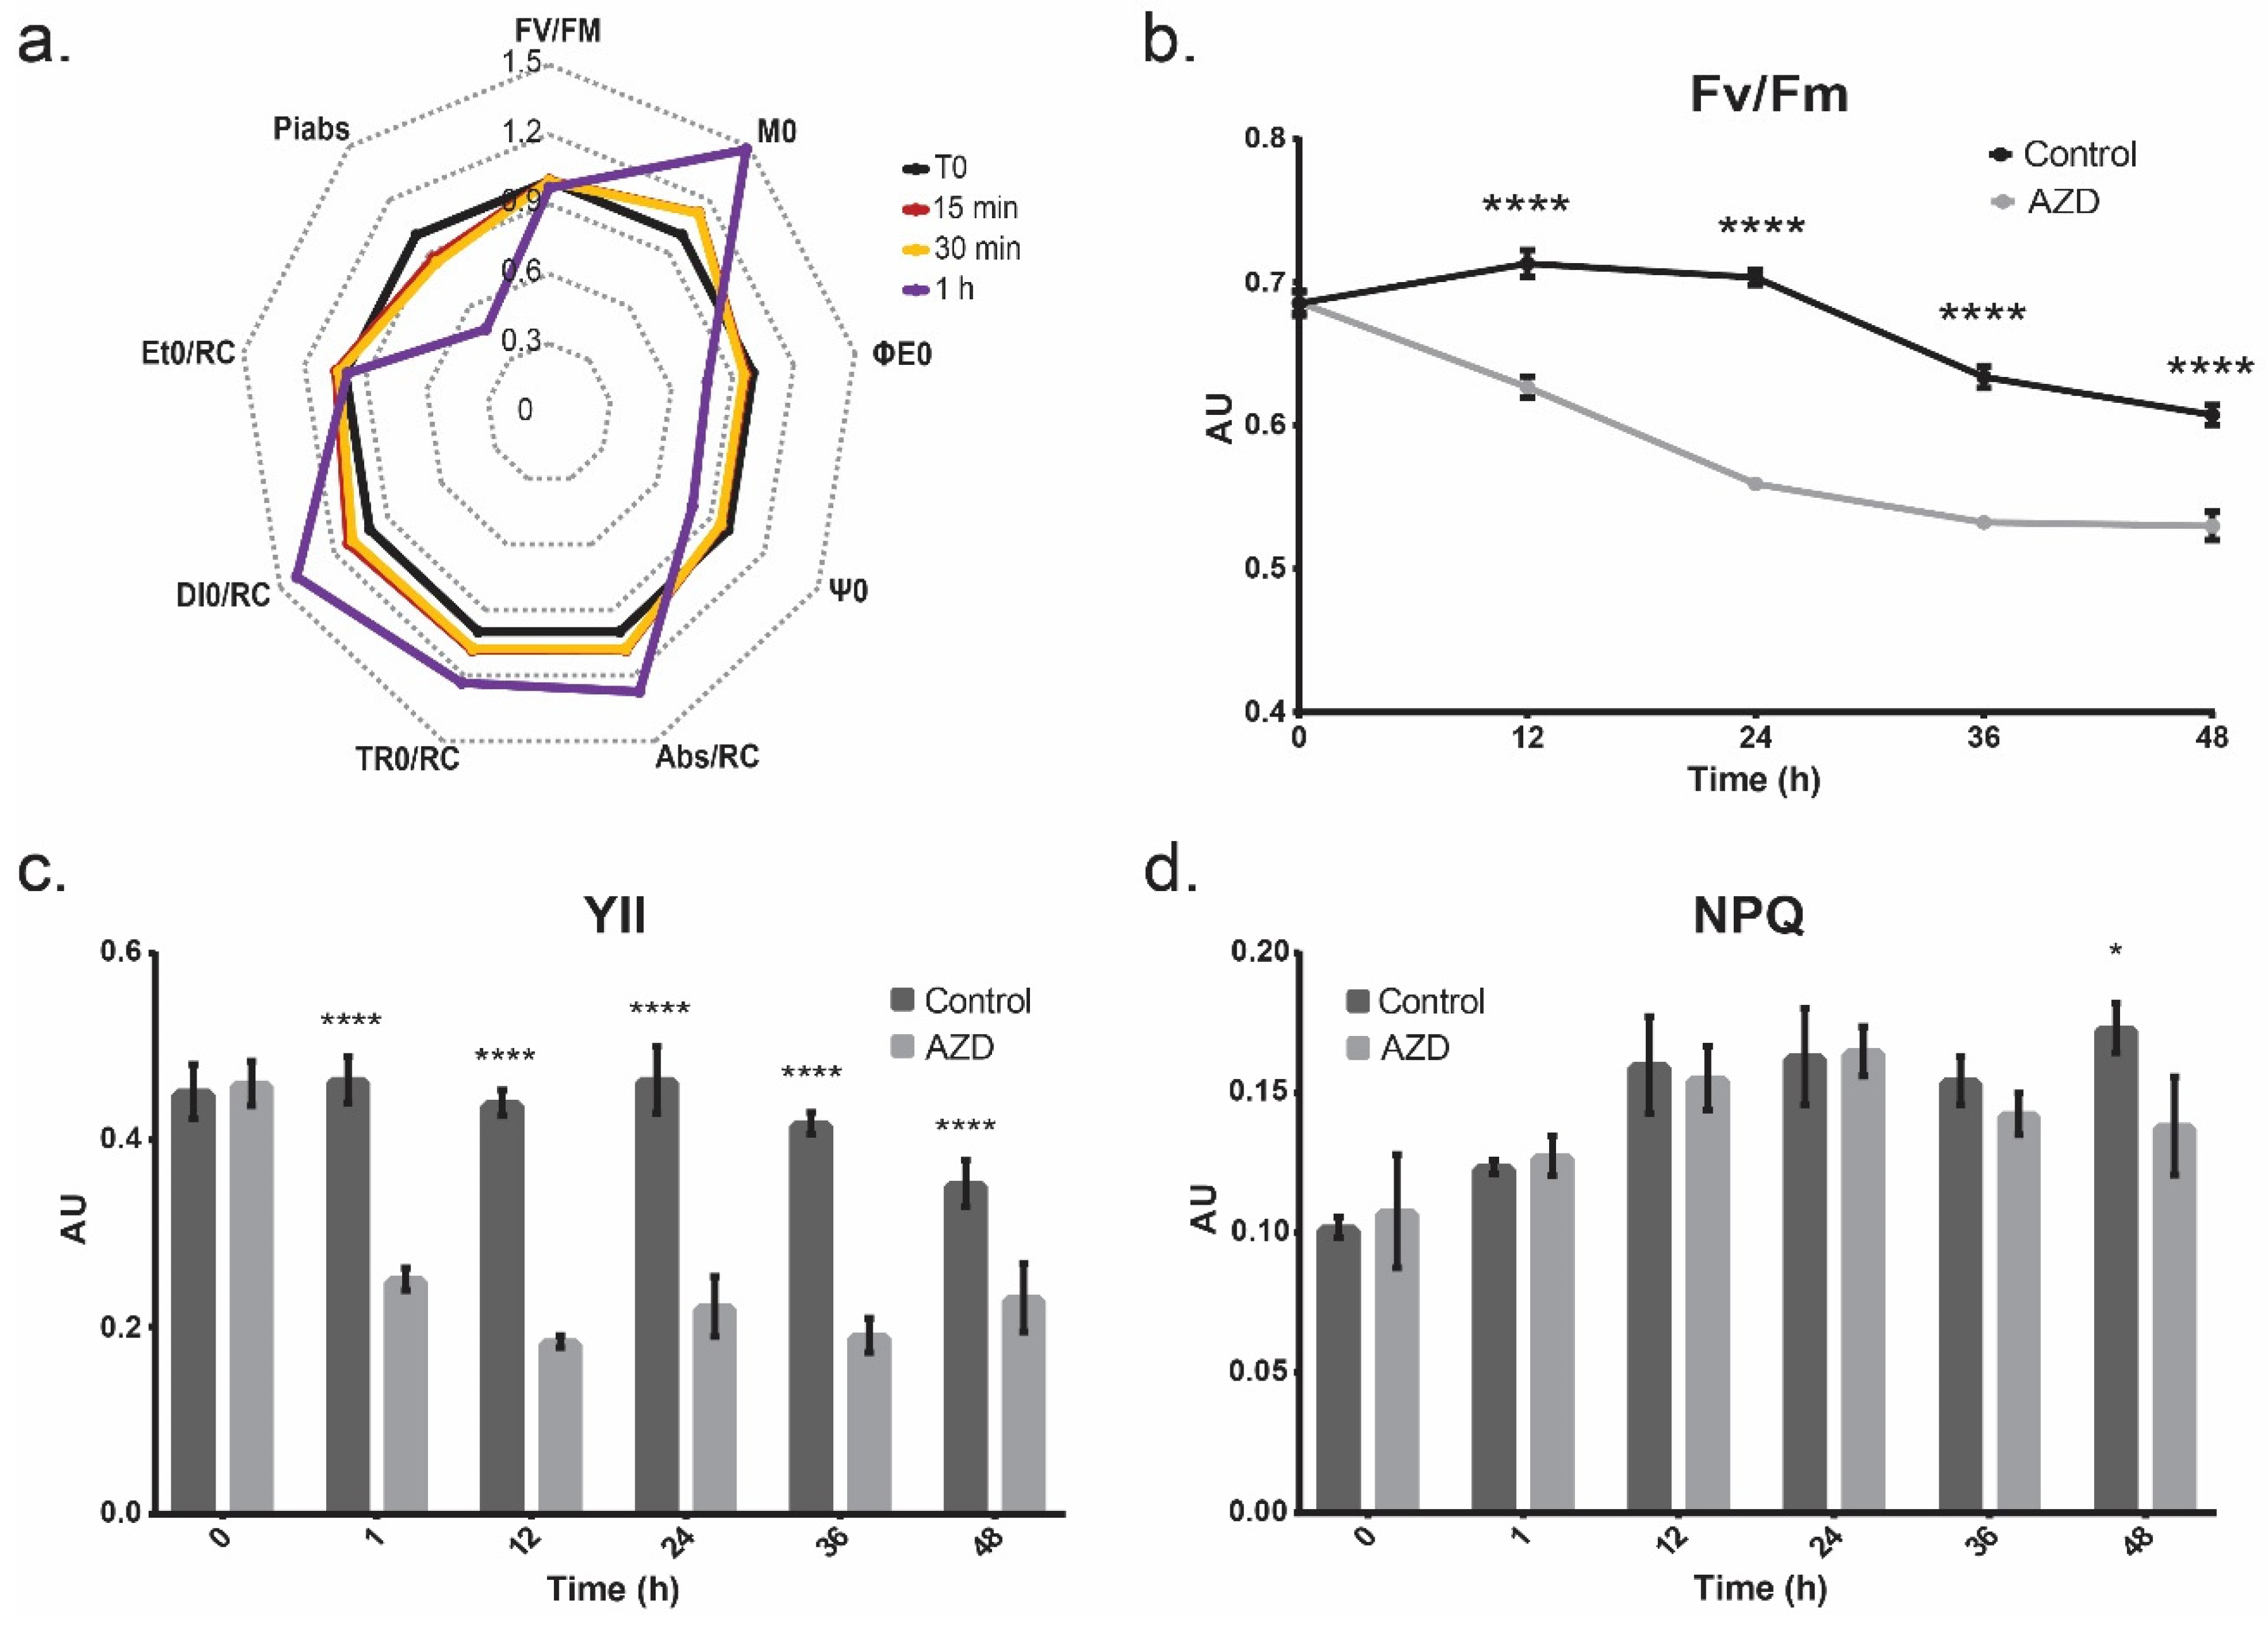
3.3. Photosynthetic Output
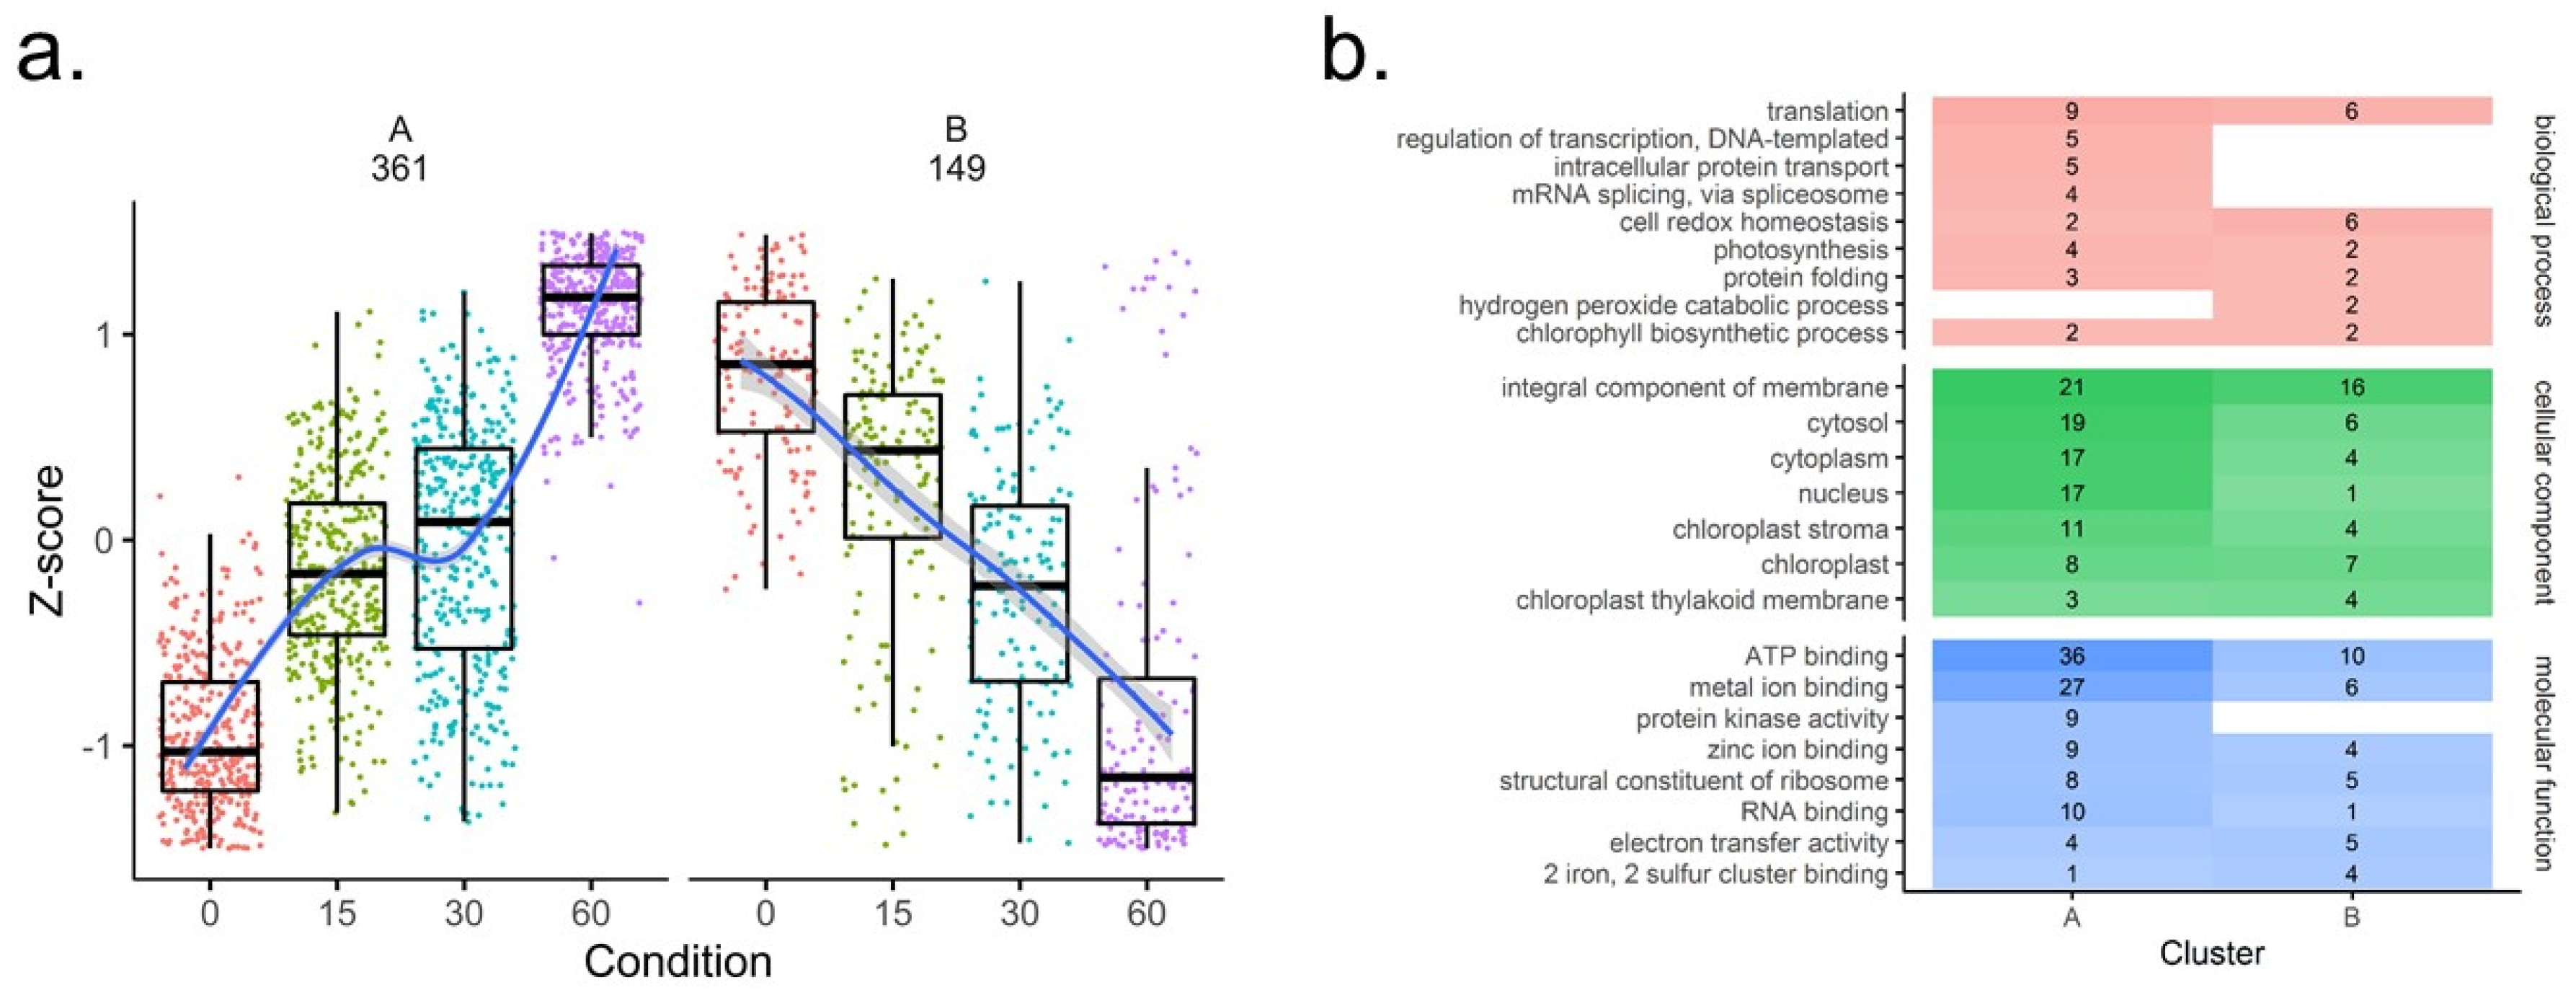
3.4. Coverage and Differential Analysis of the Reversibly Oxidized Thiol Proteome Upon TOR Inhibition
4. Discussion
4.1. Lipid Metabolism
4.2. Protein Translation
4.3. Carbohydrate Metabolism
4.4. TOR Pathway-Related Proteins
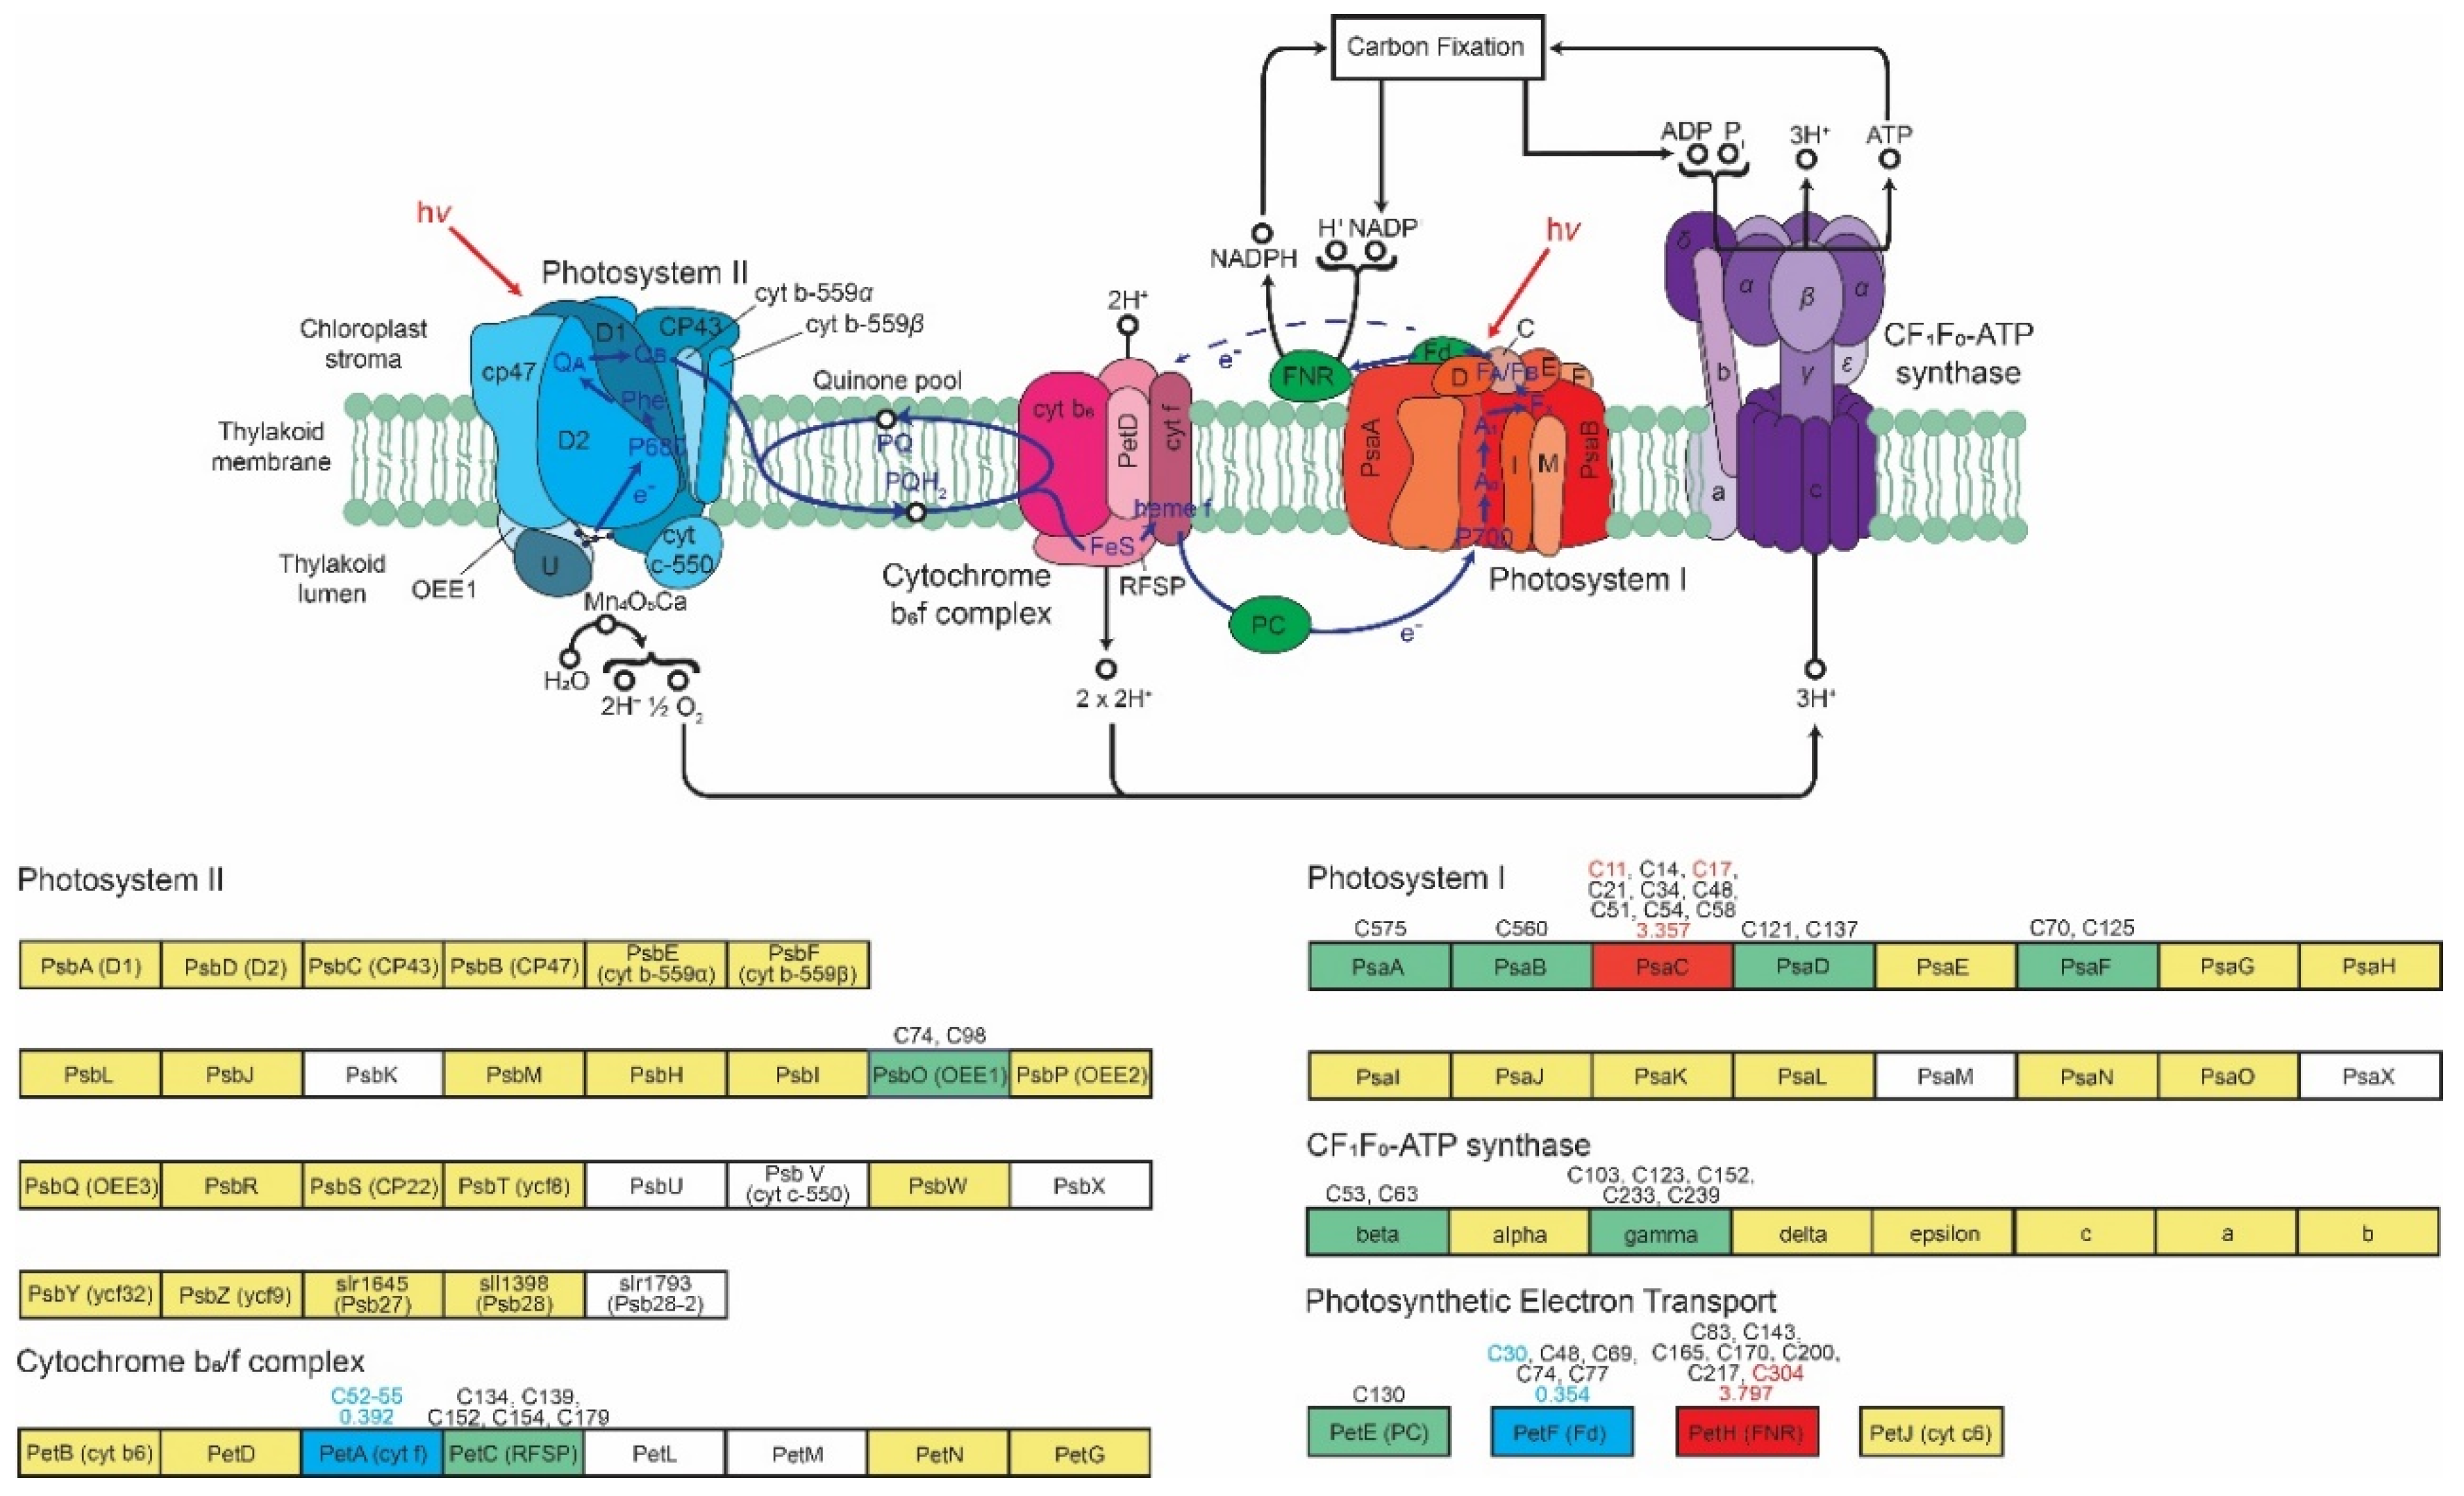
4.5. Photosynthesis
5. Conclusions
Supplementary Materials
Author Contributions
Funding
Conflicts of Interest
References
- Crespo, J.L.; Díaz-Troya, S.; Florencio, F.J. Inhibition of Target of Rapamycin signaling by rapamycin in the unicellular green alga Chlamydomonas reinhardtii. Plant Physiol. 2005, 139, 1736–1749. [Google Scholar] [CrossRef]
- Wullschleger, S.; Loewith, R.; Hall, M.N. TOR signaling in growth and metabolism. Cell 2006, 124, 471–484. [Google Scholar] [CrossRef]
- Loewith, R.; Hall, M.N. Target of Rapamycin (TOR) in nutrient signaling and growth control. Genetics 2011, 189, 1177–1201. [Google Scholar] [CrossRef]
- Dobrenel, T.; Caldana, C.; Hanson, J.; Robaglia, C.; Vincentz, M.; Veit, B.; Meyer, C. TOR signaling and nutrient sensing. Annu. Rev. Plant Biol. 2016, 67, 261–285. [Google Scholar] [CrossRef]
- Pérez-Pérez, M.E.; Couso, I.; Crespo, J.L. The TOR signaling network in the model unicellular green alga Chlamydomonas reinhardtii. Biomolecules 2017, 7, 54. [Google Scholar] [CrossRef]
- González, A.; Hall, M.N. Nutrient sensing and TOR signaling in yeast and mammals. EMBO J. 2017, 36, 397–408. [Google Scholar] [CrossRef] [Green Version]
- Ryabova, L.A.; Robaglia, C.; Meyer, C. Target of Rapamycin kinase: Central regulatory hub for plant growth and metabolism. J. Exp. Bot. 2019, 70, 2211–2216. [Google Scholar] [CrossRef]
- Kunz, J.; Henriquez, R.; Schneider, U.; Deuter-Reinhard, M.; Movva, N.R.; Hall, M.N. Target of rapamycin in yeast, TOR2, is an essential phosphatidylinositol kinase homolog required for G1 progression. Cell 1993, 73, 585–596. [Google Scholar] [CrossRef]
- Helliwell, S.B.; Wagner, P.; Kunz, J.; Deuter-Reinhard, M.; Henriquez, R.; Hall, M.N. TOR1 and TOR2 are structurally and functionally similar but not identical phosphatidylinositol kinase homologues in yeast. Mol. Biol. Cell 1994, 5, 105–118. [Google Scholar] [CrossRef]
- Loewith, R.; Jacinto, E.; Wullschleger, S.; Lorberg, A.; Crespo, J.L.; Bonenfant, D.; Oppliger, W.; Jenoe, P.; Hall, M.N. Two TOR complexes, only one of which is rapamycin sensitive, have distinct roles in cell growth control. Mol. Cell 2002, 10, 457–468. [Google Scholar] [CrossRef]
- Wedaman, K.P.; Reinke, A.; Anderson, S.; Yates, J.; McCaffery, J.M.; Powers, T. TOR kinases are in distinct membrane-associated protein complexes in Saccharomyces cerevisiae. Mol. Biol. Cell 2003, 14, 1204–1220. [Google Scholar] [CrossRef]
- Dibble, C.C.; Manning, B.D. Signal integration by mTORC1 coordinates nutrient input with biosynthetic output. Nat. Cell Biol. 2013, 15, 555–564. [Google Scholar] [CrossRef] [Green Version]
- Saxton, R.A.; Sabatini, D.M. mTOR Signaling in growth, metabolism, and disease. Cell 2017, 168, 960–976. [Google Scholar] [CrossRef]
- Ballou, L.M.; Lin, R.Z. Rapamycin and mTOR kinase inhibitors. J. Chem. Biol. 2008, 1, 27–36. [Google Scholar] [CrossRef] [Green Version]
- De Virgilio, C.; Loewith, R. The TOR signalling network from yeast to man. Int. J. Biochem. Cell Biol. 2006, 38, 1476–1481. [Google Scholar] [CrossRef] [Green Version]
- Werth, E.G.; McConnell, E.W.; Lianez, I.C.; Perrine, Z.; Crespo, J.L.; Umen, J.G.; Hicks, L.M. Investigating the effect of Target of Rapamycin kinase inhibition on the Chlamydomonas reinhardtii phosphoproteome: From known homologs to new targets. New Phytol. 2019, 221, 247–260. [Google Scholar] [CrossRef]
- Ramundo, S.; Casero, D.; Mühlhaus, T.; Hemme, D.; Sommer, F.; Crèvecoeur, M.; Rahire, M.; Schroda, M.; Rusch, J.; Goodenough, U.; et al. Conditional depletion of the Chlamydomonas chloroplast ClpP protease activates nuclear genes involved in autophagy and plastid protein quality control. Plant Cell. 2014, 26, 2201–2222. [Google Scholar] [CrossRef]
- Kleessen, S.; Irgang, S.; Klie, S.; Giavalisco, P.; Nikoloski, Z. Integration of transcriptomics and metabolomics data specifies the metabolic response of Chlamydomonas to rapamycin treatment. Plant J. 2015, 81, 822–835. [Google Scholar] [CrossRef]
- Valledor, L.; Furuhashi, T.; Recuenco-Muñoz, L.; Wienkoop, S.; Weckwerth, W. System-level network analysis of nitrogen starvation and recovery in Chlamydomonas reinhardtii reveals potential new targets for increased lipid accumulation. Biotechnol. Biofuels 2014, 7, 171. [Google Scholar] [CrossRef]
- Park, J.-J.; Wang, H.; Gargouri, M.; Deshpande, R.R.; Skepper, J.N.; Holguin, F.O.; Juergens, M.T.; Shachar-Hill, Y.; Hicks, L.M.; Gang, D.R. The response of Chlamydomonas reinhardtii to nitrogen deprivation: A systems biology analysis. Plant J. 2015, 81, 611–624. [Google Scholar] [CrossRef]
- Imamura, S.; Kawase, Y.; Kobayashi, I.; Shimojima, M.; Ohta, H.; Tanaka, K. TOR (target of rapamycin) is a key regulator of triacylglycerol accumulation in microalgae. Plant Signal Behav. 2016, 11. [Google Scholar] [CrossRef]
- Rodrigues, S.P.; Alvarez, S.; Werth, E.G.; Slade, W.O.; Gau, B.; Cahoon, E.B.; Hicks, L.M. Multiplexing strategy for simultaneous detection of redox-, phospho- and total proteome – understanding TOR regulating pathways in Chlamydomonas reinhardtii. Anal. Methods 2015, 7, 7336–7344. [Google Scholar] [CrossRef]
- Couso, I.; Evans, B.S.; Li, J.; Liu, Y.; Ma, F.; Diamond, S.; Allen, D.K.; Umen, J.G. Synergism between inositol polyphosphates and TOR kinase signaling in nutrient sensing, growth control, and lipid metabolism in Chlamydomonas. Plant Cell 2016, 28, 2026–2042. [Google Scholar] [CrossRef]
- Couso, I.; Pérez-Pérez, M.E.; Martínez-Force, E.; Kim, H.-S.; He, Y.; Umen, J.G.; Crespo, J.L. Autophagic flux is required for the synthesis of triacylglycerols and ribosomal protein turnover in Chlamydomonas. J. Exp. Bot. 2018, 69, 1355–1367. [Google Scholar] [CrossRef]
- Fan, J.; Yu, L.; Xu, C. Dual role for autophagy in lipid metabolism in Arabidopsis. Plant Cell 2019, 31, 1598–1613. [Google Scholar] [CrossRef]
- Pérez-Pérez, M.E.; Florencio, F.J.; Crespo, J.L. Inhibition of target of rapamycin signaling and stress activate autophagy in Chlamydomonas reinhardtii. Plant Physiol. 2010, 152, 1874–1888. [Google Scholar] [CrossRef]
- Díaz-Troya, S.; Pérez-Pérez, M.E.; Pérez-Martín, M.; Moes, S.; Jeno, P.; Florencio, F.J.; Crespo, J.L. Inhibition of protein synthesis by TOR inactivation revealed a conserved regulatory mechanism of the BiP Chaperone in Chlamydomonas. Plant Physiol. 2011, 157, 730–741. [Google Scholar] [CrossRef]
- Lee, D.Y.; Fiehn, O. Metabolomic response of Chlamydomonas reinhardtii to the inhibition of target of rapamycin (TOR) by rapamycin. J. Microbiol. Biotechnol. 2013, 23, 923–931. [Google Scholar] [CrossRef]
- Yilancioglu, K.; Cokol, M.; Pastirmaci, I.; Erman, B.; Cetiner, S. Oxidative stress is a mediator for increased lipid accumulation in a newly isolated Dunaliella salina strain. PLOS ONE 2014, 9, e91957. [Google Scholar] [CrossRef]
- Oka, S.-I.; Hirata, T.; Suzuki, W.; Naito, D.; Chen, Y.; Chin, A.; Yaginuma, H.; Saito, T.; Nagarajan, N.; Zhai, P.; et al. Thioredoxin-1 maintains mechanistic target of rapamycin (mTOR) function during oxidative stress in cardiomyocytes. J. Biol. Chem. 2017, 292, 18988–19000. [Google Scholar] [CrossRef] [Green Version]
- Wang, H.; Wang, S.; Lu, Y.; Alvarez, S.; Hicks, L.M.; Ge, X.; Xia, Y. Proteomic analysis of early-responsive redox-sensitive proteins in Arabidopsis. J. Proteome Res. 2012, 11, 412–424. [Google Scholar] [CrossRef] [PubMed]
- Zaffagnini, M.; Bedhomme, M.; Groni, H.; Marchand, C.H.; Puppo, C.; Gontero, B.; Cassier-Chauvat, C.; Decottignies, P.; Lemaire, S.D. Glutathionylation in the photosynthetic model organism Chlamydomonas reinhardtii: A proteomic survey. Mol. Cell Proteomics 2012, 11, M111.014142. [Google Scholar] [CrossRef] [PubMed]
- Liu, P.; Zhang, H.; Wang, H.; Xia, Y. Identification of redox-sensitive cysteines in the Arabidopsis proteome using OxiTRAQ, a quantitative redox proteomics method. Proteomics 2014, 14, 750–762. [Google Scholar] [CrossRef] [PubMed]
- Slade, W.O.; Werth, E.G.; McConnell, E.W.; Alvarez, S.; Hicks, L.M. Quantifying reversible oxidation of protein thiols in photosynthetic organisms. J. Am. Soc. Mass Spectrom. 2015, 26, 631–640. [Google Scholar] [CrossRef] [PubMed]
- McConnell, E.W.; Werth, E.G.; Hicks, L.M. The phosphorylated redox proteome of Chlamydomonas reinhardtii: Revealing novel means for regulation of protein structure and function. Redox Biol. 2018, 17, 35–46. [Google Scholar] [CrossRef]
- Harris, E.H. The Chlamydomonas Sourcebook; Academic Press Inc.: San Diego, CA, USA, 1989. [Google Scholar]
- Woodworth, B.D.; Mead, R.L.; Nichols, C.N.; Kolling, D.R.J. Photosynthetic light reactions increase total lipid accumulation in carbon-supplemented batch cultures of Chlorella vulgaris. Bioresour. Technol. 2015, 179, 159–164. [Google Scholar] [CrossRef] [PubMed]
- Smythers, A.L.; Garmany, A.; Perry, N.L.; Higginbotham, E.L.; Adkins, P.E.; Kolling, D.R.J. Characterizing the effect of Poast on Chlorella vulgaris, a non-target organism. Chemosphere 2019, 219, 704–712. [Google Scholar] [CrossRef]
- Schindelin, J.; Arganda-Carreras, I.; Frise, E.; Kaynig, V.; Longair, M.; Pietzsch, T.; Preibisch, S.; Rueden, C.; Saalfeld, S.; Schmid, B.; et al. Fiji: An open-source platform for biological-image analysis. Nat. Methods. 2012, 9, 676–682. [Google Scholar] [CrossRef]
- Wellburn, A.R. The spectral determination of chlorophylls a and b, as well as total carotenoids, using various solvents with spectrophotometers of different resolution. J. Plant Phys. 1994, 144, 307–313. [Google Scholar] [CrossRef]
- Matyash, V.; Liebisch, G.; Kurzchalia, T.V.; Shevchenko, A.; Schwudke, D. Lipid extraction by methyl-tert-butyl ether for high-throughput lipidomics. J. Lipid Res. 2008, 49, 1137–1146. [Google Scholar] [CrossRef] [Green Version]
- Greenspan, P.; Mayer, E.P.; Fowler, S.D. Nile red: A selective fluorescent stain for intracellular lipid droplets. J. Cell Biol. 1985, 100, 965–973. [Google Scholar] [CrossRef] [PubMed]
- Dubois, M.; Gilles, K.A.; Hamilton, J.K.; Rebers, P.A.; Smith, F. Colorimetric method for determination of sugars and related substances. Anal. Chem. 1956, 28, 350–356. [Google Scholar] [CrossRef]
- Slocombe, S.P.; Ross, M.; Thomas, N.; McNeill, S.; Stanley, M.S. A rapid and general method for measurement of protein in micro-algal biomass. Bioresour. Technol. 2013, 129, 51–57. [Google Scholar] [CrossRef] [PubMed] [Green Version]
- Lowry, O.H.; Rosebrough, N.J.; Farr, A.L.; Randall, R.J. Protein measurement with the Folin phenol reagent. J. Biol. Chem. 1951, 193, 265–275. [Google Scholar] [PubMed]
- Price, C.A. A membrane method for determination of total protein in dilute algal suspensions. Anal. Biochem. 1965, 12, 213–218. [Google Scholar] [CrossRef]
- Stirbet, A.; Lazár, D.; Kromdijk, J.; Govindjee. Chlorophyll a fluorescence induction: Can just a one-second measurement be used to quantify abiotic stress responses? Photosynthetica 2018, 56, 86–104. [Google Scholar] [CrossRef]
- Stirbet, A.; Govindjee. On the relation between the Kautsky effect (chlorophyll a fluorescence induction) and Photosystem II: Basics and applications of the OJIP fluorescence transient. J. Photochem. Photobiol. B 2011, 104, 236–257. [Google Scholar] [CrossRef]
- Müller, P.; Li, X.-P.; Niyogi, K.K. Non-photochemical quenching. A response to excess light energy. Plant Phys. 2001, 125, 1558–1566. [Google Scholar] [CrossRef]
- Schansker, G.; Tóth, S.Z.; Strasser, R.J. Dark recovery of the Chl a fluorescence transient (OJIP) after light adaptation: The qT-component of non-photochemical quenching is related to an activated photosystem I acceptor side. Biochim. Biophys. Acta 2006, 1757, 787–797. [Google Scholar] [CrossRef] [Green Version]
- McConnell, E.W.; Berg, P.; Westlake, T.J.; Wilson, K.M.; Popescu, G.V.; Hicks, L.M.; Popescu, S.C. Proteome-wide analysis of cysteine reactivity during effector-triggered immunity. Plant Physiol. 2019, 179, 1248–1264. [Google Scholar] [CrossRef]
- Käll, L.; Canterbury, J.D.; Weston, J.; Noble, W.S.; MacCoss, M.J. Semi-supervised learning for peptide identification from shotgun proteomics datasets. Nat. Methods 2007, 4, 923–925. [Google Scholar] [CrossRef]
- Gianetto, Q.G. imp4p: Imputation for Proteomics. 2018. Available online: https://cran.r-project.org/web/packages/imp4p/index.html (accessed on 30 January 2019).
- Benjamini, Y.; Hochberg, Y. Controlling the false discovery rate: A practical and powerful approach to multiple testing. J. Royal Stat. Soc. B 1995, 57, 289–300. [Google Scholar] [CrossRef]
- Vizcaíno, J.A.; Deutsch, E.W.; Wang, R.; Csordas, A.; Reisinger, F.; Ríos, D.; Dianes, J.A.; Sun, Z.; Farrah, T.; Bandeira, N.; et al. ProteomeXchange provides globally coordinated proteomics data submission and dissemination. Nat. Biotechnol. 2014, 32, 223–226. [Google Scholar] [CrossRef]
- Ishida, H.; Izumi, M.; Wada, S.; Makino, A. Roles of autophagy in chloroplast recycling. Biochim. Biophys. Acta 2014, 1837, 512–521. [Google Scholar] [CrossRef] [Green Version]
- Roustan, V.; Weckwerth, W. Quantitative phosphoproteomic and system-level analysis of TOR inhibition unravel distinct organellar acclimation in Chlamydomonas reinhardtii. Front. Plant Sci. 2018, 9, 1590. [Google Scholar] [CrossRef]
- Yap, B.H.J.; Crawford, S.A.; Dagastine, R.R.; Scales, P.J.; Martin, G.J.O. Nitrogen deprivation of microalgae: Effect on cell size, cell wall thickness, cell strength, and resistance to mechanical disruption. J. Ind. Microbiol. Biotechnol. 2016, 43, 1671–1680. [Google Scholar] [CrossRef]
- Jeong, S.W.; Nam, S.W.; HwangBo, K.; Jeong, W.J.; Jeong, B.; Chang, Y.K.; Park, Y.-I. Transcriptional regulation of cellulose biosynthesis during the early phase of nitrogen deprivation in Nannochloropsis salina. Sci. Rep. 2017, 7, 5264. [Google Scholar] [CrossRef]
- Antal, T.; Rubin, A. In vivo analysis of chlorophyll a fluorescence induction. Photosyn. Res. 2008, 96, 217–226. [Google Scholar] [CrossRef]
- Tomek, P.; Lazár, D.; Ilík, P.; Naus, J. Research note: On the intermediate steps between the O and P steps in chlorophyll a fluorescence rise measured at different intensities of exciting light. Functional Plant Biol. 2001, 28, 1151–1160. [Google Scholar] [CrossRef]
- Rigbolt, K.T.G.; Zarei, M.; Sprenger, A.; Becker, A.C.; Diedrich, B.; Huang, X.; Eiselein, S.; Kristensen, A.R.; Gretzmeier, C.; Andersen, J.S.; et al. Characterizatino of early autophagy signaling by quantitative phosphoproteomics. Autophagy. 2014, 10, 356–371. [Google Scholar] [CrossRef]
- Muthuramalingam, M.; Matros, A.; Scheibe, R.; Mock, H.-P.; Dietz, K.-J. The hydrogen peroxide-sensitive proteome of the chloroplast in vitro and in vivo. Front. Plant Sci. 2013, 4. [Google Scholar] [CrossRef]
- Paulech, J.; Solis, N.; Edwards, A.V.G.; Puckeridge, M.; White, M.Y.; Cordwell, S.J. Large-scale capture of peptides containing reversibly oxidized cysteines by thiol-disulfide exchange applied to the myocardial redox proteome. Anal. Chem. 2013, 85, 3774–3780. [Google Scholar] [CrossRef]
- Guo, J.; Gaffrey, M.J.; Su, D.; Liu, T.; Camp, D.G.; Smith, R.D.; Qian, W.-J. Resin-assisted enrichment of thiols as a general strategy for proteomic profiling of cysteine-based reversible modifications. Nat. Protoc. 2014, 9, 64–75. [Google Scholar] [CrossRef]
- Forrester, M.T.; Thompson, J.W.; Foster, M.W.; Nogueira, L.; Moseley, M.A.; Stamler, J.S. Proteomic analysis of S-nitrosylation and denitrosylation by resin-assisted capture. Nat. Biotechnol. 2009, 27, 557–559. [Google Scholar] [CrossRef] [Green Version]
- Su, D.; Shukla, A.K.; Chen, B.; Kim, J.-S.; Nakayasu, E.; Qu, Y.; Aryal, U.; Weitz, K.; Clauss, T.R.W.; Monroe, M.E.; et al. Quantitative site-specific reactivity profiling of S-nitrosylation in mouse skeletal muscle using cysteinyl peptide enrichment coupled with mass spectrometry. Free Radic. Biol. Med. 2013, 57, 68–78. [Google Scholar] [CrossRef] [Green Version]
- Lind, C.; Gerdes, R.; Hamnell, Y.; Schuppe-Koistinen, I.; von Löwenhielm, H.B.; Holmgren, A.; Cotgreave, I.A. Identification of S-glutathionylated cellular proteins during oxidative stress and constitutive metabolism by affinity purification and proteomic analysis. Arch. Biochem. Biophys. 2002, 406, 229–240. [Google Scholar] [CrossRef]
- Su, D.; Gaffrey, M.J.; Guo, J.; Hatchell, K.E.; Chu, R.K.; Clauss, T.R.W.; Aldrich, J.T.; Wu, S.; Purvine, S.; Camp, D.G.; et al. Proteomic identification and quantification of S-glutathionylation in mouse macrophages using resin-assisted enrichment and isobaric labeling. Free Radic. Biol. Med. 2014, 67, 460–470. [Google Scholar] [CrossRef]
- Forrester, M.T.; Hess, D.T.; Thompson, J.W.; Hultman, R.; Moseley, M.A.; Stamler, J.S.; Casey, P.J. Site-specific analysis of protein S-acylation by resin-assisted capture. J. Lipid Res. 2011, 52, 393–398. [Google Scholar] [CrossRef] [Green Version]
- Hansen, R.E.; Winther, J.R. An introduction to methods for analyzing thiols and disulfides: Reactions, reagents, and practical considerations. Anal. Biochem. 2009, 394, 147–158. [Google Scholar] [CrossRef]
- Paulech, J.; Solis, N.; Cordwell, S.J. Characterization of reaction conditions providing rapid and specific cysteine alkylation for peptide-based mass spectrometry. Biochim. Biophys. Acta 2013, 1834, 372–379. [Google Scholar] [CrossRef]
- Morisse, S.; Zaffagnini, M.; Gao, X.-H.; Lemaire, S.D.; Marchand, C.H. Insight into protein S-nitrosylation in Chlamydomonas reinhardtii. Antioxid. Redox Signal. 2014, 21, 1271–1284. [Google Scholar] [CrossRef] [PubMed]
- Pérez-Pérez, M.E.; Mauriès, A.; Maes, A.; Tourasse, N.J.; Hamon, M.; Lemaire, S.D.; Marchand, C.H. The deep thioredoxome in Chlamydomonas reinhardtii: New insights into redox regulation. Mol. Plant 2017, 10, 1107–1125. [Google Scholar] [CrossRef] [PubMed]
- Burrus, L.W.; Zuber, M.E.; Lueddecke, B.A.; Olwin, B.B. Identification of a cysteine-rich receptor for fibroblast growth factors. Mol. Cell. Biol. 1992, 12, 5600–5609. [Google Scholar] [CrossRef] [PubMed]
- Song, H.; Bao, S.; Ramanadham, S.; Turk, J. Effects of biological oxidants on the catalytic activity and structure of group VIA Phospholipase A2. Biochem. 2006, 45, 6392–6406. [Google Scholar] [CrossRef] [PubMed]
- Sato, N.; Fujiwara, S.; Kawaguchi, A.; Tsuzuki, M. Cloning of a gene for chloroplast ω6 Desaturase of a green alga, Chlamydomonas reinhardtii. J. Biochem. 1997, 122, 1224–1232. [Google Scholar] [CrossRef] [PubMed]
- Tsukamoto, Y.; Fukushima, Y.; Hara, S.; Hisabori, T. Redox control of the activity of Phosphoglycerate Kinase in Synechocystis sp. PCC6803. Plant Cell Physiol. 2013, 54, 484–491. [Google Scholar] [CrossRef] [PubMed]
- Liebeke, M.; Pöther, D.-C.; van Duy, N.; Albrecht, D.; Becher, D.; Hochgräfe, F.; Lalk, M.; Hecker, M.; Antelmann, H. Depletion of thiol-containing proteins in response to quinones in Bacillus subtilis. Mol. Microbiol. 2008, 69, 1513–1529. [Google Scholar] [CrossRef] [PubMed]
- Loi, V.V.; Rossius, M.; Antelmann, H. Redox regulation by reversible protein S-thiolation in bacteria. Front. Microbiol. 2015, 6, 187. [Google Scholar] [CrossRef] [Green Version]
- Imber, M.; Pietrzyk-Brzezinska, A.J.; Antelmann, H. Redox regulation by reversible protein S-thiolation in Gram-positive bacteria. Redox Biol. 2019, 20, 130–145. [Google Scholar] [CrossRef]
- Topf, U.; Suppanz, I.; Samluk, L.; Wrobel, L.; Böser, A.; Sakowska, P.; Knapp, B.; Pietrzyk, M.K.; Chacinska, A.; Warscheid, B. Quantitative proteomics identifies redox switches for global translation modulation by mitochondrially produced reactive oxygen species. Nat. Commun. 2018, 9, 324. [Google Scholar] [CrossRef]
- Xiong, Y.; Sheen, J. The role of Target of Rapamycin signaling networks in plant growth and metabolism. Plant Physiol. 2014, 164, 499–512. [Google Scholar] [CrossRef]
- Pancha, I.; Shima, H.; Higashitani, N.; Igarashi, K.; Higashitani, A.; Tanaka, K.; Imamura, S. Target of Rapamycin-signaling modulates starch accumulation via glycogenin phosphorylation status in the unicellular red alga Cyanidioschyzon merolae. Plant J. 2019, 97, 485–499. [Google Scholar] [CrossRef]
- Miginiac-Maslow, M.; Lancelin, J.-M. Intrasteric inhibition in redox signalling: Light activation of NADP-malate dehydrogenase. Photosynth. Res. 2002, 72, 1. [Google Scholar] [CrossRef]
- Lemaire, S.D.; Quesada, A.; Merchan, F.; Corral, J.M.; Igeno, M.I.; Keryer, E.; Issakidis-Bourguet, E.; Hirasawa, M.; Knaff, D.B.; Miginiac-Maslow, M. NADP-Malate Dehydrogenase from unicellular green alga Chlamydomonas reinhardtii: A first step toward redox regulation? Plant Phys. 2005, 137, 514–521. [Google Scholar] [CrossRef]
- Issakidis, E.; Saarinen, M.; Decottignies, P.; Jacquot, J.P.; Crétin, C.; Gadal, P.; Miginiac-Maslow, M. Identification and characterization of the second regulatory disulfide bridge of recombinant sorghum leaf NADP-malate dehydrogenase. J. Biol. Chem. 1994, 269, 3511–3517. [Google Scholar]
- Raines, C.A.; Lloyd, J.C.; Dyer, T.A. New insights into the structure and function of sedoheptulose-1,7-bisphosphatase; an important but neglected Calvin cycle enzyme. J. Exp. Bot. 1999, 50, 1–8. [Google Scholar] [Green Version]
- Yoshida, S.; Hong, S.; Suzuki, T.; Nada, S.; Mannan, A.M.; Wang, J.; Okada, M.; Guan, K.-L.; Inoki, K. Redox regulates mammalian target of rapamycin complex 1 (mTORC1) activity by modulating the TSC1/TSC2-Rheb GTPase pathway. J. Biol. Chem. 2011, 286, 32651–32660. [Google Scholar] [CrossRef]
- Marshansky, V.; Rubinstein, J.L.; Grüber, G. Eukaryotic V-ATPase: Novel structural findings and functional insights. Biochim. Biophys. Acta 2014, 1837, 857–879. [Google Scholar] [CrossRef] [Green Version]
- Seidel, T.; Scholl, S.; Krebs, M.; Rienmüller, F.; Marten, I.; Hedrich, R.; Hanitzsch, M.; Janetzki, P.; Dietz, K.-J.; Schumacher, K. Regulation of the V-type ATPase by redox modulation. Biochem. J. 2012, 448, 243–251. [Google Scholar] [CrossRef] [Green Version]
- Cassan, N.; Lagoutte, B.; Sétif, P. Ferredoxin-NADP+ Reductase kinetics of electron transfer, transient intermediates, and catalytic activities studied by flash-absorption spectroscopy with isolated Photosystem I and Ferredoxin. J. Biol. Chem. 2005, 280, 25960–25972. [Google Scholar] [CrossRef]
- Hasan, S.S.; Cramer, W.A. On rate limitations of electron transfer in the photosynthetic Cytochrome b6f complex. Phys. Chem. Chem. Phys. 2012, 14, 13853–13860. [Google Scholar] [CrossRef] [PubMed]


© 2019 by the authors. Licensee MDPI, Basel, Switzerland. This article is an open access article distributed under the terms and conditions of the Creative Commons Attribution (CC BY) license (http://creativecommons.org/licenses/by/4.0/).
Share and Cite
Ford, M.M.; Smythers, A.L.; McConnell, E.W.; Lowery, S.C.; Kolling, D.R.J.; Hicks, L.M. Inhibition of TOR in Chlamydomonas reinhardtii Leads to Rapid Cysteine Oxidation Reflecting Sustained Physiological Changes. Cells 2019, 8, 1171. https://doi.org/10.3390/cells8101171
Ford MM, Smythers AL, McConnell EW, Lowery SC, Kolling DRJ, Hicks LM. Inhibition of TOR in Chlamydomonas reinhardtii Leads to Rapid Cysteine Oxidation Reflecting Sustained Physiological Changes. Cells. 2019; 8(10):1171. https://doi.org/10.3390/cells8101171
Chicago/Turabian StyleFord, Megan M., Amanda L. Smythers, Evan W. McConnell, Sarah C. Lowery, Derrick R. J. Kolling, and Leslie M. Hicks. 2019. "Inhibition of TOR in Chlamydomonas reinhardtii Leads to Rapid Cysteine Oxidation Reflecting Sustained Physiological Changes" Cells 8, no. 10: 1171. https://doi.org/10.3390/cells8101171