Appendix A
Figure A1.
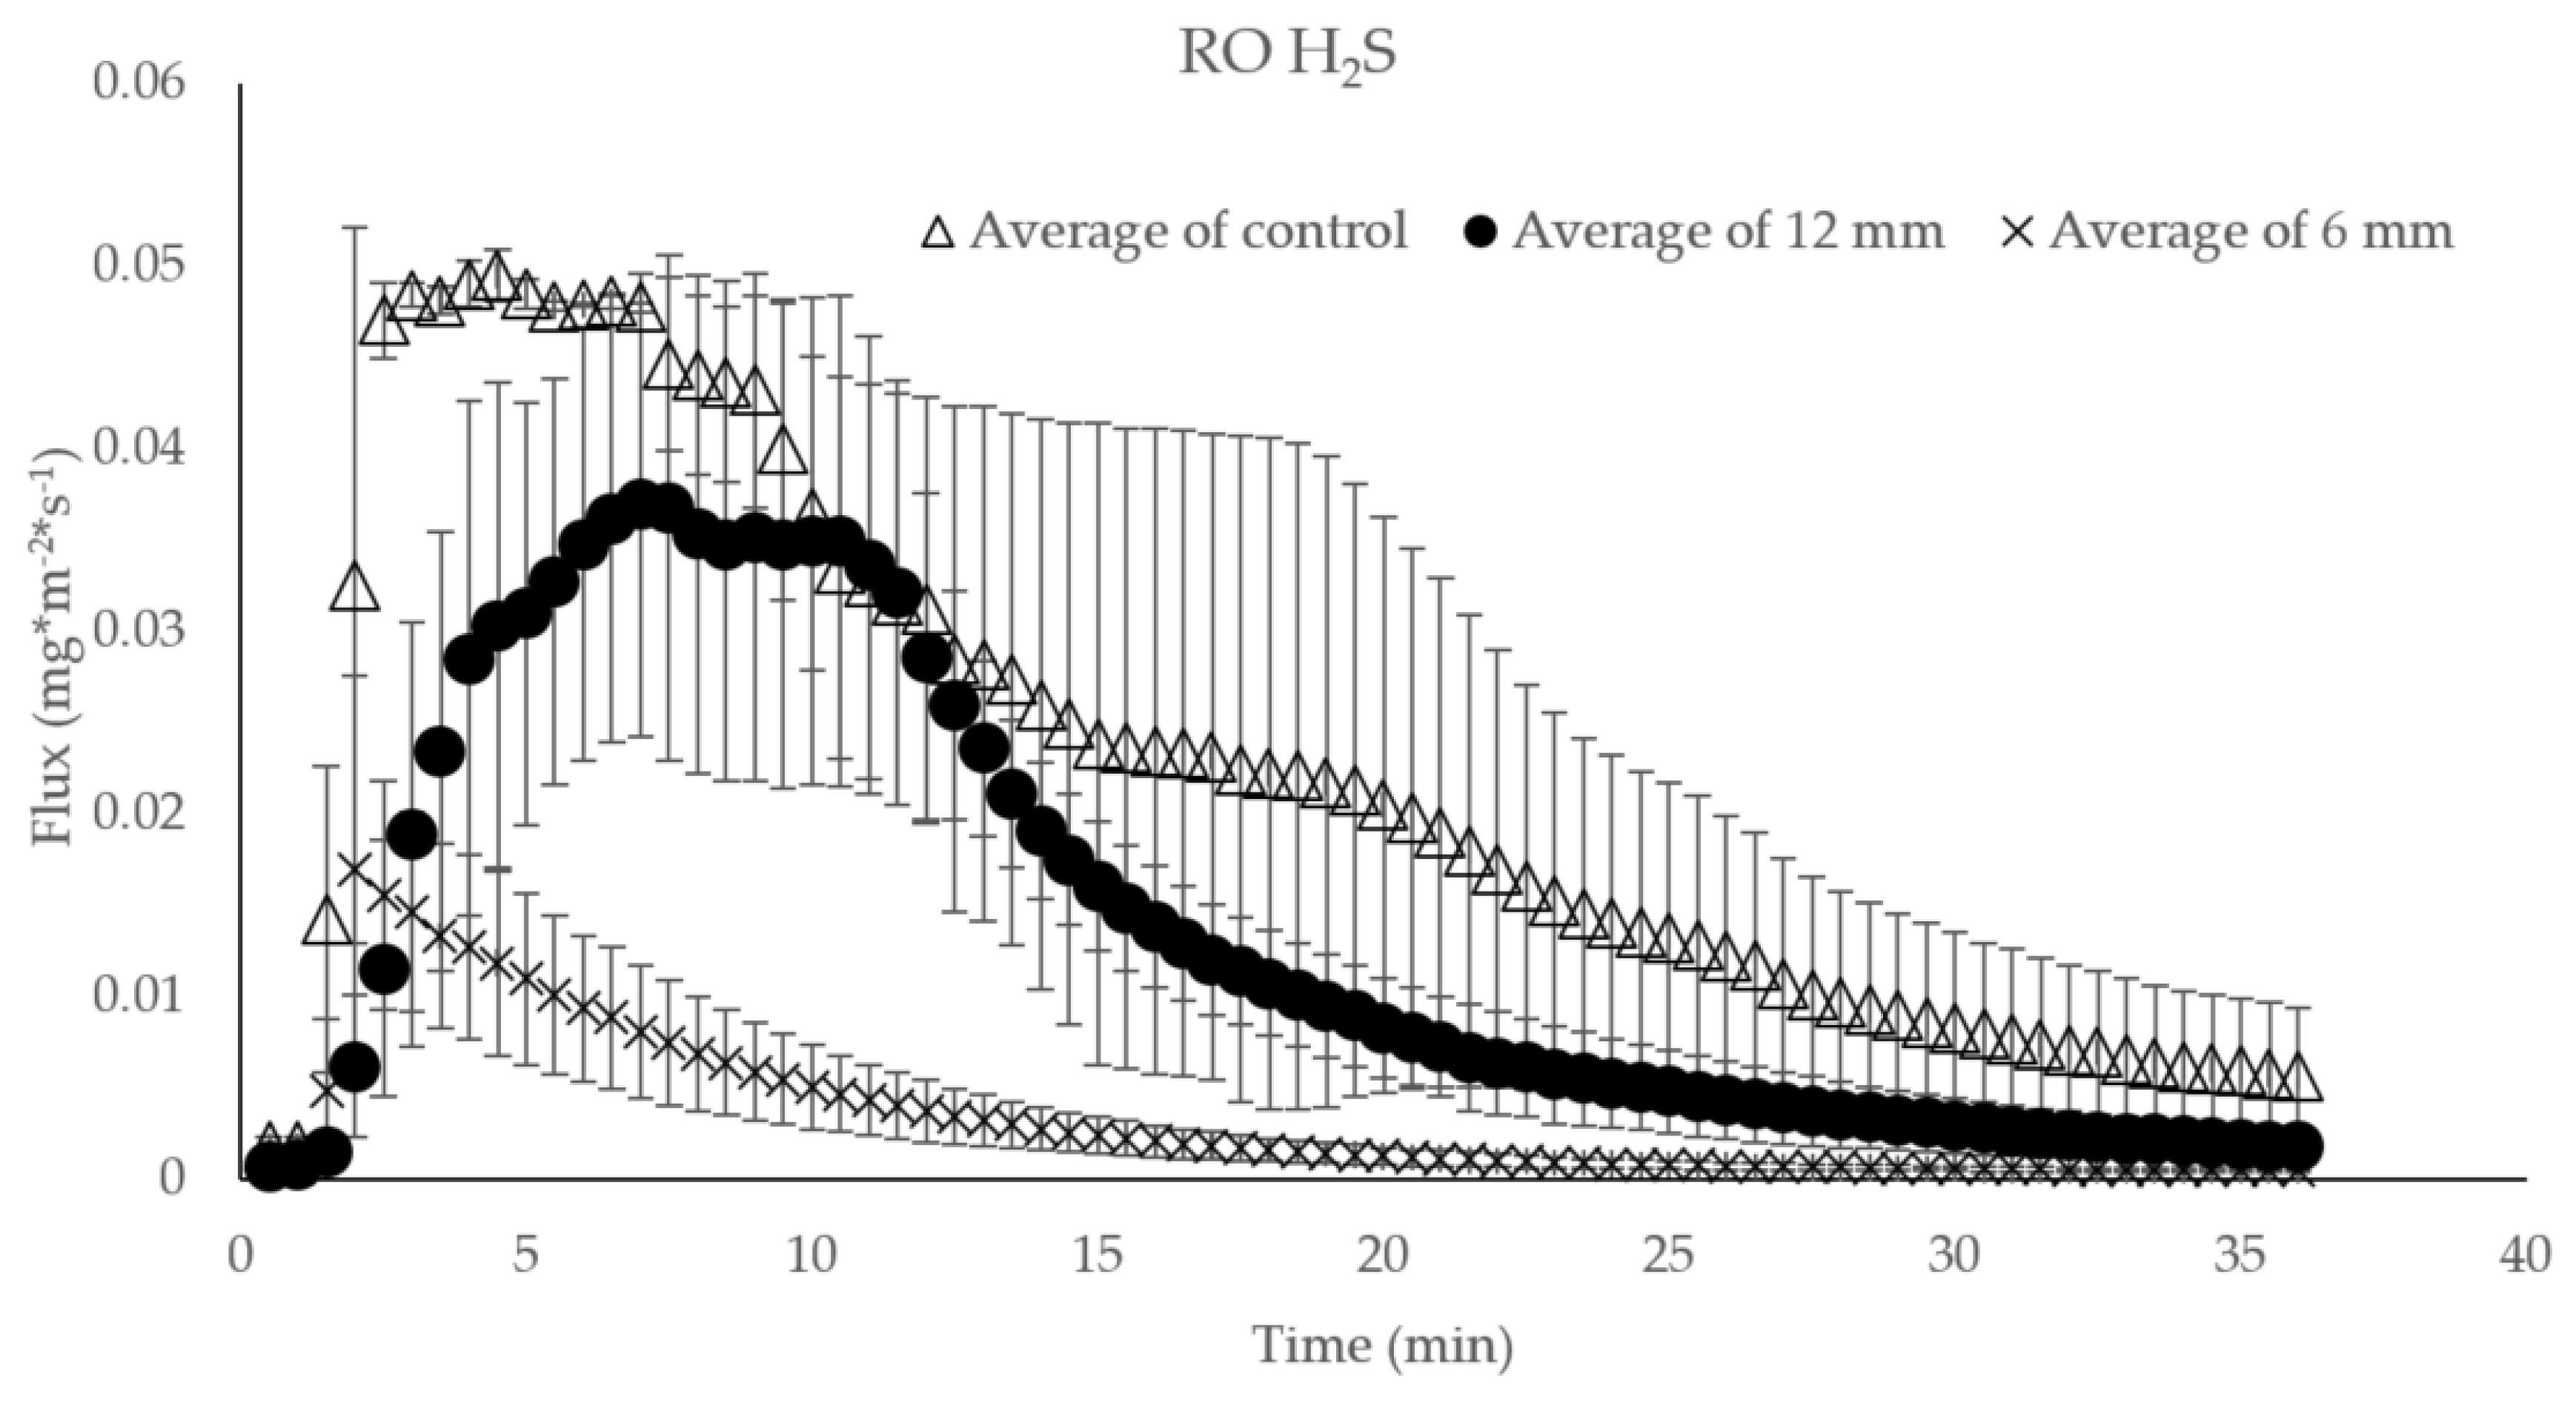
The short-term H2S emissions when manure is treated surficially with RO biochar layer at two thicknesses (6 mm; 12 mm) immediately prior to 3 min agitation. Each data point is the average of triplicate, and the error bar signifies a standard deviation.
Figure A1.
The short-term H2S emissions when manure is treated surficially with RO biochar layer at two thicknesses (6 mm; 12 mm) immediately prior to 3 min agitation. Each data point is the average of triplicate, and the error bar signifies a standard deviation.
Figure A2.
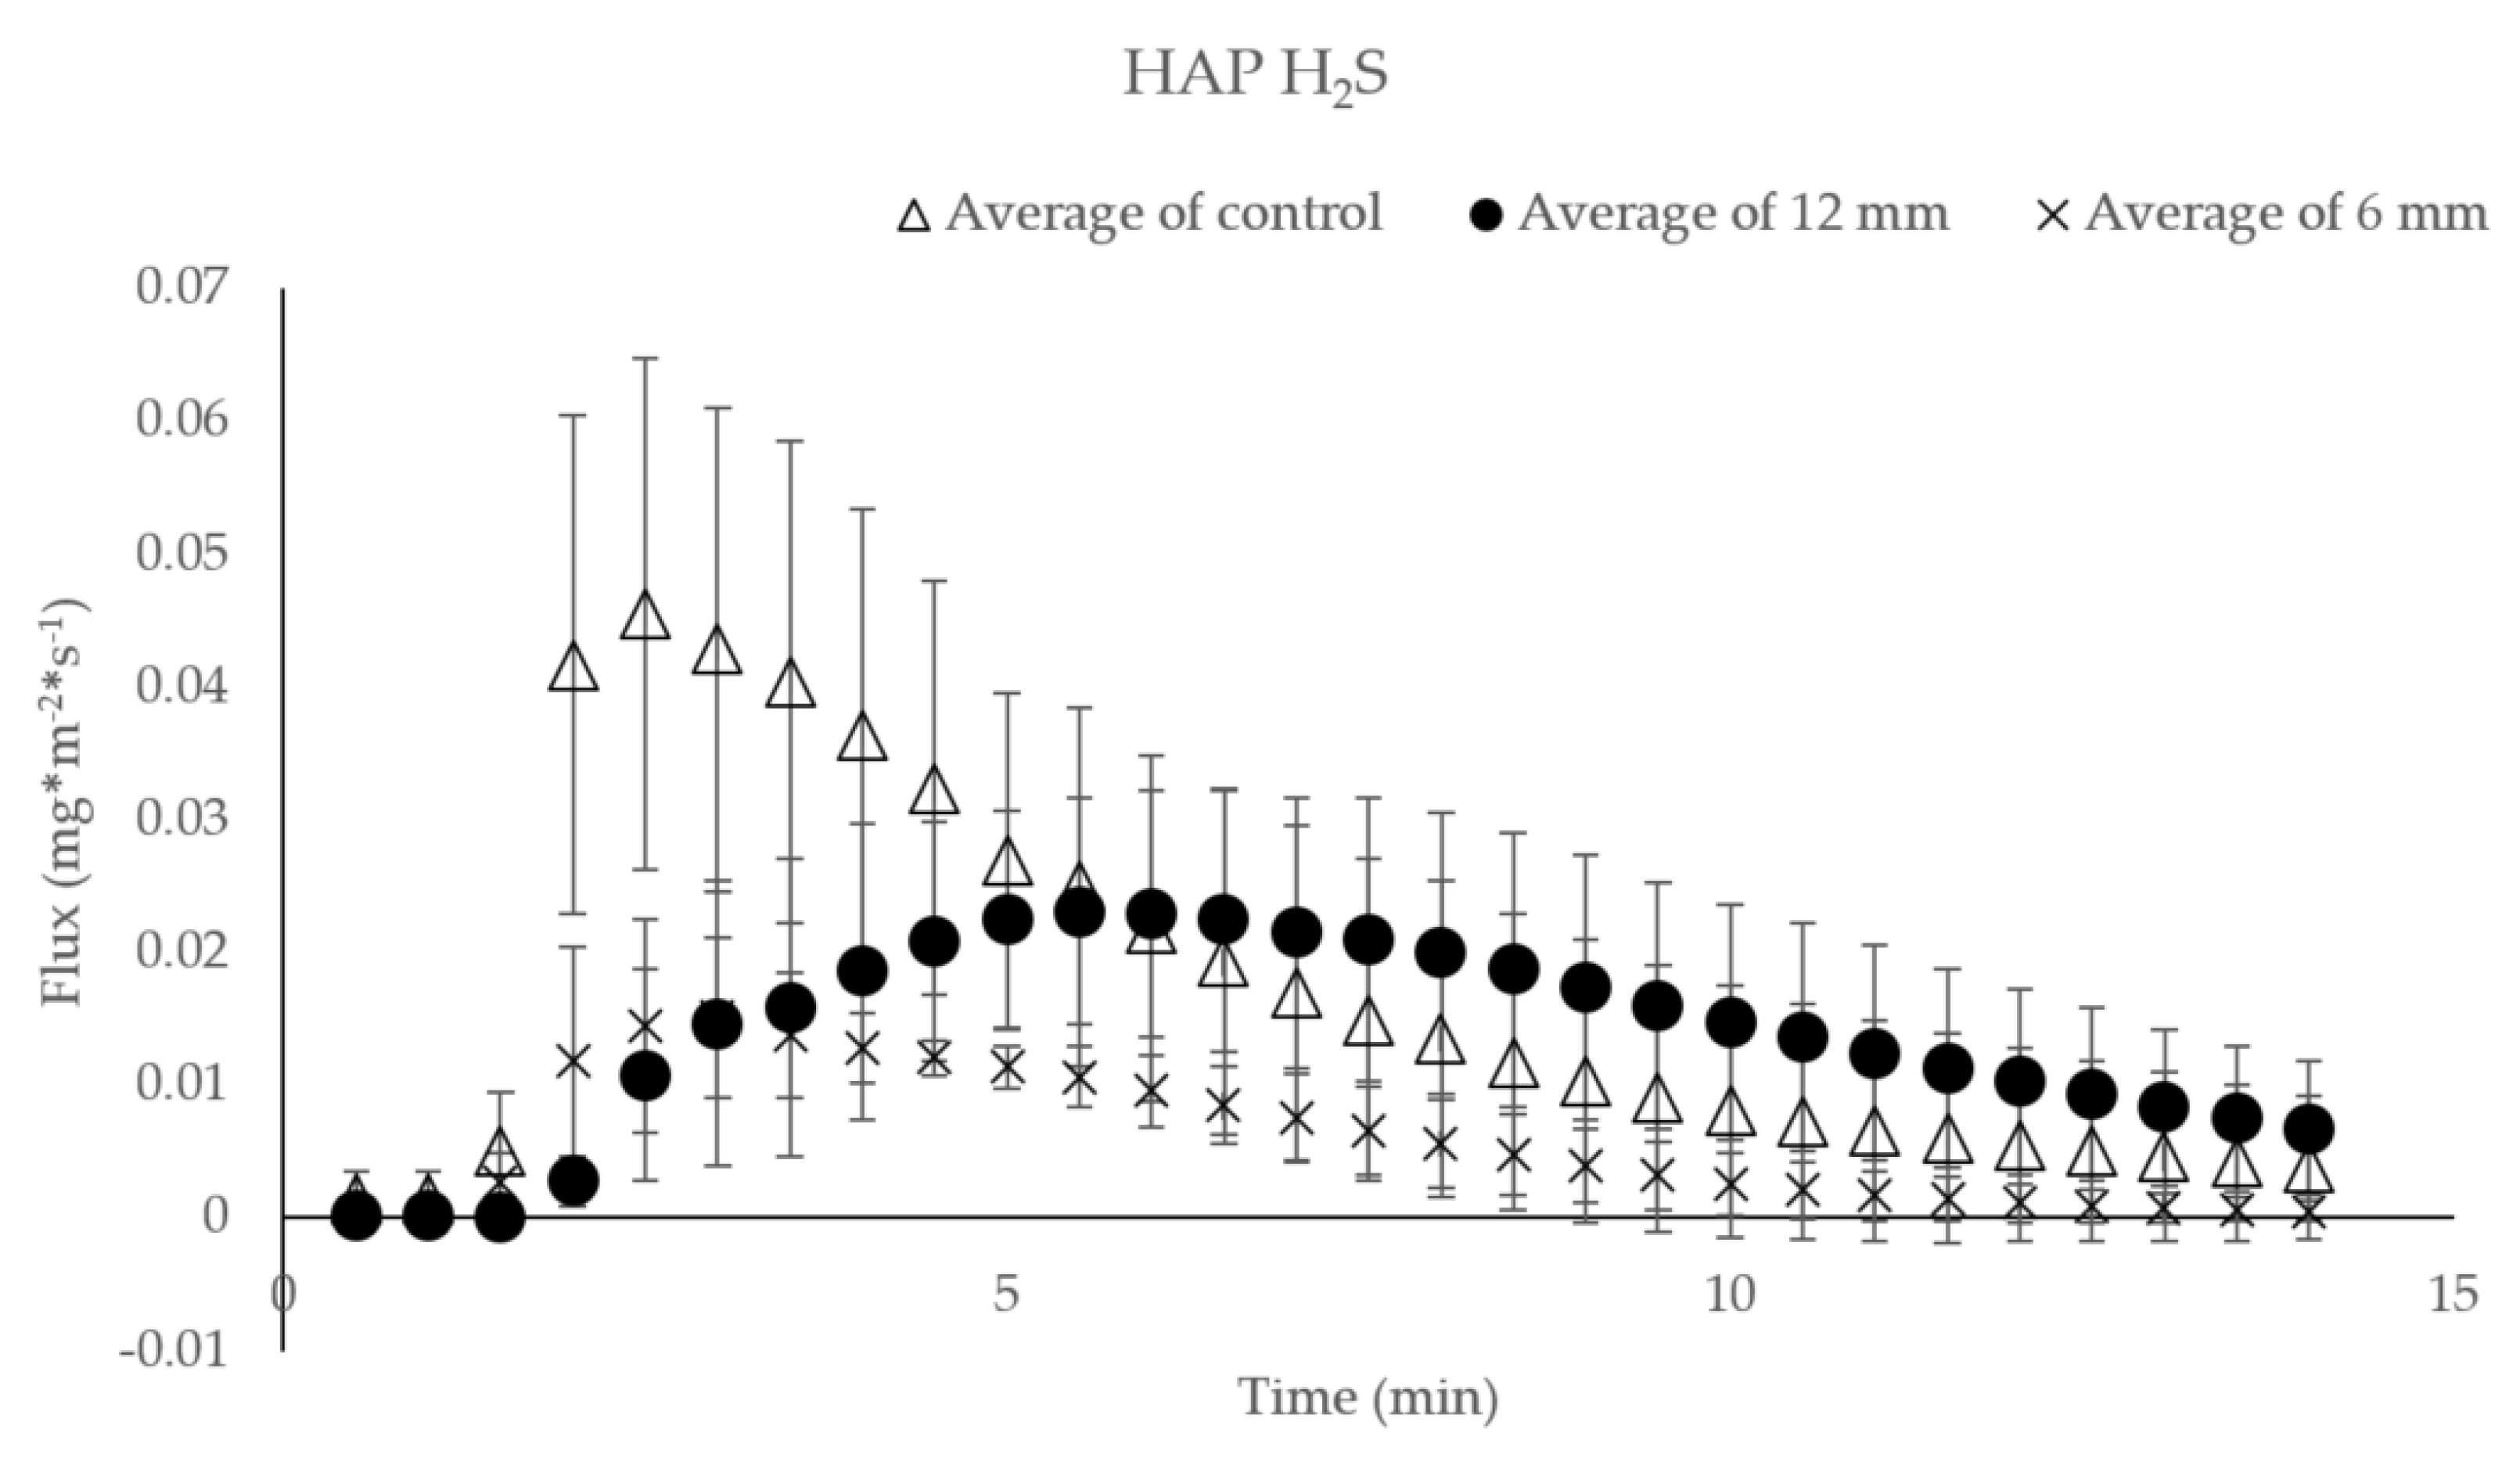
The short-term H2S emissions when manure is treated surficially with HAP biochar layer at two thicknesses (6 mm; 12 mm) immediately prior to 3 min agitation. Each data point is the average of triplicate, and the error bar signifies a standard deviation.
Figure A2.
The short-term H2S emissions when manure is treated surficially with HAP biochar layer at two thicknesses (6 mm; 12 mm) immediately prior to 3 min agitation. Each data point is the average of triplicate, and the error bar signifies a standard deviation.
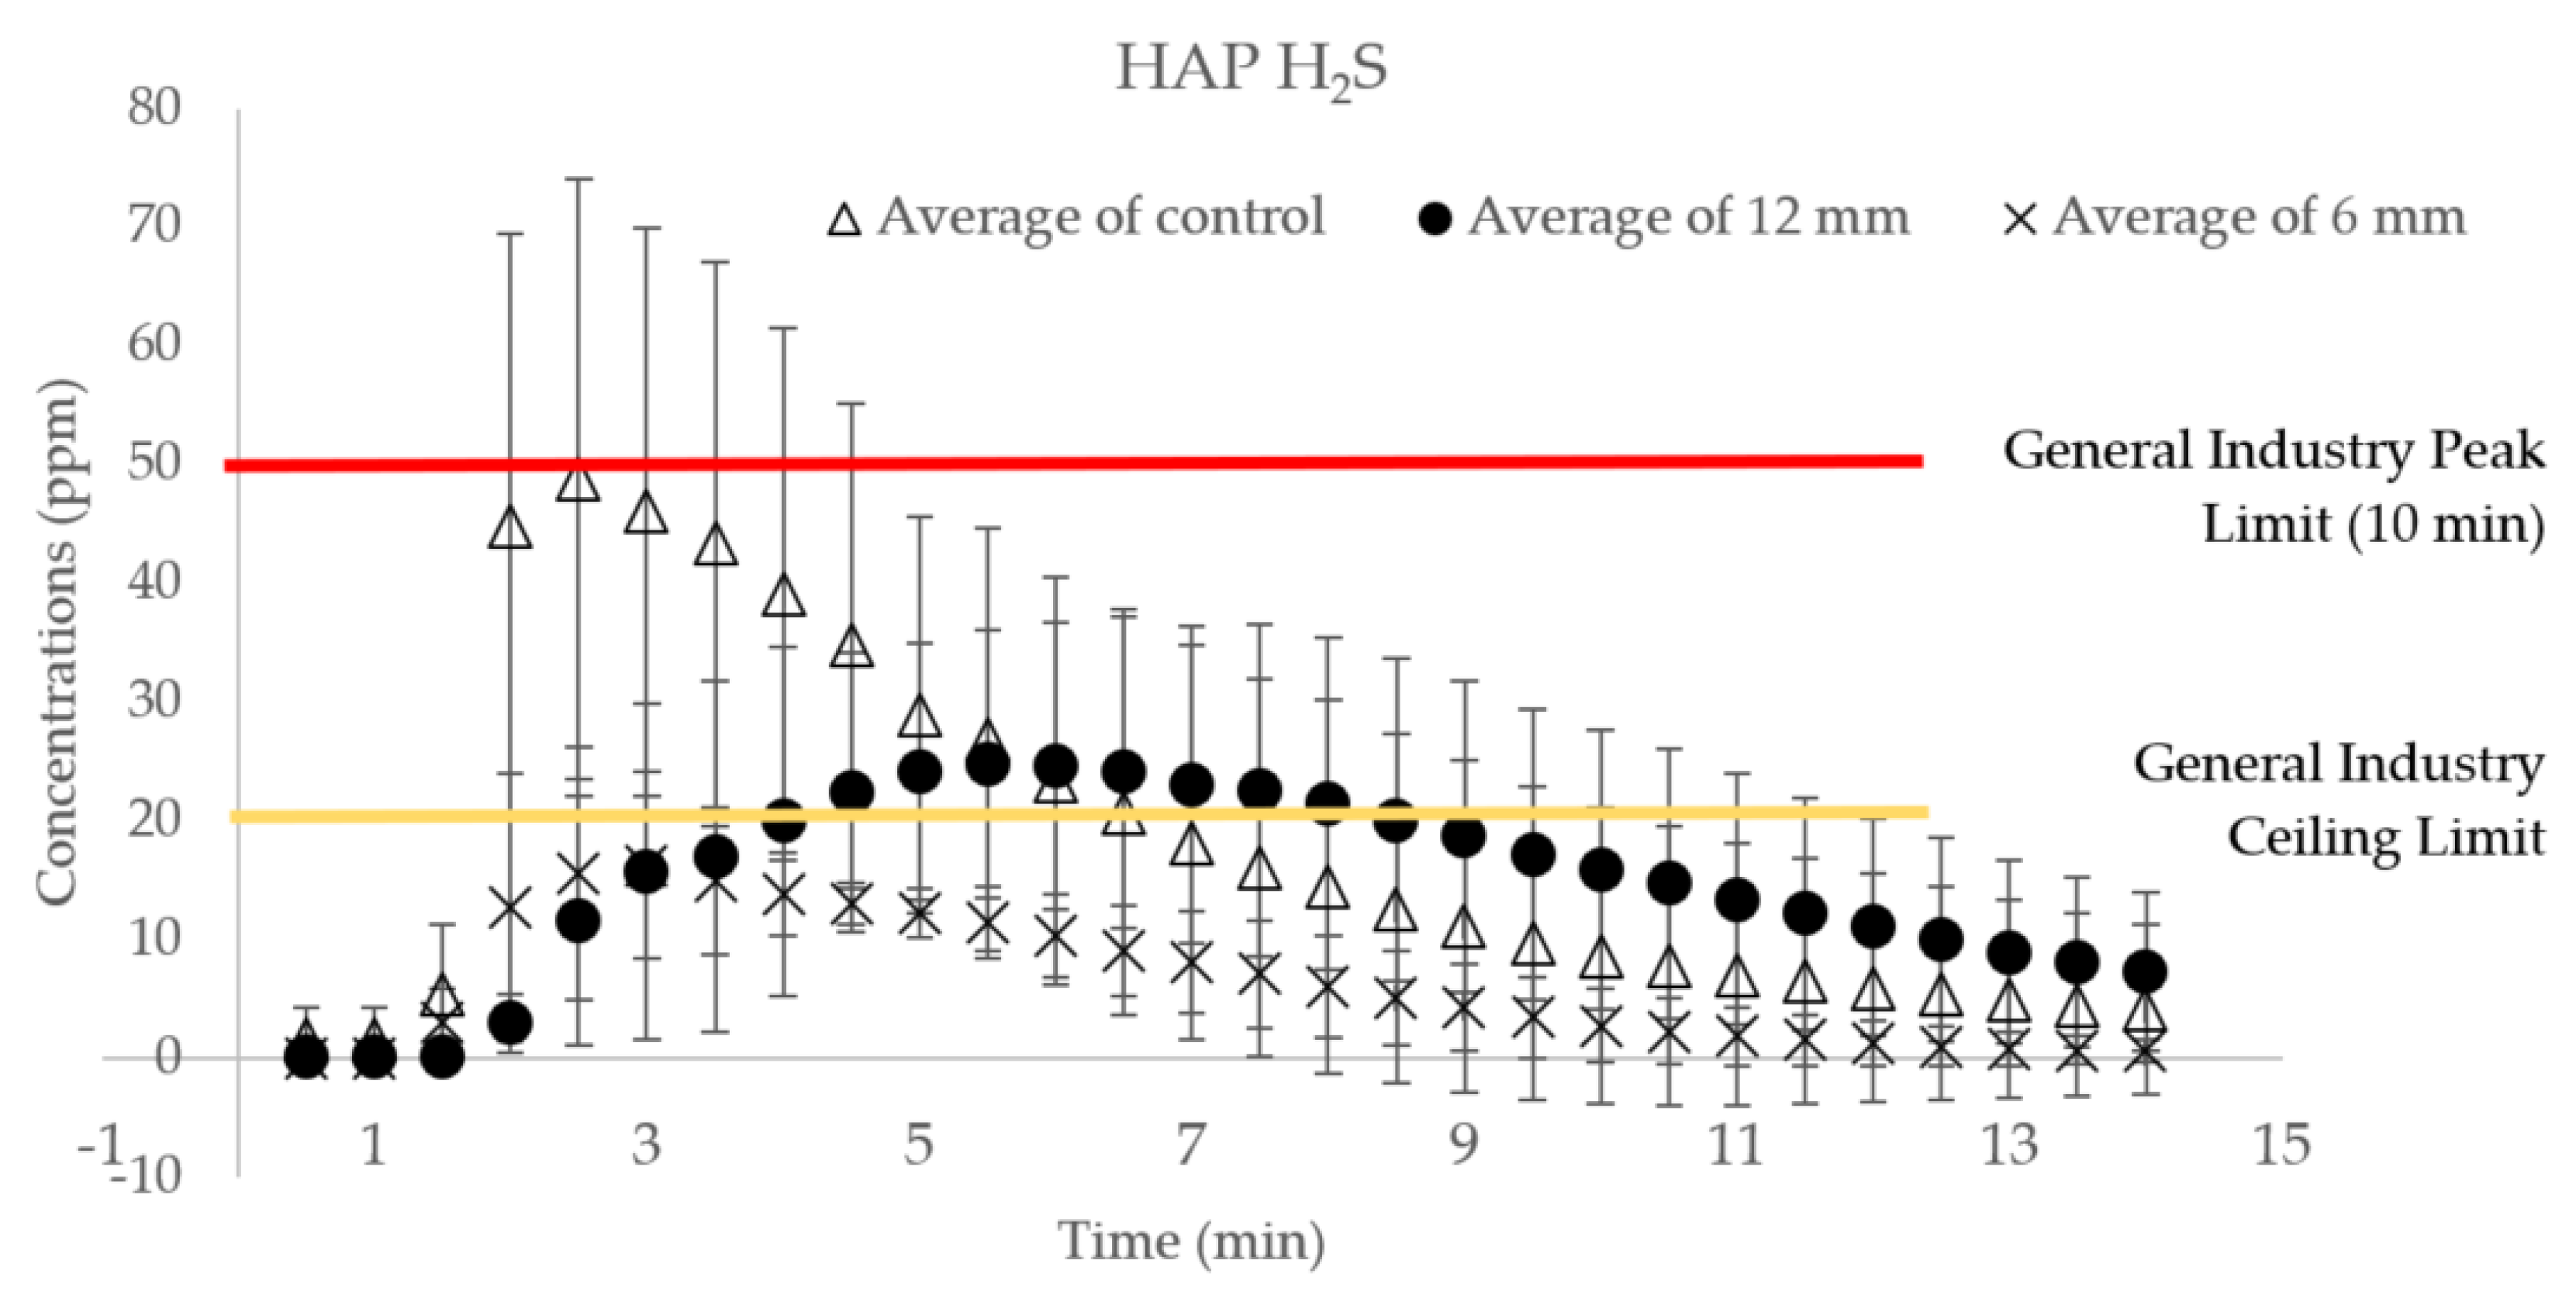
Figure A3.
The short-term H
2S concentrations when manure is treated surficially with HAP biochar layer at two thicknesses (6 mm; 12 mm) immediately
prior to 3 min agitation. Each data point is the average of triplicate, and the error bar signifies a standard deviation. Red line = the ‘General Industry Peak Limit’ (OSHA PEL = 50 ppm); yellow line = the ‘General Industry Ceiling Limit’ (OSHA PEL = 20 ppm) [
1].
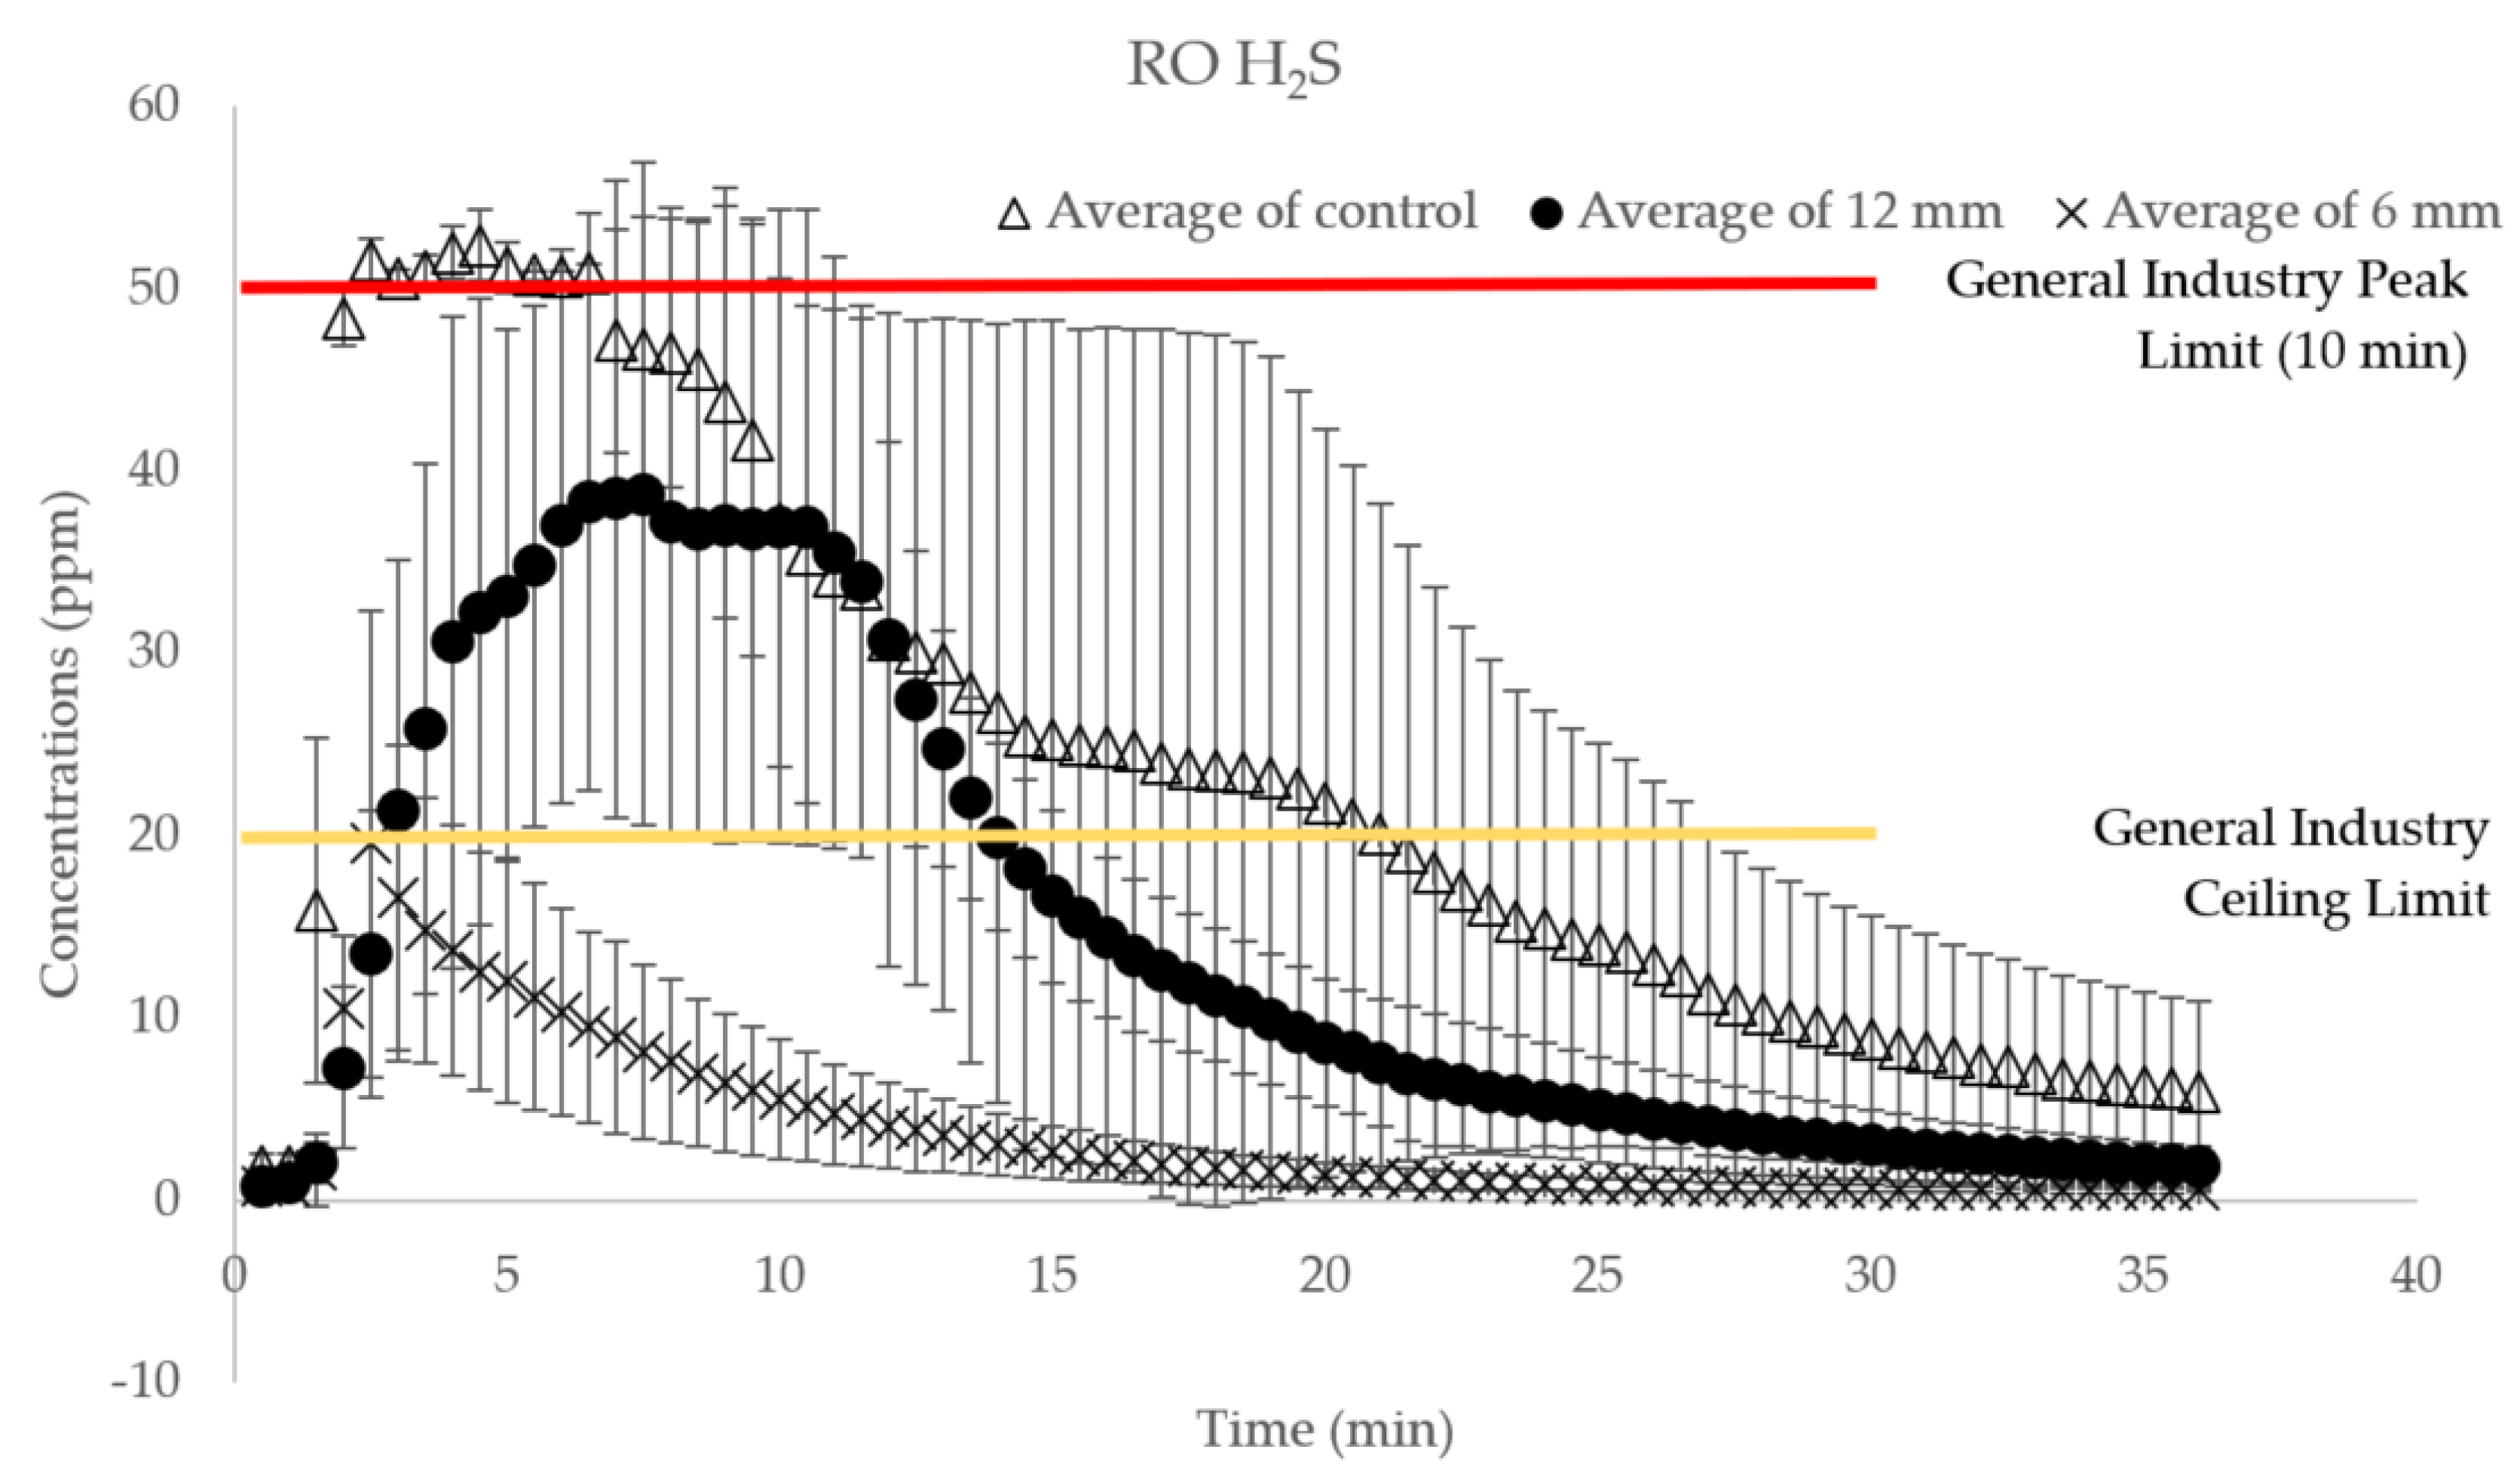
Figure A4.
The short-term H
2S concentrations when manure is treated surficially with RO biochar layer at two thicknesses (6 mm; 12 mm) immediately
prior to 3 min agitation. Each data point is the average of triplicate, and the error bar signifies a standard deviation. Red line = the ‘General Industry Peak Limit’ (OSHA PEL = 50 ppm); yellow line = the ‘General Industry Ceiling Limit’ (OSHA PEL = 20 ppm) [
1].
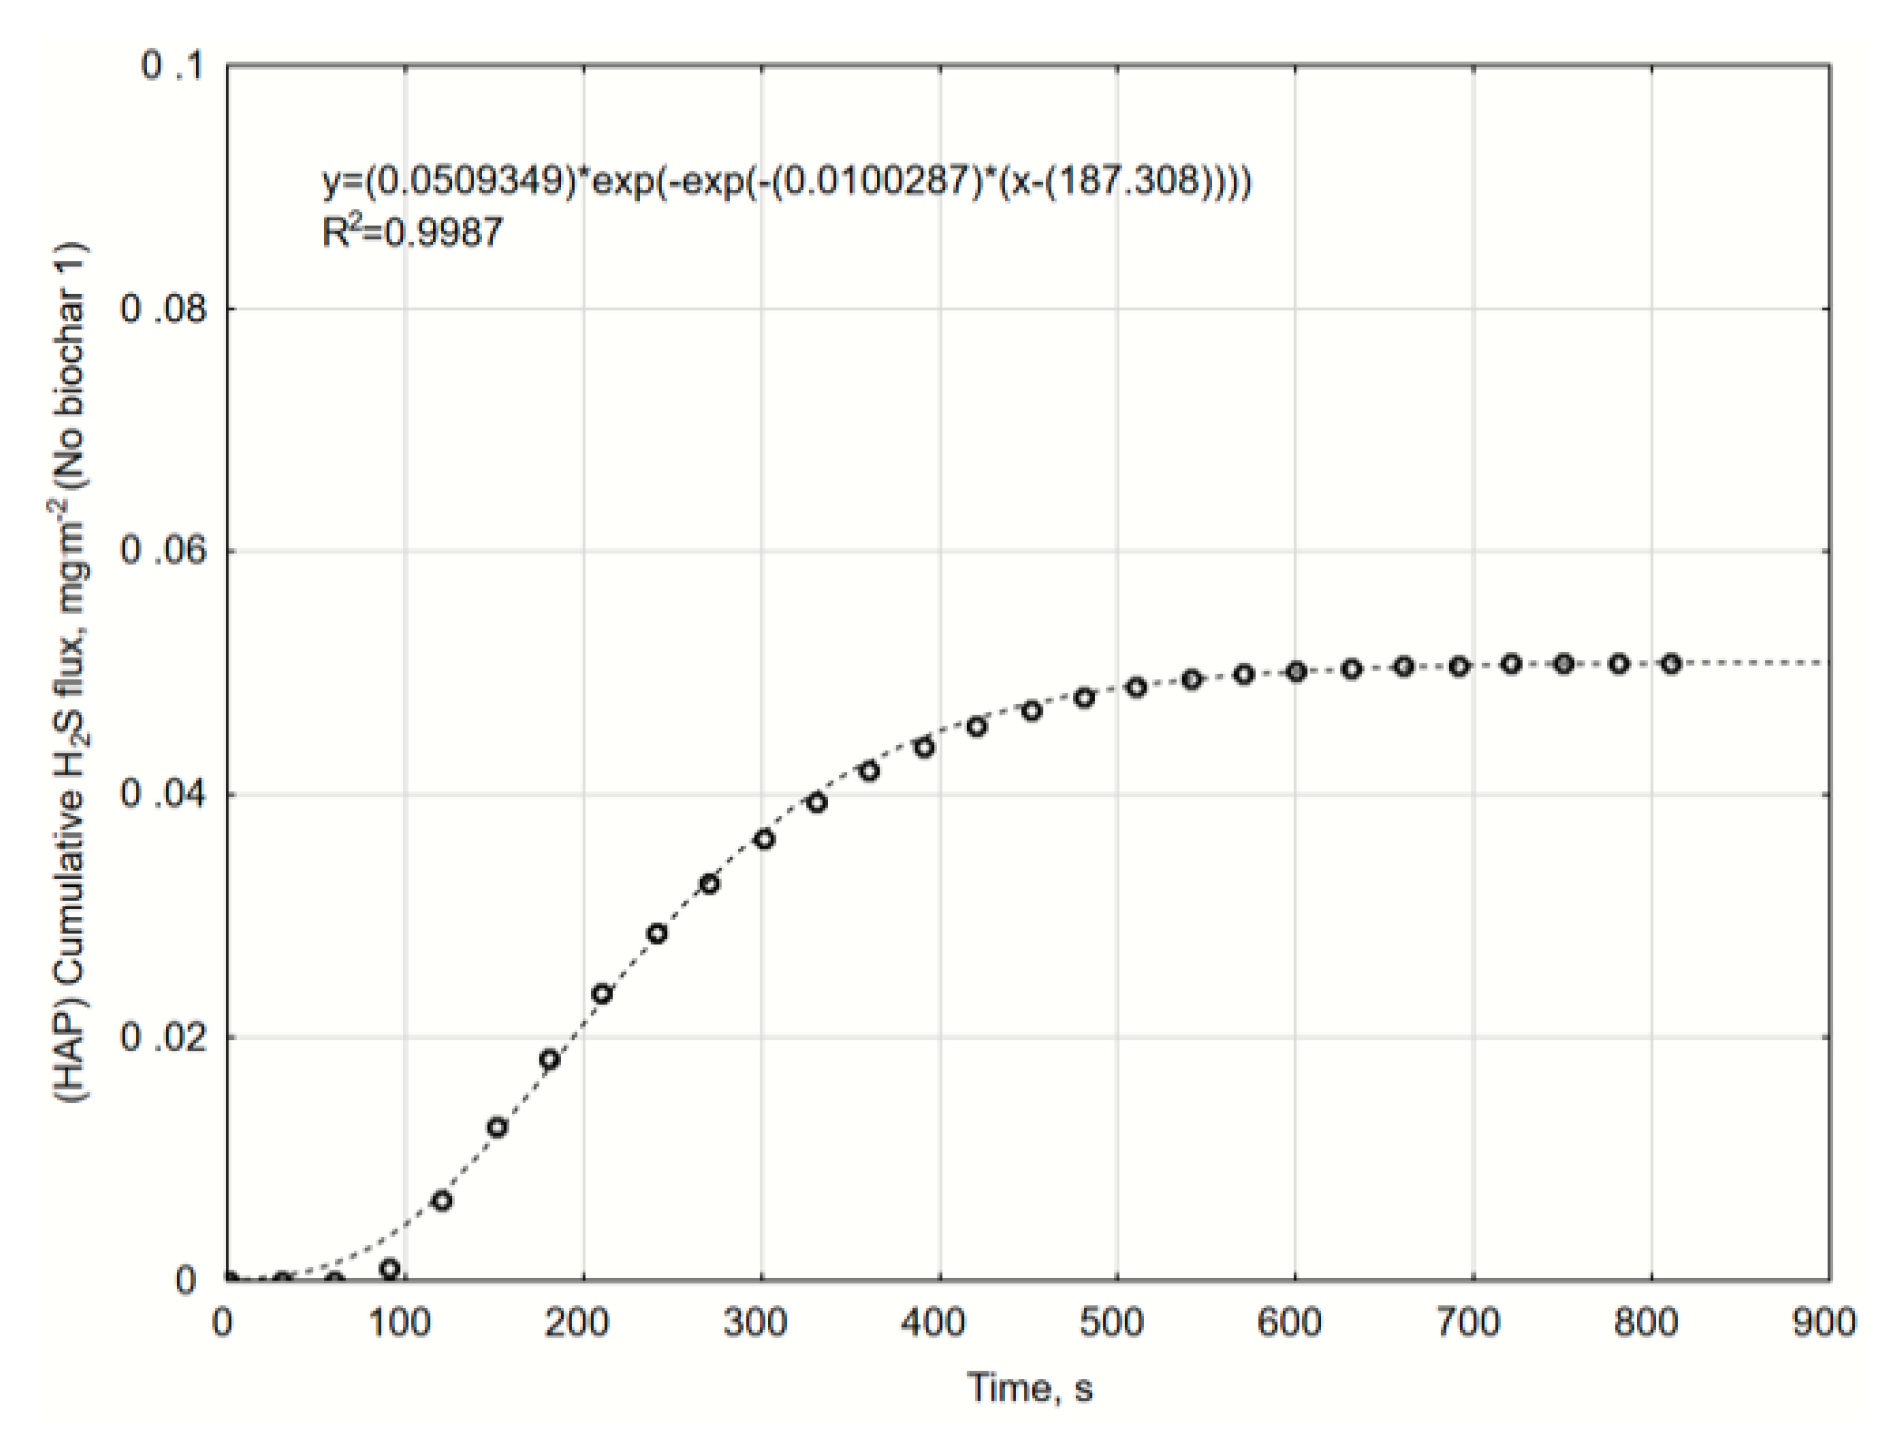
Figure A5.
The cumulative H2S flux. Variant with no HAP biochar, repetition 1. Gompertz equation parameters and R2 determination coefficient.
Figure A5.
The cumulative H2S flux. Variant with no HAP biochar, repetition 1. Gompertz equation parameters and R2 determination coefficient.
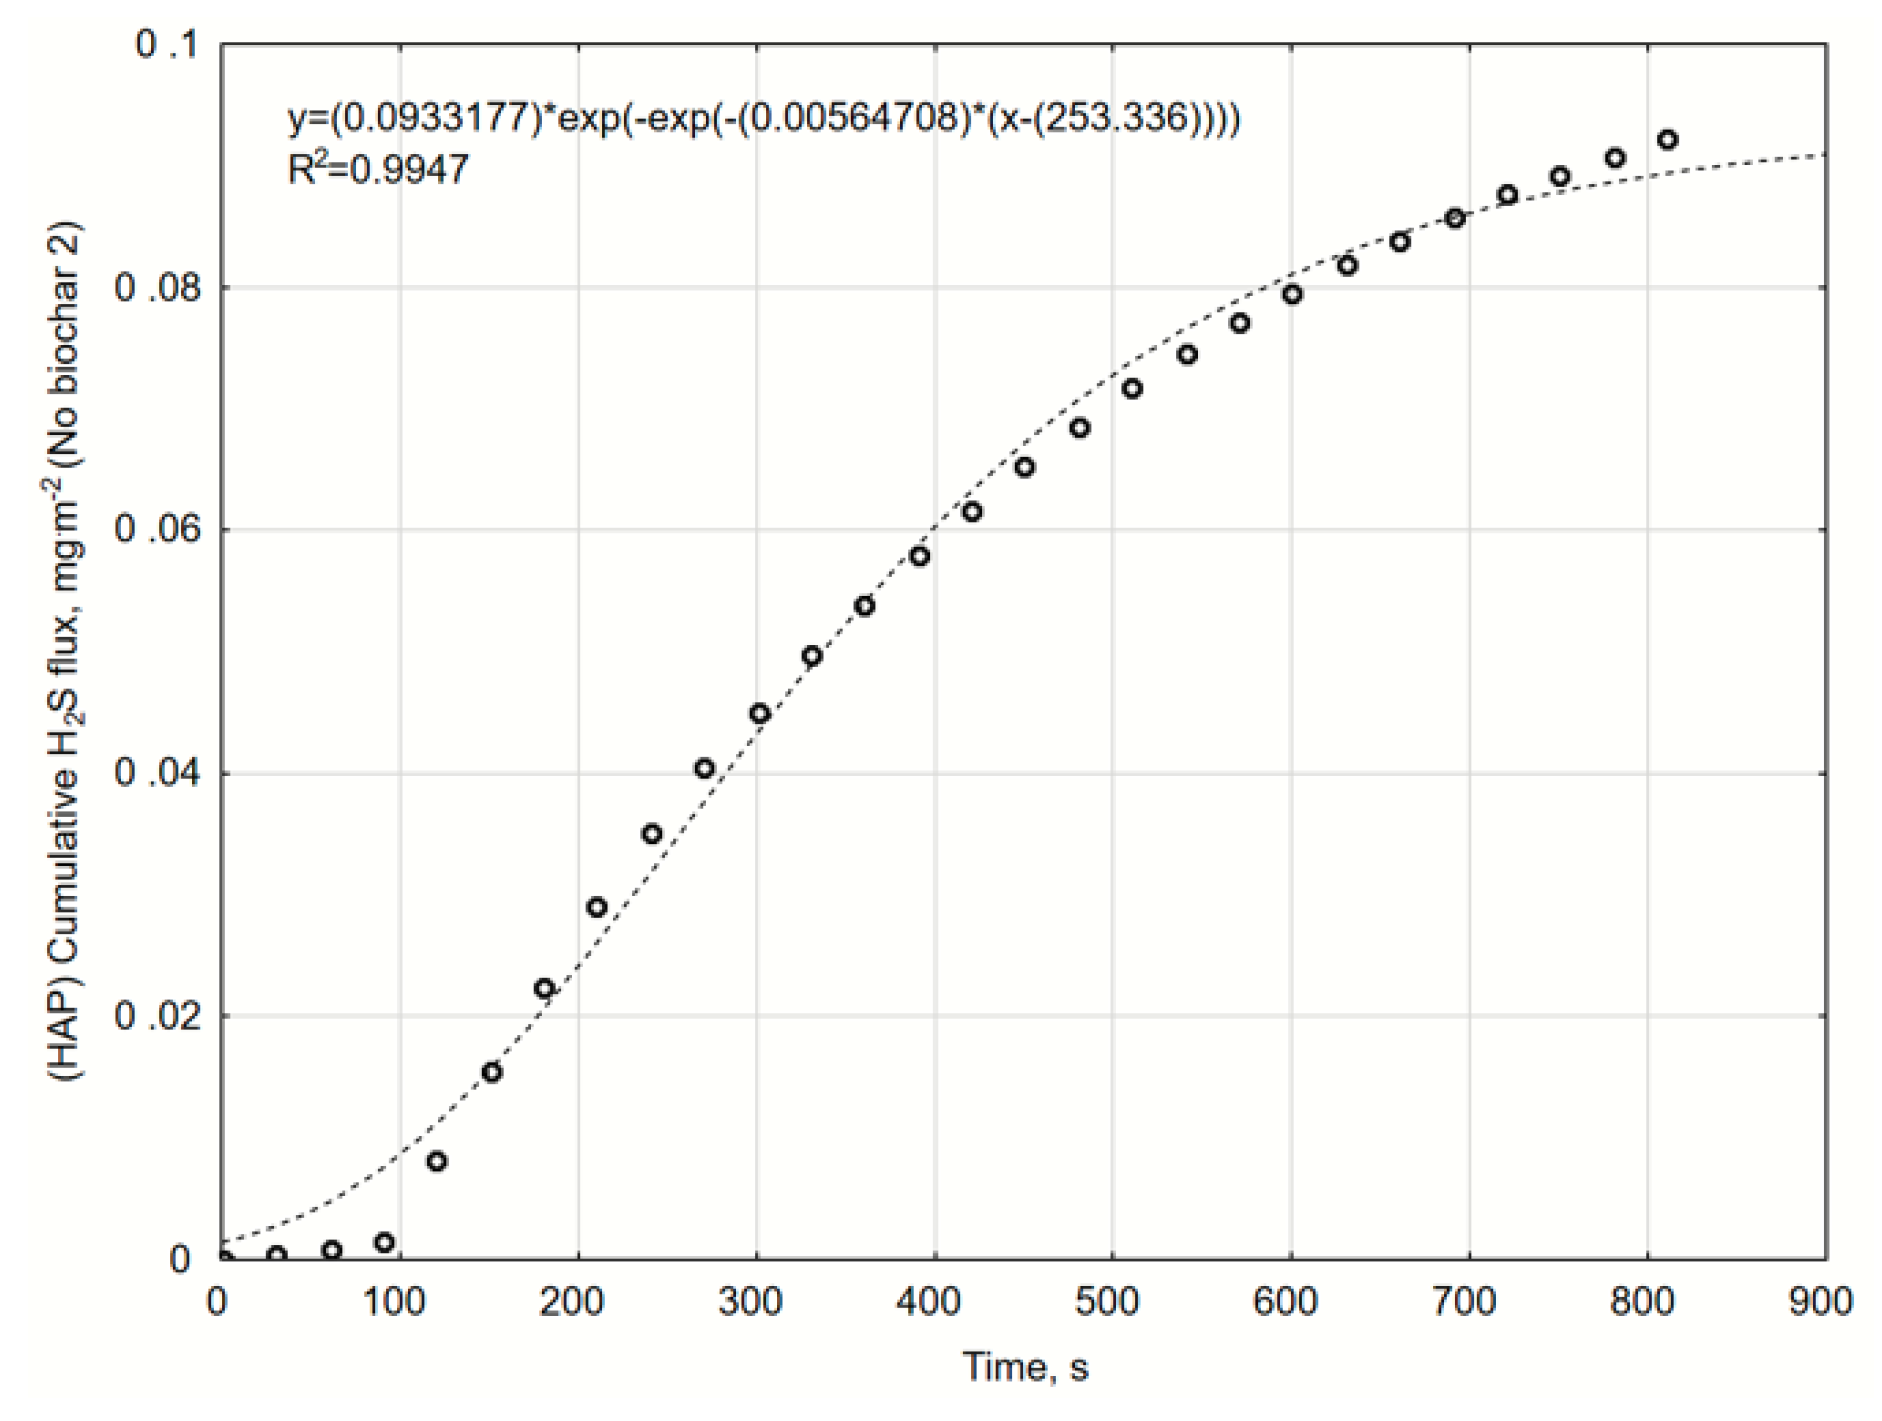
Figure A6.
The cumulative H2S flux. Variant with no HAP biochar, repetition 2. Gompertz equation parameters and R2 determination coefficient.
Figure A6.
The cumulative H2S flux. Variant with no HAP biochar, repetition 2. Gompertz equation parameters and R2 determination coefficient.
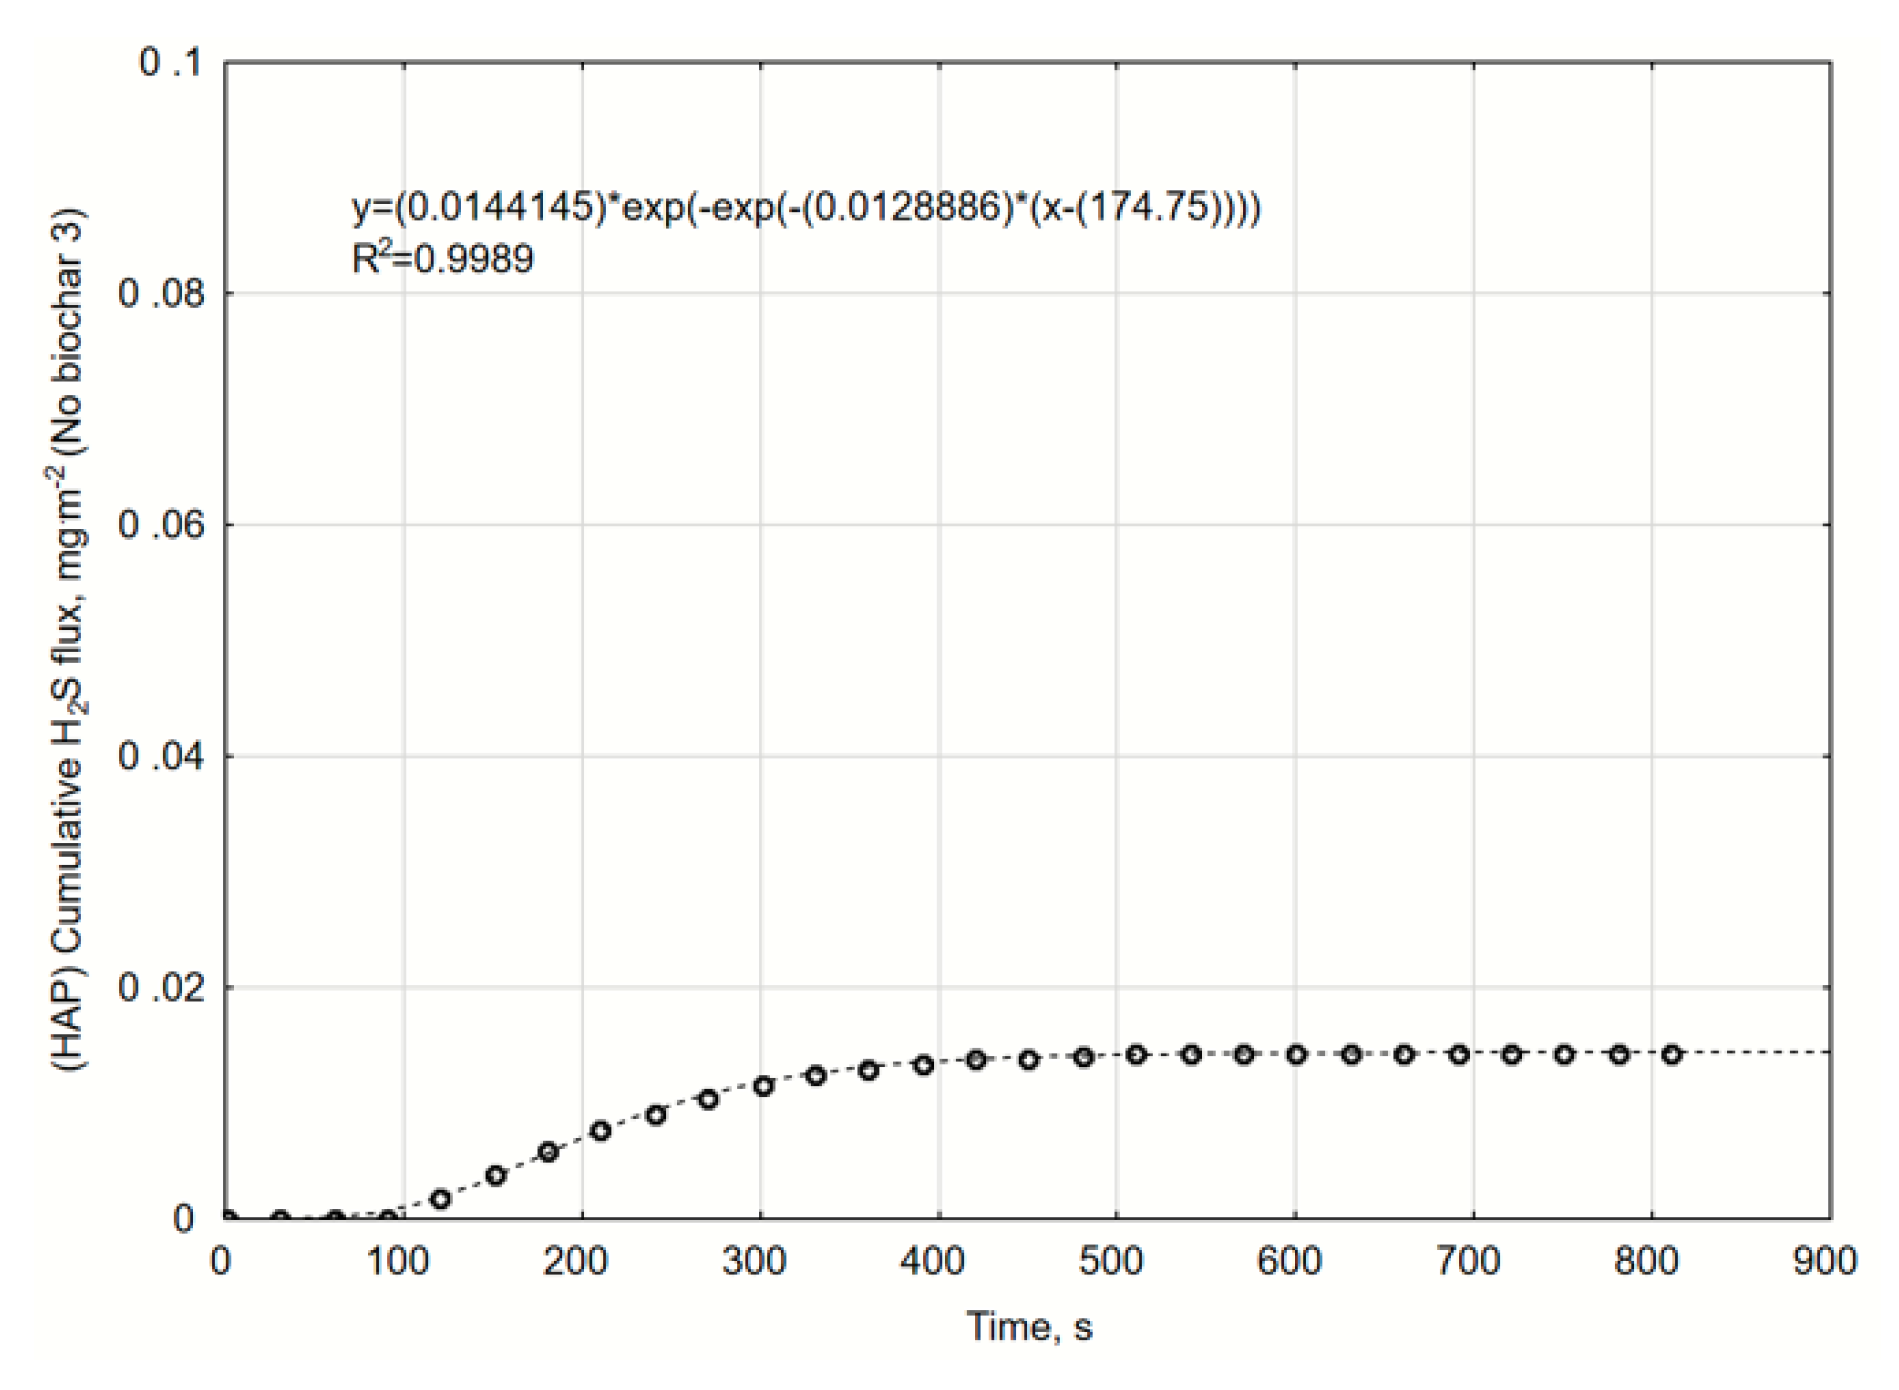
Figure A7.
The cumulative H2S flux. Variant with no HAP biochar, repetition 3. Gompertz equation parameters and R2 determination coefficient.
Figure A7.
The cumulative H2S flux. Variant with no HAP biochar, repetition 3. Gompertz equation parameters and R2 determination coefficient.
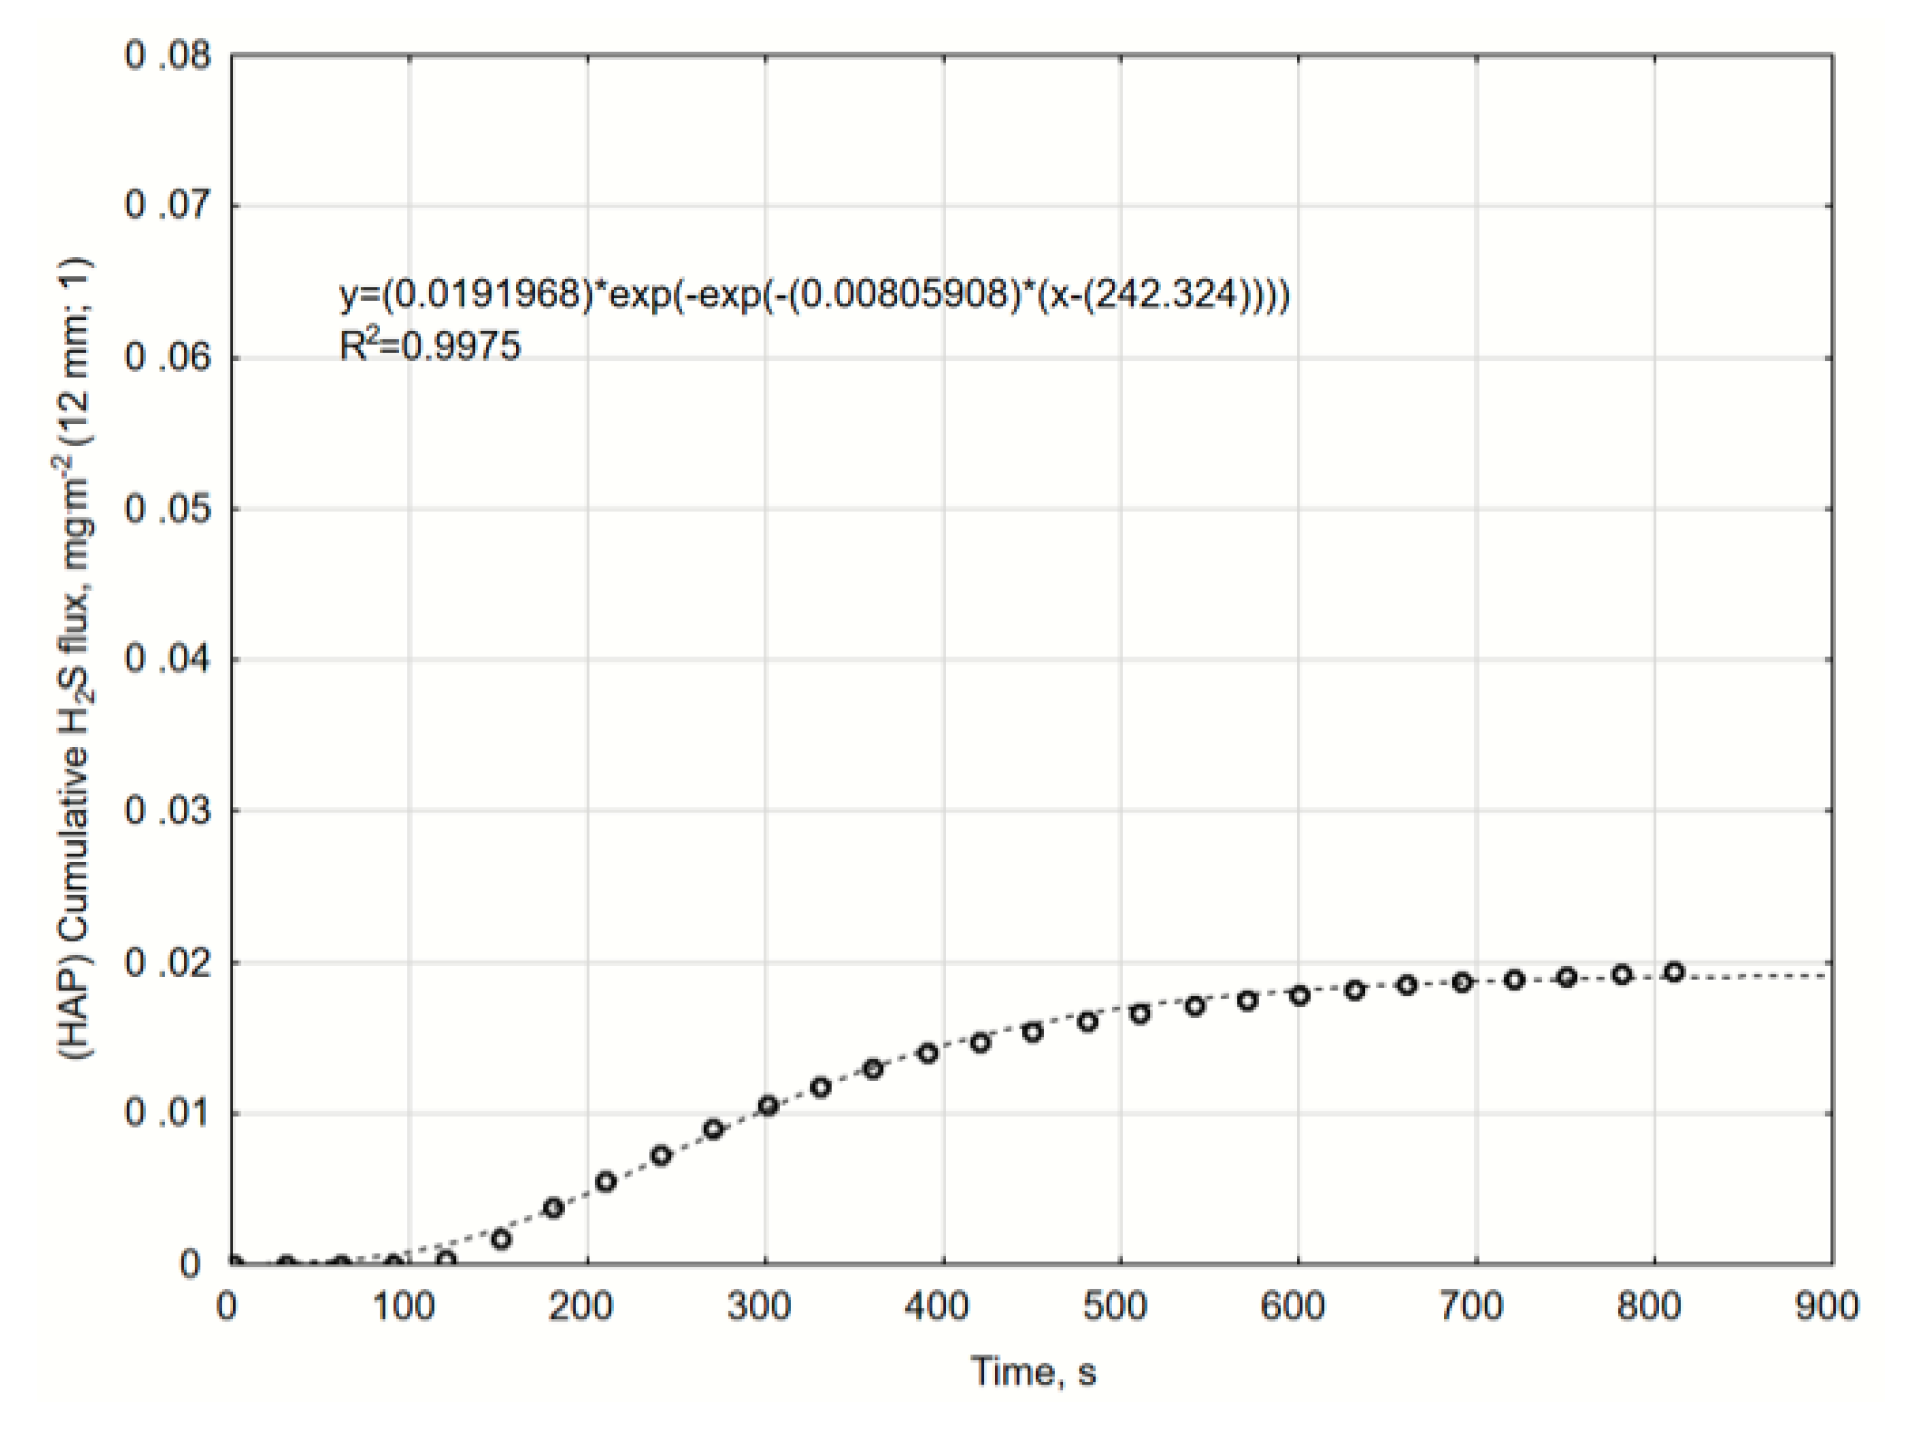
Figure A8.
The cumulative H2S flux. Variant with 12 mm HAP biochar layer, repetition 1. Gompertz equation parameters and R2 determination coefficient.
Figure A8.
The cumulative H2S flux. Variant with 12 mm HAP biochar layer, repetition 1. Gompertz equation parameters and R2 determination coefficient.
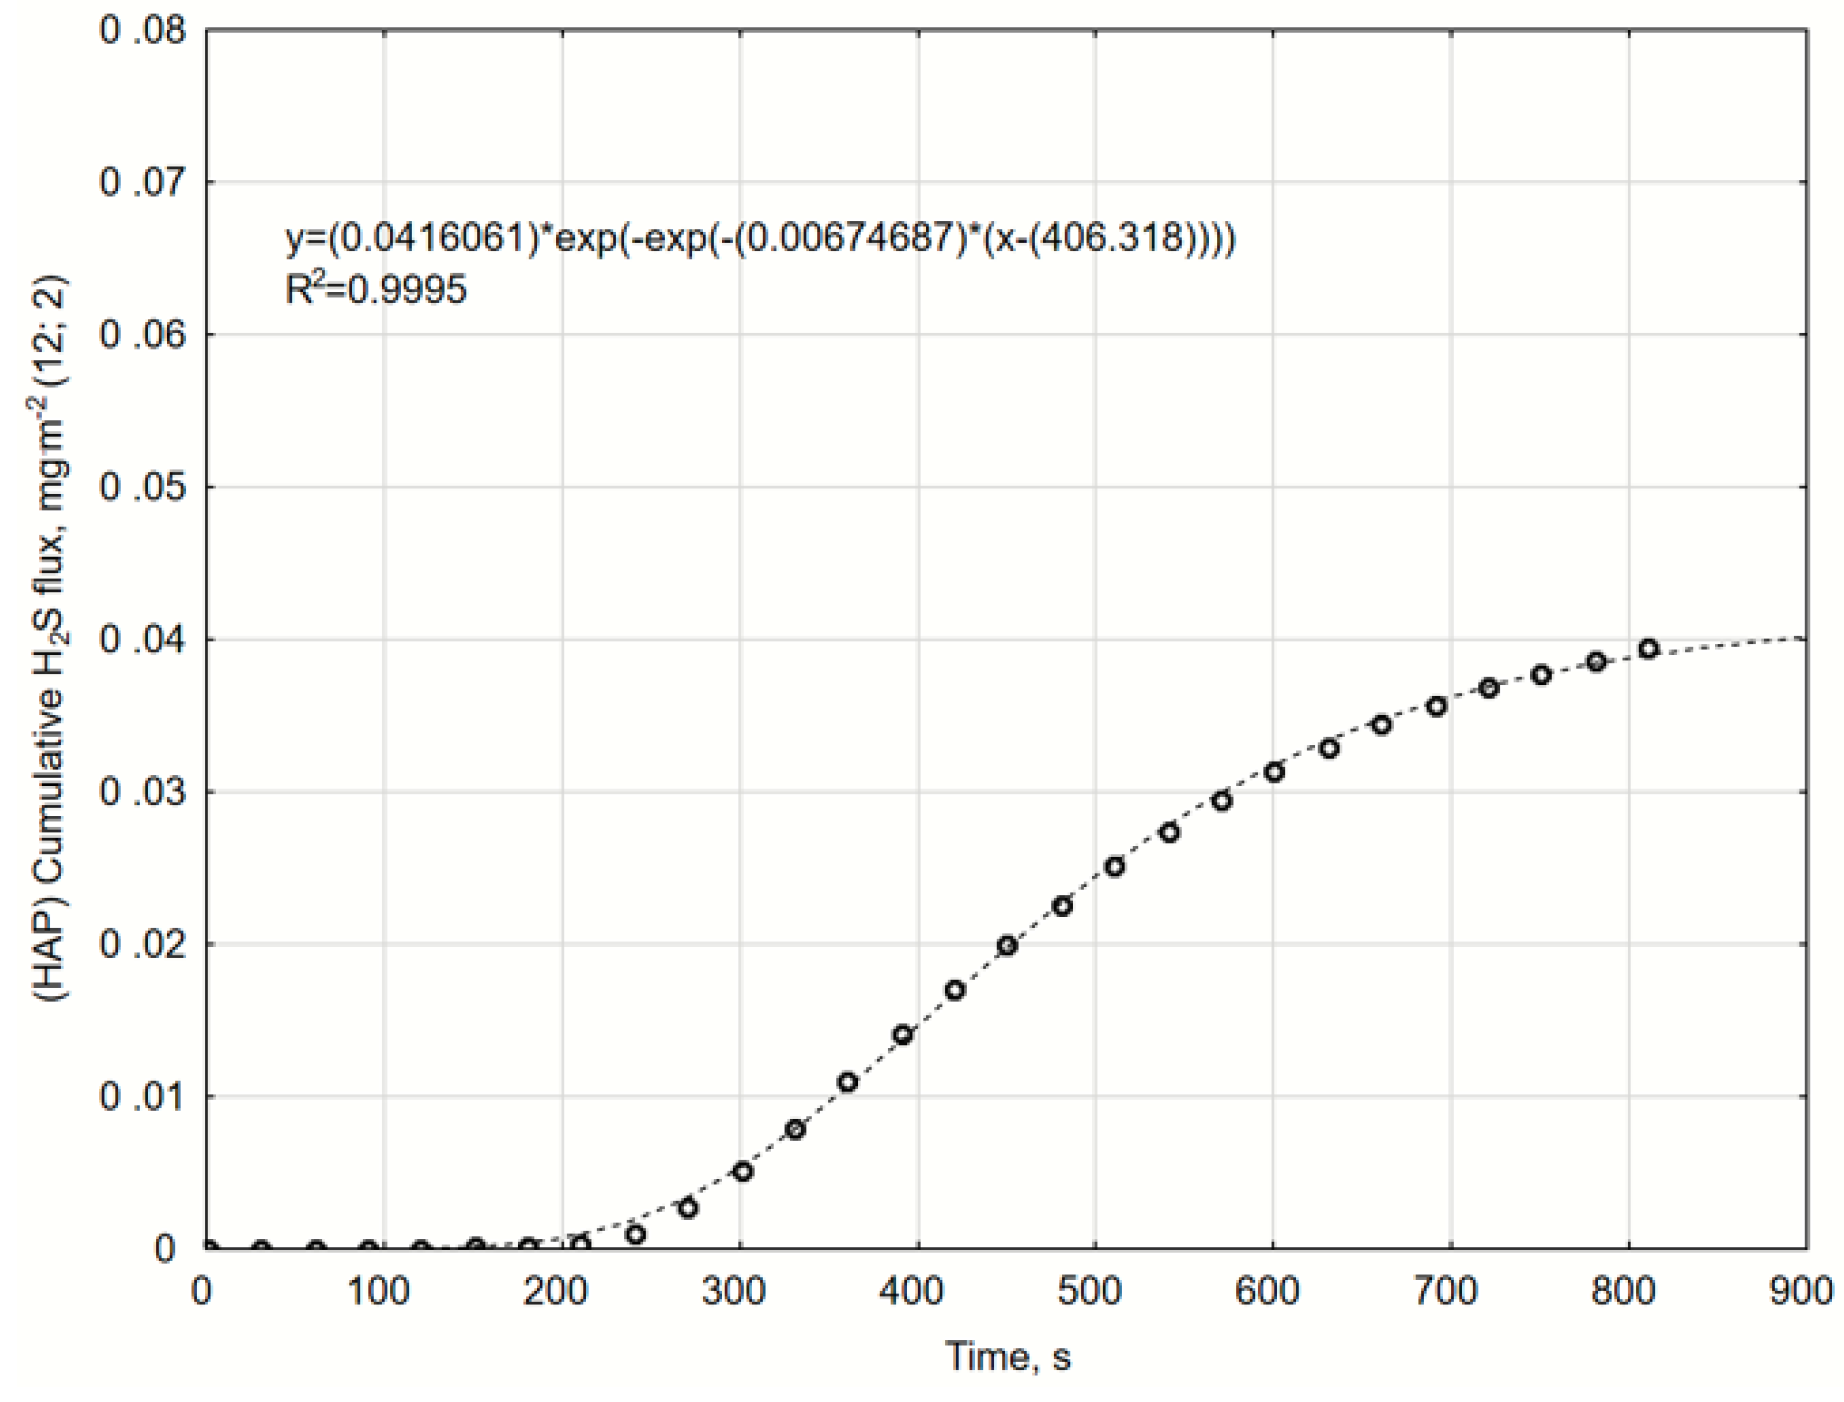
Figure A9.
The cumulative H2S flux. Variant with 12 mm HAP biochar layer, repetition 2. Gompertz equation parameters and R2 determination coefficient.
Figure A9.
The cumulative H2S flux. Variant with 12 mm HAP biochar layer, repetition 2. Gompertz equation parameters and R2 determination coefficient.
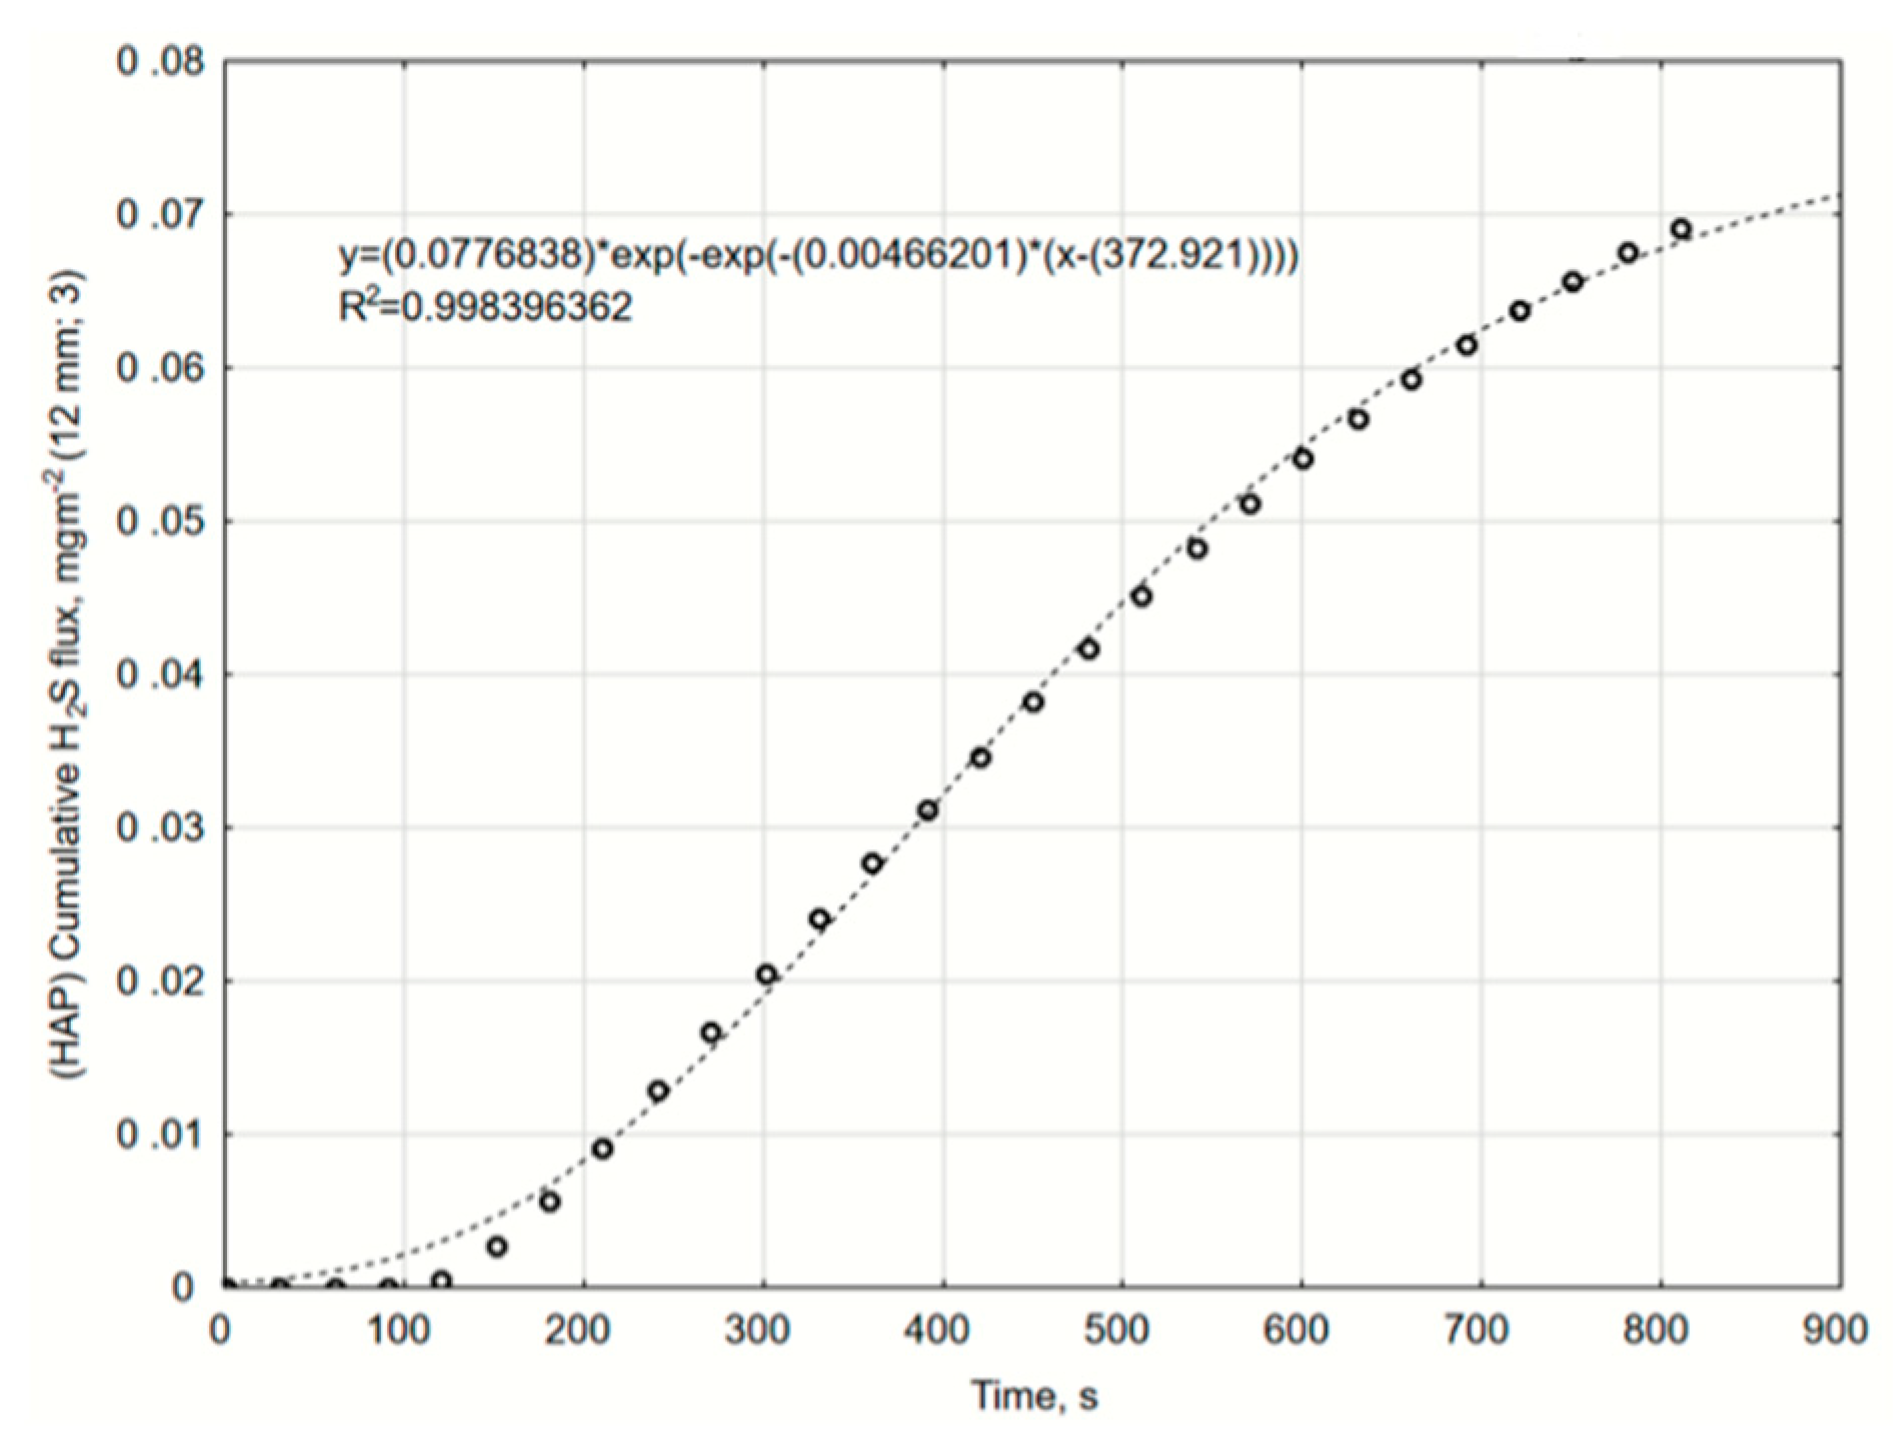
Figure A10.
The cumulative H2S flux. Variant with 12 mm HAP biochar layer, repetition 3. Gompertz equation parameters and R2 determination coefficient.
Figure A10.
The cumulative H2S flux. Variant with 12 mm HAP biochar layer, repetition 3. Gompertz equation parameters and R2 determination coefficient.
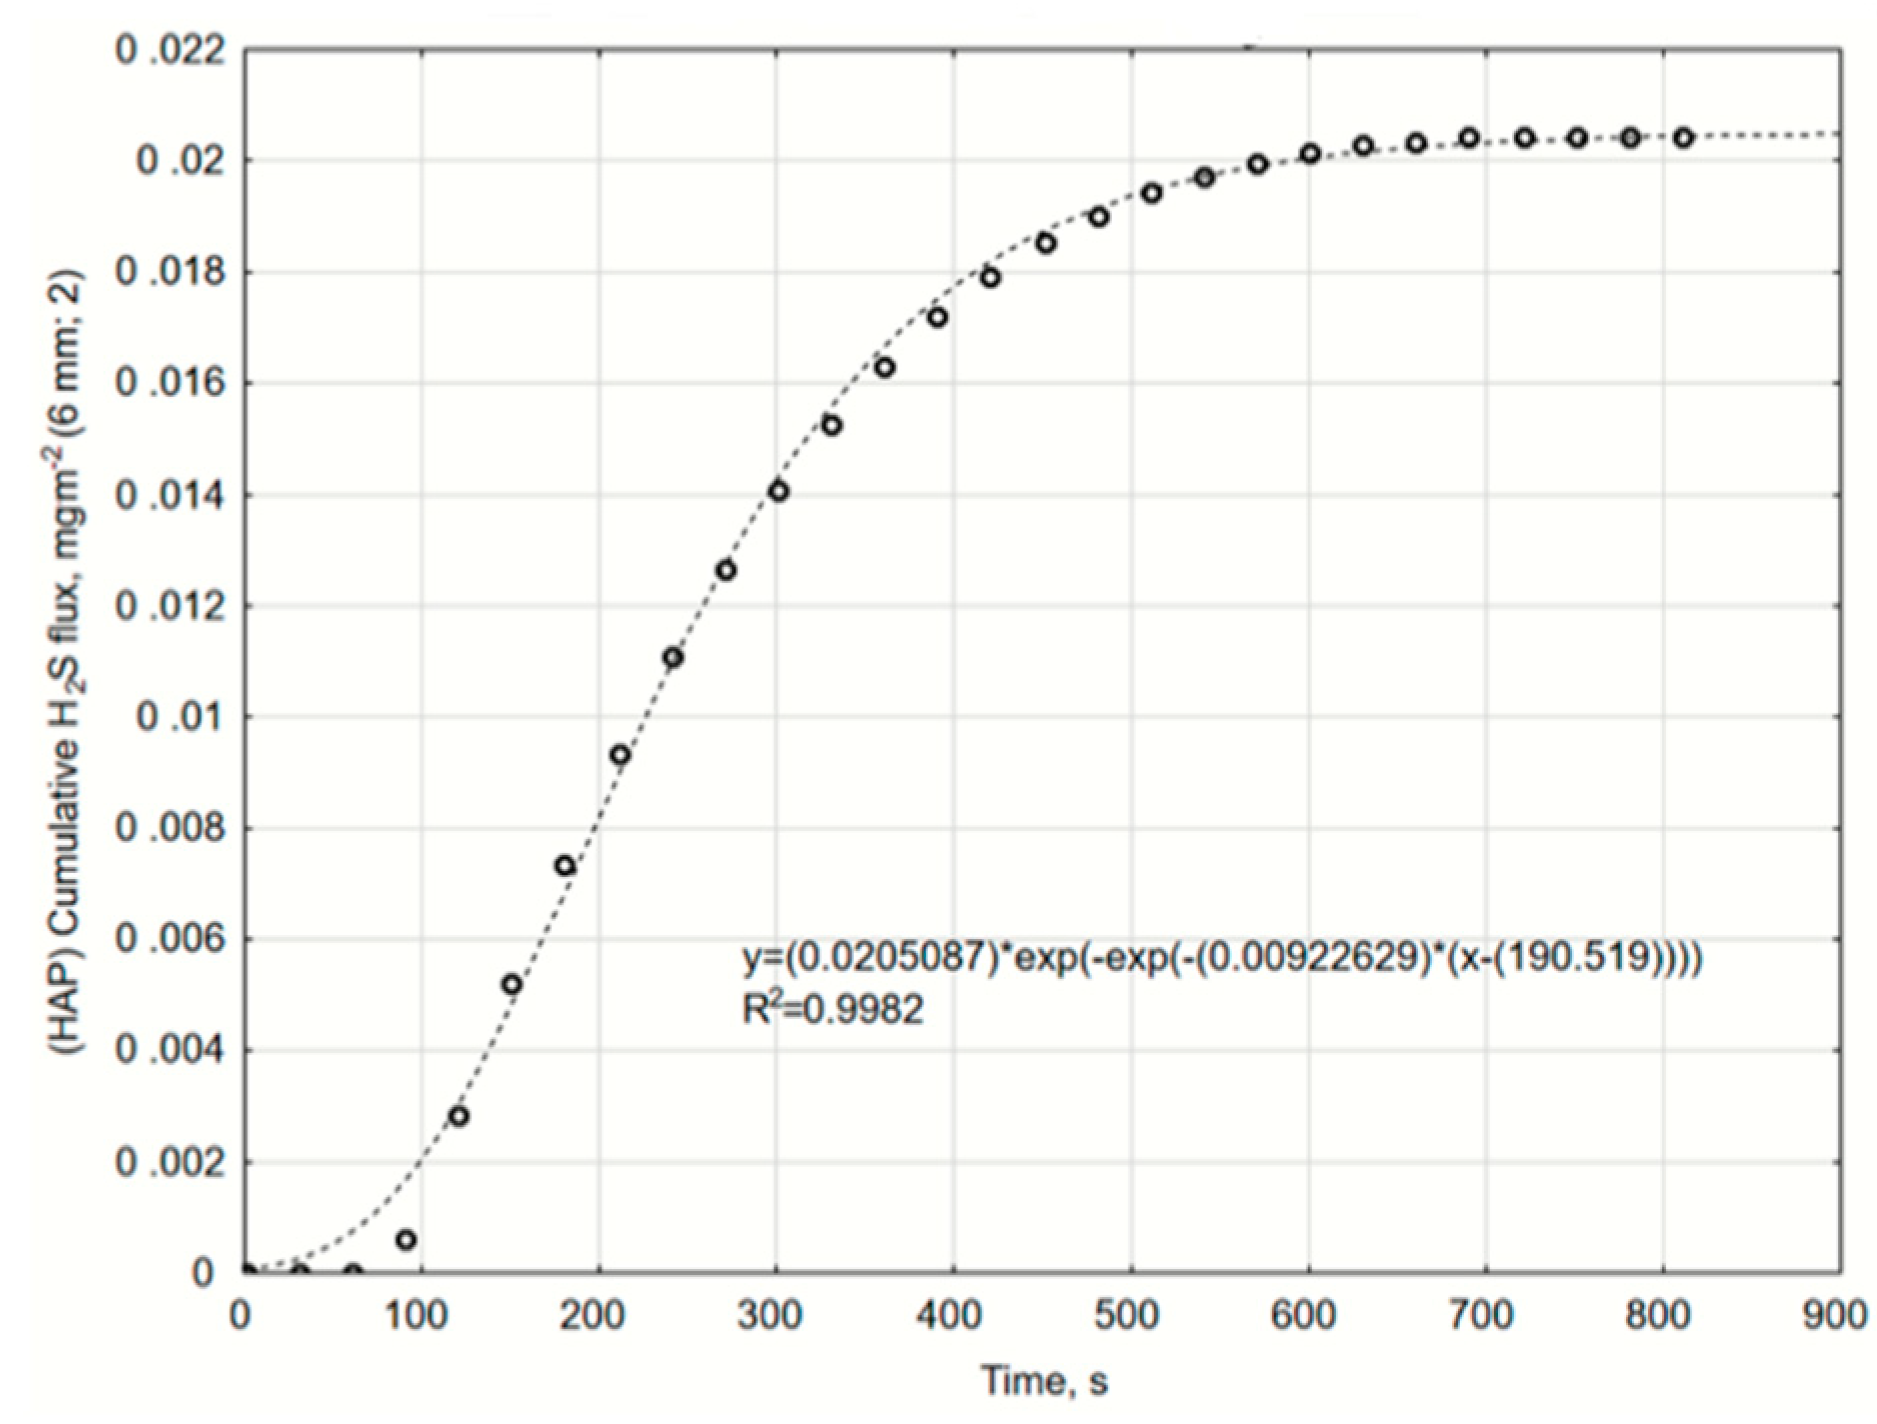
Figure A11.
The cumulative H2S flux. Variant with 6 mm HAP biochar layer, repetition 1. Gompertz equation parameters and R2 determination coefficient.
Figure A11.
The cumulative H2S flux. Variant with 6 mm HAP biochar layer, repetition 1. Gompertz equation parameters and R2 determination coefficient.
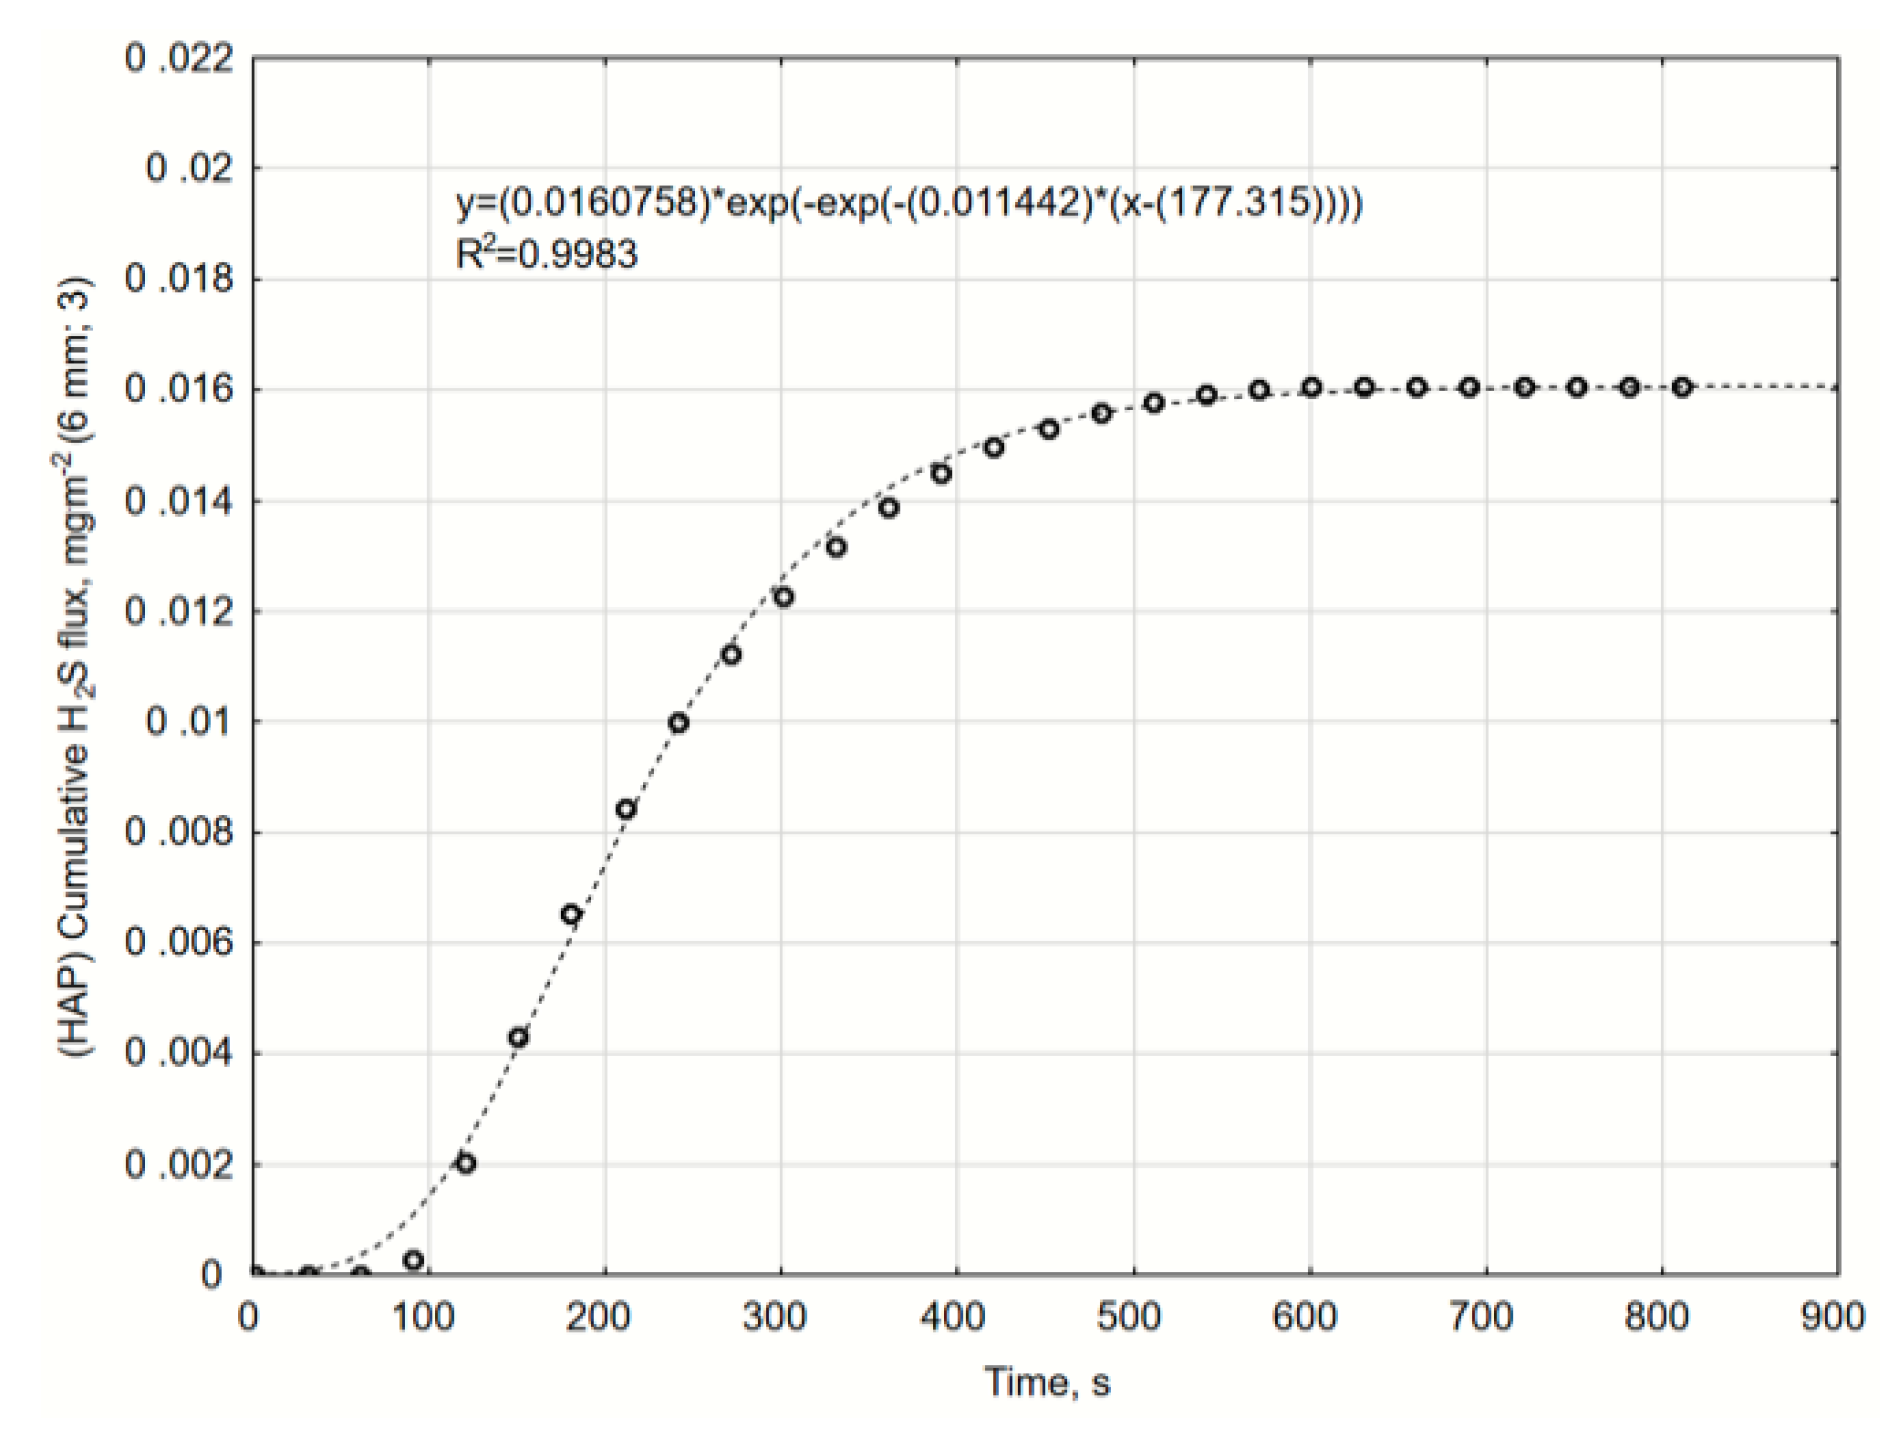
Figure A12.
The cumulative H2S flux. Variant with 6 mm HAP biochar layer, repetition 2. Gompertz equation parameters and R2 determination coefficient.
Figure A12.
The cumulative H2S flux. Variant with 6 mm HAP biochar layer, repetition 2. Gompertz equation parameters and R2 determination coefficient.
Figure A13.
The cumulative H2S flux. Variant with 6 mm HAP biochar layer, repetition 3. Gompertz equation parameters and R2 determination coefficient.
Figure A13.
The cumulative H2S flux. Variant with 6 mm HAP biochar layer, repetition 3. Gompertz equation parameters and R2 determination coefficient.
Figure A14.
The cumulative H2S flux. Variant with no RO biochar, repetition 1. Gompertz equation parameters and R2 determination coefficient.
Figure A14.
The cumulative H2S flux. Variant with no RO biochar, repetition 1. Gompertz equation parameters and R2 determination coefficient.
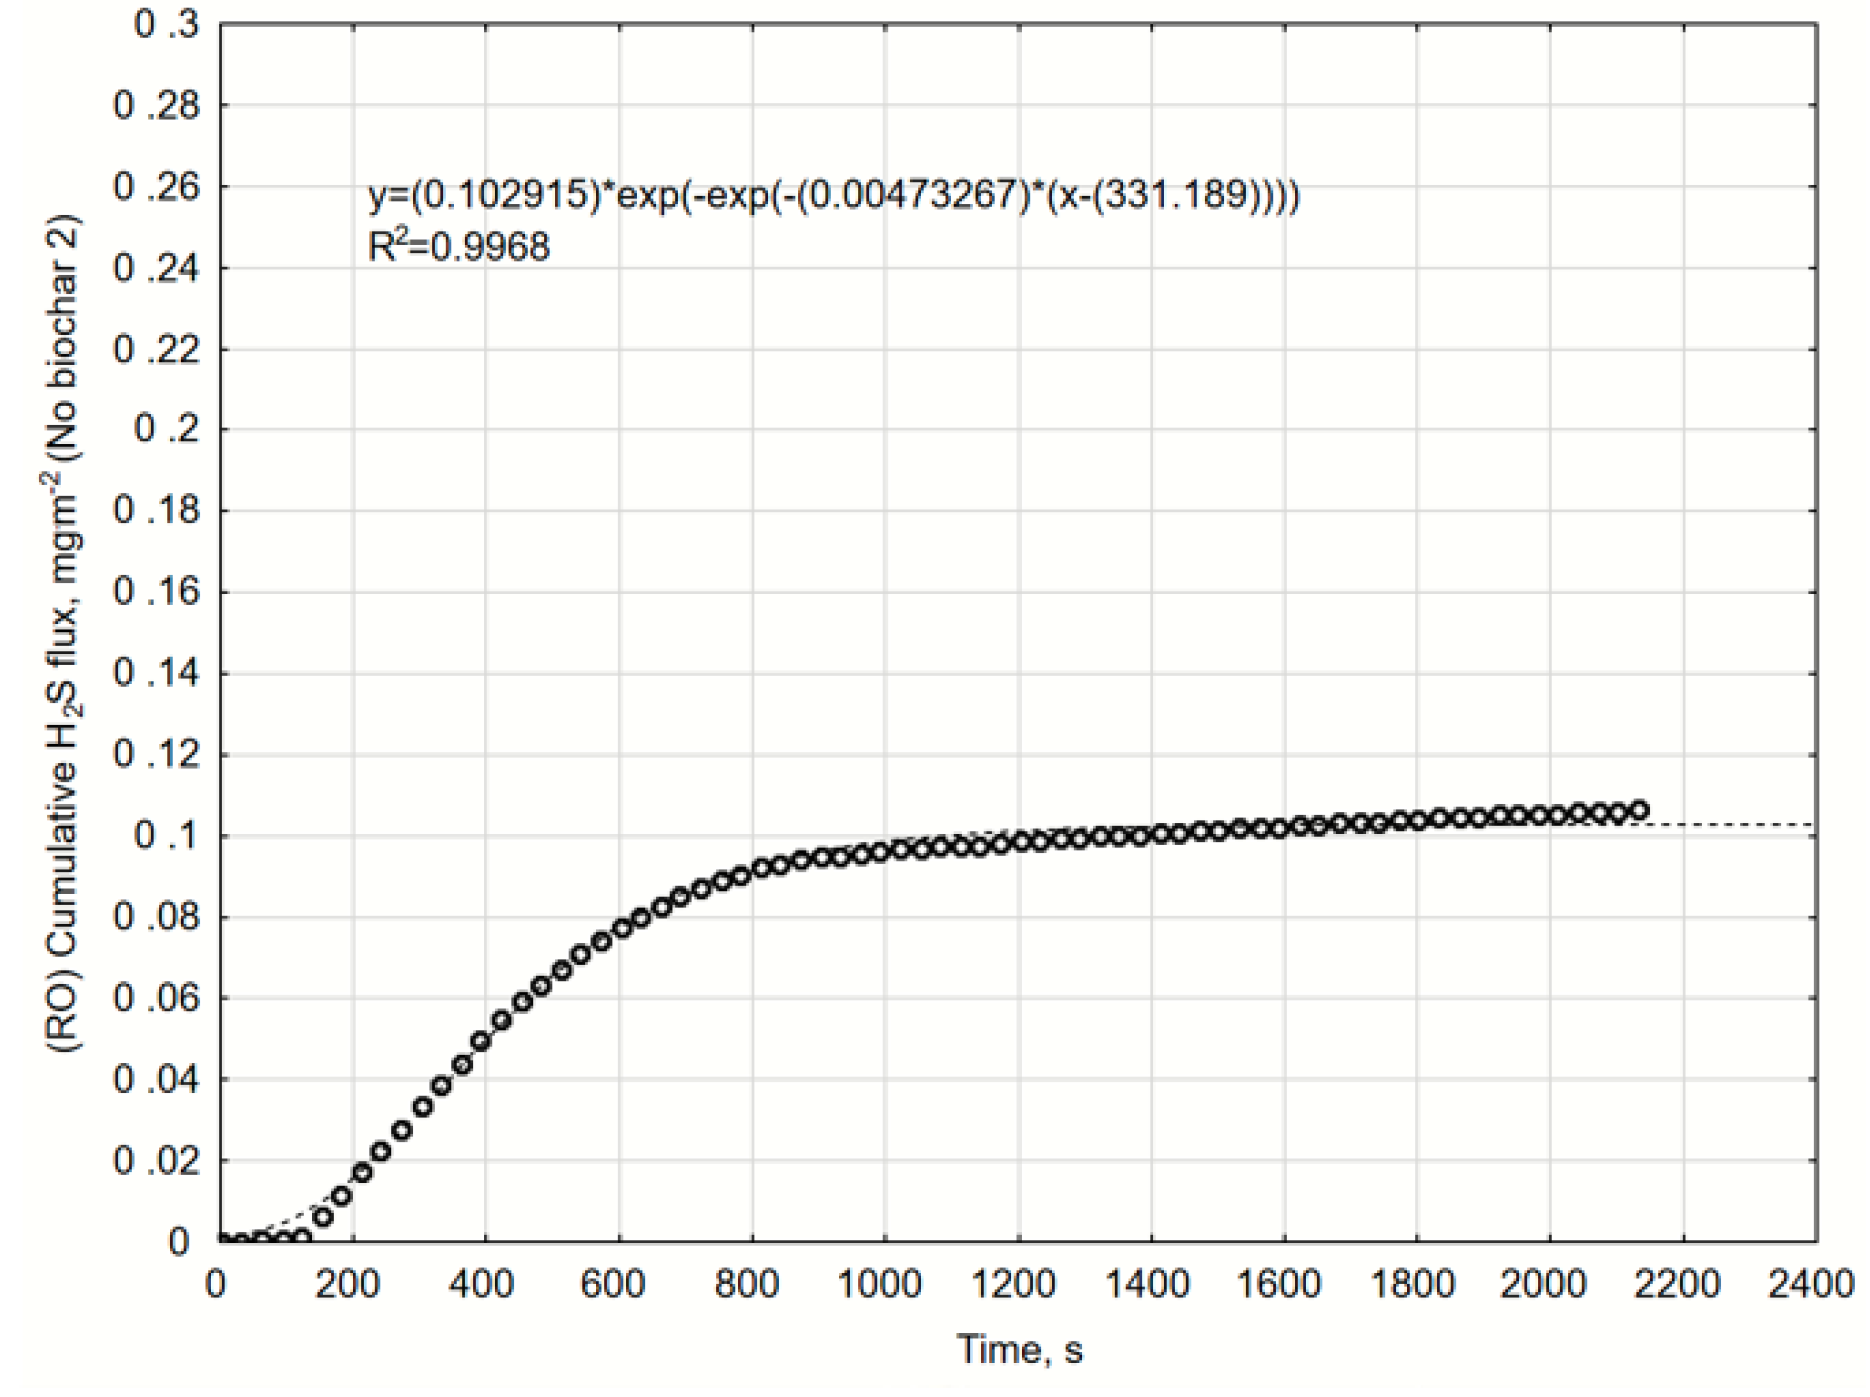
Figure A15.
The cumulative H2S flux. Variant with no RO biochar, repetition 2. Gompertz equation parameters and R2 determination coefficient.
Figure A15.
The cumulative H2S flux. Variant with no RO biochar, repetition 2. Gompertz equation parameters and R2 determination coefficient.
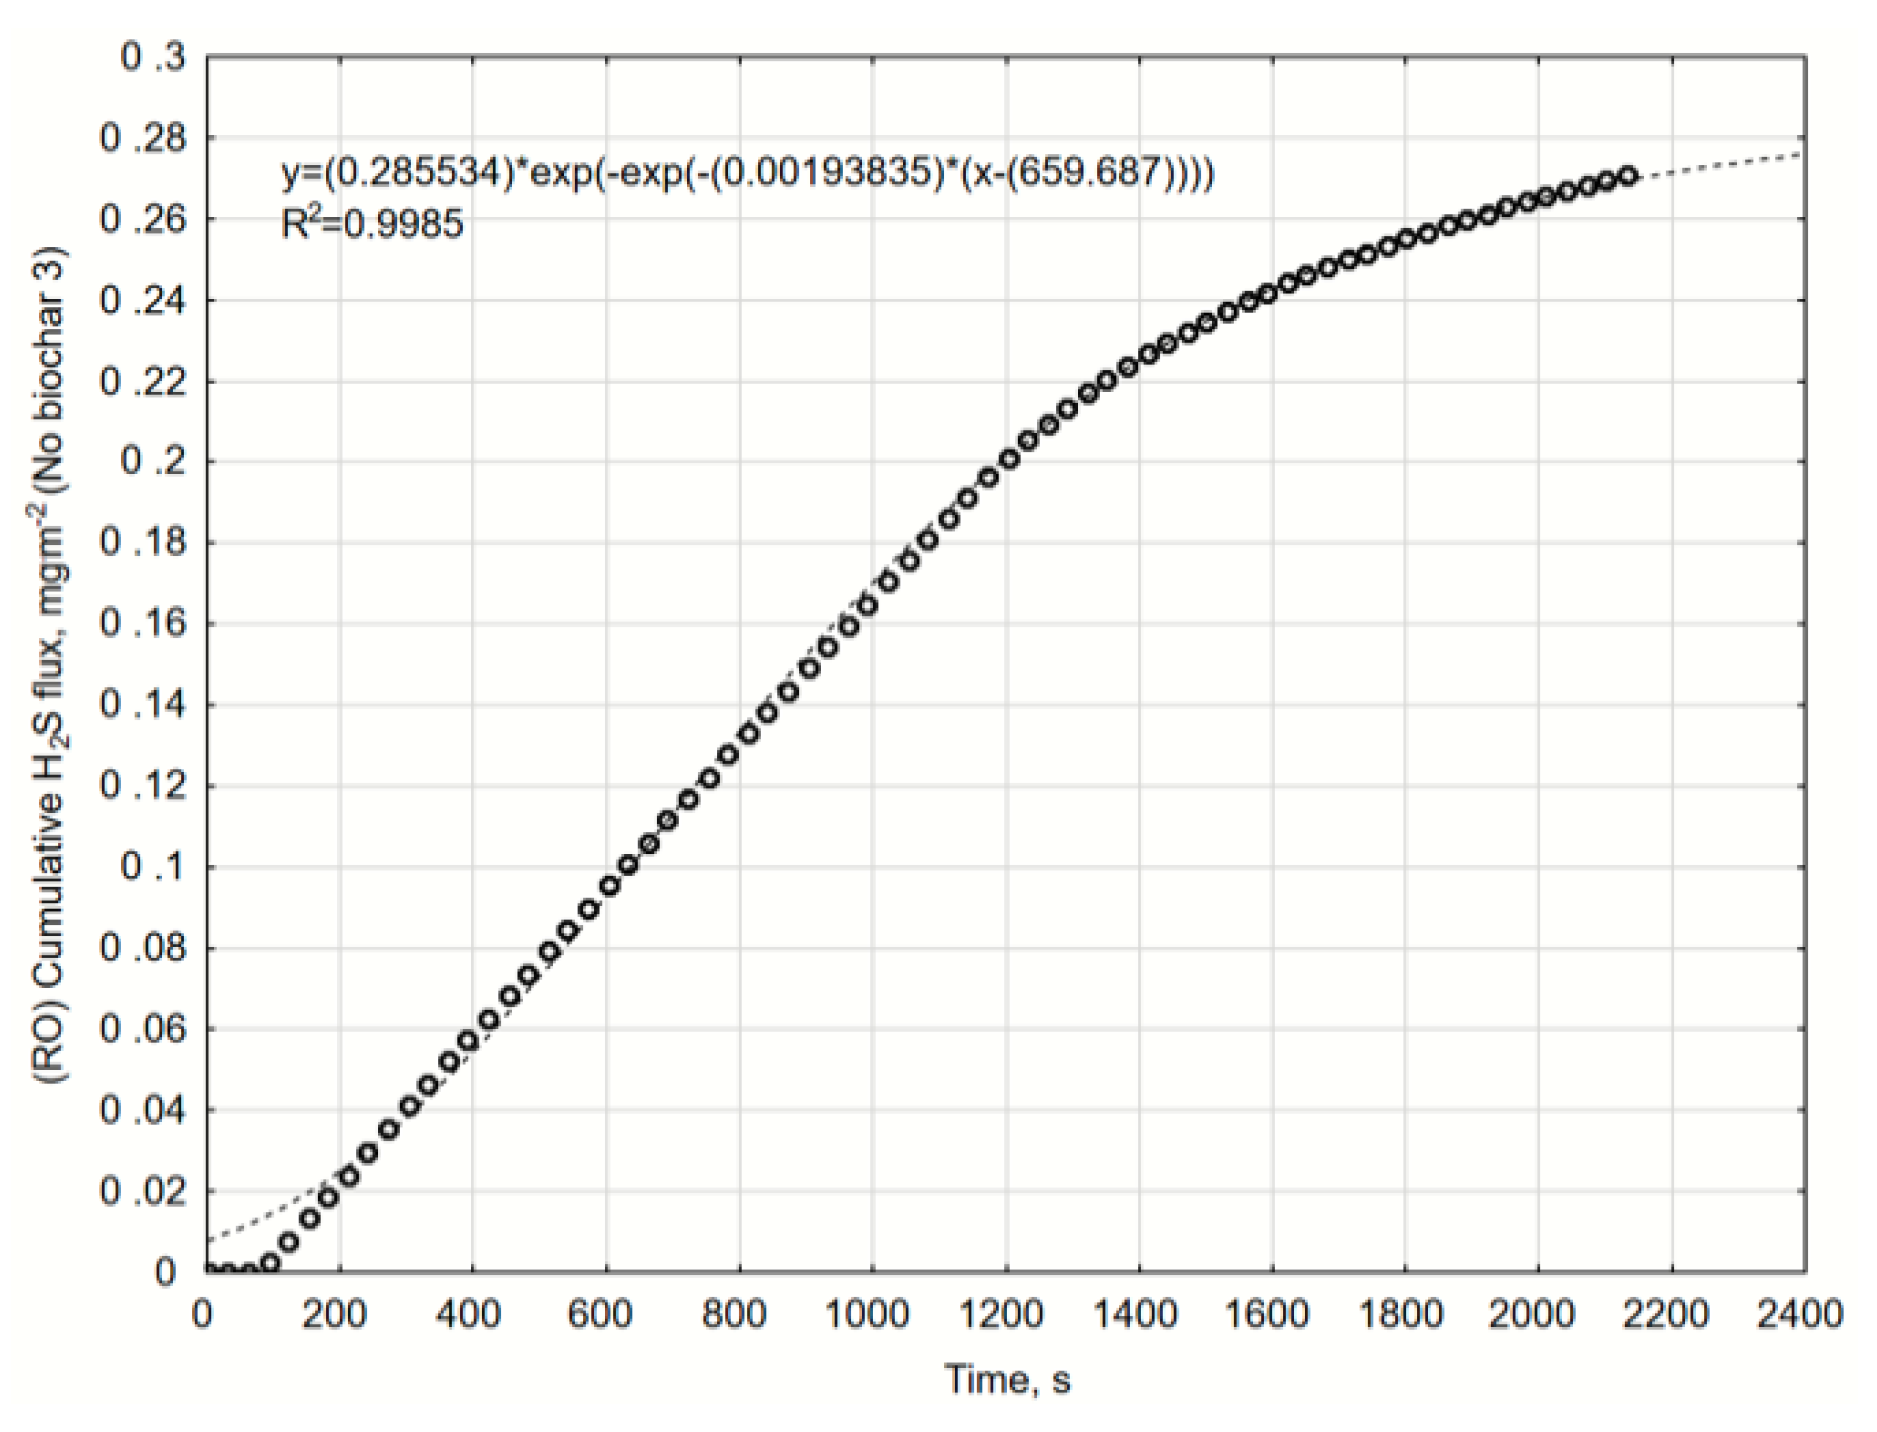
Figure A16.
The cumulative H2S flux. Variant with no RO biochar, repetition 3. Gompertz equation parameters and R2 determination coefficient.
Figure A16.
The cumulative H2S flux. Variant with no RO biochar, repetition 3. Gompertz equation parameters and R2 determination coefficient.
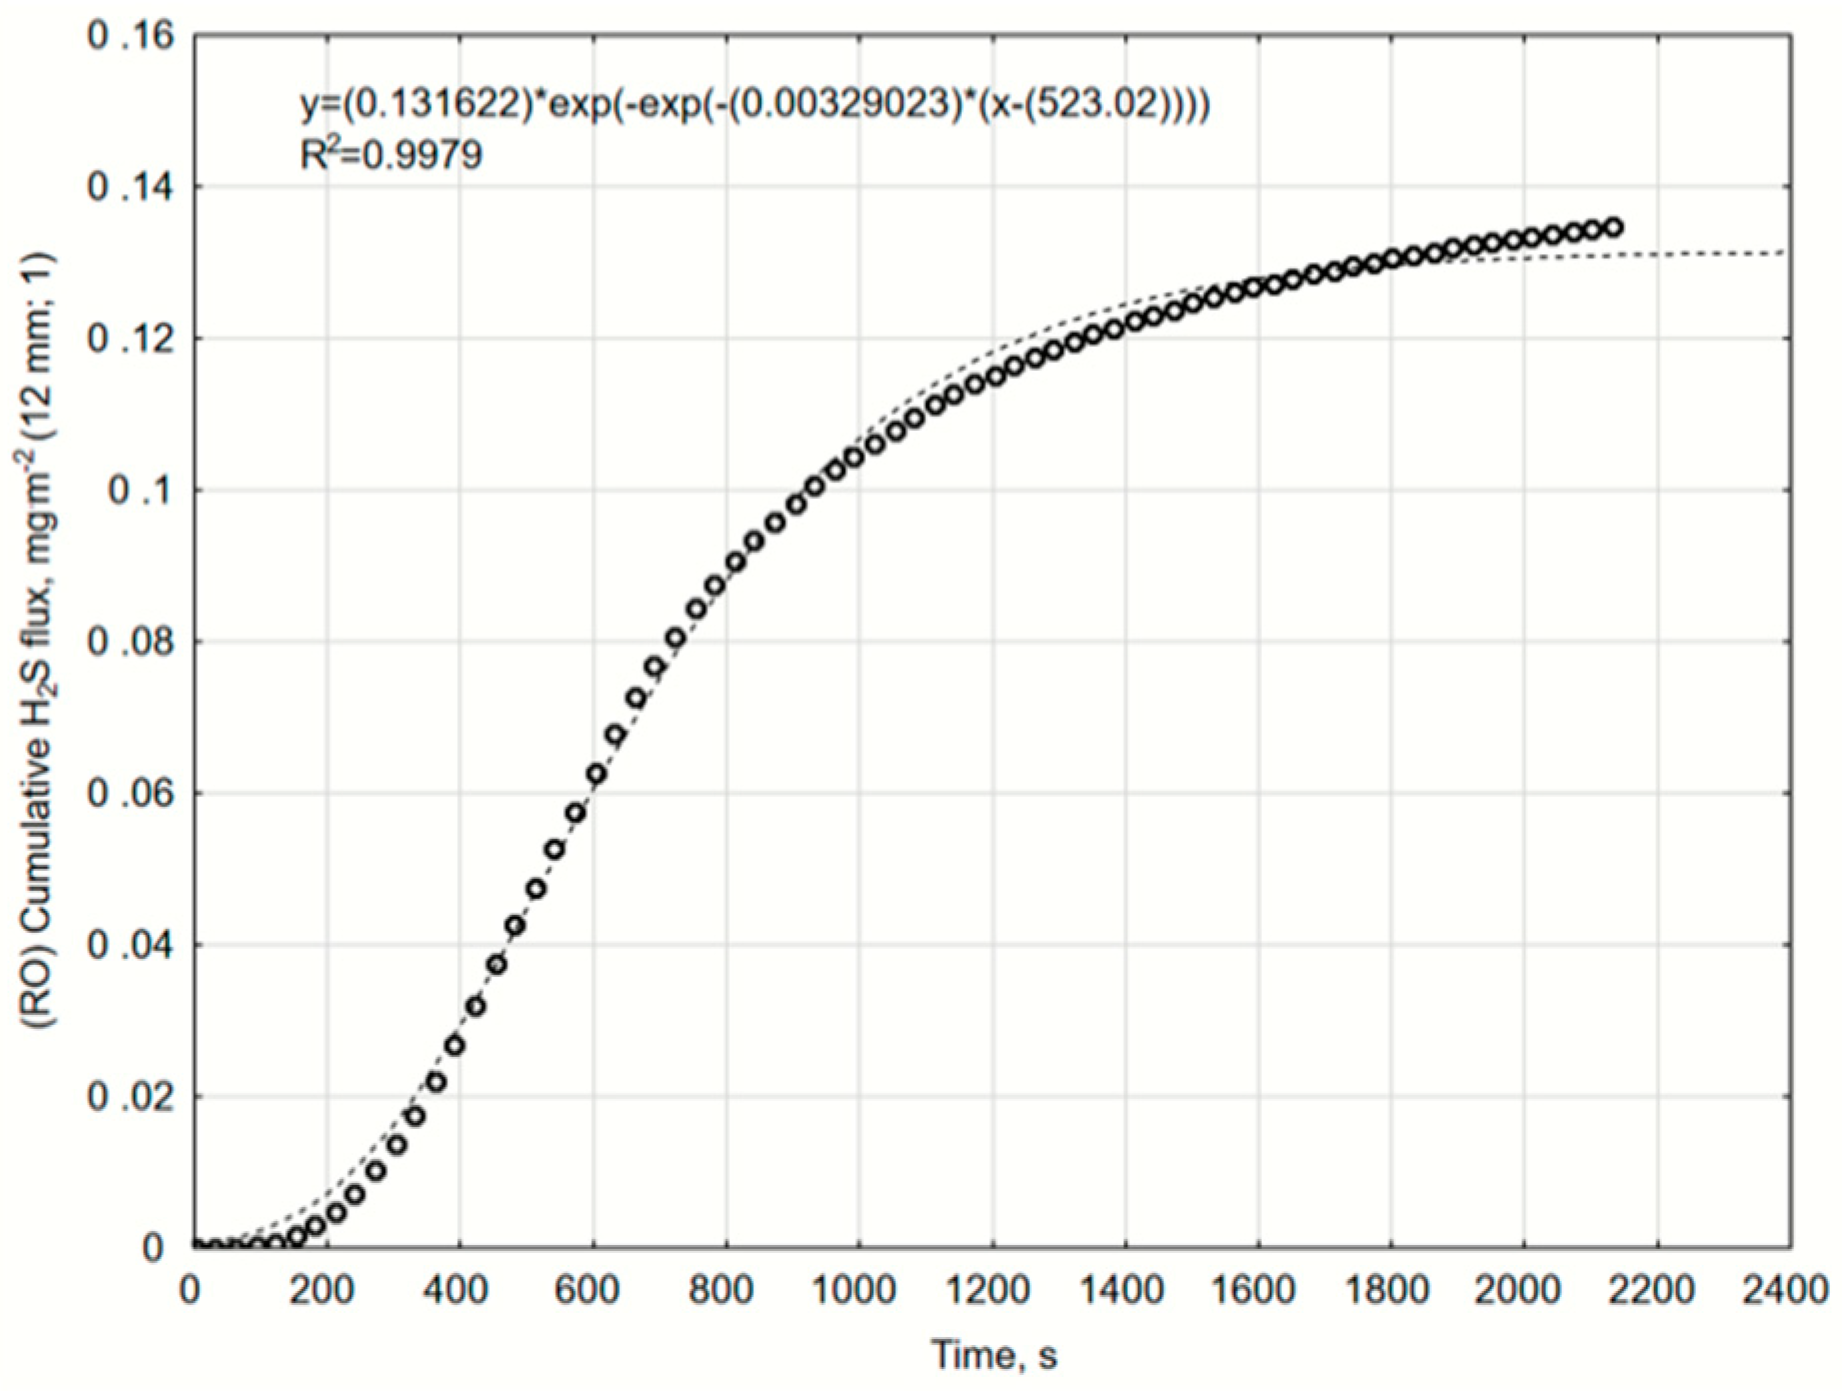
Figure A17.
The cumulative H2S flux. Variant with 12 mm RO biochar layer, repetition 1. Gompertz equation parameters and R2 determination coefficient.
Figure A17.
The cumulative H2S flux. Variant with 12 mm RO biochar layer, repetition 1. Gompertz equation parameters and R2 determination coefficient.
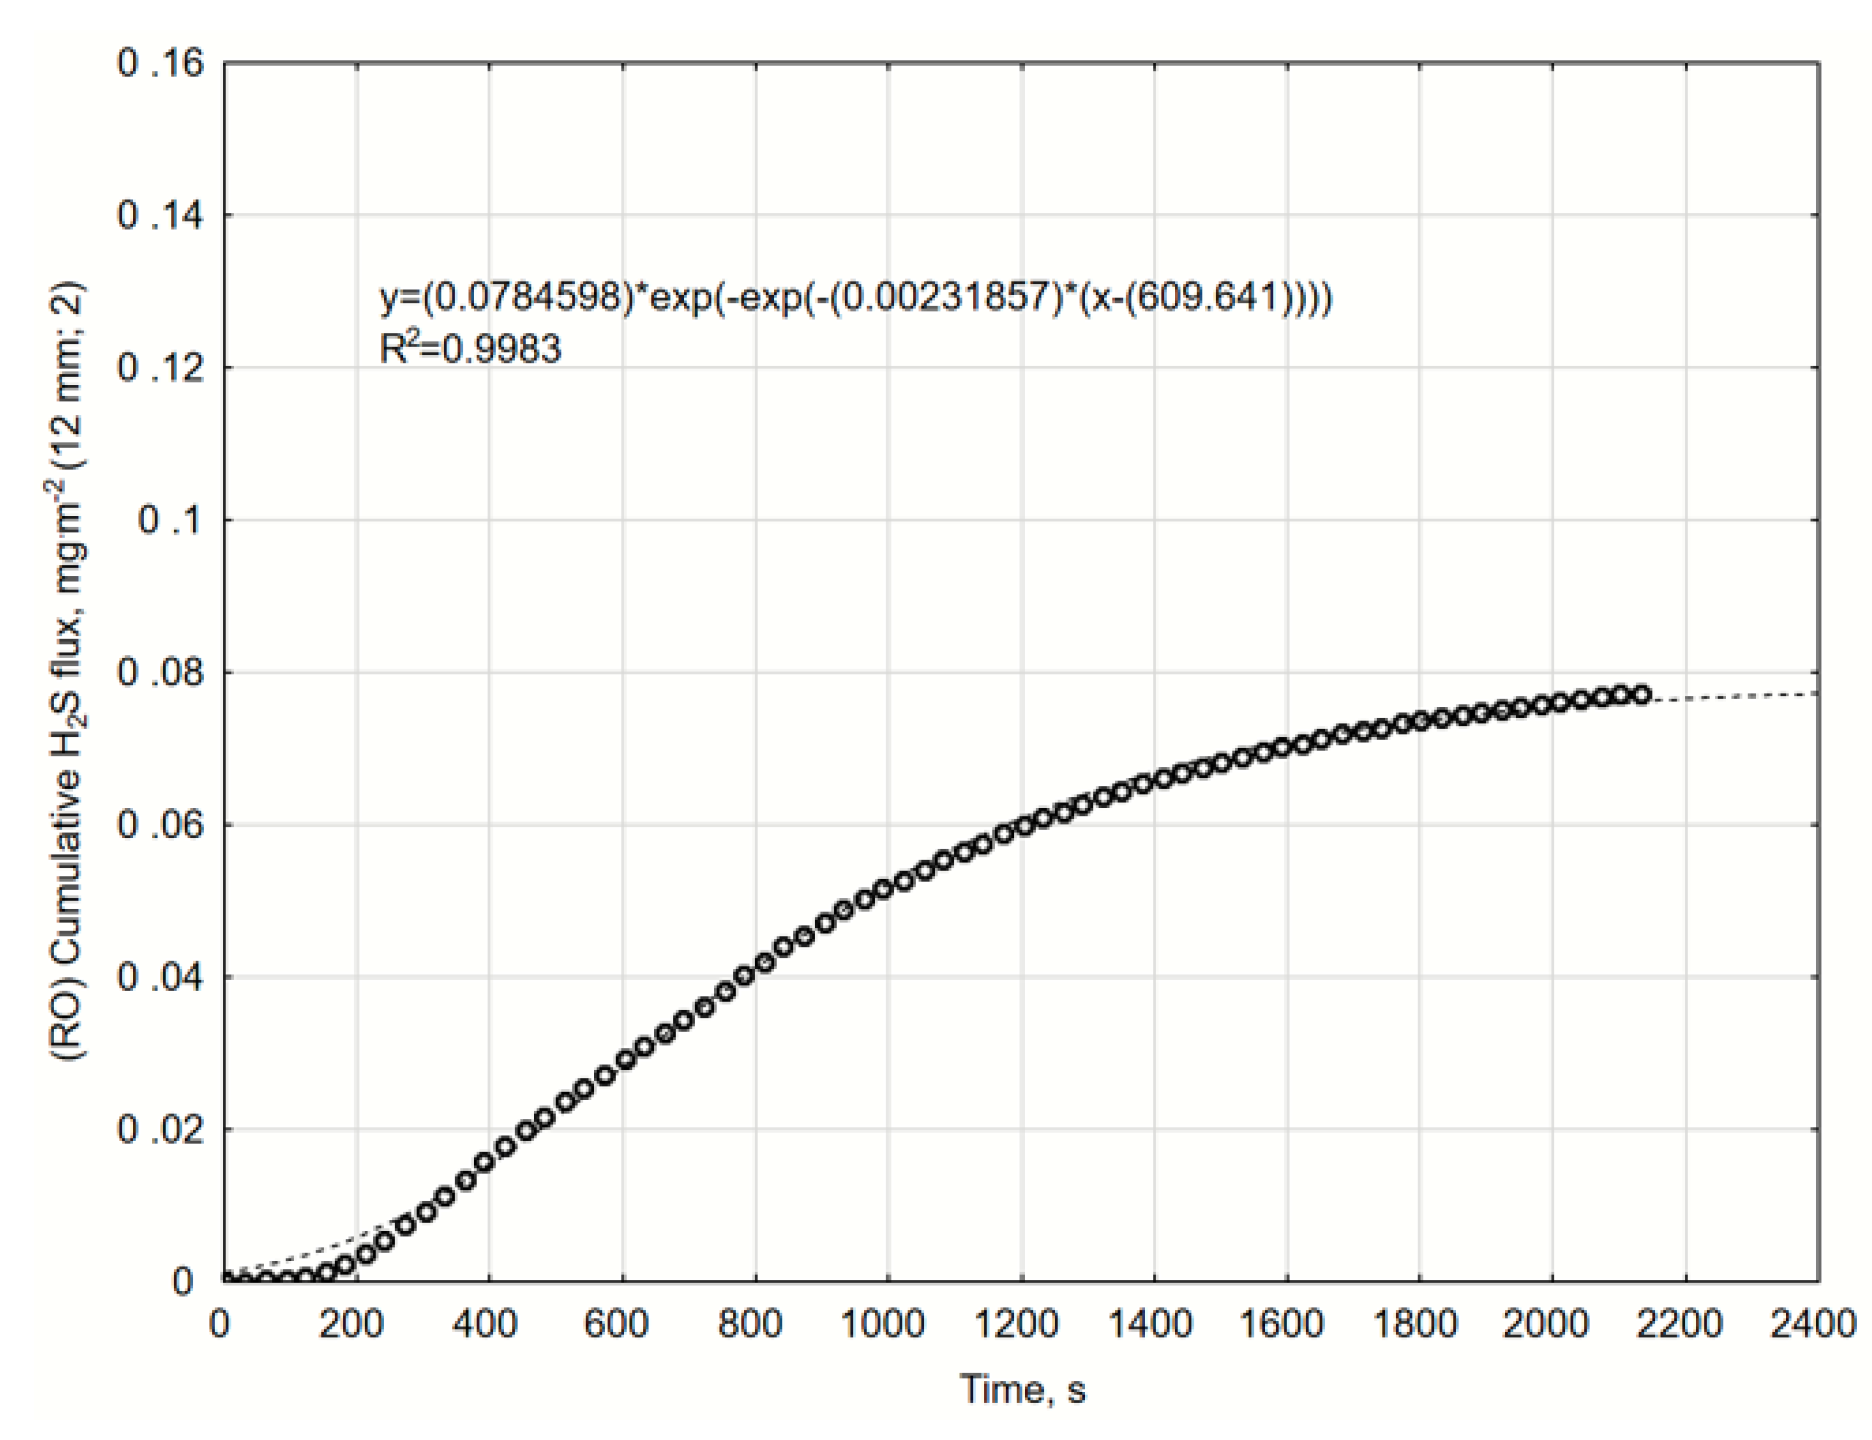
Figure A18.
The cumulative H2S flux. Variant with 12 mm RO biochar layer, repetition 2. Gompertz equation parameters and R2 determination coefficient.
Figure A18.
The cumulative H2S flux. Variant with 12 mm RO biochar layer, repetition 2. Gompertz equation parameters and R2 determination coefficient.
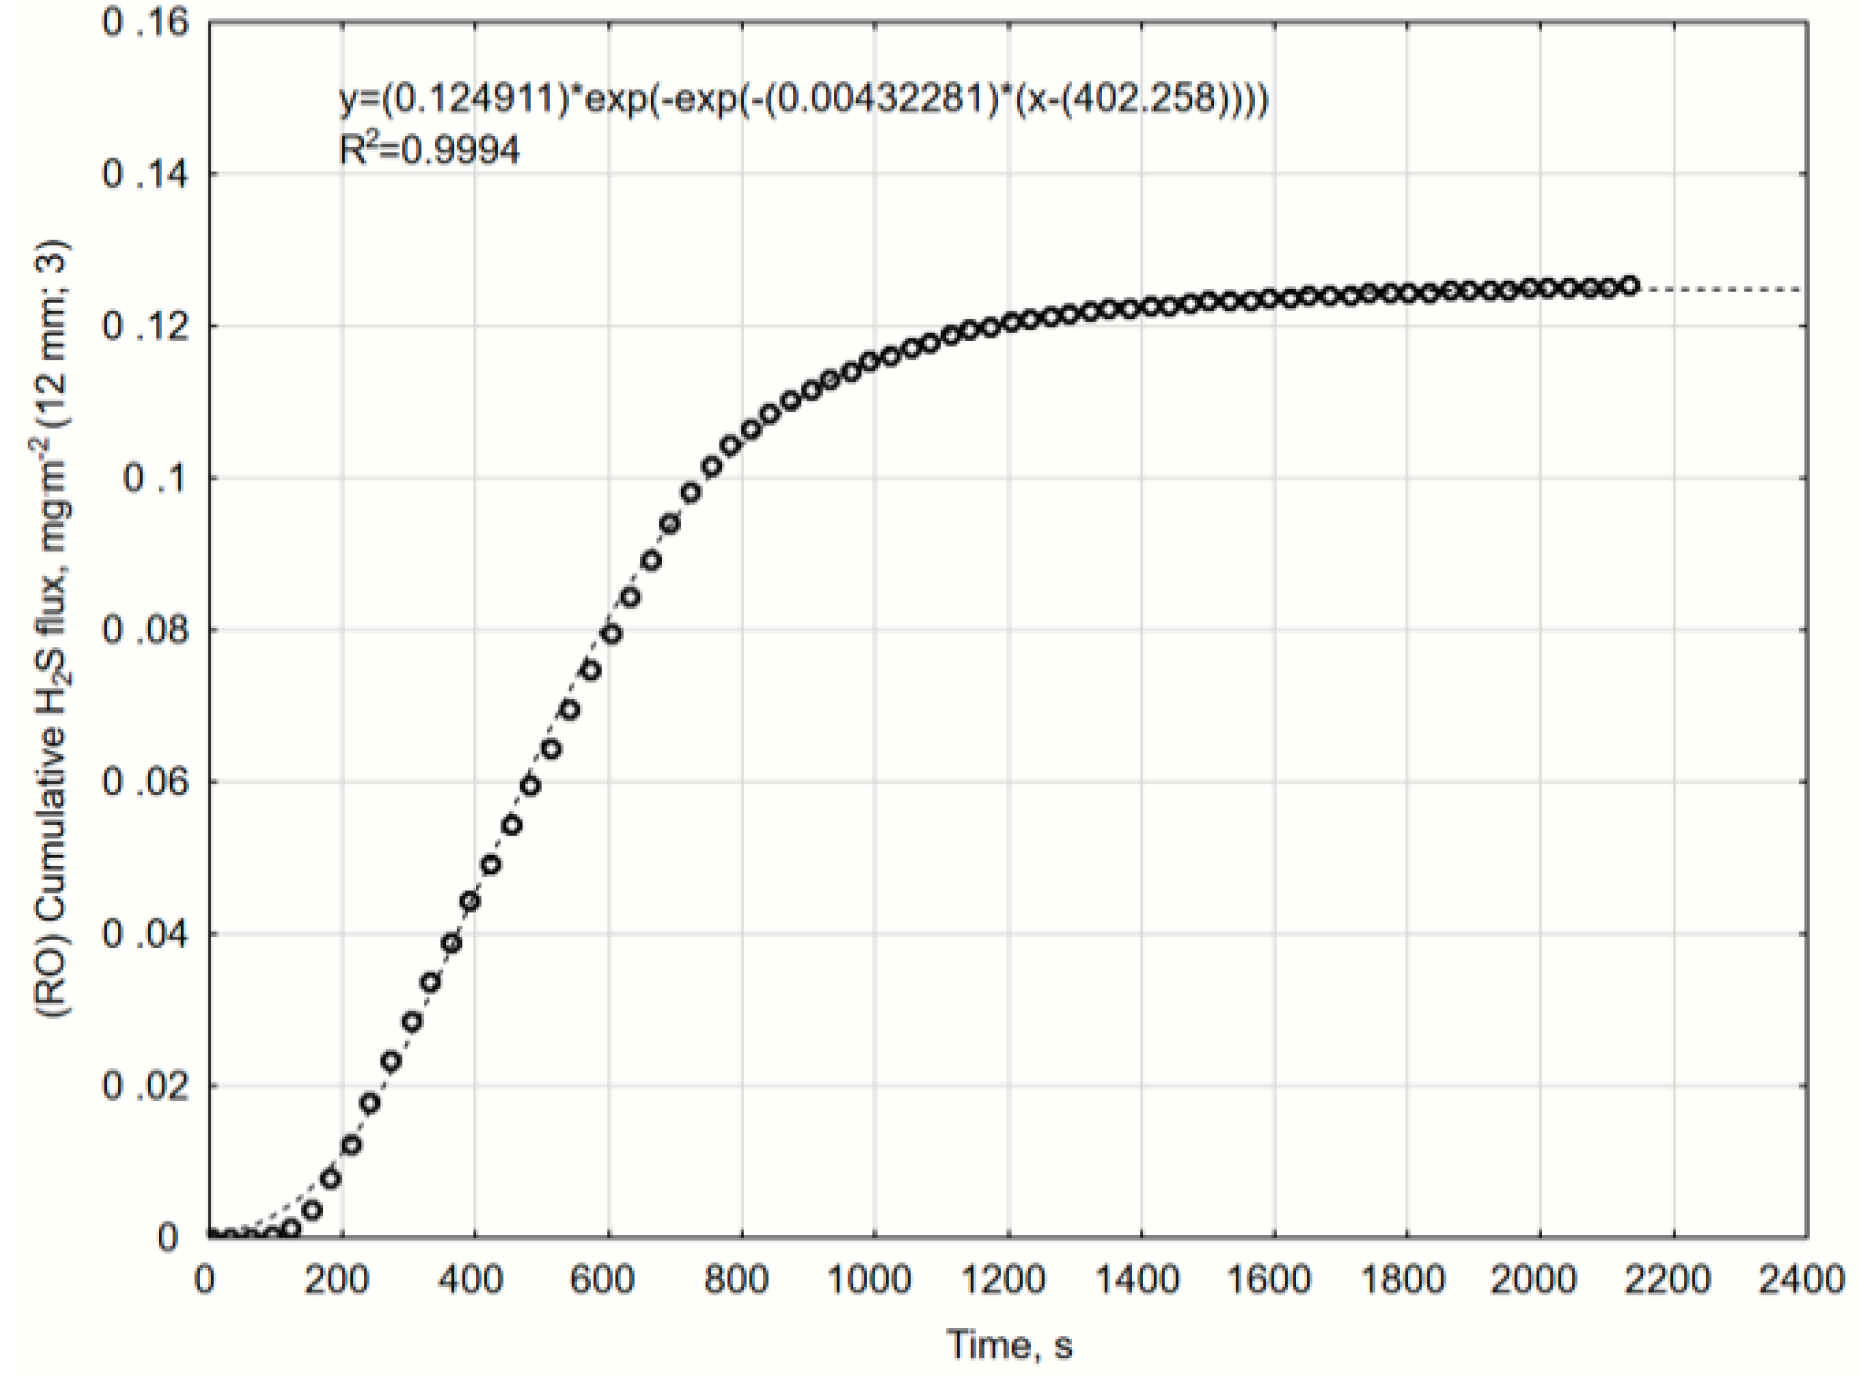
Figure A19.
The cumulative H2S flux. Variant with 12 mm RO biochar layer, repetition 3. Gompertz equation parameters and R2 determination coefficient.
Figure A19.
The cumulative H2S flux. Variant with 12 mm RO biochar layer, repetition 3. Gompertz equation parameters and R2 determination coefficient.
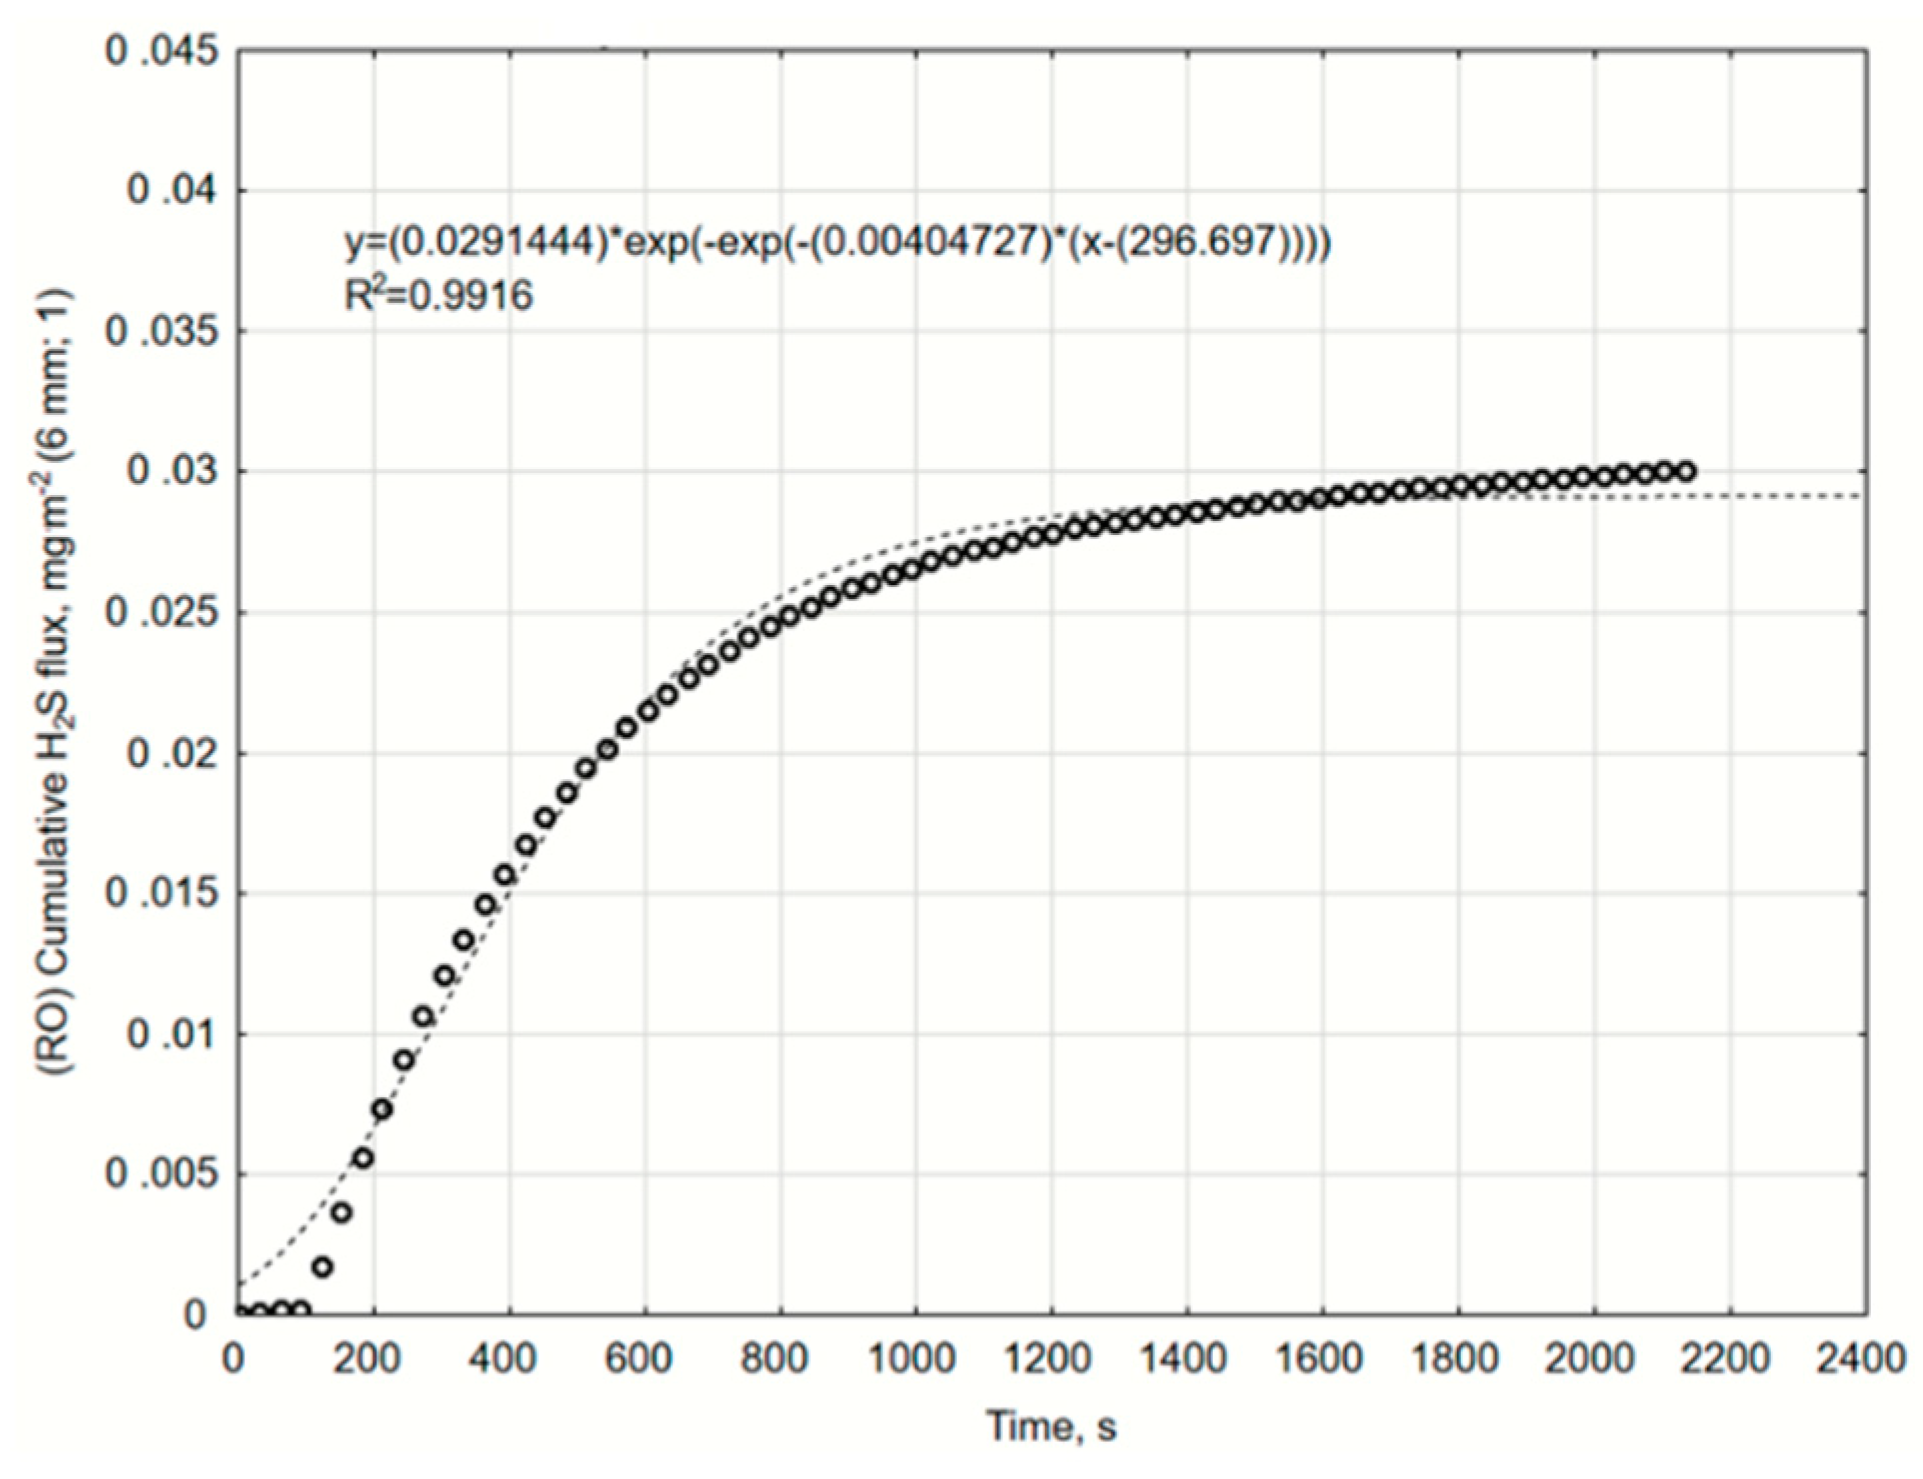
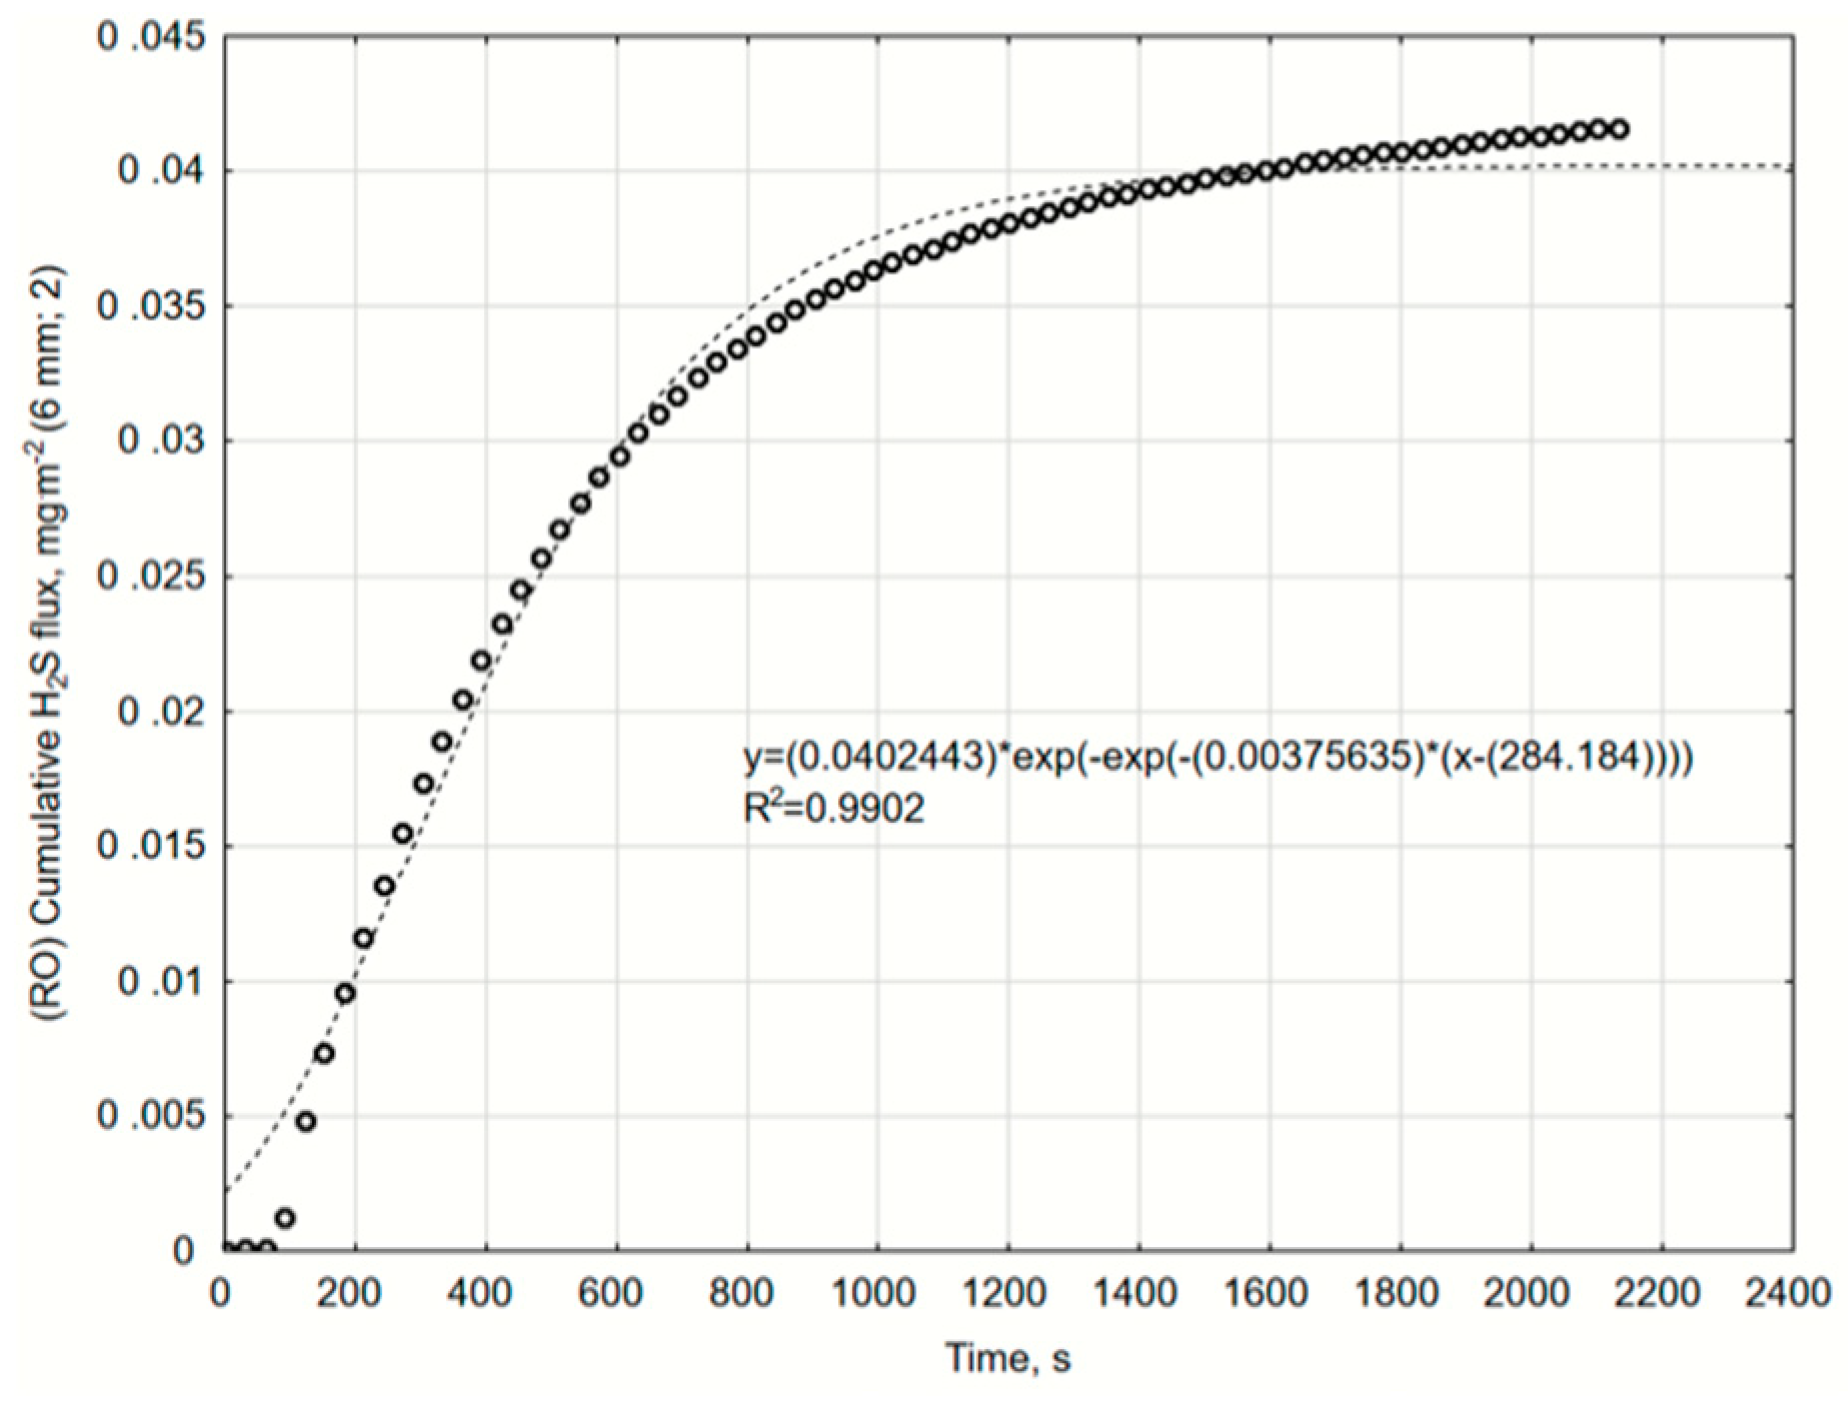
Figure A20.
The cumulative H2S flux. Variant with 6 mm RO biochar layer, repetition 1. Gompertz equation parameters and R2 determination coefficient.
Figure A20.
The cumulative H2S flux. Variant with 6 mm RO biochar layer, repetition 1. Gompertz equation parameters and R2 determination coefficient.
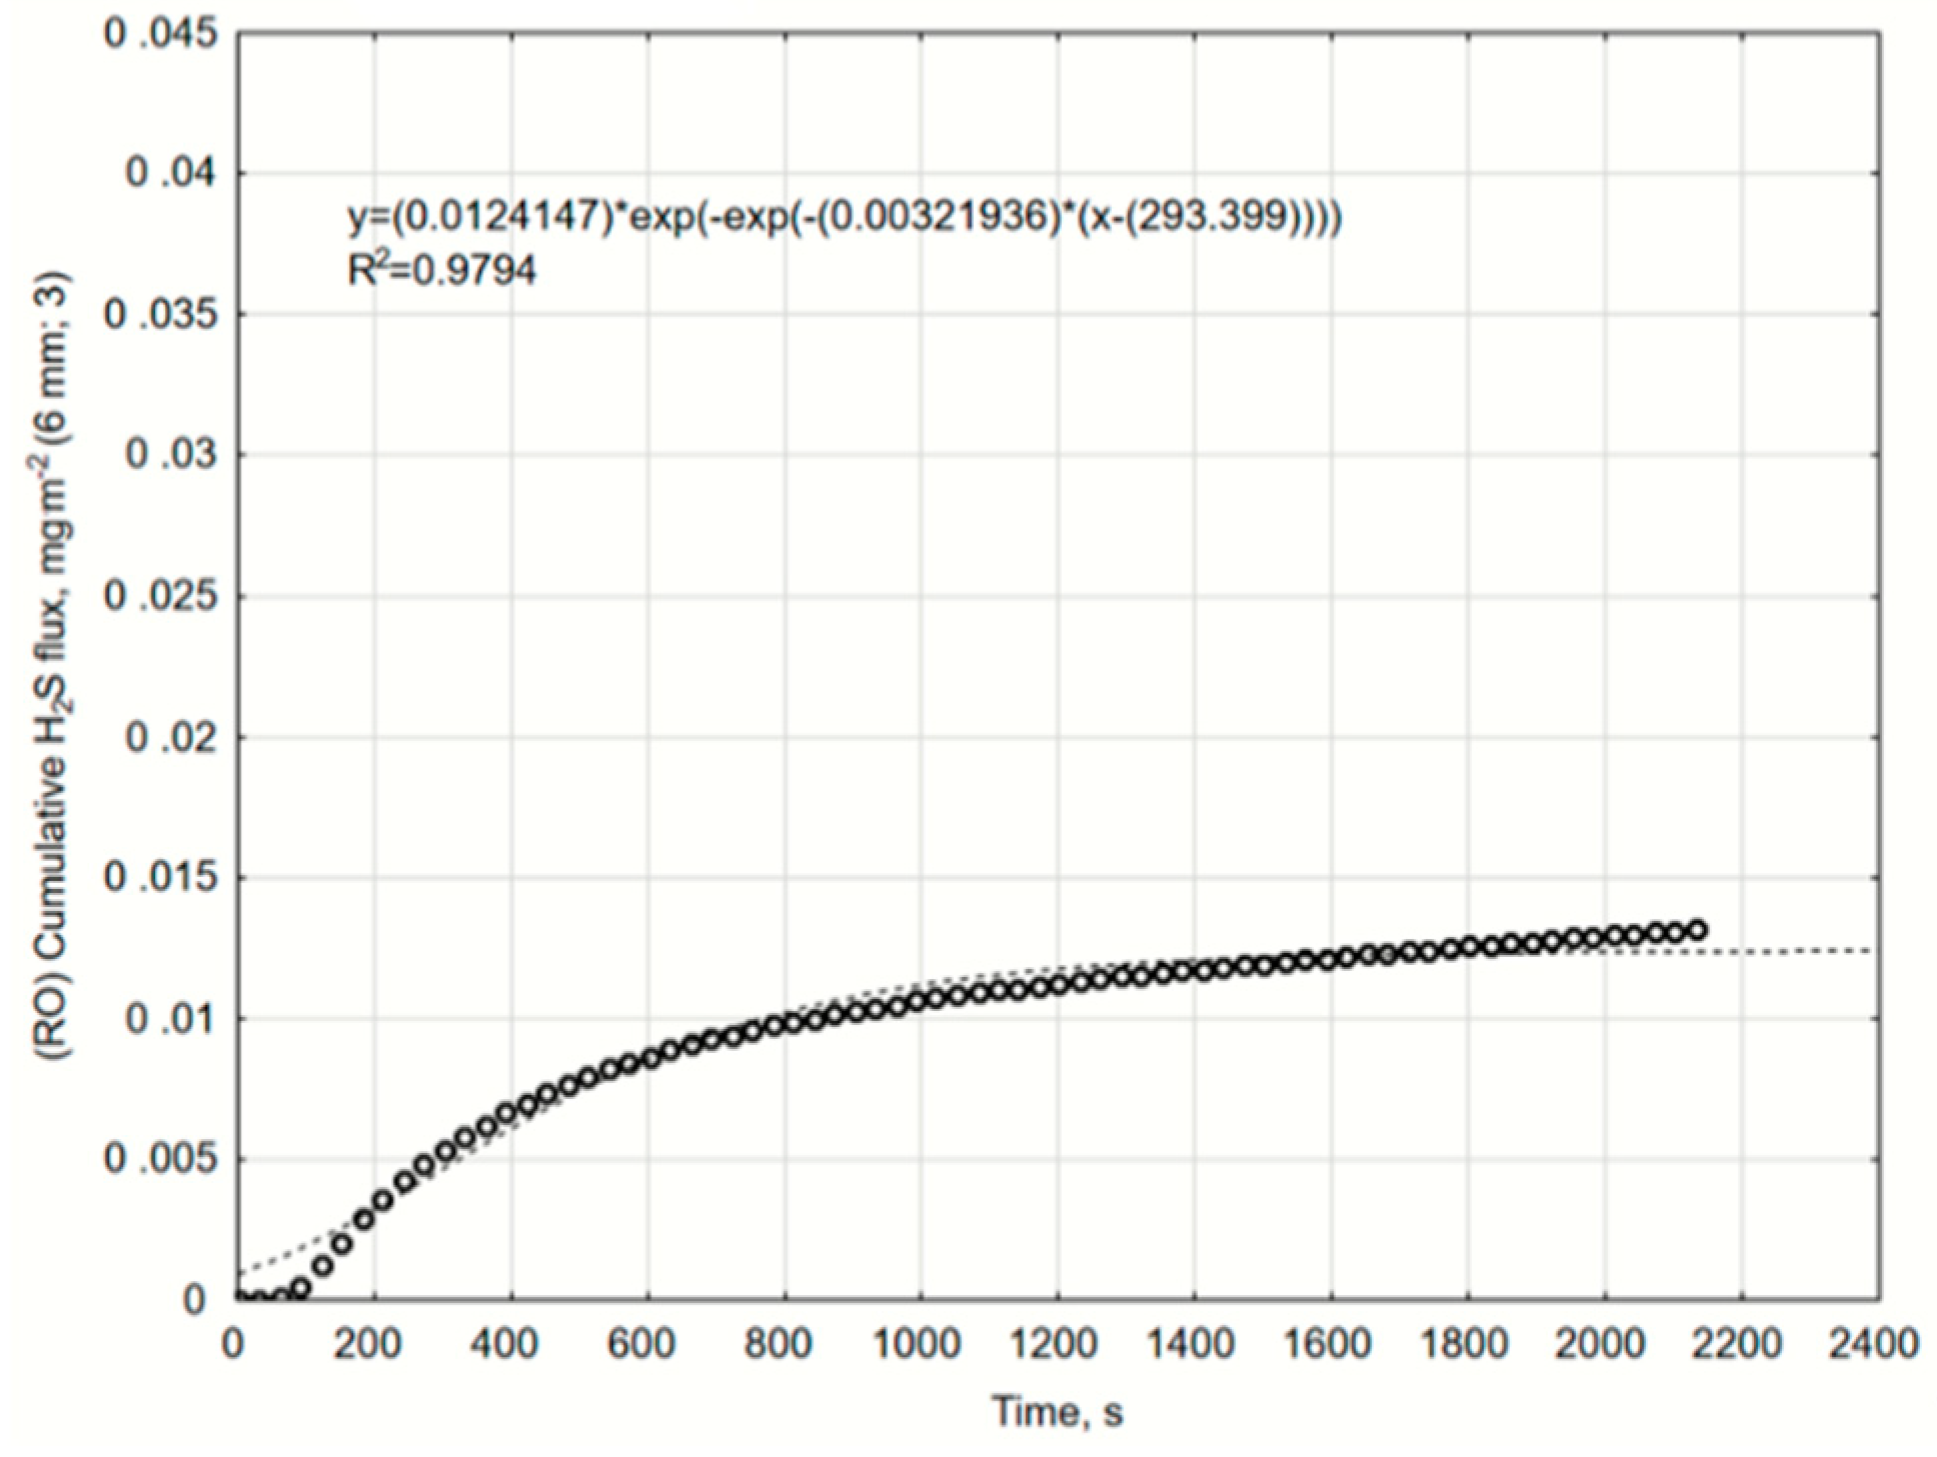
Figure A21.
The cumulative H2S flux. Variant with 6 mm RO biochar layer, repetition 2. Gompertz equation parameters and R2 determination coefficient.
Figure A21.
The cumulative H2S flux. Variant with 6 mm RO biochar layer, repetition 2. Gompertz equation parameters and R2 determination coefficient.
Figure A22.
The cumulative H2S flux. Variant with 6 mm RO biochar layer, repetition 3. Gompertz equation parameters and R2 determination coefficient.
Figure A22.
The cumulative H2S flux. Variant with 6 mm RO biochar layer, repetition 3. Gompertz equation parameters and R2 determination coefficient.

 ,
, 


