The Role of Lactate Metabolism in Prostate Cancer Progression and Metastases Revealed by Dual-Agent Hyperpolarized 13C MRSI

 , and
, and 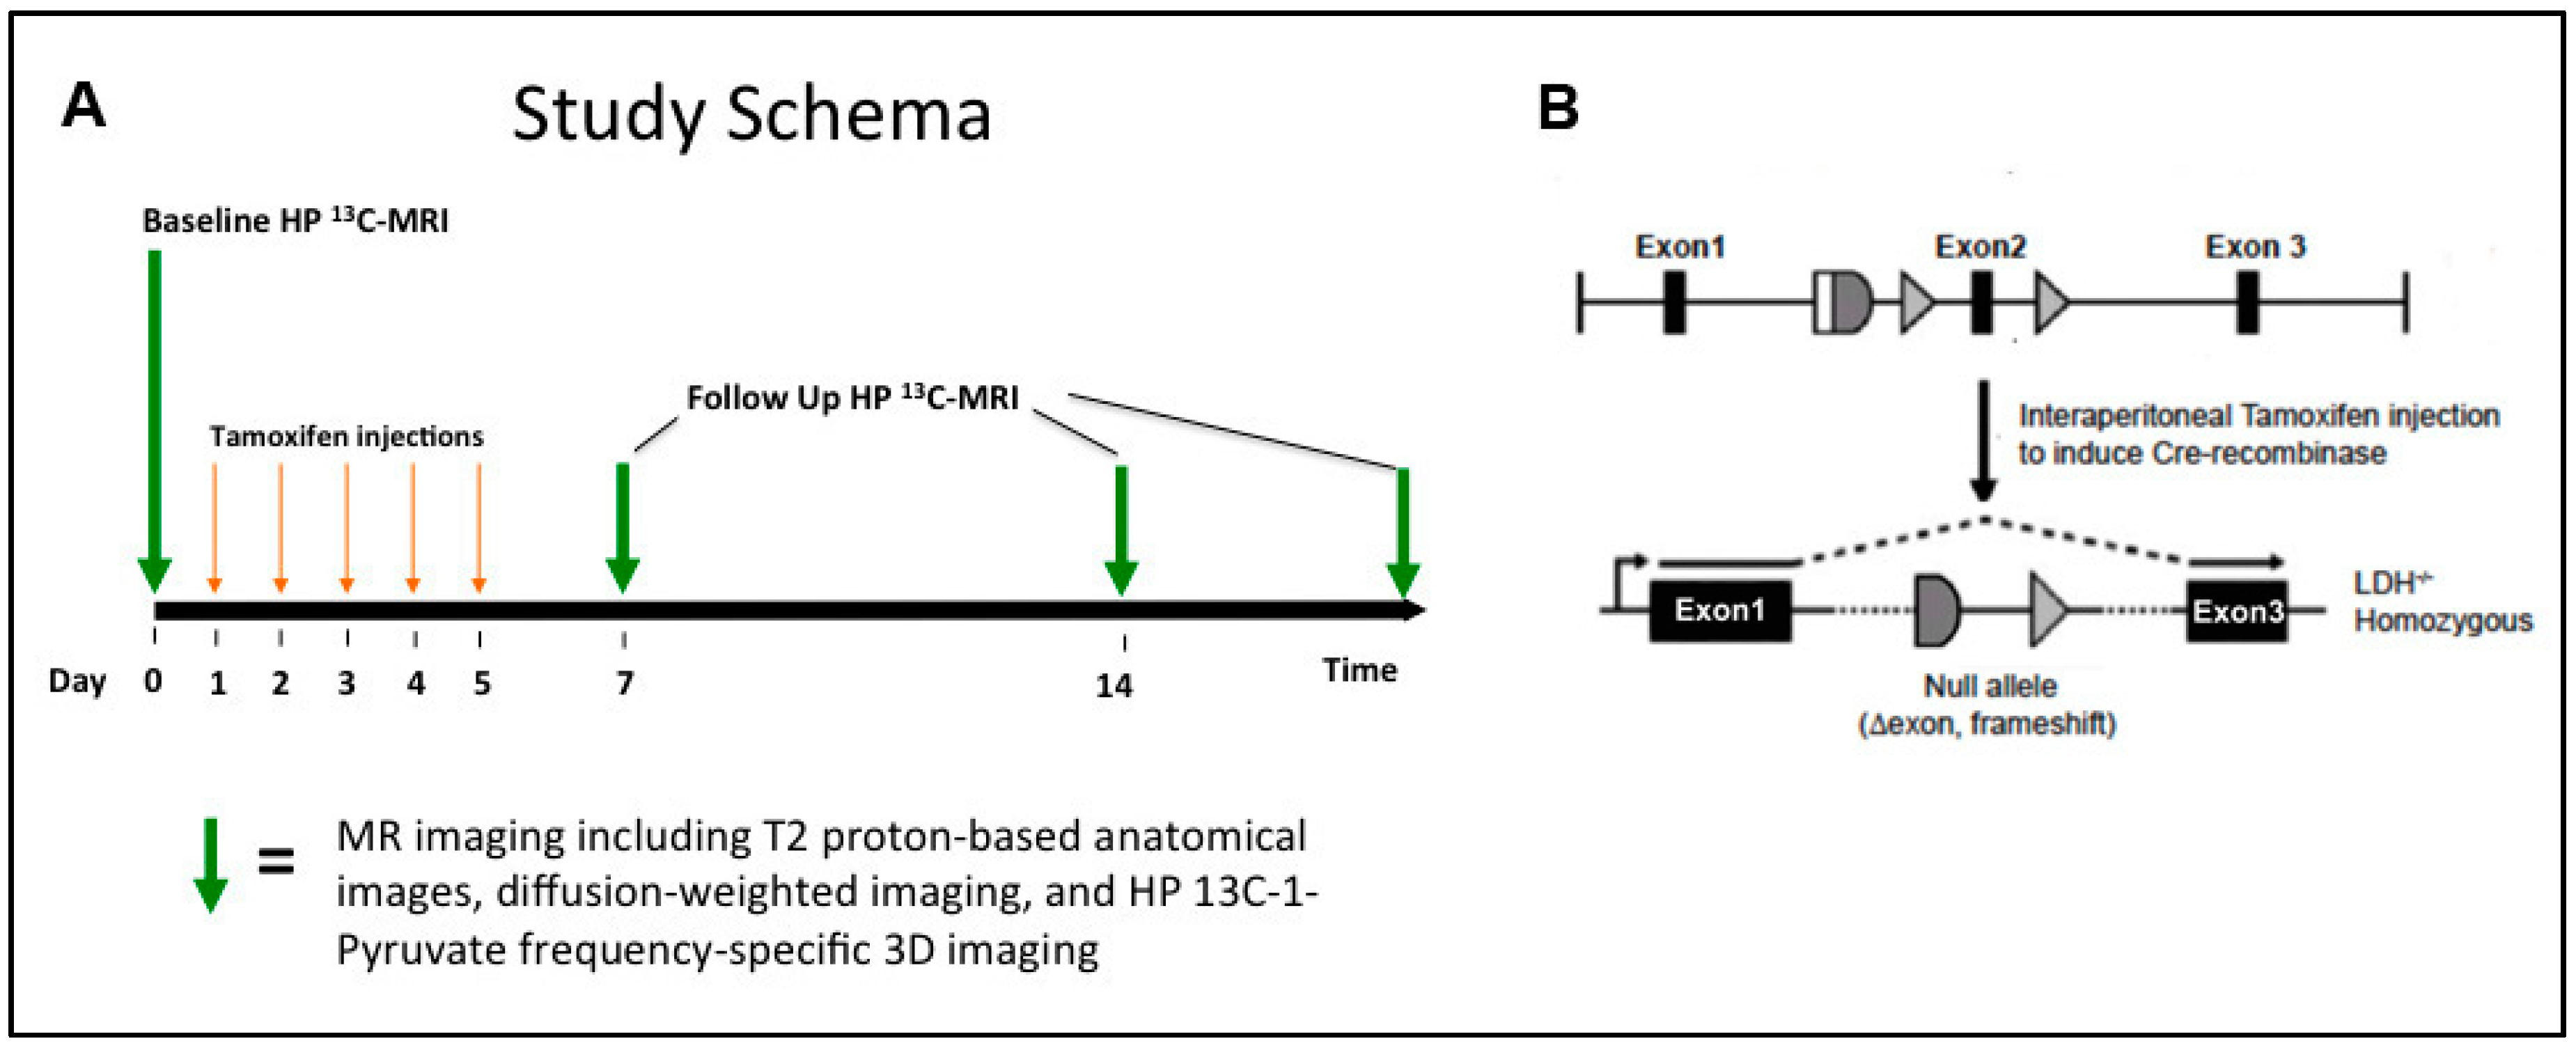
Abstract
:1. Introduction
2. Materials and Methods
2.1. Animal Protocol and Handling
2.2. Hyperpolarization of 13C-Labelled Compounds
2.3. 1H/HP 13C MR Imaging Studies
2.3.1. 1H MRI
2.3.2. HP 13C MRSI
2.4. Histopathologic Analysis
2.5. mRNA Expression and Enzyme Activity Analyses
2.6. Data Analyses
2.7. Statistical Analysis
3. Results
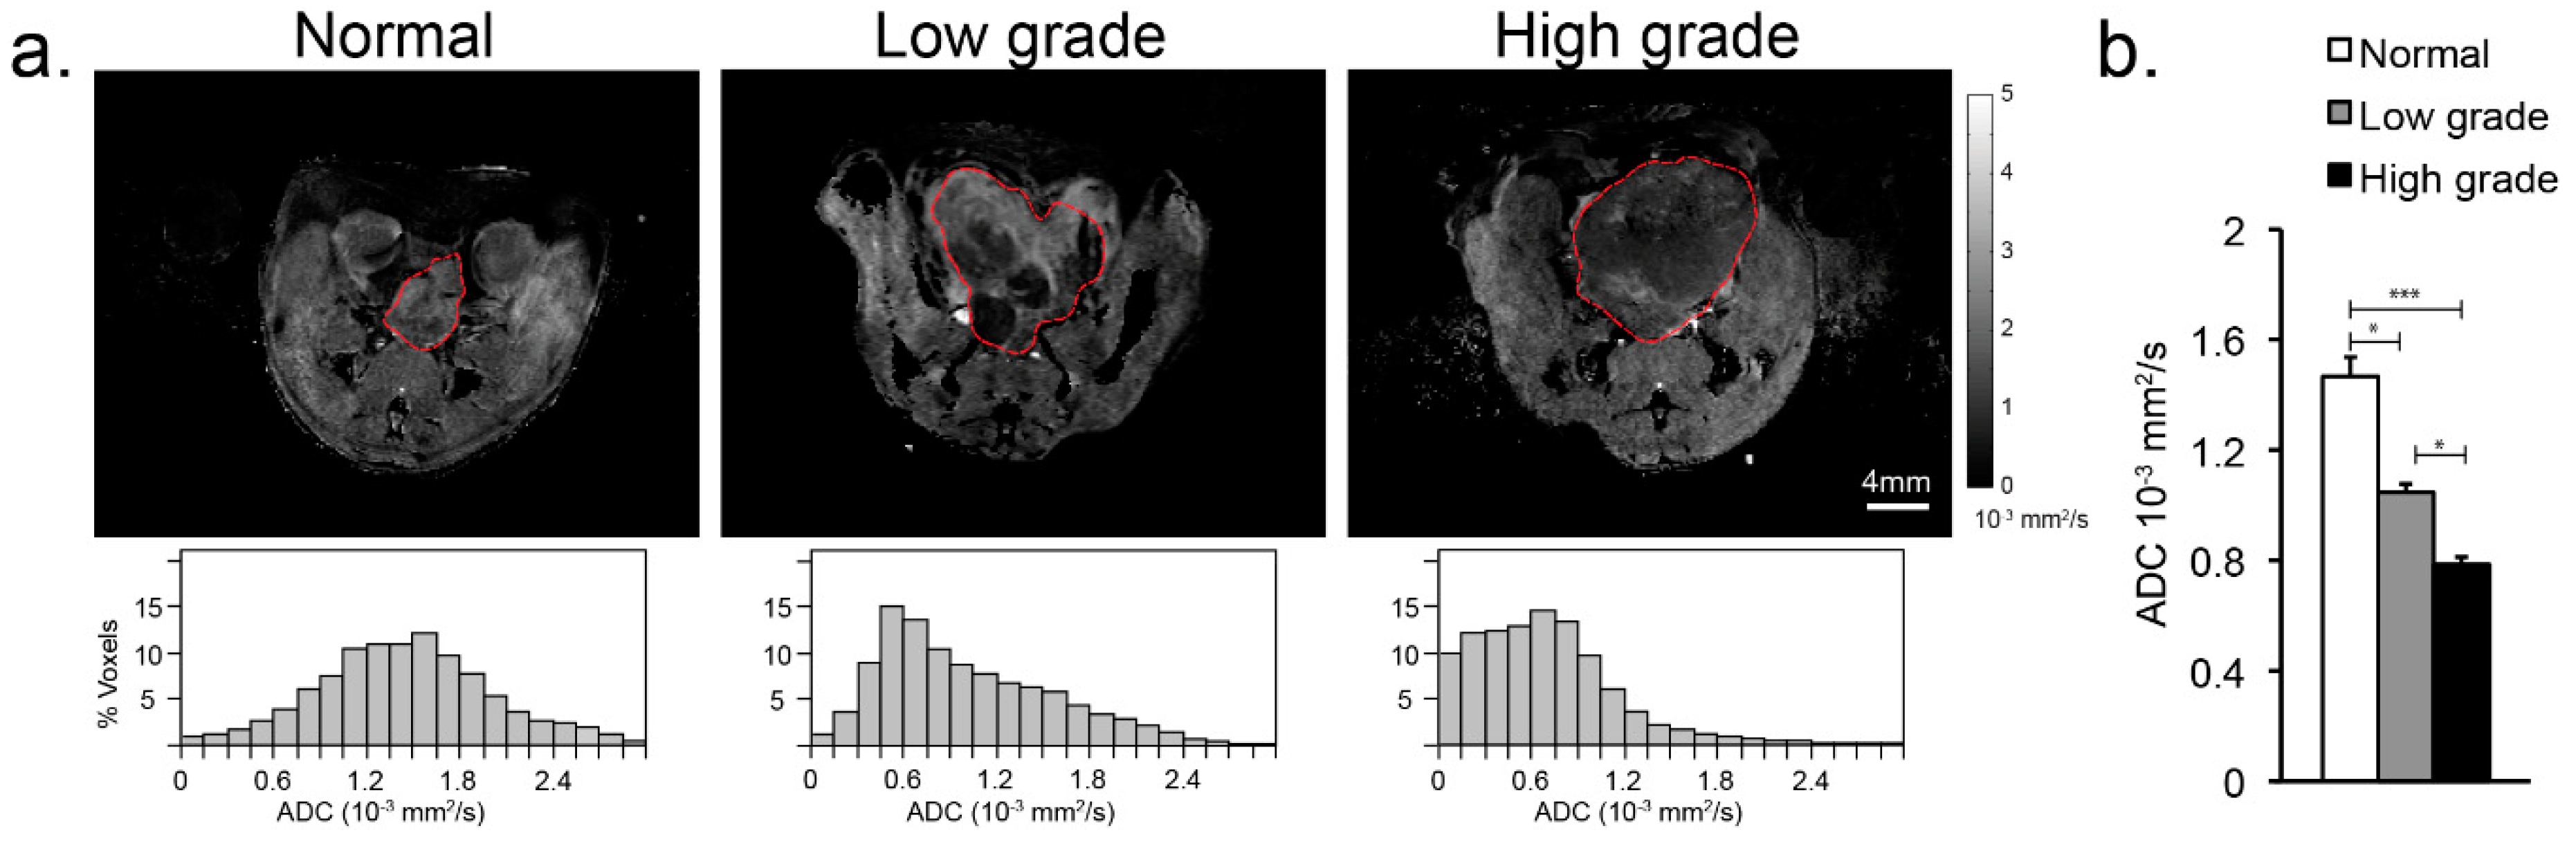
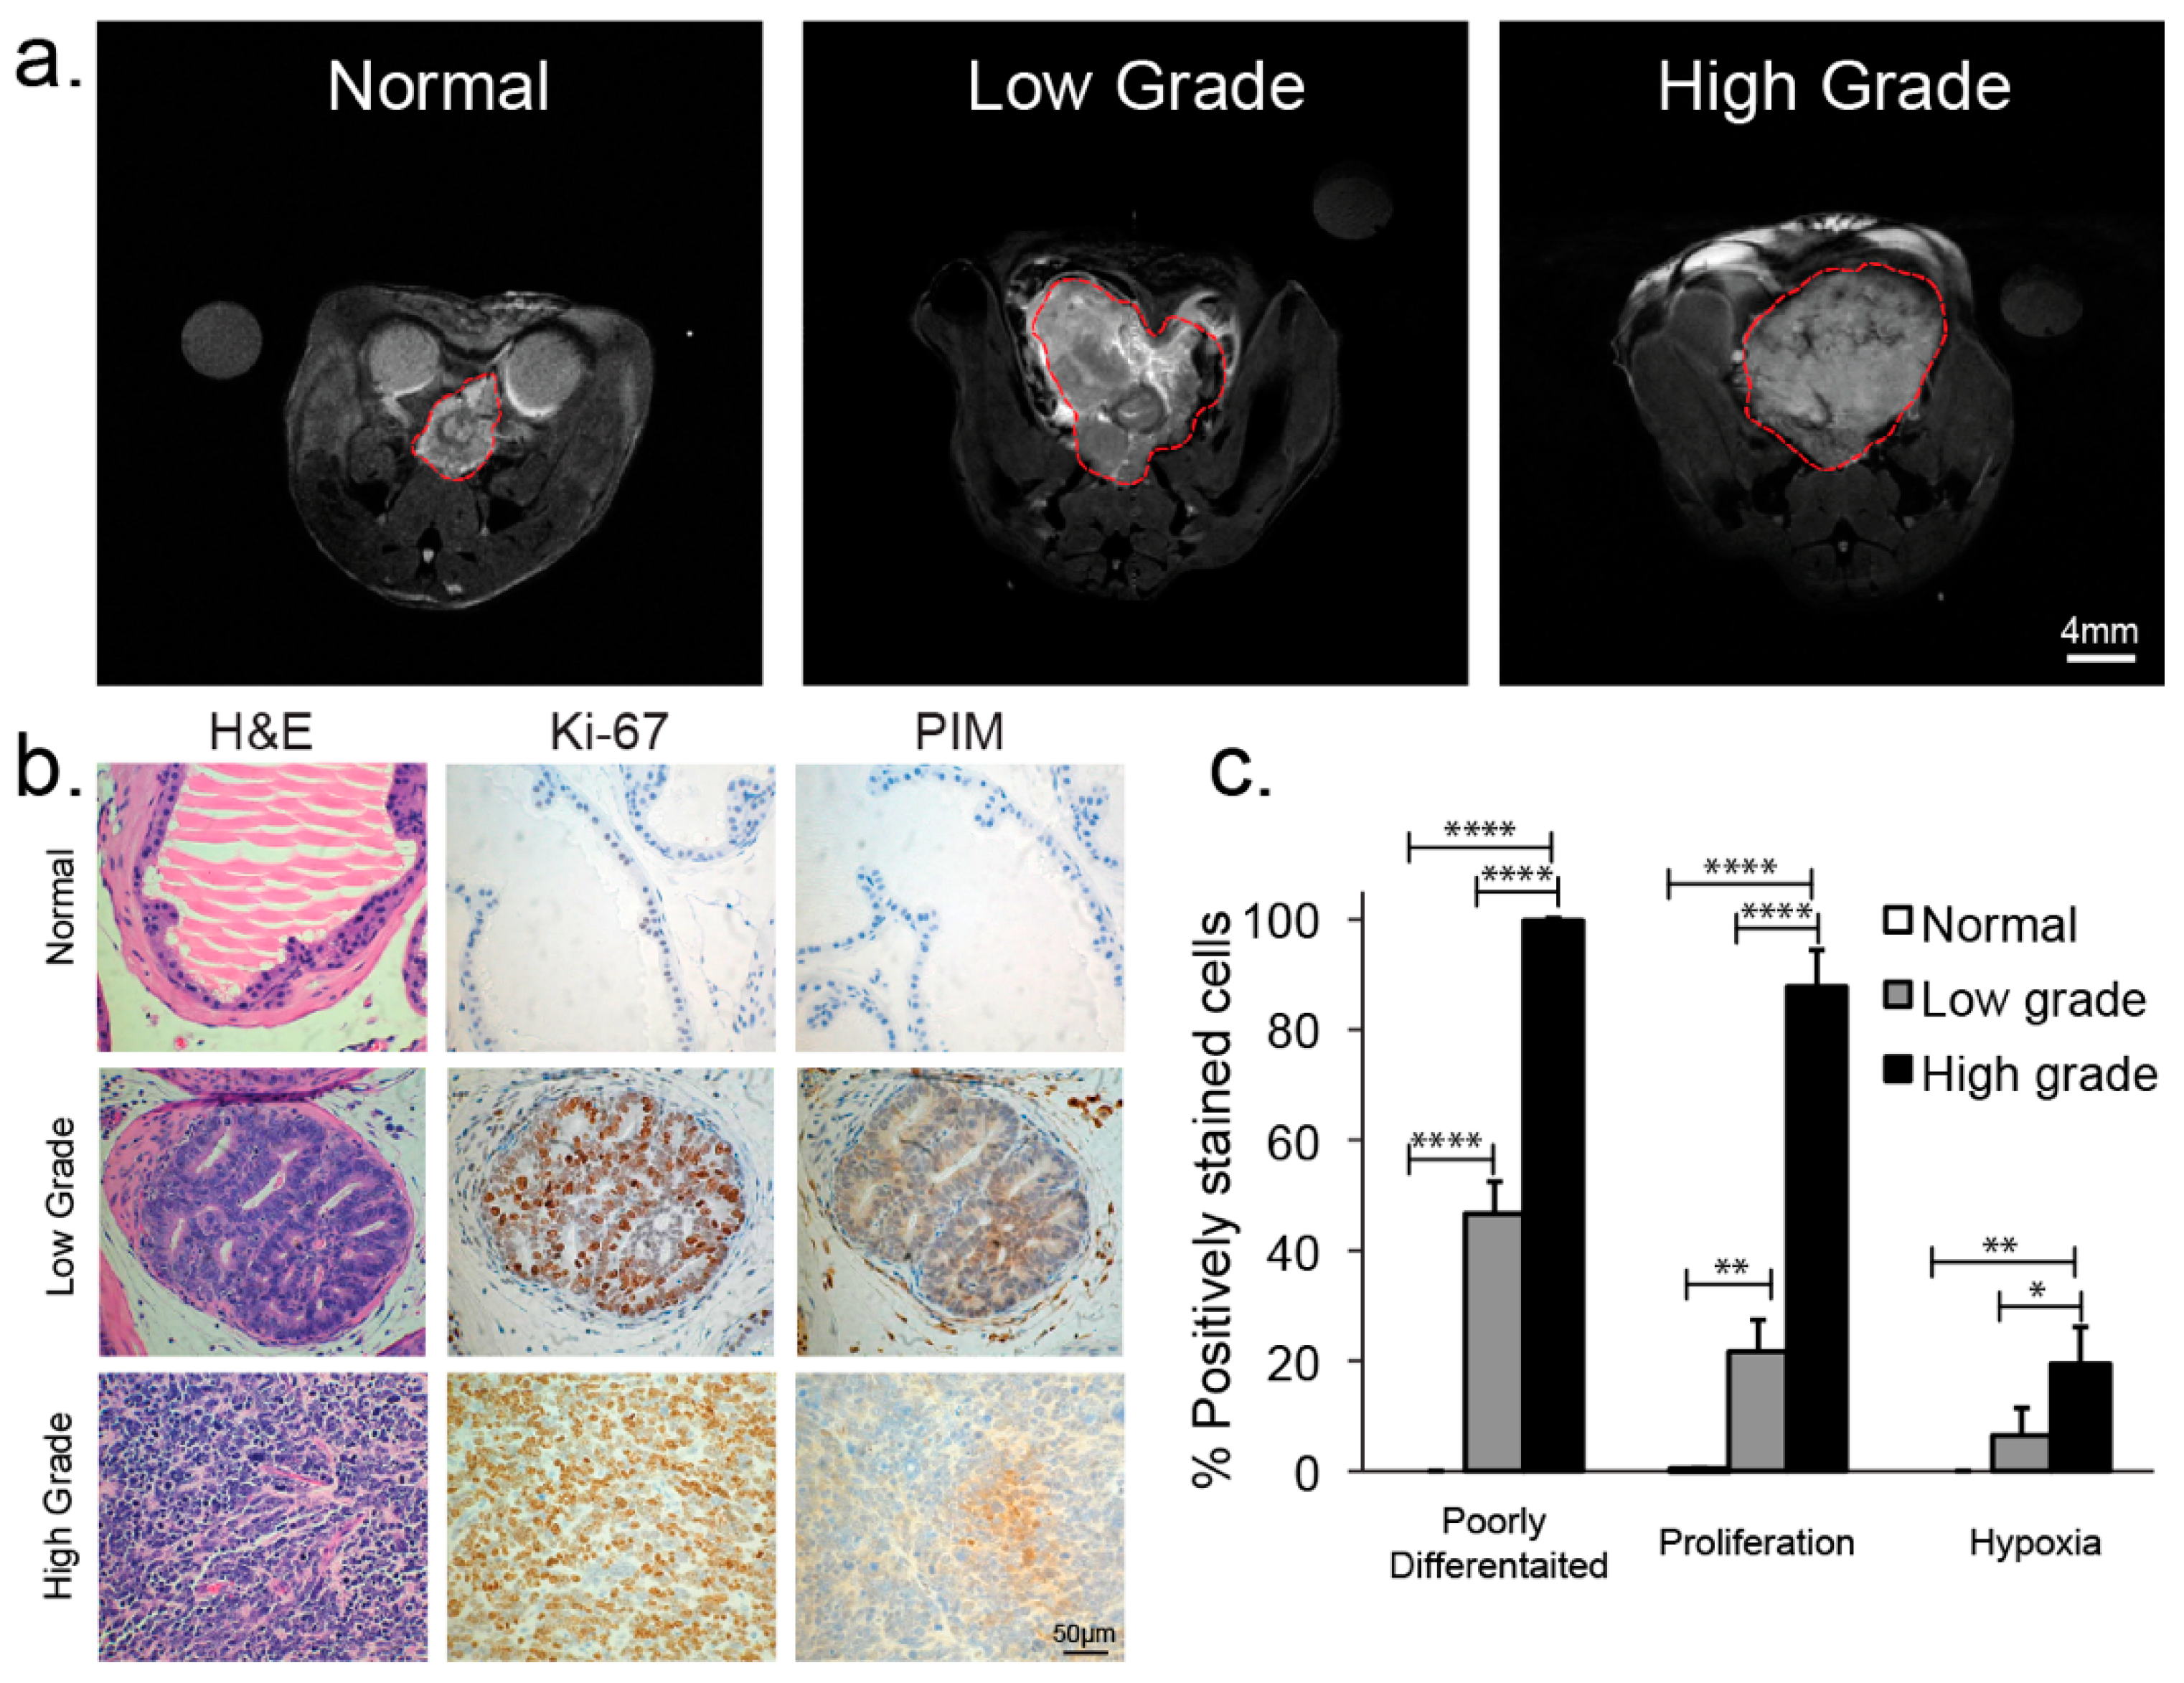
3.1. Anatomical Changes with TRAMP Tumor Evolution and Progression
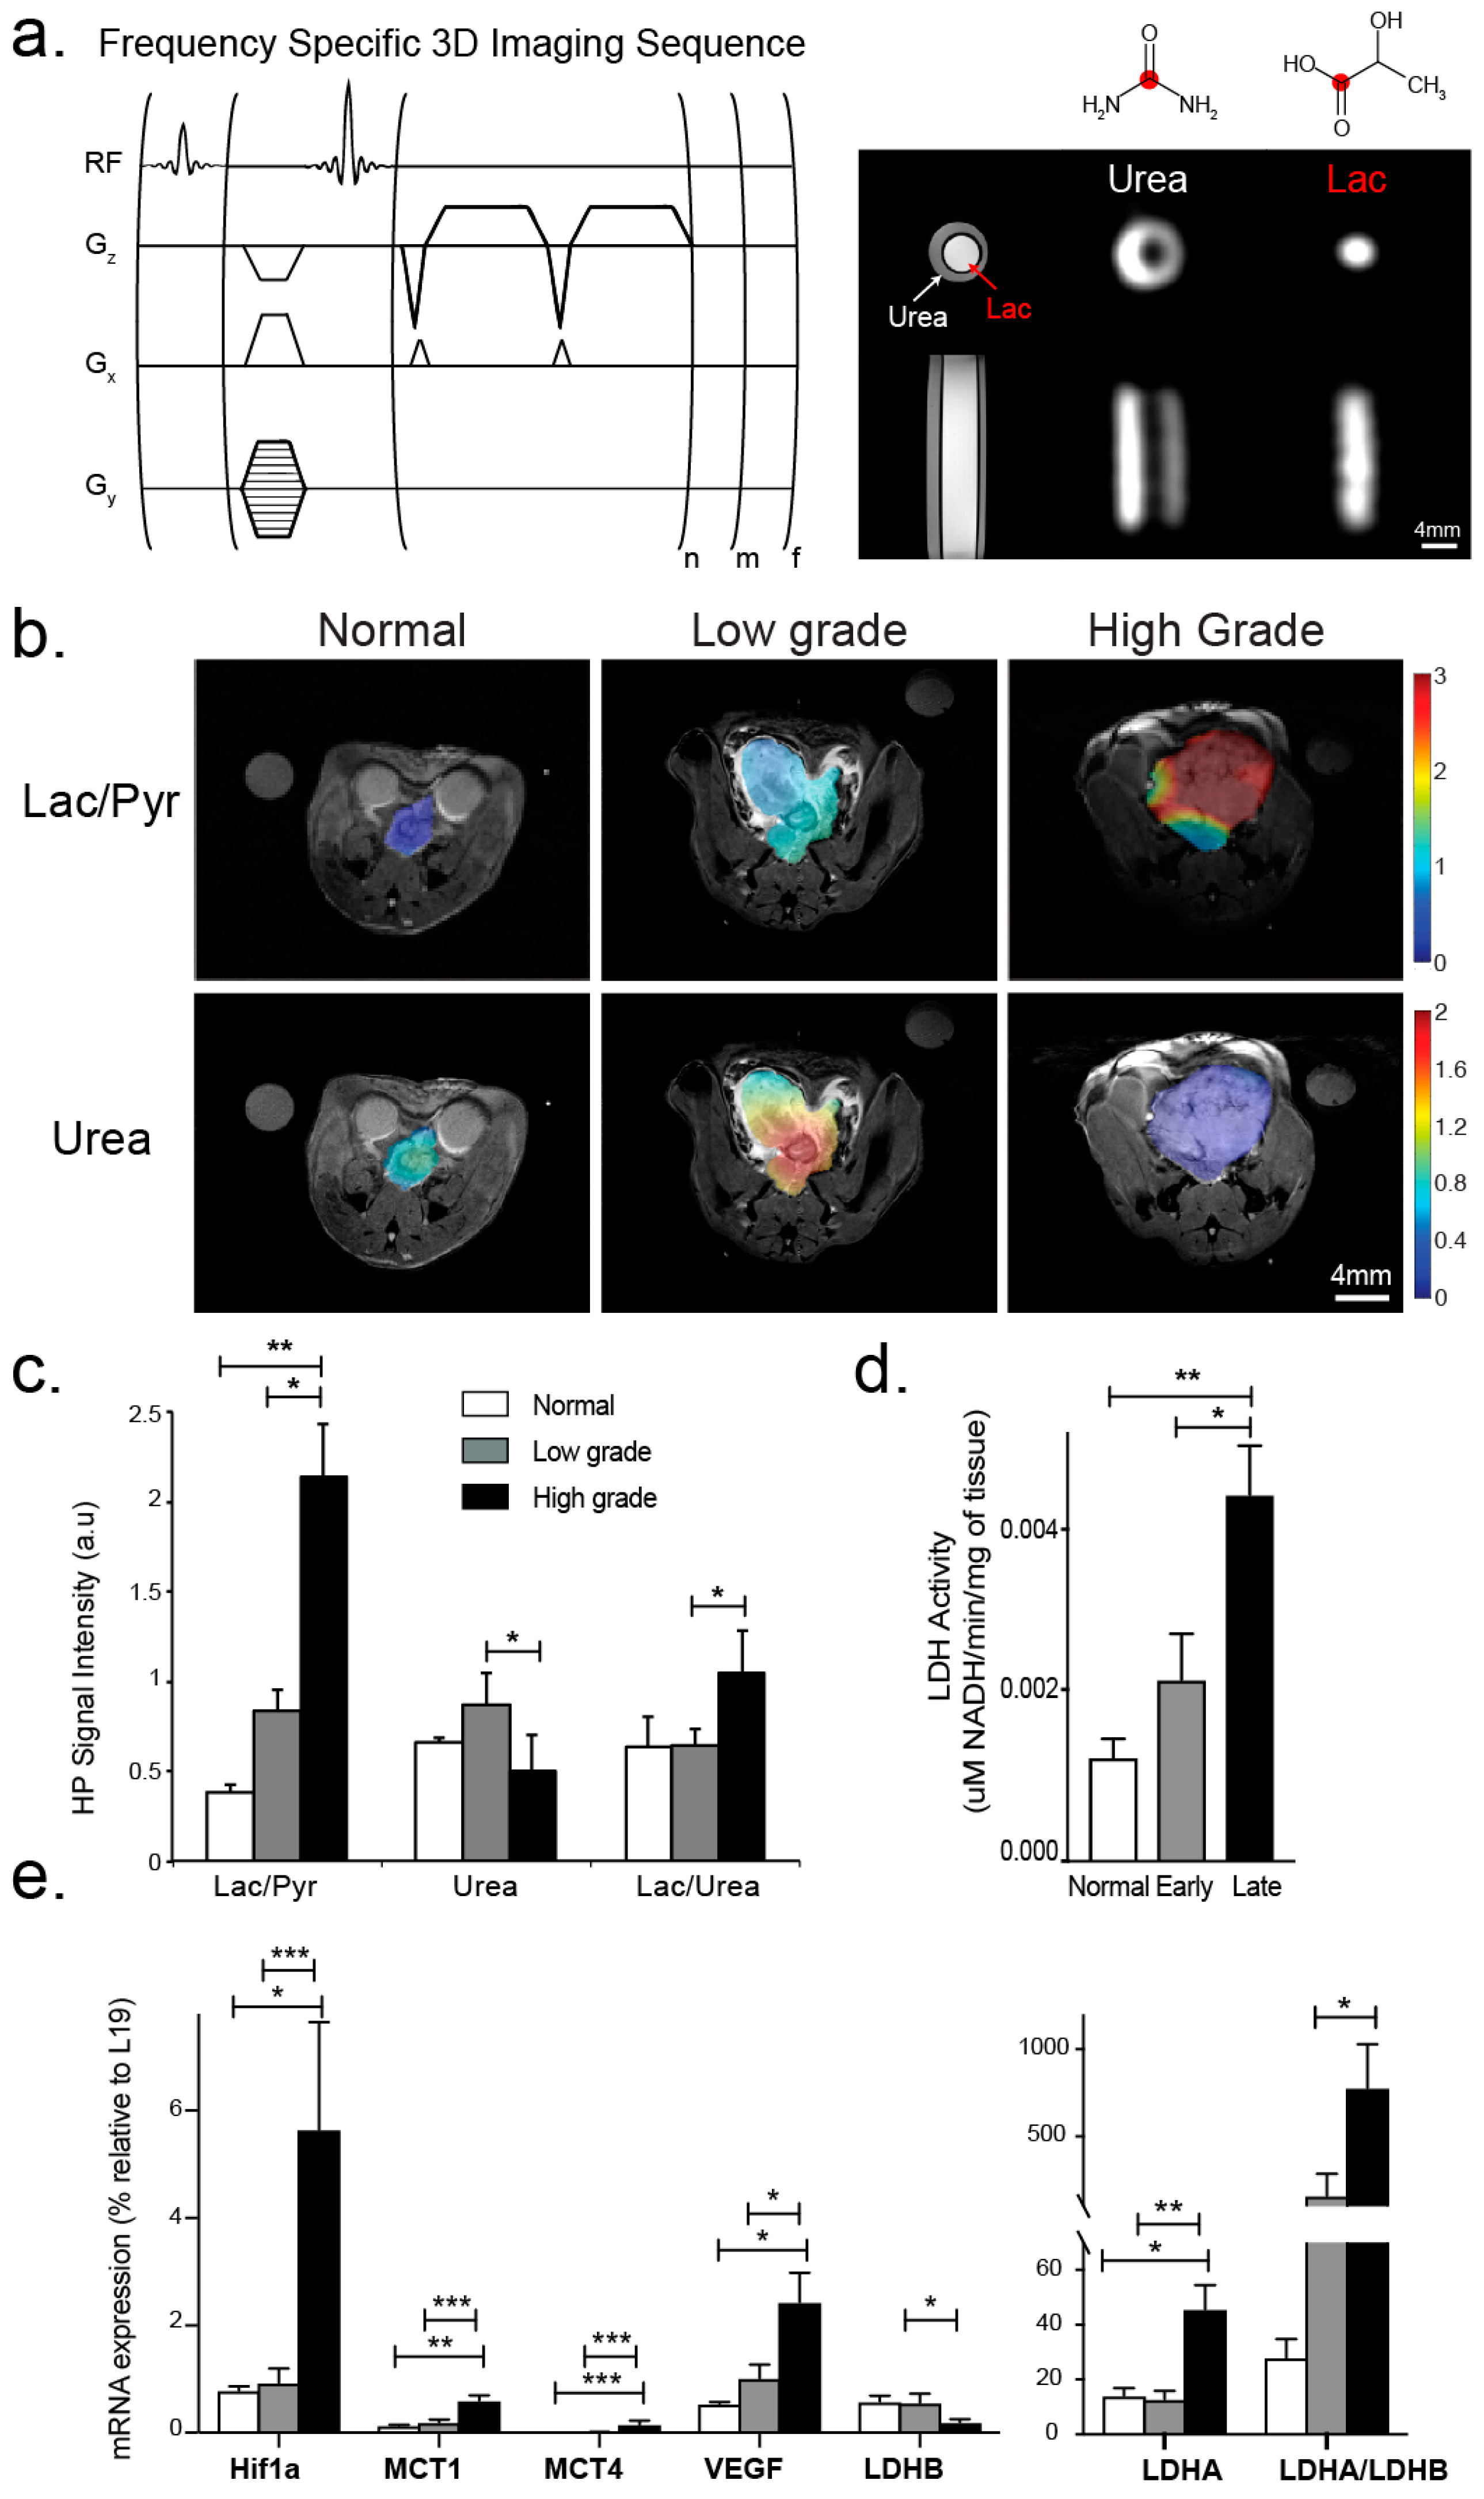
3.2. Changes in Perfusion and Lactate Metabolism with Prostate Cancer Evolution and Progression
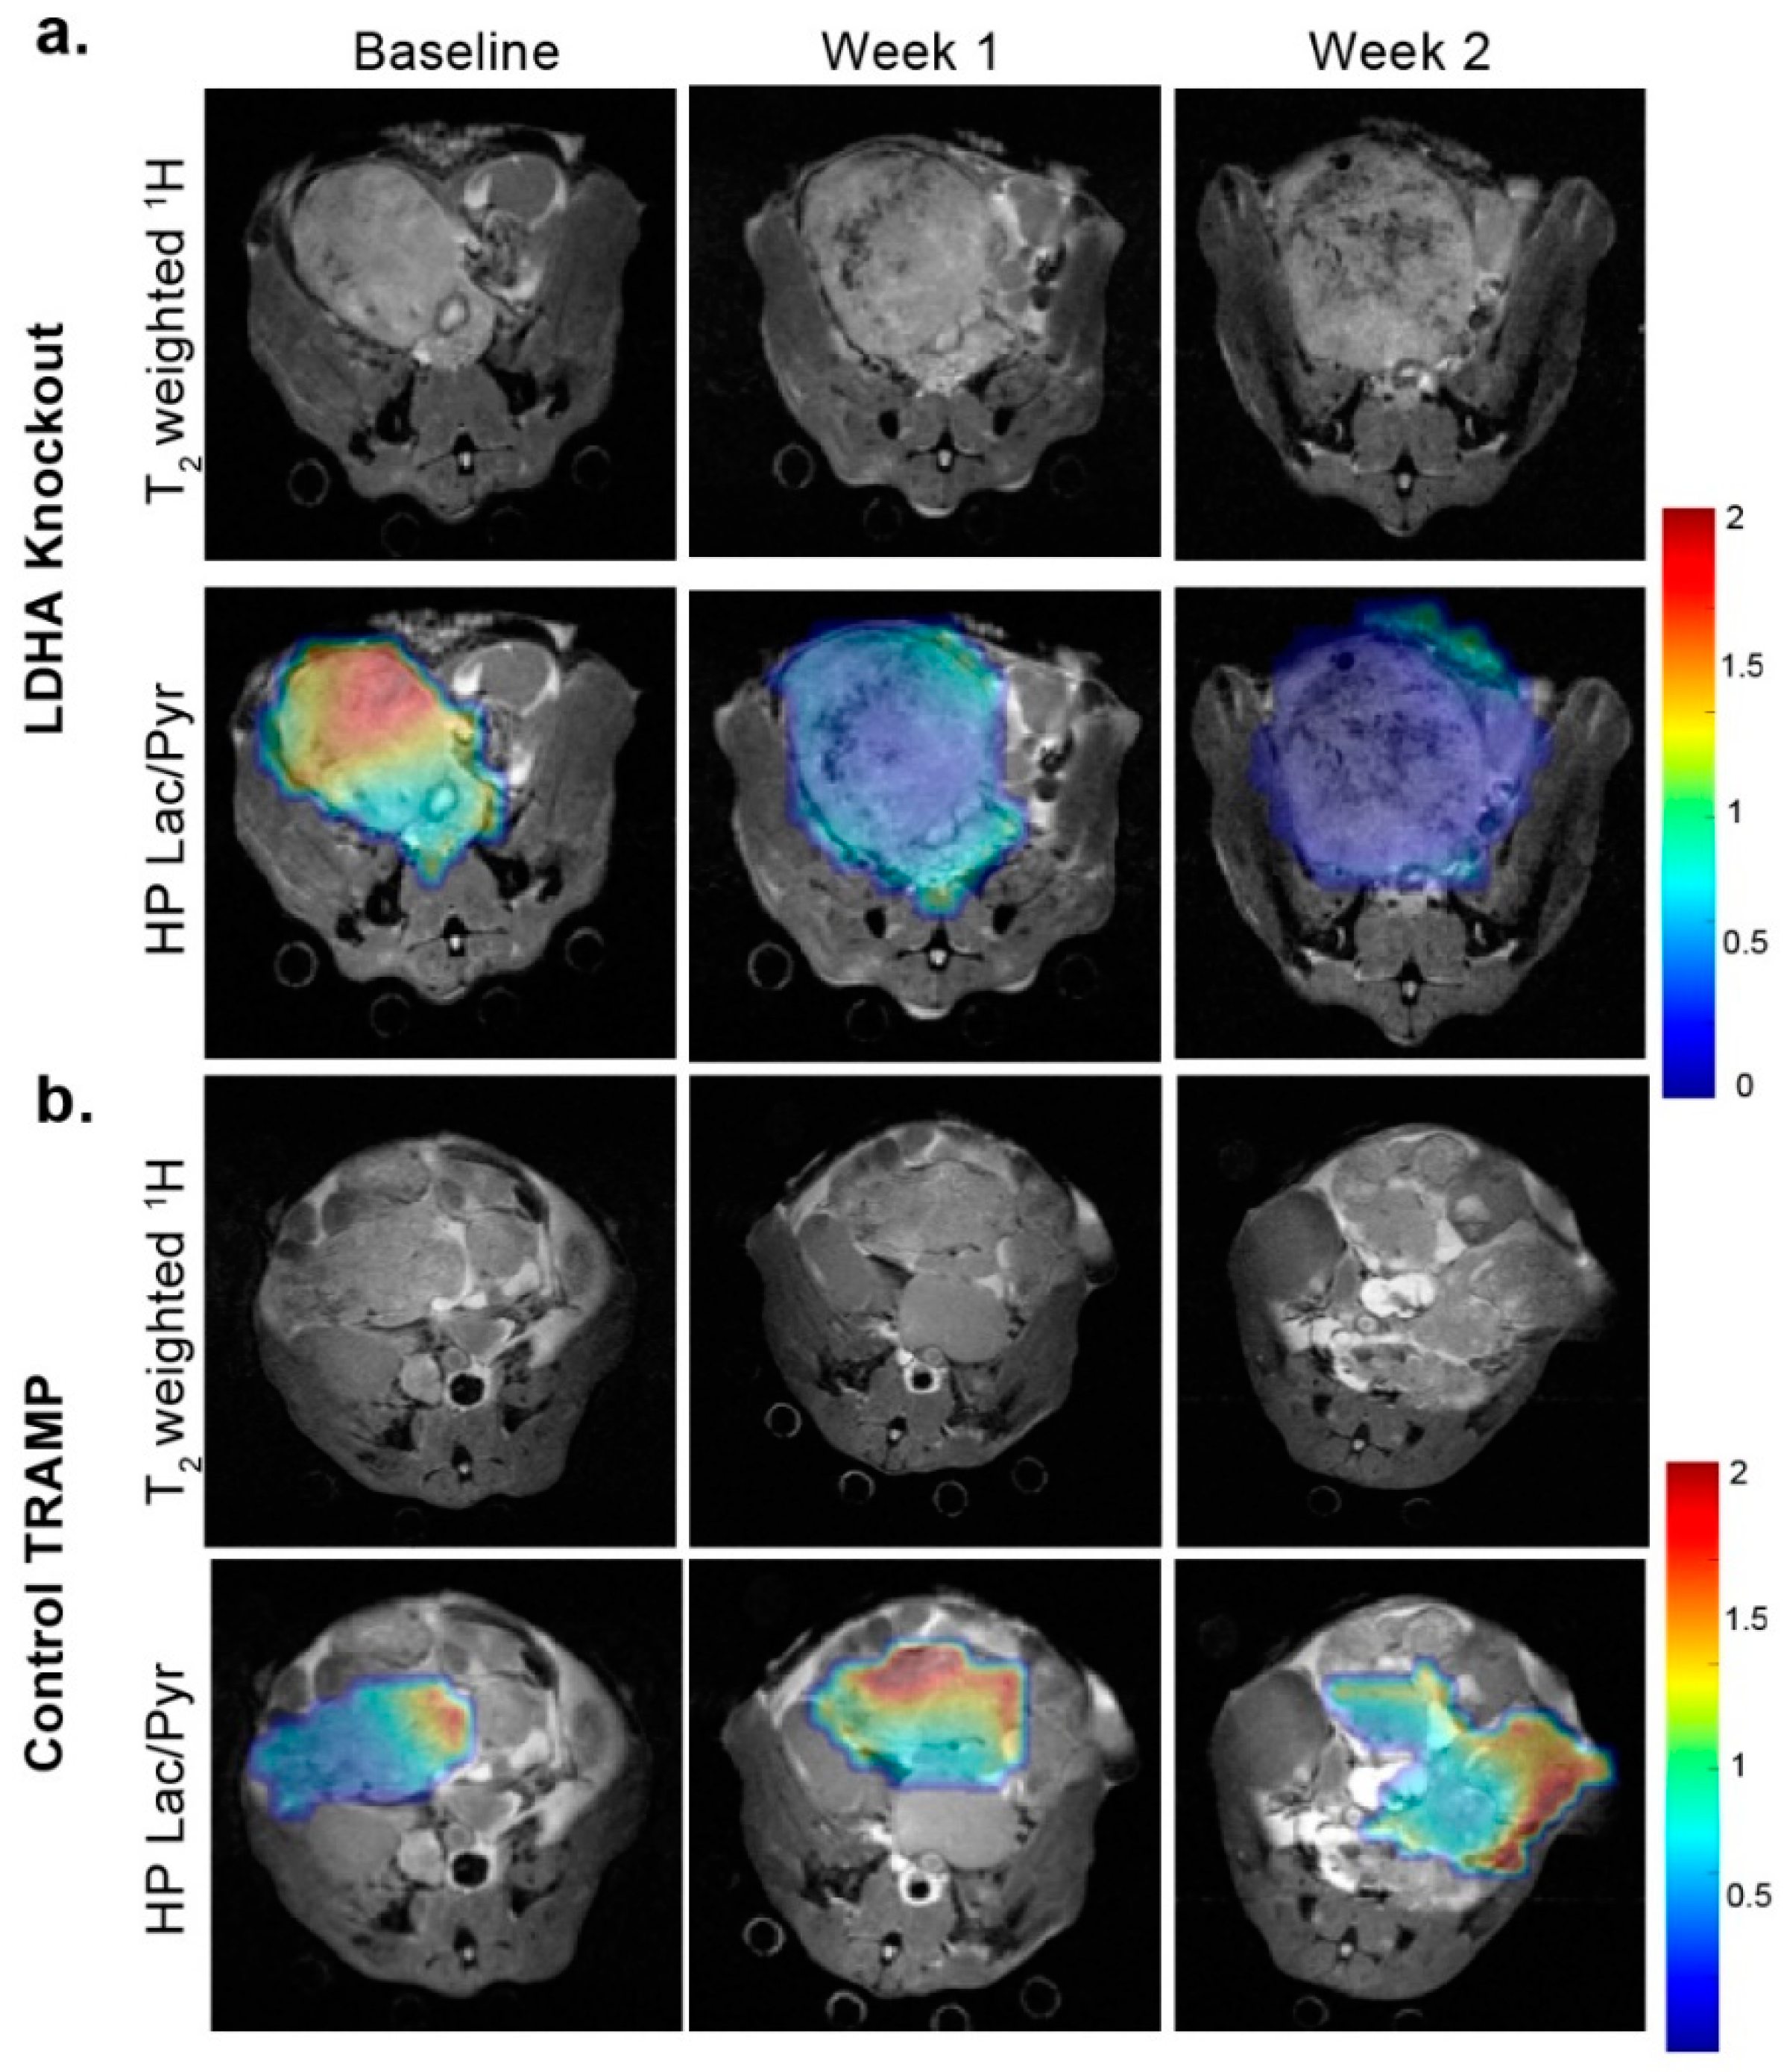
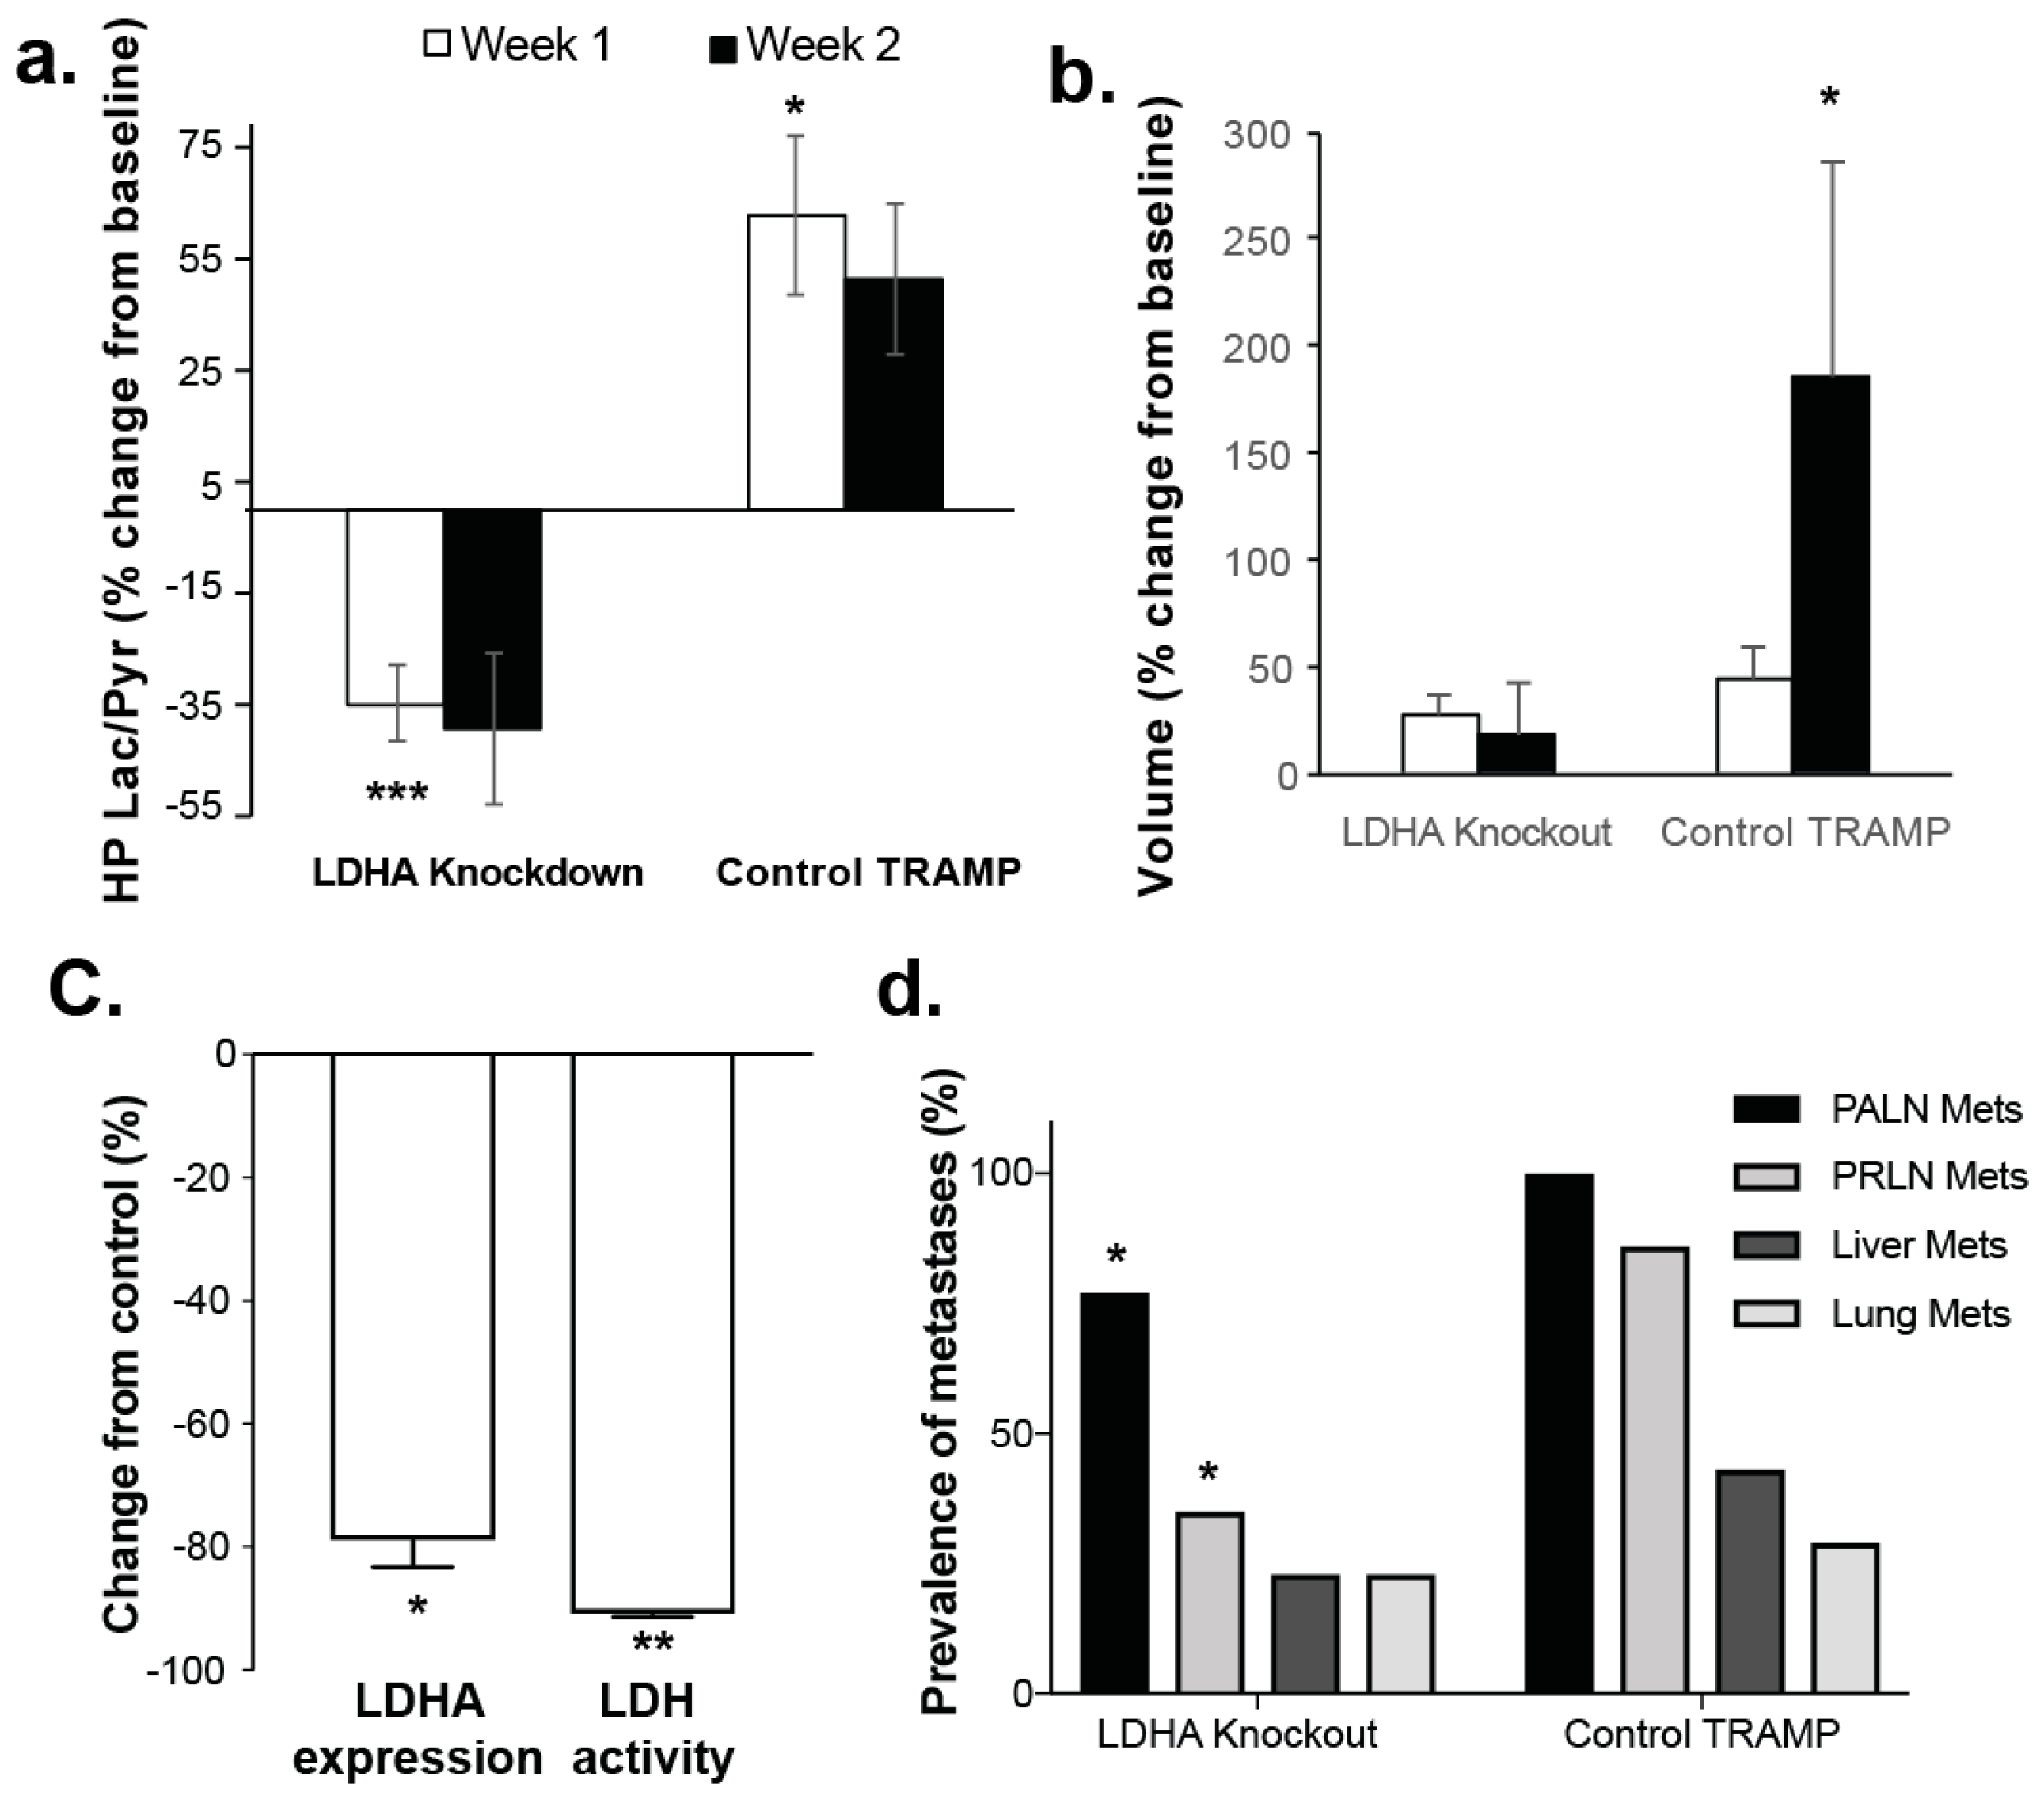
3.3. Changes in Lactate Metabolism with Ldha-Knockout
4. Discussion
5. Conclusions
Supplementary Materials
Author Contributions
Funding
Acknowledgments
Conflicts of Interest
References
- Siegel, R.L.; Miller, K.D.; Jemal, A. Cancer statistics, 2018. CA Cancer J. Clin. 2018, 68, 7–30. [Google Scholar] [CrossRef] [PubMed]
- Cooperberg, M.R. Long-term active surveillance for prostate cancer: Answers and questions. J. Clin. Oncol. 2015, 33, 238–240. [Google Scholar] [CrossRef] [PubMed]
- Cooperberg, M.R.; Carroll, P.R. Trends in Management for Patients with Localized Prostate Cancer, 1990–2013. JAMA 2015, 314, 80–82. [Google Scholar] [CrossRef] [PubMed]
- Gatenby, R.A.; Gillies, R.J. Why do cancers have high aerobic glycolysis? Nat. Rev. Cancer 2004, 4, 891–899. [Google Scholar] [CrossRef] [PubMed]
- Koukourakis, M.I.; Giatromanolaki, A.; Panteliadou, M.; Pouliliou, S.E.; Chondrou, P.S.; Mavropoulou, S.; Sivridis, E. Lactate dehydrogenase 5 isoenzyme overexpression defines resistance of prostate cancer to radiotherapy. Br. J. Cancer 2014, 110, 2217–2223. [Google Scholar] [CrossRef] [PubMed]
- Valvona, C.J.; Fillmore, H.L.; Nunn, P.B.; Pilkington, G.J. The Regulation and Function of Lactate Dehydrogenase A: Therapeutic Potential in Brain Tumor. Brain Pathol. 2016, 26, 3–17. [Google Scholar] [CrossRef] [PubMed]
- Priolo, C.; Pyne, S.; Rose, J.; Regan, E.R.; Zadra, G.; Photopoulos, C.; Cacciatore, S.; Schultz, D.; Scaglia, N.; McDunn, J.; et al. AKT1 and MYC induce distinctive metabolic fingerprints in human prostate cancer. Cancer Res. 2014, 74, 7198–7204. [Google Scholar] [CrossRef] [PubMed]
- Coller, H.A. Is cancer a metabolic disease? Am. J. Pathol. 2014, 184, 4–17. [Google Scholar] [CrossRef] [PubMed]
- Keshari, K.R.; Sriram, R.; Van Criekinge, M.; Wilson, D.M.; Wang, Z.J.; Vigneron, D.B.; Peehl, D.M.; Kurhanewicz, J. Metabolic reprogramming and validation of hyperpolarized (13) C lactate as a prostate cancer biomarker using a human prostate tissue slice culture bioreactor. Prostate 2013, 73, 1171–1181. [Google Scholar] [CrossRef] [PubMed]
- Parks, S.K.; Chiche, J.; Pouyssegur, J. Disrupting proton dynamics and energy metabolism for cancer therapy. Nat. Rev. Cancer 2013, 13, 611–623. [Google Scholar] [CrossRef] [PubMed]
- Estrella, V.; Chen, T.; Lloyd, M.; Wojtkowiak, J.; Cornnell, H.H.; Ibrahim-Hashim, A.; Bailey, K.; Balagurunathan, Y.; Rothberg, J.M.; Sloane, B.F.; et al. Acidity generated by the tumor microenvironment drives local invasion. Cancer Res. 2013, 73, 1524–1535. [Google Scholar] [CrossRef] [PubMed]
- Gatenby, R.A.; Gawlinski, E.T.; Gmitro, A.F.; Kaylor, B.; Gillies, R.J. Acid-mediated tumor invasion: A multidisciplinary study. Cancer Res. 2006, 66, 5216–5223. [Google Scholar] [CrossRef] [PubMed]
- Xu, L.; Fukumura, D.; Jain, R.K. Acidic extracellular pH induces vascular endothelial growth factor (VEGF) in human glioblastoma cells via ERK1/2 MAPK signaling pathway: Mechanism of low pH-induced VEGF. J. Biol. Chem. 2002, 277, 11368–11374. [Google Scholar] [CrossRef] [PubMed]
- Lardner, A. The effects of extracellular pH on immune function. J. Leukoc. Biol. 2001, 69, 522–530. [Google Scholar] [PubMed]
- Seth, P.; Csizmadia, E.; Hedblom, A.; Vuerich, M.; Xie, H.; Li, M.; Longhi, M.S.; Wegiel, B. Deletion of Lactate Dehydrogenase-A in Myeloid Cells Triggers Antitumor Immunity. Cancer Res. 2017, 77, 3632–3643. [Google Scholar] [CrossRef]
- Xie, H.; Valera, V.A.; Merino, M.J.; Amato, A.M.; Signoretti, S.; Linehan, W.M.; Sukhatme, V.P.; Seth, P. LDH-A inhibition, a therapeutic strategy for treatment of hereditary leiomyomatosis and renal cell cancer. Mol. Cancer Ther. 2009, 8, 626–635. [Google Scholar] [CrossRef] [Green Version]
- Greenberg, N.M.; DeMayo, F.; Finegold, M.J.; Medina, D.; Tilley, W.D.; Aspinall, J.O.; Cunha, G.R.; Donjacour, A.A.; Matusik, R.J.; Rosen, J.M. Prostate cancer in a transgenic mouse. Proc. Natl. Acad. Sci. USA 1995, 92, 3439–3443. [Google Scholar] [CrossRef]
- Costello, L.C.; Franklin, R.B.; Zou, J.; Feng, P.; Bok, R.; Swanson, M.G.; Kurhanewicz, J. Human prostate cancer ZIP1/zinc/citrate genetic/metabolic relationship in the TRAMP prostate cancer animal model. Cancer Biol. Ther. 2011, 12, 1078–1084. [Google Scholar] [CrossRef] [Green Version]
- Beauregard, J.M.; Williams, S.G.; Degrado, T.R.; Roselt, P.; Hicks, R.J. Pilot comparison of F-fluorocholine and F-fluorodeoxyglucose PET/CT with conventional imaging in prostate cancer. J. Med. Imaging Radiat. Oncol. 2010, 54, 325–332. [Google Scholar] [CrossRef]
- Farsad, M.; Schiavina, R.; Franceschelli, A.; Sanguedolce, F.; Castellucci, P.; Bertaccini, A.; Brunocilla, E.; Manferrari, F.; Concetti, S.; Garofalo, M.; et al. Positron-emission tomography in imaging and staging prostate cancer. Cancer Biomark. 2008, 4, 277–284. [Google Scholar] [CrossRef]
- Wilson, D.M.; Keshari, K.R.; Larson, P.E.; Chen, A.P.; Hu, S.; Van Criekinge, M.; Bok, R.; Nelson, S.J.; Macdonald, J.M.; Vigneron, D.B.; et al. Multi-compound polarization by DNP allows simultaneous assessment of multiple enzymatic activities in vivo. J. Magn. Reson. 2010, 205, 141–147. [Google Scholar] [CrossRef] [PubMed] [Green Version]
- Chen, H.Y.; Larson, P.E.Z.; Bok, R.A.; von Morze, C.; Sriram, R.; Delos Santos, R.; Delos Santos, J.; Gordon, J.W.; Bahrami, N.; Ferrone, M.; et al. Assessing Prostate Cancer Aggressiveness with Hyperpolarized Dual-Agent 3D Dynamic Imaging of Metabolism and Perfusion. Cancer Res. 2017. [Google Scholar] [CrossRef] [PubMed]
- Oshio, K.; Feinberg, D.A. Single-shot GRASE imaging without fast gradients. Magn. Reson. Med. 1992, 26, 355–360. [Google Scholar] [CrossRef] [PubMed]
- Albers, M.J.; Bok, R.; Chen, A.P.; Cunningham, C.H.; Zierhut, M.L.; Zhang, V.Y.; Kohler, S.J.; Tropp, J.; Hurd, R.E.; Yen, Y.F.; et al. Hyperpolarized 13C lactate, pyruvate, and alanine: Noninvasive biomarkers for prostate cancer detection and grading. Cancer Res. 2008, 68, 8607–8615. [Google Scholar] [CrossRef] [PubMed]
- Ward, C.S.; Venkatesh, H.S.; Chaumeil, M.M.; Brandes, A.H.; Vancriekinge, M.; Dafni, H.; Sukumar, S.; Nelson, S.J.; Vigneron, D.B.; Kurhanewicz, J.; et al. Noninvasive detection of target modulation following phosphatidylinositol 3-kinase inhibition using hyperpolarized 13C magnetic resonance spectroscopy. Cancer Res. 2010, 70, 1296–1305. [Google Scholar] [CrossRef] [PubMed]
- Crane, J.C.; Olson, M.P.; Nelson, S.J. SIVIC: Open-Source, Standards-Based Software for DICOM MR Spectroscopy Workflows. Int. J. Biomed. Imaging 2013, 2013, 169526. [Google Scholar] [CrossRef]
- Kurhanewicz, J.; Vigneron, D.; Carroll, P.; Coakley, F. Multiparametric magnetic resonance imaging in prostate cancer: Present and future. Curr. Opin. Urol. 2008, 18, 71–77. [Google Scholar] [CrossRef]
- Tan, C.H.; Wang, J.; Kundra, V. Diffusion weighted imaging in prostate cancer. Eur. Radiol. 2011, 21, 593–603. [Google Scholar] [CrossRef]
- Jacobs, M.A.; Ouwerkerk, R.; Petrowski, K.; Macura, K.J. Diffusion-weighted imaging with apparent diffusion coefficient mapping and spectroscopy in prostate cancer. Top. Magn. Reson. Imaging 2008, 19, 261–272. [Google Scholar] [CrossRef]
- Zelhof, B.; Lowry, M.; Rodrigues, G.; Kraus, S.; Turnbull, L. Description of magnetic resonance imaging-derived enhancement variables in pathologically confirmed prostate cancer and normal peripheral zone regions. BJU Int. 2009, 104, 621–627. [Google Scholar] [CrossRef] [Green Version]
- Nagarajan, R.; Margolis, D.; Raman, S.; Sheng, K.; King, C.; Reiter, R.; Thomas, M.A. Correlation of Gleason scores with diffusion-weighted imaging findings of prostate cancer. Adv. Urol. 2012, 2012, 374805. [Google Scholar] [CrossRef] [PubMed]
- Tessem, M.B.; Swanson, M.G.; Keshari, K.R.; Albers, M.J.; Joun, D.; Tabatabai, Z.L.; Simko, J.P.; Shinohara, K.; Nelson, S.J.; Vigneron, D.B.; et al. Evaluation of lactate and alanine as metabolic biomarkers of prostate cancer using 1H HR-MAS spectroscopy of biopsy tissues. Magn. Reson. Med. 2008, 60, 510–516. [Google Scholar] [CrossRef] [PubMed]
- Dueregger, A.; Schopf, B.; Eder, T.; Hofer, J.; Gnaiger, E.; Aufinger, A.; Kenner, L.; Perktold, B.; Ramoner, R.; Klocker, H.; et al. Differential Utilization of Dietary Fatty Acids in Benign and Malignant Cells of the Prostate. PLoS ONE 2015, 10, e0135704. [Google Scholar] [CrossRef] [PubMed]
- Eidelman, E.; Twum-Ampofo, J.; Ansari, J.; Siddiqui, M.M. The Metabolic Phenotype of Prostate Cancer. Front. Oncol. 2017, 7, 131. [Google Scholar] [CrossRef] [PubMed]
- Sadeghi, R.N.; Karami-Tehrani, F.; Salami, S. Targeting prostate cancer cell metabolism: Impact of hexokinase and CPT-1 enzymes. Tumour Biol. 2015, 36, 2893–2905. [Google Scholar] [CrossRef] [PubMed]
- Twum-Ampofo, J.; Fu, D.X.; Passaniti, A.; Hussain, A.; Siddiqui, M.M. Metabolic targets for potential prostate cancer therapeutics. Curr. Opin. Oncol. 2016, 28, 241–247. [Google Scholar] [CrossRef] [PubMed]
- Pertega-Gomes, N.; Felisbino, S.; Massie, C.E.; Vizcaino, J.R.; Coelho, R.; Sandi, C.; Simoes-Sousa, S.; Jurmeister, S.; Ramos-Montoya, A.; Asim, M.; et al. A glycolytic phenotype is associated with prostate cancer progression and aggressiveness: A role for monocarboxylate transporters as metabolic targets for therapy. J. Pathol. 2015, 236, 517–530. [Google Scholar] [CrossRef]
- Sanita, P.; Capulli, M.; Teti, A.; Galatioto, G.P.; Vicentini, C.; Chiarugi, P.; Bologna, M.; Angelucci, A. Tumor-stroma metabolic relationship based on lactate shuttle can sustain prostate cancer progression. BMC Cancer 2014, 14, 154. [Google Scholar] [CrossRef]
- Matsumoto, S.; Batra, S.; Saito, K.; Yasui, H.; Choudhuri, R.; Gadisetti, C.; Subramanian, S.; Devasahayam, N.; Munasinghe, J.P.; Mitchell, J.B.; et al. Antiangiogenic agent sunitinib transiently increases tumor oxygenation and suppresses cycling hypoxia. Cancer Res. 2011, 71, 6350–6359. [Google Scholar] [CrossRef]
- Wang, L.; Chen, Z.J.; Wang, Q.T.; Cao, W.F.; Jian, Y.; Wang, S.X.; Zhang, B.H. Expression of hypoxia-inducible factor 1 alpha and vascular endothelial growth factor in prostate cancer and its significance. Zhonghua Nan Ke Xue 2006, 12, 57–59. [Google Scholar]
- Liu, J.; Chen, G.; Liu, Z.; Liu, S.; Cai, Z.; You, P.; Ke, Y.; Lai, L.; Huang, Y.; Gao, H.; et al. Aberrant FGFR Tyrosine Kinase Signaling Enhances the Warburg Effect by Reprogramming LDH Isoform Expression and Activity in Prostate Cancer. Cancer Res. 2018, 78, 4459–4470. [Google Scholar] [CrossRef] [PubMed]
- Dimmer, K.S.; Friedrich, B.; Lang, F.; Deitmer, J.W.; Broer, S. The low-affinity monocarboxylate transporter MCT4 is adapted to the export of lactate in highly glycolytic cells. Biochem. J. 2000, 350 Pt 1, 219–227. [Google Scholar] [CrossRef]
- Korenchan, D.E.; Flavell, R.R.; Baligand, C.; Sriram, R.; Neumann, K.; Sukumar, S.; VanBrocklin, H.; Vigneron, D.B.; Wilson, D.M.; Kurhanewicz, J. Dynamic nuclear polarization of biocompatible (13)C-enriched carbonates for in vivo pH imaging. Chem. Commun. 2016, 52, 3030–3033. [Google Scholar] [CrossRef] [PubMed]
- Fukumura, D.; Xu, L.; Chen, Y.; Gohongi, T.; Seed, B.; Jain, R.K. Hypoxia and acidosis independently up-regulate vascular endothelial growth factor transcription in brain tumors in vivo. Cancer Res. 2001, 61, 6020–6024. [Google Scholar] [PubMed]
- Kolosenko, I.; Avnet, S.; Baldini, N.; Viklund, J.; De Milito, A. Therapeutic implications of tumor interstitial acidification. Semin. Cancer Biol. 2017, 43, 119–133. [Google Scholar] [CrossRef] [PubMed]
- Dhup, S.; Dadhich, R.K.; Porporato, P.E.; Sonveaux, P. Multiple biological activities of lactic acid in cancer: Influences on tumor growth, angiogenesis and metastasis. Curr. Pharm. Des. 2012, 18, 1319–1330. [Google Scholar] [CrossRef] [PubMed]
- Qing, G.; Skuli, N.; Mayes, P.A.; Pawel, B.; Martinez, D.; Maris, J.M.; Simon, M.C. Combinatorial regulation of neuroblastoma tumor progression by N-Myc and hypoxia inducible factor HIF-1alpha. Cancer Res. 2010, 70, 10351–10361. [Google Scholar] [CrossRef]
- Fantin, M.; Quintieri, L.; Kusz, E.; Kis, E.; Glavinas, H.; Floreani, M.; Padrini, R.; Duda, E.; Vizler, C. Pentoxifylline and its major oxidative metabolites exhibit different pharmacological properties. Eur. J. Pharmacol. 2006, 535, 301–309. [Google Scholar] [CrossRef]
- Wang, Z.Y.; Loo, T.Y.; Shen, J.G.; Wang, N.; Wang, D.M.; Yang, D.P.; Mo, S.L.; Guan, X.Y.; Chen, J.P. LDH-A silencing suppresses breast cancer tumorigenicity through induction of oxidative stress mediated mitochondrial pathway apoptosis. Breast Cancer Res. Treat. 2012, 131, 791–800. [Google Scholar] [CrossRef]
- Zhou, X.; Chen, R.; Xie, W.; Ni, Y.; Liu, J.; Huang, G. Relationship between 18F-FDG accumulation and lactate dehydrogenase A expression in lung adenocarcinomas. J. Nucl. Med. 2014, 55, 1766–1771. [Google Scholar] [CrossRef]
- Stock, C.; Schwab, A. Protons make tumor cells move like clockwork. Pflugers Arch. 2009, 458, 981–992. [Google Scholar] [CrossRef] [PubMed]
- Dantas, E.; Erra Diaz, F.; Pereyra Gerber, P.; Merlotti, A.; Varese, A.; Ostrowski, M.; Sabatte, J.; Geffner, J. Low pH impairs complement-dependent cytotoxicity against IgG-coated target cells. Oncotarget 2016, 7, 74203–74216. [Google Scholar] [CrossRef] [PubMed]
- Feng, J.; Yang, H.; Zhang, Y.; Wei, H.; Zhu, Z.; Zhu, B.; Yang, M.; Cao, W.; Wang, L.; Wu, Z. Tumor cell-derived lactate induces TAZ-dependent upregulation of PD-L1 through GPR81 in human lung cancer cells. Oncogene 2017, 36, 5829–5839. [Google Scholar] [CrossRef] [PubMed]
- Matsumoto, S.; Saito, K.; Yasui, H.; Morris, H.D.; Munasinghe, J.P.; Lizak, M.; Merkle, H.; Ardenkjaer-Larsen, J.H.; Choudhuri, R.; Devasahayam, N.; et al. EPR oxygen imaging and hyperpolarized 13C MRI of pyruvate metabolism as noninvasive biomarkers of tumor treatment response to a glycolysis inhibitor 3-bromopyruvate. Magn. Reson. Med. 2013, 69, 1443–1450. [Google Scholar] [CrossRef] [PubMed]
- Nelson, S.J.; Kurhanewicz, J.; Vigneron, D.B.; Larson, P.E.; Harzstark, A.L.; Ferrone, M.; van Criekinge, M.; Chang, J.W.; Bok, R.; Park, I.; et al. Metabolic Imaging of Patients with Prostate Cancer Using Hyperpolarized [1-13C] Pyruvate. Sci. Transl. Med. 2013, 5, 198ra108. [Google Scholar] [CrossRef] [PubMed]
- Aggarwal, R.; Vigneron, D.B.; Kurhanewicz, J. Hyperpolarized 1-[13C]-Pyruvate Magnetic Resonance Imaging Detects an Early Metabolic Response to Androgen Ablation Therapy in Prostate Cancer. Eur. Urol. 2017. [Google Scholar] [CrossRef] [PubMed]


© 2019 by the authors. Licensee MDPI, Basel, Switzerland. This article is an open access article distributed under the terms and conditions of the Creative Commons Attribution (CC BY) license (http://creativecommons.org/licenses/by/4.0/).
Share and Cite
Bok, R.; Lee, J.; Sriram, R.; Keshari, K.; Sukumar, S.; Daneshmandi, S.; Korenchan, D.E.; Flavell, R.R.; Vigneron, D.B.; Kurhanewicz, J.; et al. The Role of Lactate Metabolism in Prostate Cancer Progression and Metastases Revealed by Dual-Agent Hyperpolarized 13C MRSI. Cancers 2019, 11, 257. https://doi.org/10.3390/cancers11020257
Bok R, Lee J, Sriram R, Keshari K, Sukumar S, Daneshmandi S, Korenchan DE, Flavell RR, Vigneron DB, Kurhanewicz J, et al. The Role of Lactate Metabolism in Prostate Cancer Progression and Metastases Revealed by Dual-Agent Hyperpolarized 13C MRSI. Cancers. 2019; 11(2):257. https://doi.org/10.3390/cancers11020257
Chicago/Turabian StyleBok, Robert, Jessie Lee, Renuka Sriram, Kayvan Keshari, Subramaniam Sukumar, Saeed Daneshmandi, David E. Korenchan, Robert R. Flavell, Daniel B. Vigneron, John Kurhanewicz, and et al. 2019. "The Role of Lactate Metabolism in Prostate Cancer Progression and Metastases Revealed by Dual-Agent Hyperpolarized 13C MRSI" Cancers 11, no. 2: 257. https://doi.org/10.3390/cancers11020257