Non-Invasive Assessment of Lactate Production and Compartmentalization in Renal Cell Carcinomas Using Hyperpolarized 13C Pyruvate MRI

 , , , , and
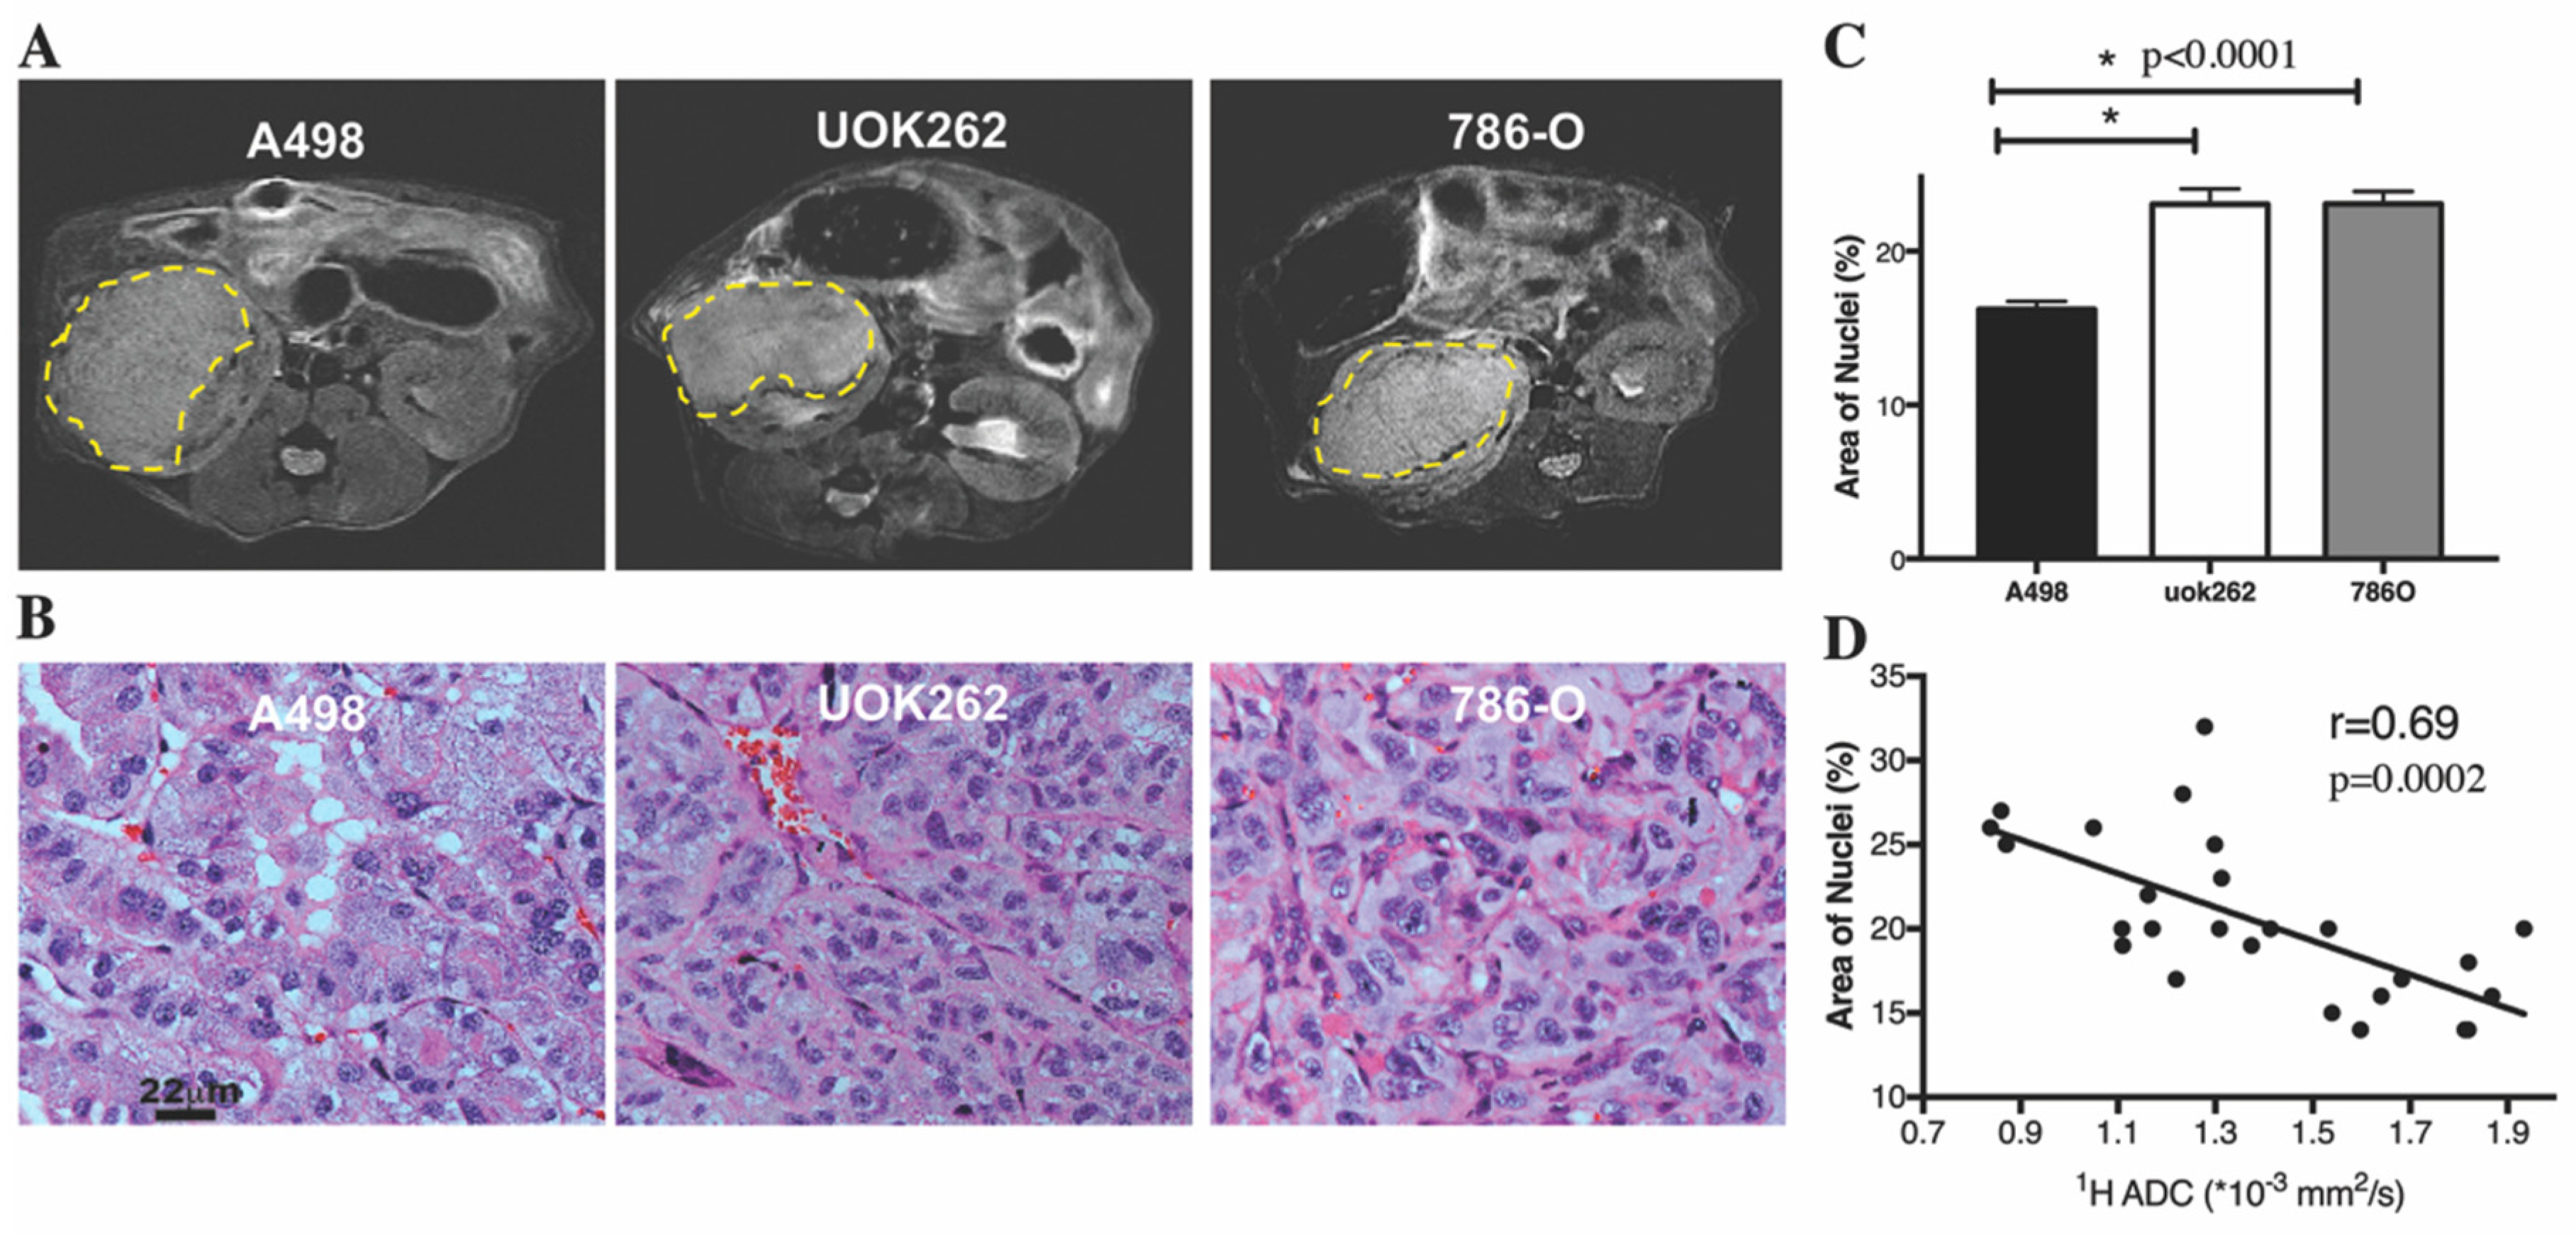
Abstract
:1. Introduction
2. Results
2.1. Orthotopic Tumor Characteristics on 1H MRI and on Histology
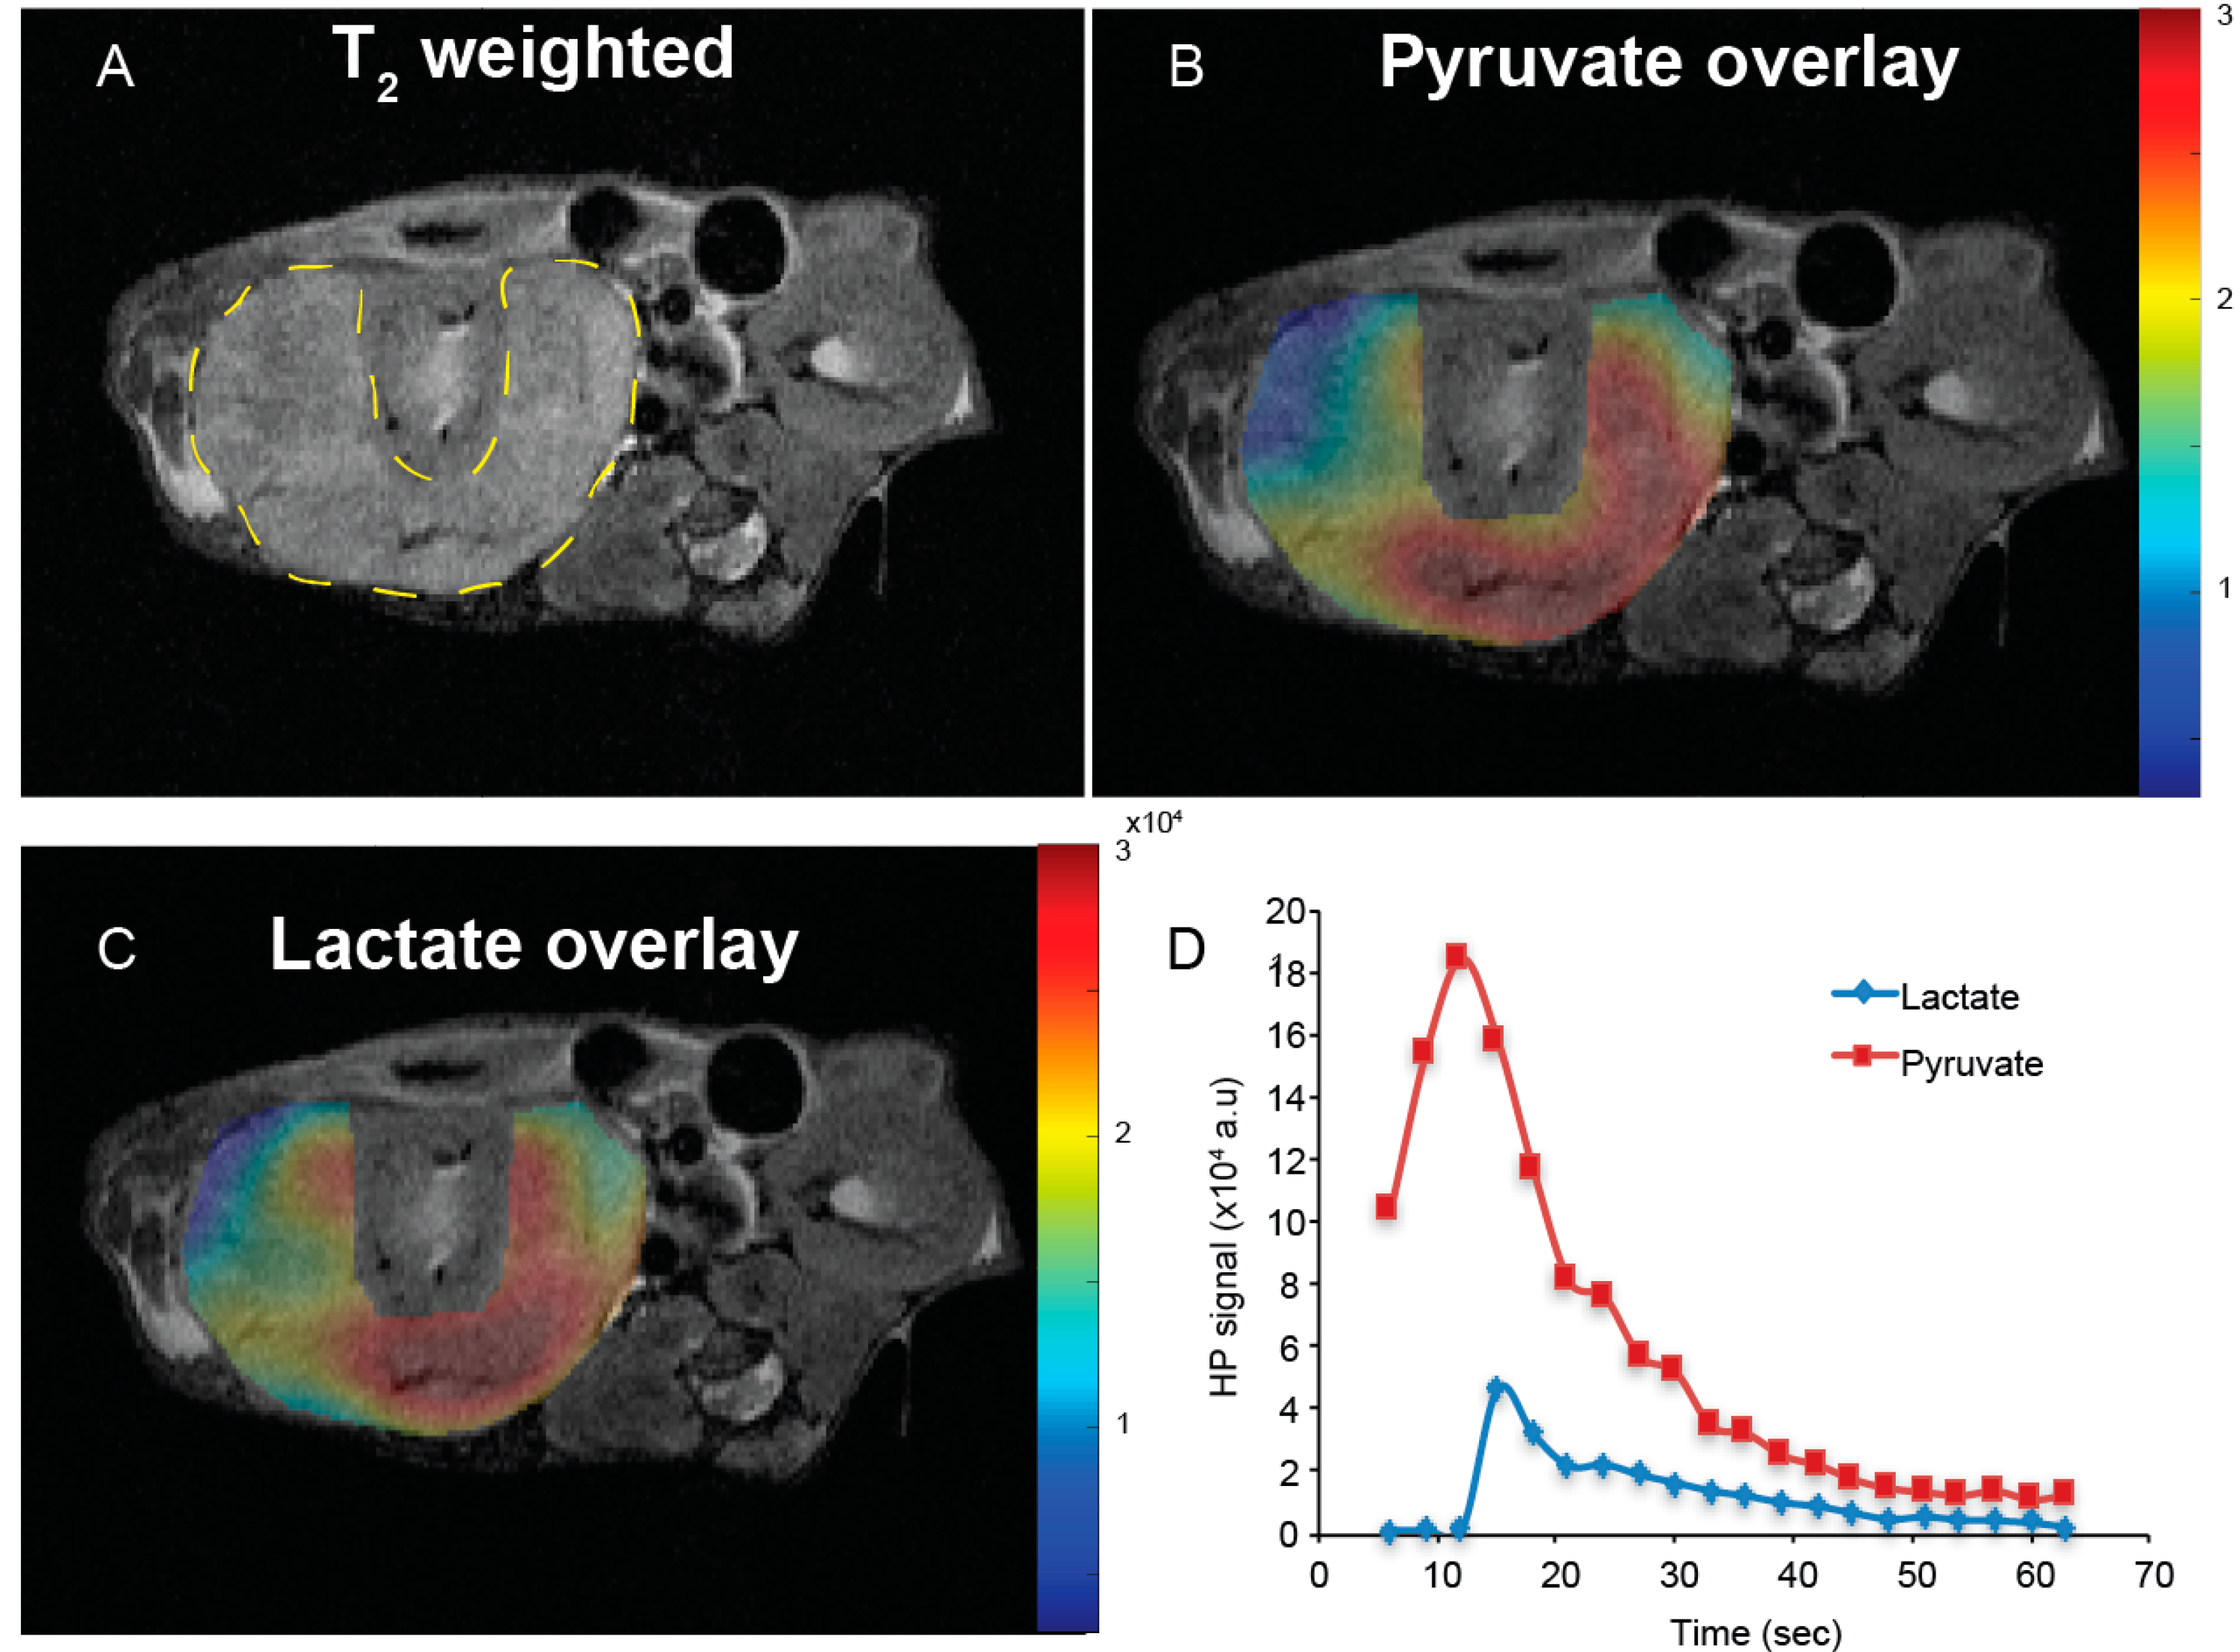
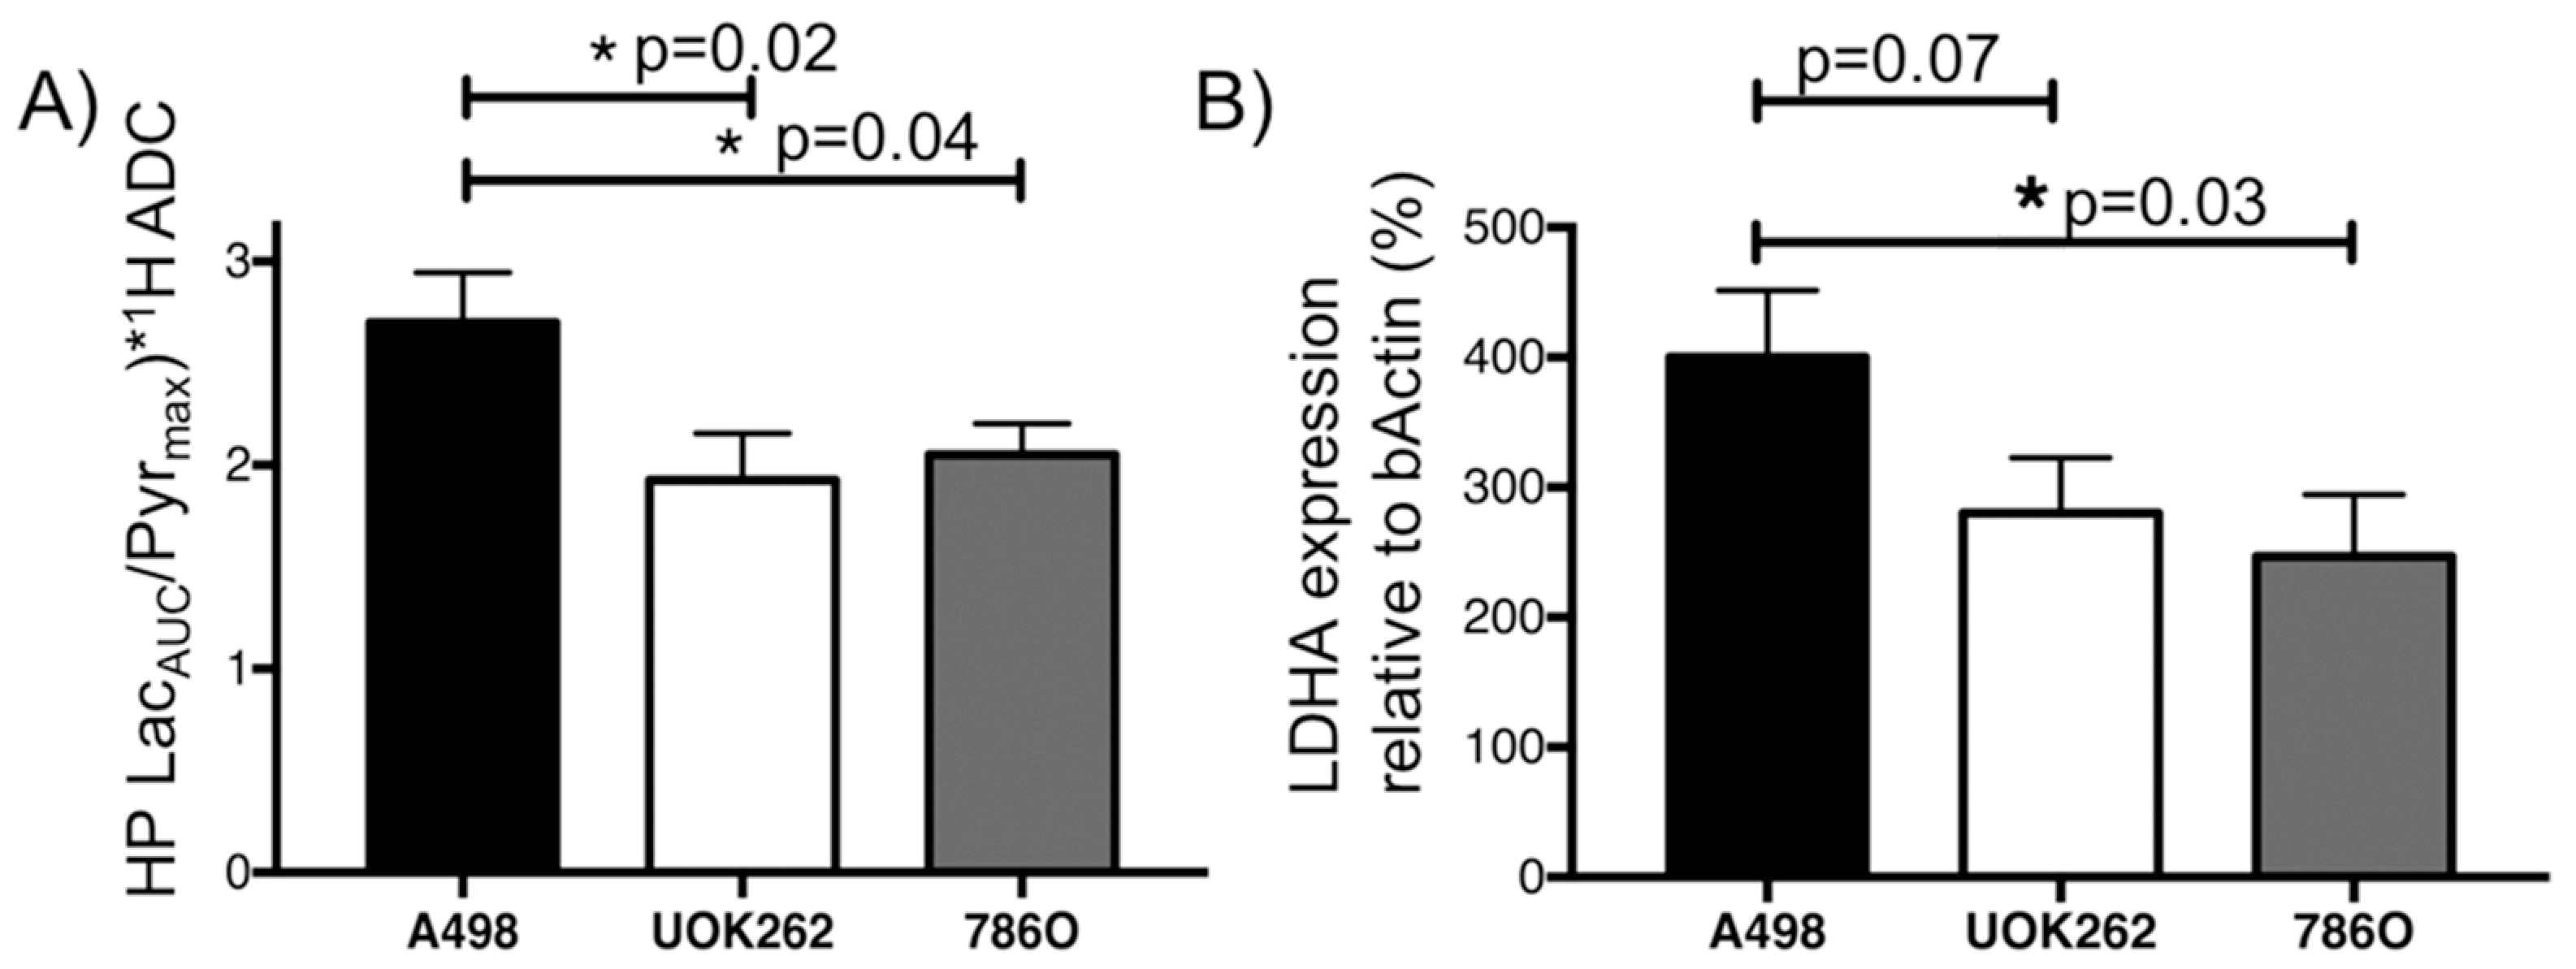
2.2. Dynamic HP 13C MRI to Interrogate Pyruvate-to-Lactate Conversion
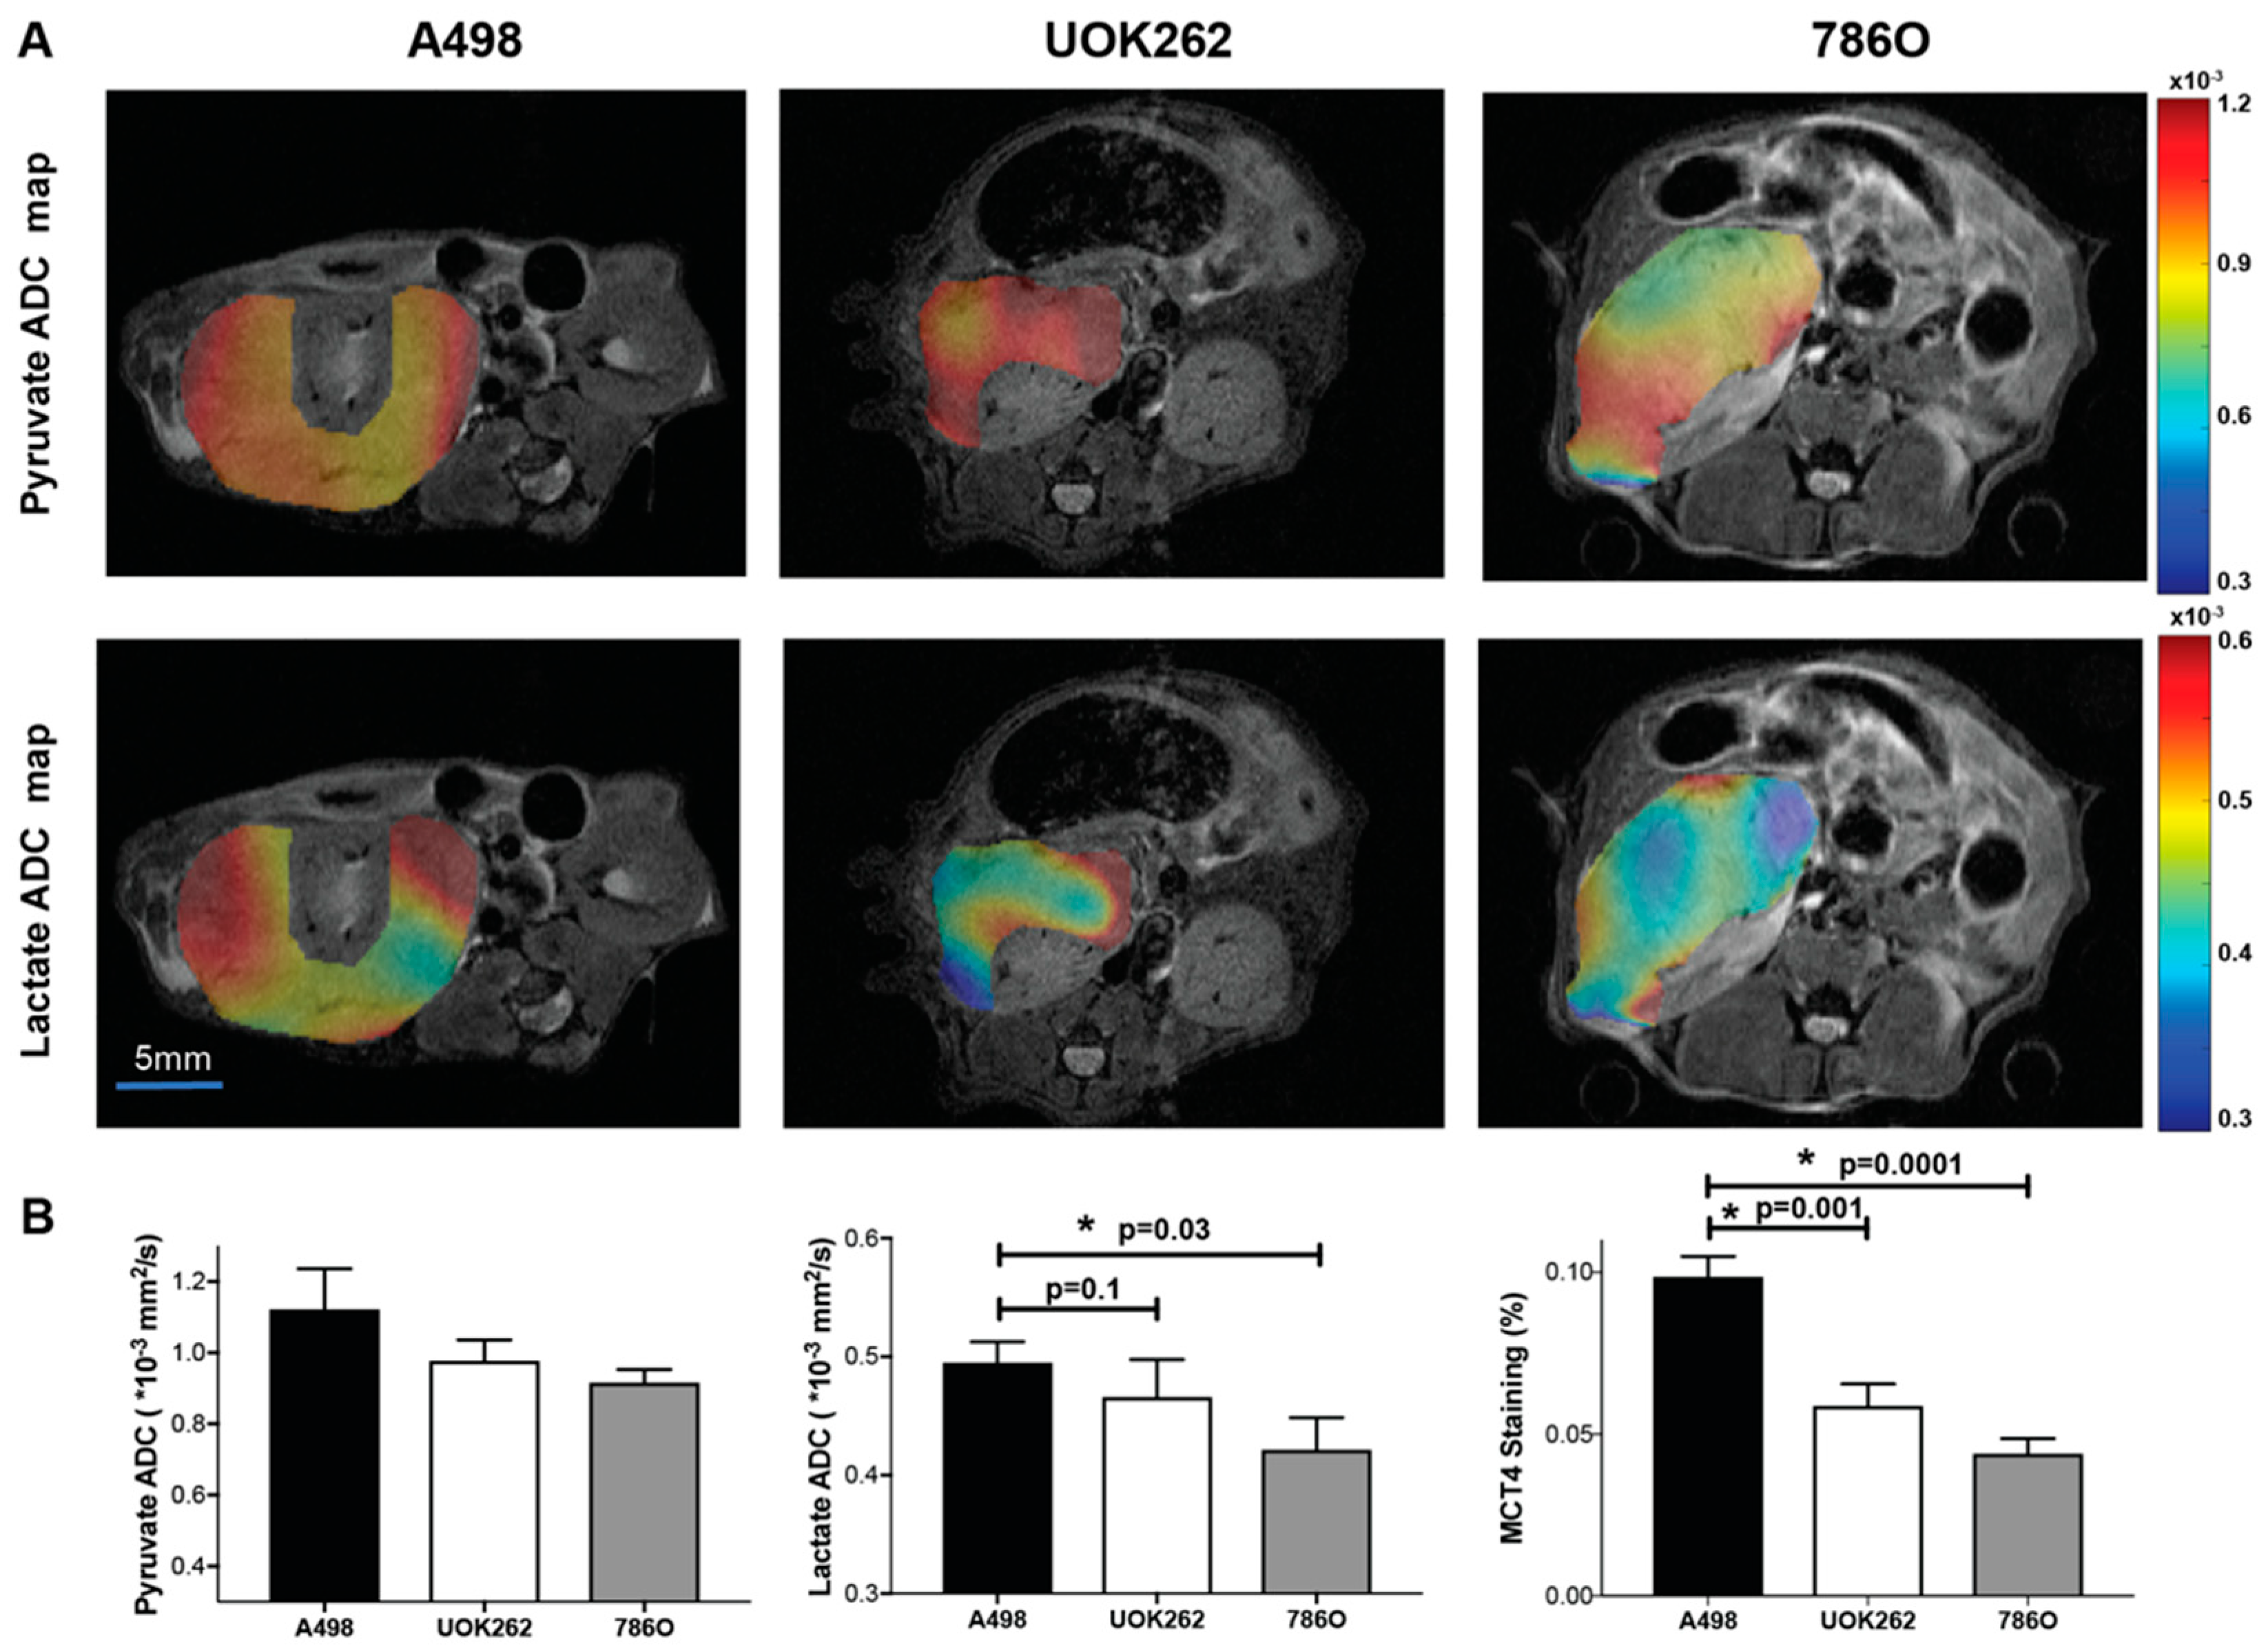
2.3. Diffusion Weighted HP 13C MRI to Interrogate Lactate Compartmentalization
3. Discussion
4. Materials and Methods
4.1. Cell Lines
4.2. Murine Orthotopic RCC Model
4.3. 1H and HP 13C MRI
4.4. MRI Data Analysis
4.5. LDHA Expression Assay
4.6. H&E and MCT4 Staining, and Imaging Analysis
4.7. Statistical Analysis
5. Conclusions
Supplementary Materials
Author Contributions
Funding
Acknowledgments
Conflicts of Interest
References
- Hollingsworth, J.M.; Miller, D.C.; Daignault, S.; Hollenbeck, B.K. Rising incidence of small renal masses: A need to reassess treatment effect. J. Natl. Cancer Inst. 2006, 98, 1331–1334. [Google Scholar] [CrossRef] [PubMed]
- Patard, J.J. Incidental renal tumours. Curr. Opin. Urol. 2009, 19, 454–458. [Google Scholar] [CrossRef] [PubMed]
- Rothman, J.; Egleston, B.; Wong, Y.N.; Iffrig, K.; Lebovitch, S.; Uzzo, R.G. Histopathological characteristics of localized renal cell carcinoma correlate with tumor size: A SEER analysis. J. Urol. 2009, 181, 29–33; discussion 33-24. [Google Scholar] [PubMed]
- Thompson, R.H.; Hill, J.R.; Babayev, Y.; Cronin, A.; Kaag, M.; Kundu, S.; Bernstein, M.; Coleman, J.; Dalbagni, G.; Touijer, K.; et al. Metastatic renal cell carcinoma risk according to tumor size. J. Urol. 2009, 182, 41–45. [Google Scholar] [CrossRef] [PubMed]
- Campbell, S.; Uzzo, R.; Allaf, M.E.; Bass, E.B.; Cadeddu, J.A.; Chang, A.; Clark, P.E.; Pierorazio, P.M.; Davis, B.J.; Derweesh, I.H.; et al. Renal Mass and Localized Renal Cancer: AUA Guideline. Availabe online. J. Urol. 2017, 198, 520–529. [Google Scholar] [CrossRef] [PubMed]
- Welch, H.G.; Skinner, J.S.; Schroeck, F.R.; Zhou, W.; Black, W.C. Regional Variation of Computed Tomographic Imaging in the United States and the Risk of Nephrectomy. JAMA Intern. Med. 2018, 178, 221–227. [Google Scholar] [CrossRef] [PubMed]
- Snyder, M.E.; Bach, A.; Kattan, M.W.; Raj, G.V.; Reuter, V.E.; Russo, P. Incidence of benign lesions for clinically localized renal masses smaller than 7 cm in radiological diameter: Influence of sex. J. Urol. 2006, 176, 2391–2395; discussion 2395–2396. [Google Scholar] [CrossRef] [PubMed]
- Murphy, A.M.; Buck, A.M.; Benson, M.C.; McKiernan, J.M. Increasing detection rate of benign renal tumors: Evaluation of factors predicting for benign tumor histologic features during past two decades. Urology 2009, 73, 1293–1297. [Google Scholar] [CrossRef] [PubMed]
- Kutikov, A.; Fossett, L.K.; Ramchandani, P.; Tomaszewski, J.E.; Siegelman, E.S.; Banner, M.P.; Van Arsdalen, K.N.; Wein, A.J.; Malkowicz, S.B. Incidence of benign pathologic findings at partial nephrectomy for solitary renal mass presumed to be renal cell carcinoma on preoperative imaging. Urology 2006, 68, 737–740. [Google Scholar] [CrossRef] [PubMed]
- Leveridge, M.J.; Finelli, A.; Kachura, J.R.; Evans, A.; Chung, H.; Shiff, D.A.; Fernandes, K.; Jewett, M.A. Outcomes of small renal mass needle core biopsy, nondiagnostic percutaneous biopsy, and the role of repeat biopsy. Eur. Urol. 2011, 60, 578–584. [Google Scholar] [CrossRef] [PubMed]
- Patel, H.D.; Johnson, M.H.; Pierorazio, P.M.; Sozio, S.M.; Sharma, R.; Iyoha, E.; Bass, E.B.; Allaf, M.E. Diagnostic Accuracy and Risks of Biopsy in the Diagnosis of a Renal Mass Suspicious for Localized Renal Cell Carcinoma: Systematic Review of the Literature. J. Urol. 2016, 195, 1340–1347. [Google Scholar] [CrossRef] [PubMed] [Green Version]
- Harris, C.R.; Whitson, J.M.; Meng, M.V. Under-grading of <4 cm renal masses on renal biopsy. BJU Int. 2012, 110, 794–797. [Google Scholar] [CrossRef]
- Bernhard, J.C.; Bigot, P.; Pignot, G.; Baumert, H.; Zini, L.; Lang, H.; Crepel, M.; Monod, P.; Salomon, L.; Bellec, L.; et al. The accuracy of renal tumor biopsy: Analysis from a national prospective study. World J. Urol. 2014. [Google Scholar] [CrossRef] [PubMed]
- Gatenby, R.A.; Gawlinski, E.T.; Gmitro, A.F.; Kaylor, B.; Gillies, R.J. Acid-mediated tumor invasion: A multidisciplinary study. Cancer Res. 2006, 66, 5216–5223. [Google Scholar] [CrossRef] [PubMed]
- Sudarshan, S.; Karam, J.A.; Brugarolas, J.; Thompson, R.H.; Uzzo, R.; Rini, B.; Margulis, V.; Patard, J.J.; Escudier, B.; Linehan, W.M. Metabolism of kidney cancer: From the lab to clinical practice. Eur. Urol. 2013, 63, 244–251. [Google Scholar] [CrossRef] [PubMed]
- Linehan, W.M.; Srinivasan, R.; Schmidt, L.S. The genetic basis of kidney cancer: A metabolic disease. Nat. Rev. Urol. 2010, 7, 277–285. [Google Scholar] [CrossRef] [PubMed]
- Van der Mijn, J.C.; Panka, D.J.; Geissler, A.K.; Verheul, H.M., Jr.; Mier, J.W. Novel drugs that target the metabolic reprogramming in renal cell cancer. Cancer Metab. 2016, 4, 14. [Google Scholar] [CrossRef] [PubMed]
- Wettersten, H.I.; Aboud, O.A.; Lara, P.N.; Weiss, R.H. Metabolic reprogramming in clear cell renal cell carcinoma. Nat. Rev. Nephrol. 2017. [Google Scholar] [CrossRef] [PubMed]
- Wettersten, H.I.; Hakimi, A.A.; Morin, D.; Bianchi, C.; Johnstone, M.E.; Donohoe, D.R.; Trott, J.F.; Aboud, O.A.; Stirdivant, S.; Neri, B.; et al. Grade-Dependent Metabolic Reprogramming in Kidney Cancer Revealed by Combined Proteomics and Metabolomics Analysis. Cancer Res. 2015, 75, 2541–2552. [Google Scholar] [CrossRef] [PubMed] [Green Version]
- Girgis, H.; Masui, O.; White, N.M.; Scorilas, A.; Rotondo, F.; Seivwright, A.; Gabril, M.; Filter, E.R.; Girgis, A.H.; Bjarnason, G.A.; et al. Lactate dehydrogenase A is a potential prognostic marker in clear cell renal cell carcinoma. Mol. Cancer 2014, 13, 101. [Google Scholar] [CrossRef] [PubMed]
- Masui, O.; White, N.M.; DeSouza, L.V.; Krakovska, O.; Matta, A.; Metias, S.; Khalil, B.; Romaschin, A.D.; Honey, R.J.; Stewart, R.; et al. Quantitative proteomic analysis in metastatic renal cell carcinoma reveals a unique set of proteins with potential prognostic significance. Mol. Cell. Proteomics 2013, 12, 132–144. [Google Scholar] [CrossRef] [PubMed]
- White, N.M.; Newsted, D.W.; Masui, O.; Romaschin, A.D.; Siu, K.W.; Yousef, G.M. Identification and validation of dysregulated metabolic pathways in metastatic renal cell carcinoma. Tumour. Biol. 2014, 35, 1833–1846. [Google Scholar] [CrossRef] [PubMed]
- Halestrap, A.P.; Price, N.T. The proton-linked monocarboxylate transporter (MCT) family: Structure, function and regulation. Biochem. J. 1999, 343, 281–299. [Google Scholar] [CrossRef] [PubMed]
- Harris, T.; Eliyahu, G.; Frydman, L.; Degani, H. Kinetics of hyperpolarized 13C1-pyruvate transport and metabolism in living human breast cancer cells. Proc. Natl. Acad. Sci. USA 2009, 106, 18131–18136. [Google Scholar] [CrossRef] [PubMed]
- Kim, Y.; Choi, J.W.; Lee, J.H.; Kim, Y.S. Expression of lactate/H(+) symporters MCT1 and MCT4 and their chaperone CD147 predicts tumor progression in clear cell renal cell carcinoma: Immunohistochemical and The Cancer Genome Atlas data analyses. Hum. Pathol. 2015, 46, 104–112. [Google Scholar] [CrossRef] [PubMed]
- Gerlinger, M.; Santos, C.R.; Spencer-Dene, B.; Martinez, P.; Endesfelder, D.; Burrell, R.A.; Vetter, M.; Jiang, M.; Saunders, R.E.; Kelly, G.; et al. Genome-wide RNA interference analysis of renal carcinoma survival regulators identifies MCT4 as a Warburg effect metabolic target. J. Pathol. 2012, 227, 146–156. [Google Scholar] [CrossRef] [PubMed] [Green Version]
- Ardenkjaer-Larsen, J.H.; Fridlund, B.; Gram, A.; Hansson, G.; Hansson, L.; Lerche, M.H.; Servin, R.; Thaning, M.; Golman, K. Increase in signal-to-noise ratio of > 10,000 times in liquid-state NMR. Proc. Natl. Acad. Sci. USA 2003, 100, 10158–10163. [Google Scholar] [CrossRef] [PubMed] [Green Version]
- Keshari, K.R.; Sriram, R.; Koelsch, B.L.; Van Criekinge, M.; Wilson, D.M.; Kurhanewicz, J.; Wang, Z.J. Hyperpolarized 13C-pyruvate magnetic resonance reveals rapid lactate export in metastatic renal cell carcinomas. Cancer Res. 2013, 73, 529–538. [Google Scholar] [CrossRef] [PubMed]
- Albers, M.J.; Bok, R.; Chen, A.P.; Cunningham, C.H.; Zierhut, M.L.; Zhang, V.Y.; Kohler, S.J.; Tropp, J.; Hurd, R.E.; Yen, Y.F.; et al. Hyperpolarized 13C lactate, pyruvate, and alanine: Noninvasive biomarkers for prostate cancer detection and grading. Cancer Res. 2008, 68, 8607–8615. [Google Scholar] [CrossRef] [PubMed]
- Keshari, K.R.; Sriram, R.; Van Criekinge, M.; Wilson, D.M.; Wang, Z.J.; Vigneron, D.B.; Peehl, D.M.; Kurhanewicz, J. Metabolic reprogramming and validation of hyperpolarized 13C lactate as a prostate cancer biomarker using a human prostate tissue slice culture bioreactor. Prostate 2013, 73, 1171–1181. [Google Scholar] [CrossRef] [PubMed]
- Chen, H.Y.; Larson, P.E.Z.; Bok, R.A.; von Morze, C.; Sriram, R.; Delos Santos, R.; Delos Santos, J.; Gordon, J.W.; Bahrami, N.; Ferrone, M.; et al. Assessing Prostate Cancer Aggressiveness with Hyperpolarized Dual-Agent 3D Dynamic Imaging of Metabolism and Perfusion. Cancer Res. 2017, 77, 3207–3216. [Google Scholar] [CrossRef] [PubMed]
- Sogaard, L.V.; Schilling, F.; Janich, M.A.; Menzel, M.I.; Ardenkjaer-Larsen, J.H. In vivo measurement of apparent diffusion coefficients of hyperpolarized (1)(3)C-labeled metabolites. NMR Biomed. 2014, 27, 561–569. [Google Scholar] [CrossRef] [PubMed]
- Koelsch, B.L.; Reed, G.D.; Keshari, K.R.; Chaumeil, M.M.; Bok, R.; Ronen, S.M.; Vigneron, D.B.; Kurhanewicz, J.; Larson, P.E.Z. Rapid in vivo apparent diffusion coefficient mapping of hyperpolarized (13) C metabolites. Magn. Reson. Med. 2015, 74, 622–633. [Google Scholar] [CrossRef] [PubMed]
- Koelsch, B.L.; Sriram, R.; Keshari, K.R.; Leon Swisher, C.; Van Criekinge, M.; Sukumar, S.; Vigneron, D.B.; Wang, Z.J.; Larson, P.E.; Kurhanewicz, J. Separation of extra- and intracellular metabolites using hyperpolarized (13)C diffusion weighted MR. J. Magn. Reson. 2016, 270, 115–123. [Google Scholar] [CrossRef] [PubMed]
- Marco-Rius, I.; Gordon, J.W.; Mattis, A.N.; Bok, R.; Delos Santos, R.; Sukumar, S.; Larson, P.E.Z.; Vigneron, D.B.; Ohliger, M.A. Diffusion-weighted imaging of hyperpolarized [(13) C]urea in mouse liver. J. Magn. Reson. Imaging 2018, 47, 141–151. [Google Scholar] [CrossRef] [PubMed]
- Gordon, J.W.; Milshteyn, E.; Marco-Rius, I.; Ohliger, M.; Vigneron, D.B.; Larson, P.E.Z. Mis-estimation and bias of hyperpolarized apparent diffusion coefficient measurements due to slice profile effects. Magn. Reson. Med. 2017, 78, 1087–1092. [Google Scholar] [CrossRef] [PubMed]
- Kettunen, M.I.; Kennedy, B.W.; Hu, D.E.; Brindle, K.M. Spin echo measurements of the extravasation and tumor cell uptake of hyperpolarized [1-(13) C]lactate and [1-(13) C]pyruvate. Magn. Reson. Med. 2013, 70, 1200–1209. [Google Scholar] [CrossRef] [PubMed]
- Patrick, P.S.; Kettunen, M.I.; Tee, S.S.; Rodrigues, T.B.; Serrao, E.; Timm, K.N.; McGuire, S.; Brindle, K.M. Detection of transgene expression using hyperpolarized 13C urea and diffusion-weighted magnetic resonance spectroscopy. Magn. Reson. Med. 2015, 73, 1401–1406. [Google Scholar] [CrossRef] [PubMed]
- Manenti, G.; Di Roma, M.; Mancino, S.; Bartolucci, D.A.; Palmieri, G.; Mastrangeli, R.; Miano, R.; Squillaci, E.; Simonetti, G. Malignant renal neoplasms: Correlation between ADC values and cellularity in diffusion weighted magnetic resonance imaging at 3 T. Radiol. Med. 2008, 113, 199–213. [Google Scholar] [CrossRef] [PubMed]
- Sriram, R.; Van Criekinge, M.; DeLos Santos, J.; Keshari, K.R.; Wilson, D.M.; Peehl, D.; Kurhanewicz, J.; Wang, Z.J. Non-invasive differentiation of benign renal tumors from clear cell renal cell carcinomas using clinically translatable hyperpolarized (13)C pyruvate magnetic resonance. Tomography 2016, 2, 35–42. [Google Scholar] [CrossRef] [PubMed]
- Chawla, S.N.; Crispen, P.L.; Hanlon, A.L.; Greenberg, R.E.; Chen, D.Y.; Uzzo, R.G. The natural history of observed enhancing renal masses: Meta-analysis and review of the world literature. J. Urol. 2006, 175, 425–431. [Google Scholar] [CrossRef]
- Frank, I.; Blute, M.L.; Cheville, J.C.; Lohse, C.M.; Weaver, A.L.; Zincke, H. Solid renal tumors: An analysis of pathological features related to tumor size. J. Urol. 2003, 170, 2217–2220. [Google Scholar] [CrossRef] [PubMed]
- Gerlinger, M.; Rowan, A.J.; Horswell, S.; Larkin, J.; Endesfelder, D.; Gronroos, E.; Martinez, P.; Matthews, N.; Stewart, A.; Tarpey, P.; et al. Intratumor heterogeneity and branched evolution revealed by multiregion sequencing. N. Engl. J. Med. 2012, 366, 883–892. [Google Scholar] [CrossRef] [PubMed]
- Nelson, S.J.; Kurhanewicz, J.; Vigneron, D.B.; Larson, P.E.; Harzstark, A.L.; Ferrone, M.; van Criekinge, M.; Chang, J.W.; Bok, R.; Park, I.; et al. Metabolic imaging of patients with prostate cancer using hyperpolarized [1-(1)(3)C]pyruvate. Sci. Transl. Med. 2013, 5, 198ra108. [Google Scholar] [CrossRef] [PubMed]
- Cunningham, C.H.; Lau, J.Y.; Chen, A.P.; Geraghty, B.J.; Perks, W.J.; Roifman, I.; Wright, G.A.; Connelly, K.A. Hyperpolarized 13C Metabolic MRI of the Human Heart: Initial Experience. Circ. Res. 2016, 119, 1177–1182. [Google Scholar] [CrossRef] [PubMed]
- Yang, Y.; Valera, V.A.; Padilla-Nash, H.M.; Sourbier, C.; Vocke, C.D.; Vira, M.A.; Abu-Asab, M.S.; Bratslavsky, G.; Tsokos, M.; Merino, M.J.; et al. UOK 262 cell line, fumarate hydratase deficient (FH-/FH-) hereditary leiomyomatosis renal cell carcinoma: In vitro and in vivo model of an aberrant energy metabolic pathway in human cancer. Cancer Genet. Cytogenet 2010, 196, 45–55. [Google Scholar] [CrossRef] [PubMed]
- Naito, S.; von Eschenbach, A.C.; Fidler, I.J. Different growth pattern and biologic behavior of human renal cell carcinoma implanted into different organs of nude mice. J. Natl. Cancer Inst. 1987, 78, 377–385. [Google Scholar] [PubMed]
- Naito, S.; von Eschenbach, A.C.; Giavazzi, R.; Fidler, I.J. Growth and metastasis of tumor cells isolated from a human renal cell carcinoma implanted into different organs of nude mice. Cancer Res. 1986, 46, 4109–4115. [Google Scholar] [PubMed]
- Cunningham, C.H.; Chen, A.P.; Lustig, M.; Hargreaves, B.A.; Lupo, J.; Xu, D.; Kurhanewicz, J.; Hurd, R.E.; Pauly, J.M.; Nelson, S.J.; et al. Pulse sequence for dynamic volumetric imaging of hyperpolarized metabolic products. J. Magn. Reson. 2008, 193, 139–146. [Google Scholar] [CrossRef] [PubMed] [Green Version]
- Xing, Y.; Reed, G.D.; Pauly, J.M.; Kerr, A.B.; Larson, P.E. Optimal variable flip angle schemes for dynamic acquisition of exchanging hyperpolarized substrates. J. Magn. Reson. 2013, 234, 75–81. [Google Scholar] [CrossRef] [PubMed] [Green Version]
- Carpenter, A.E.; Jones, T.R.; Lamprecht, M.R.; Clarke, C.; Kang, I.H.; Friman, O.; Guertin, D.A.; Chang, J.H.; Lindquist, R.A.; Moffat, J.; et al. CellProfiler: Image analysis software for identifying and quantifying cell phenotypes. Genome Biol. 2006, 7, R100. [Google Scholar] [CrossRef] [PubMed]


© 2018 by the authors. Licensee MDPI, Basel, Switzerland. This article is an open access article distributed under the terms and conditions of the Creative Commons Attribution (CC BY) license (http://creativecommons.org/licenses/by/4.0/).
Share and Cite
Sriram, R.; Gordon, J.; Baligand, C.; Ahamed, F.; Delos Santos, J.; Qin, H.; Bok, R.A.; Vigneron, D.B.; Kurhanewicz, J.; Larson, P.E.Z.; et al. Non-Invasive Assessment of Lactate Production and Compartmentalization in Renal Cell Carcinomas Using Hyperpolarized 13C Pyruvate MRI. Cancers 2018, 10, 313. https://doi.org/10.3390/cancers10090313
Sriram R, Gordon J, Baligand C, Ahamed F, Delos Santos J, Qin H, Bok RA, Vigneron DB, Kurhanewicz J, Larson PEZ, et al. Non-Invasive Assessment of Lactate Production and Compartmentalization in Renal Cell Carcinomas Using Hyperpolarized 13C Pyruvate MRI. Cancers. 2018; 10(9):313. https://doi.org/10.3390/cancers10090313
Chicago/Turabian StyleSriram, Renuka, Jeremy Gordon, Celine Baligand, Fayyaz Ahamed, Justin Delos Santos, Hecong Qin, Robert A. Bok, Daniel B. Vigneron, John Kurhanewicz, Peder E. Z. Larson, and et al. 2018. "Non-Invasive Assessment of Lactate Production and Compartmentalization in Renal Cell Carcinomas Using Hyperpolarized 13C Pyruvate MRI" Cancers 10, no. 9: 313. https://doi.org/10.3390/cancers10090313