Investigations on a Mesoporous Glass Membrane as Ion Separator for a Redox Flow Battery

1
Department of Chemical and Environmental Engineering, University of Cincinnati, Cincinnati, OH 45221, USA
2
State Key Laboratory of Material-Oriented Chemical Engineering, Nanjing University of Technology, Nanjing 210009, China
*
Author to whom correspondence should be addressed.
Batteries 2019, 5(1), 6; https://doi.org/10.3390/batteries5010006
Submission received: 17 August 2018
/
Revised: 12 November 2018
/
Accepted: 17 December 2018
/
Published: 5 January 2019
(This article belongs to the Special Issue Vanadium Redox Flow Battery and Its Applications)
Abstract
:This article reports extensive studies of a Vycor® porous glass (VPG) membrane as an ion separator for an all-vanadium redox flow battery (VRFB). The VPG membrane had an average pore size of 4 nm and porosity of ~28%. The VPG ion separator exhibited higher proton diffusivity but lower conductivity than the Nafion® 117 membrane because the former is intrinsically nonionic. The VRFB equipped with the VPG ion separator (VPG-VRFB) exhibited much better stability during long-term cyclic operation than the VRFB equipped with the Nafion-117 membrane (Nafion-VRFB) because the ionic Nafion membrane could be contaminated by vanadium ions exchanged into the water channels. This increases its area specific resistance, while the VPG does not have ion exchange capacity and hence has less vanadium ion contamination. The VPG-VRFB was found to outperform the Nafion-VRFB in energy efficiency (EE) during long-term cyclic operation although the former underperformed the latter in the initial period of continued operation. The VPG ion separator also showed markedly better thermal stability and temperature tolerance than the Nafion membrane as indicated by the significantly smaller losses of EE and discharge capacity for the VPG-VRFB than for the Nafion-VRFB after operating at 45 °C. The outstanding temperature tolerance of the VPG ion separator is due primarily to its rigid and non-swelling pore structure and nonionic nature, which are highly resistant to thermal distortion and vanadium ion contamination. The excellent temperature tolerance of the VPG may be useful for applications where temperature control is difficult.
1. Introduction
Redox flow batteries (RFBs) are promising for large-scale electrical energy storage, which is necessary for broader penetration of renewable solar and wind powers into the commercial electric grids [1,2,3]. Among many RFBs that utilize a variety of redox ion couples, the all-vanadium RFB (VRFB) originally developed by Skyllas-Kazacos and co-workers at UNSW Sydney has been most intensively studied in the literature [4,5,6,7]. The two half-cell reactions at the VRFB positive and negative electrodes are the following,
where the forward reactions are for the discharging process and the reverse reactions are for the charging process. The operation of a whole battery is enabled by an ion separator, which is sandwiched in between the two electrodes to allow proton transport for balancing charge and completing the electric circuit while preventing crossover of the reactive metal ions. The ion separator plays a major role in determining the RFB efficiency, lifespan, and cost. The key properties of the ion separator relevant to its performance in the RFB include ion conductivity with no electronic conductivity, ion selectivity, and chemical and structural stabilities. The ion flux (Ji) through an electrolyte membrane can be described by the following Nernst–Plank equation, which considers both the concentration gradient () and electric potential gradient () driving forces along the membrane thickness,
where and are the concentration and diffusivity of ion i in the membrane, respectively; F and zi are the Faraday constant and ion charge number, respectively; and T and R are temperature and universal gas constant, respectively. When operating as ion separator in the RFB, the internal current by conduction of ion i (Ii) and the area specific resistance (ASR) or conductivity (σ) for ion i are therefore expressed by
where δ and Am are the thickness and active area of the membrane. The proton-to-vanadium ion (Vn+) transport selectivity () is defined as the ratio of their fluxes,
As shown by Equations (1) and (3), the ion transport selectivity and conductivity are both determined by the ion permeability () in the membrane.
It is obvious that the development of a high-performance ion separator is essentially looking for membrane materials and structures to provide maximum permeability for proton ( given by the greatest and ) and minimum metal ion permeability (; i.e., smallest and/or ). Here, ion concentration is the value inside the membrane material but not the concentration in the electrolyte solution external to the membrane (). Absolute proton/metal ion separation is obtained when and/or are zero in the proton-permeable membranes. However, the proton transport rate can be adversely affected by a steric hindering effect when slow moving metal ions () exist in the membrane pores.
Conventional RFB ion separators are ion exchange membranes (IEMs) made of ionic polymers, most famously Nafion®, which is a sulfonated fluoropolymer–copolymer widely considered as a benchmark material possessing necessary chemical stability and reasonable ion conductivity [8,9,10,11]. In the ionic polymers like Nafion, nanometer-sized water channels (~2.5 nm in width [12]) and pockets (dia. ~4 nm) form by self-organization of the sulfonated sidechain terminals under full hydration. These water channels with large amount of surface functional groups [−SO3]−·H+ provide fast proton transport but limited ion selectivity because of their relatively large width and structural flexibility. These nanometer-scale flexible water channels can accommodate a small amount of metal ions that in turn cause metal ion crossover to increase self-discharge and decrease efficiency for the RFB [13]. Therefore, it is common practice to use large thicknesses (>100 μm) for polymeric ion separators to reduce metal ion crossover rates. In recent years, extensive efforts have been made in searching for ion separators with perfect ion selectivity, low ASR, and long-term stability, to improve the energy efficiency, power density, lifetime, and ultimately cost-effectiveness of the RFBs [14,15]. While the majority of the efforts in developing RFB ion separators have been focused on polymeric and polymer-based composite membranes, some nanoporous ceramic membranes have also been demonstrated as potential RFB ion separators with the most attractive advantage of improved ion-selectivity and structural stability as compared to the conventional ionic polymer membranes.
In aqueous solutions, water molecules are attracted to the positively charged metal ions (Mn+) to form hydration shells (i.e., [Mn+·mH2O], where m is the hydration number varying with the charge and size of metal ion mostly in a range of 4–10. The hydrated metal ions are much bigger in kinetic diameters (dk >0.6 nm) than the hydrated proton (mostly hydronium, H3O+, dk ~0.27 nm). Ceramic membranes, both crystalline and amorphous, have greater controllability of pore geometry and pore size uniformity as compared to the polymeric membranes, and thus high-selectivity transport of proton over metal ions in aqueous electrolyte solutions can be achieved by the size-exclusion mechanism and/or steric effect depending on the size of the membrane pore openings. The effectiveness of ion separation in aqueous solutions by the highly selective size discrimination mechanisms also relies on the rigid and non-swelling pore structures of ceramic materials. Yang et al. [16] first demonstrated the size exclusion effect between proton and vanadium ions on the crystalline membrane of silicalite, a nonionic pure-silica MFI type zeolite with ordered pores of uniform diameter dp = 0.56 nm. Molecular dynamics study also indicated that vanadium ions involved in the VRFB are too large to enter pores of diameter (dp) <0.6 nm [17]. However, because of its nonionic surface, the silicalite membrane exhibited large ASR that led to low voltage efficiency for the VRFB. Xu et al. [18,19] later studied membranes of T-type zeolite (dp ~0.41 nm [20]) and ZSM-5 zeolite (i.e., Al-containing MFI structure, dp ~0.56 nm) as ion separators for the VRFB. Both the T-type and ZSM-5 zeolite membranes were able to achieve proton permeation selectivity higher than the Nafion 117 membrane by more than an order of magnitude because their uniform pore sizes are appropriate for the size-exclusion mechanism. Meanwhile, both the T-type and ZSM-5 zeolites have enormous populations of exchangeable protons at the alumina sites in framework surface ([AlO2]−·H+).
While the ionic sieve membranes of subnanometer pores (e.g., zeolites) are theoretically capable of achieving absolute proton selectivity against vanadium ions, it has been demonstrated in the literature that ceramic membranes with much larger pore sizes can also achieve decent proton selectivity because of steric effects and surface electrostatic repulsions (Donnan effect). In general, ion diffusivity and hence conductivity increases while selectivity decreases on increasing the membrane pore size. Michos and coworkers [21] observed that the Vycor® glass membrane (Corning Inc., Corning, New York, NY, USA) with pore size of 4 nm exhibited values comparable to Nafion 117 membrane and obtained good efficiencies when operated as ion separator in the VRFB. Yan et al. [22] investigated a sol-gel derived titania membrane as ion separator for VRFB and found that a membrane with an average pore diameter of 2.7 nm was able to drastically reduce the vanadium ion crossover and mitigate capacity loss as compared to the Nafion 117 membrane. More recently, Mögelin et al. [23] conducted a detailed study on the effects of pore size of homemade porous glass membranes on the performance as ion separators for VRFB. They found that a pore size of ~8 nm gave the highest energy efficiency (EE) but the voltage efficiency (VE) and Coulombic efficiency (CE) did not show clear dependencies on the pore size in the range of 2–50 nm. Nevertheless, the open circuit voltage (OCV) decay tests showed strong evidence of dramatically reduced vanadium ion crossover in a glass membrane with pore size of ~2.5 nm as compared to the Nafion 117 membrane although the latter had a similar nominal water channel diameter (dp ~2.5 nm). Such a difference in metal ion separation capability may be related to the rigid and non-swelling pore structure of the glass membrane that made it more difficult for the hydrated vanadium ions to enter as compared to the flexible pore openings of the swollen Nafion membranes.
Although the microporous and mesoporous ceramic membranes have shown promises for application as ion separators for RFBs, research and understanding of ion transport and conduction in relation to flow battery operation are still in an early stage. Here, we report the experimental studies on a nanoporous Vycor glass membrane for its ion transport properties and performance as an ion separator in the VRFB. Particularly, the effects of operating temperature on the performance of this Vycor® porous glass (VPG) ion separator are investigated in comparison with the benchmark Nafion 117 membrane. The ability of tolerating large variations of temperature is highly desired for RFB storage because intensive temperature control could be very costly especially for solar and wind power plants in remote areas.
2. Results and Discussion
2.1. Membrane Pore Size and Chemical Composition
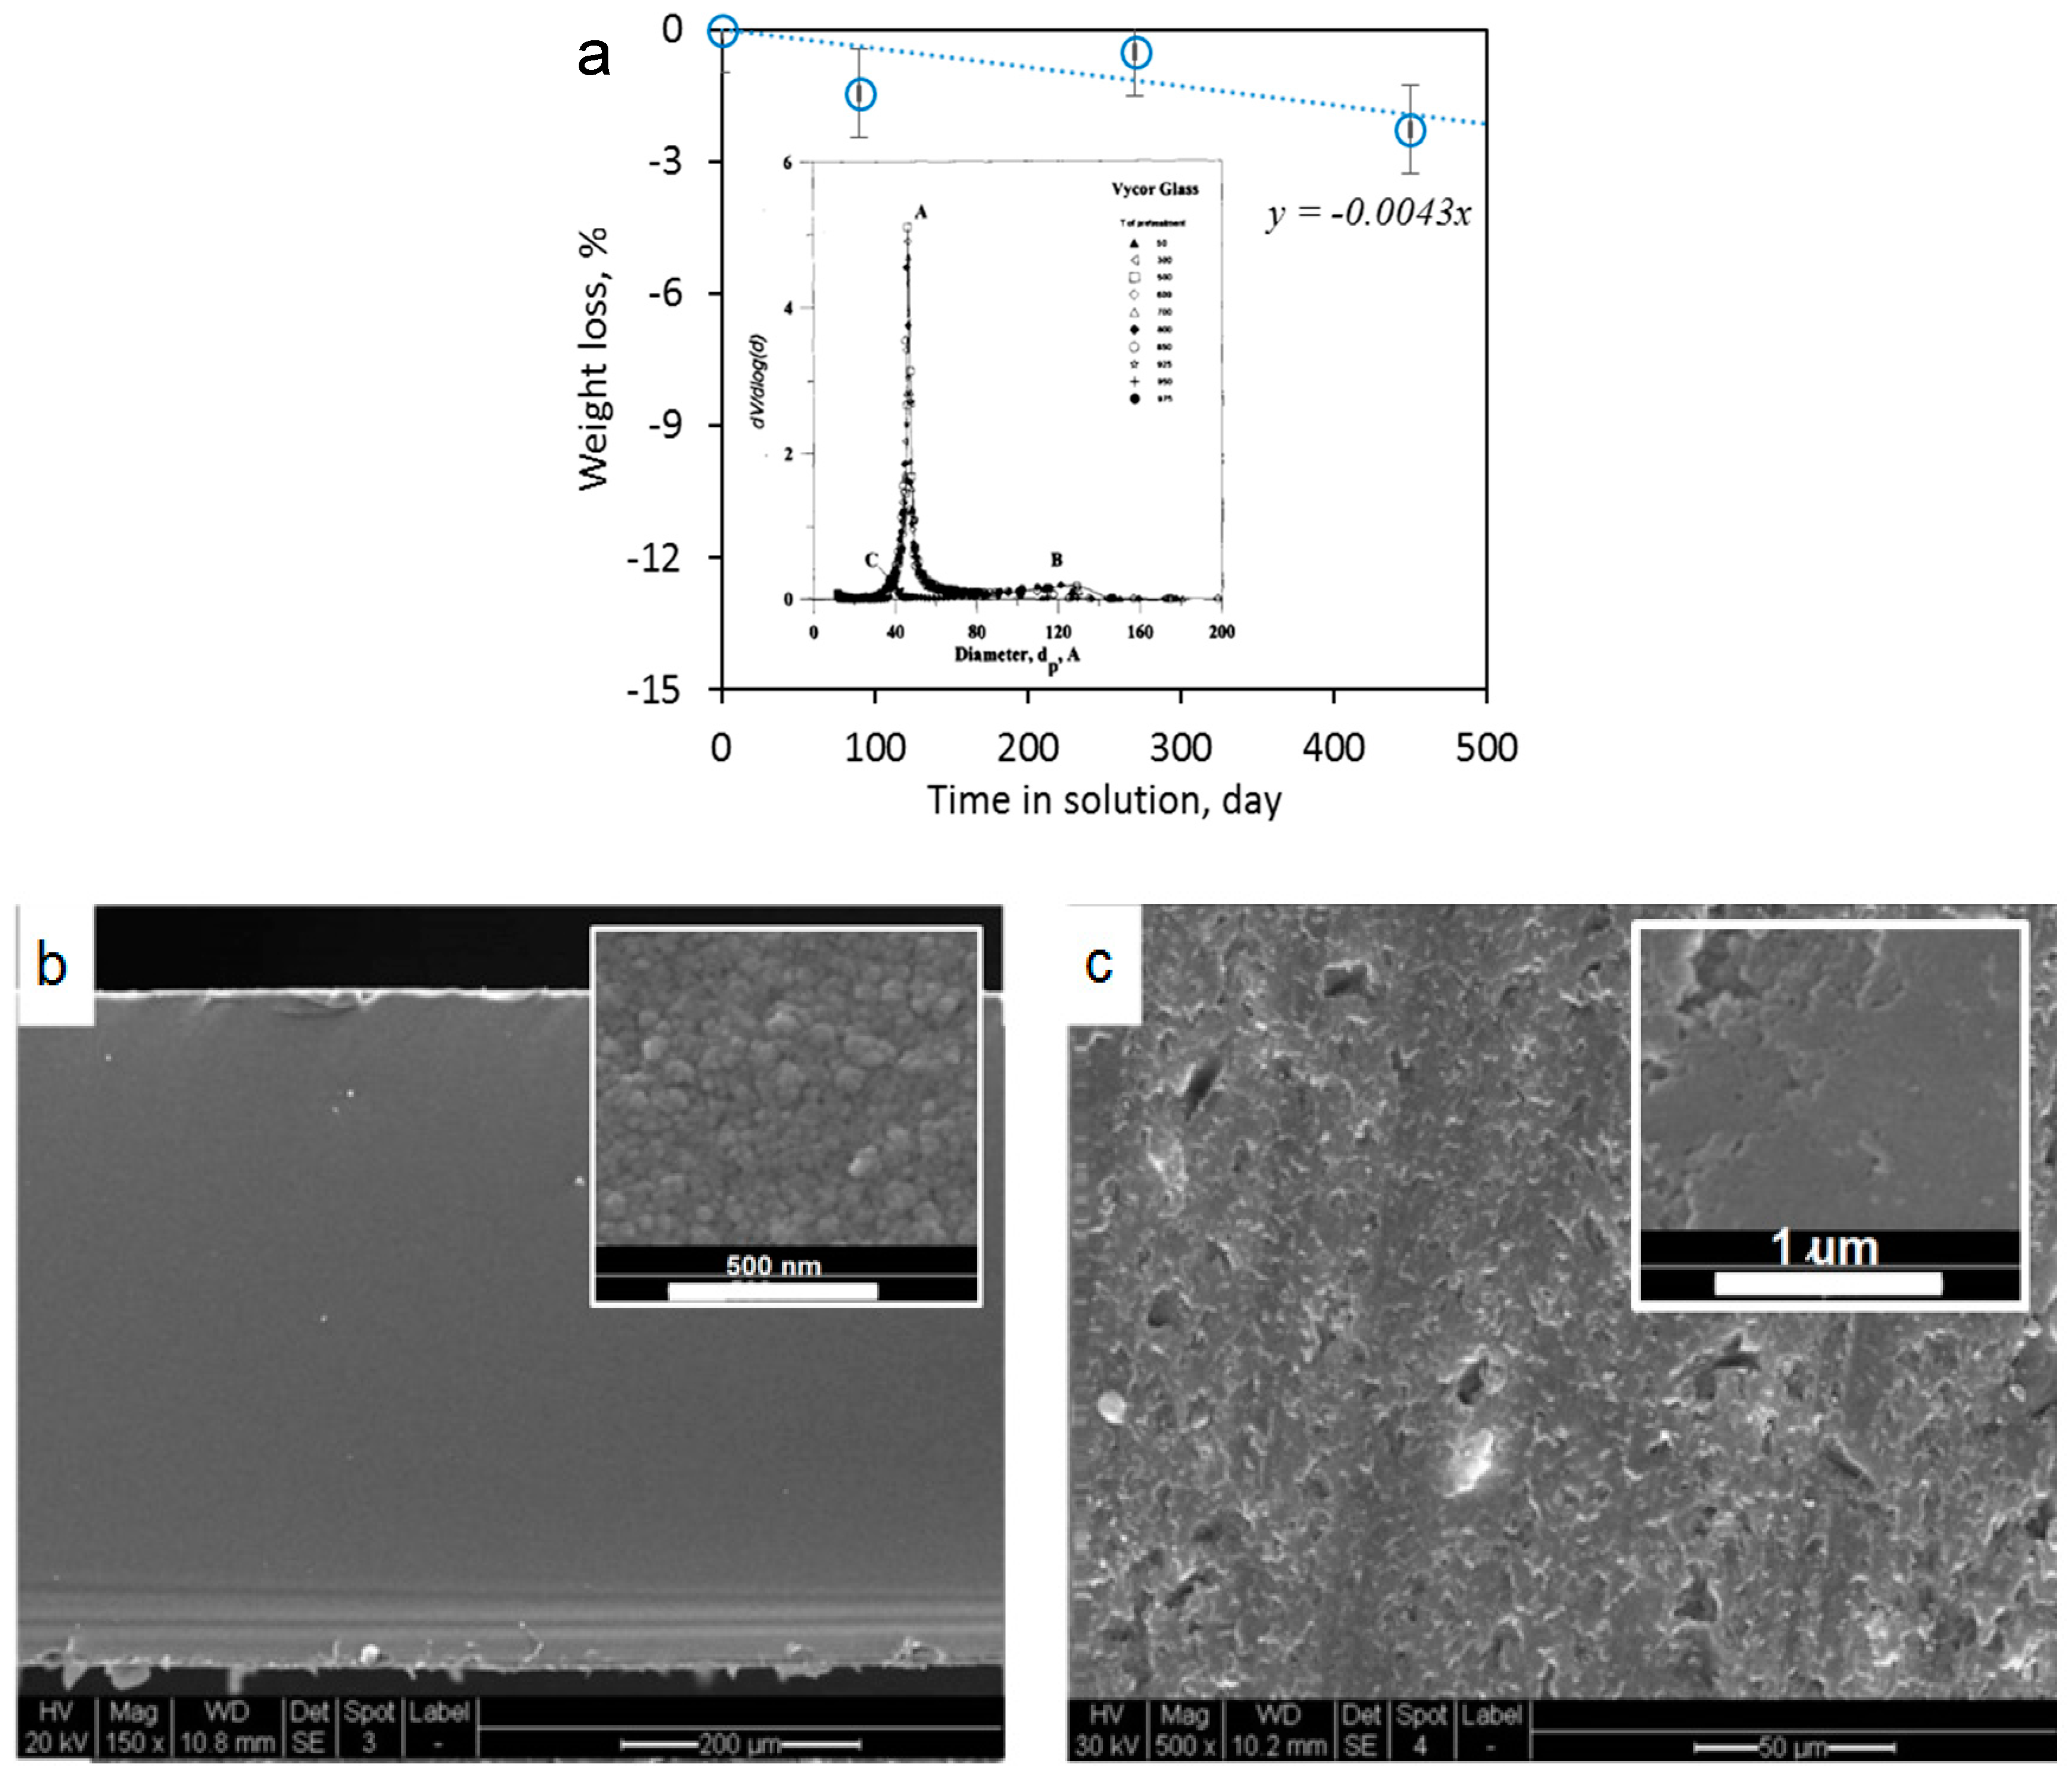
The VPG membrane (Vycor® 7930, Corning) studied in this work has been extensively characterized in the literature for its pore structure and investigated for gas and vapor separations and ultrafiltration of liquid. It has a rather uniform pore size distribution with an average dp of ~4 nm (see insert of Figure 1a), porosity of ~28% and chemical composition of in weight ratio [24]. To examine its chemical stability in the highly acidic and oxidizing solution of VRFB, a VPG membrane disc was immersed in a solution of 2 M V5+ (VO2+) in 2 M H2SO4, which is the most aggressive solution involved in the VRFB operation, for over a year during which the weight of the completely washed and dried (2 h at 200 °C) disc was monitored. The disc showed no structural changes by visual inspection and porosimetry test. The post-treatment VPG disc had a Brunauer-Emmett-Teller (BET) specific surface area of 248 m2/g, which was essentially the same as that of the fresh membrane. As shown in Figure 1a, the VPG membrane experienced only 1.57% (=0.0043% × 365) weight loss over an entire year. The SEM images of the VPG membrane are shown in Figure 1b,c.
2.2. Proton Transport Selectivity over Vanadium Ions
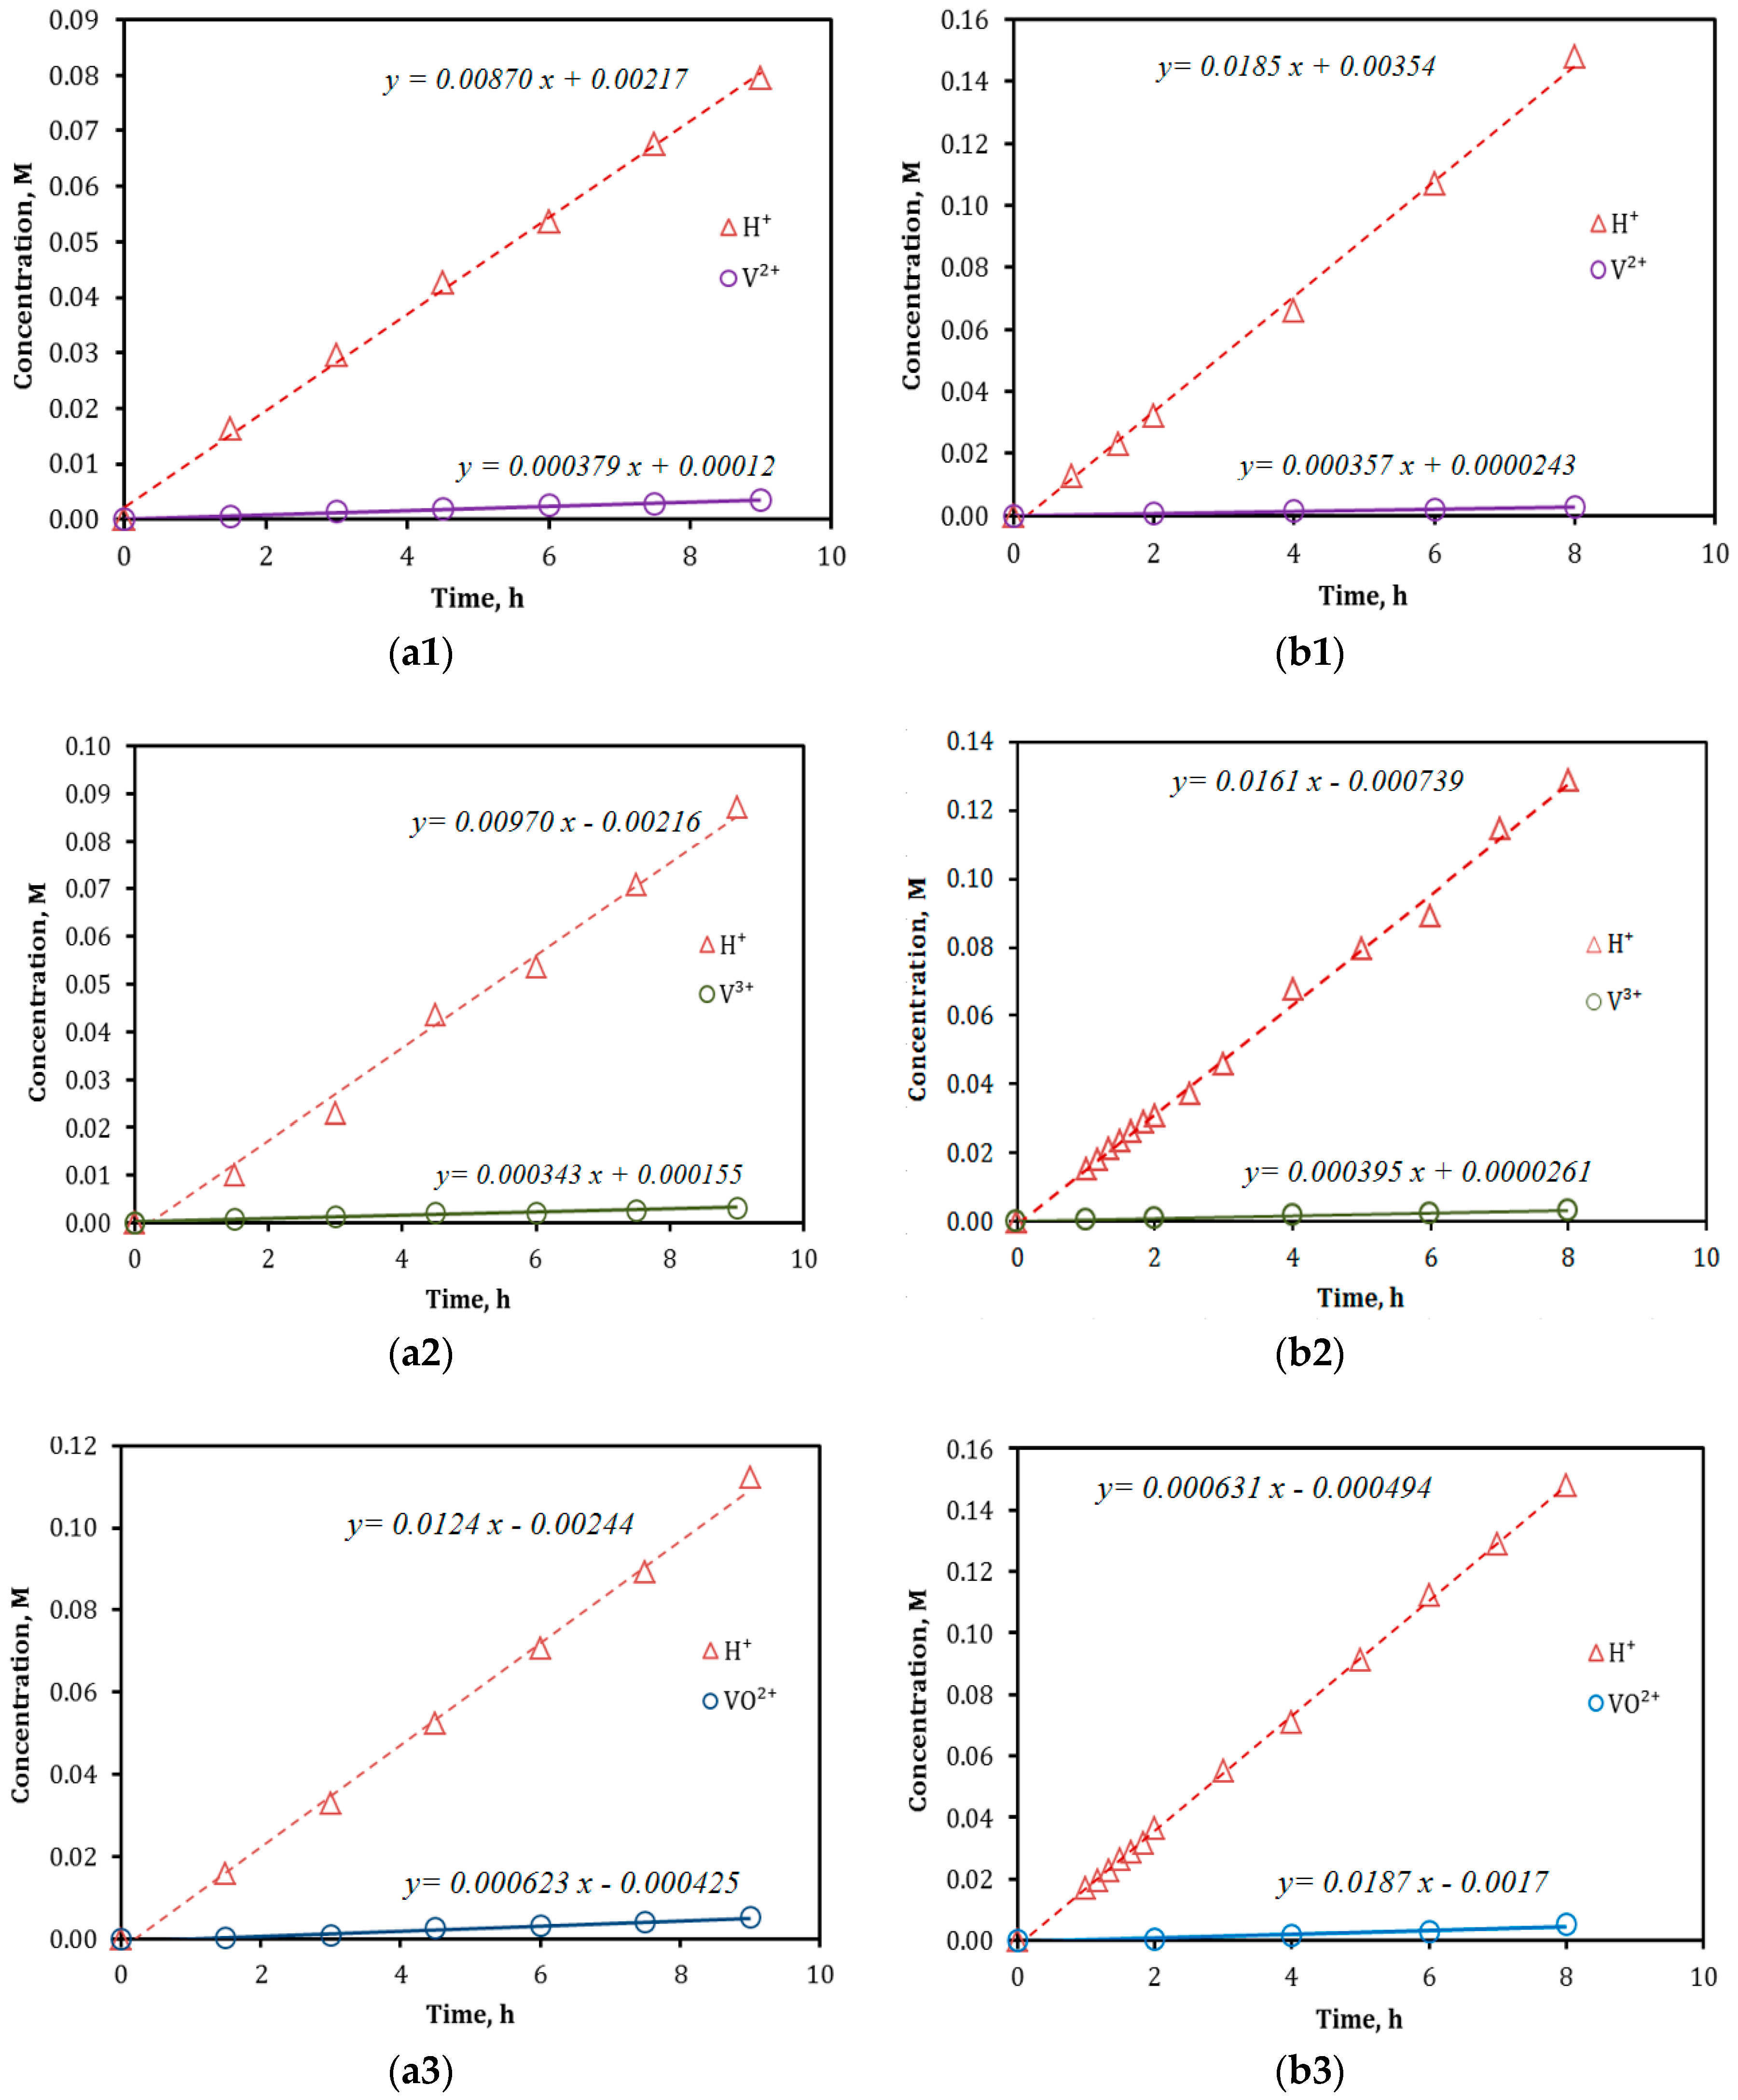
The results of ion diffusion (separation) measurements by the conventional permeation method for both VPG and Nafion membranes are presented in Figure 2. The ion fluxes obtained from the concentration-time dependencies (i.e., slopes of the linear fittings) in Figure 2 and the proton-to-vanadium ion transport selectivity () subsequently calculated by Equation (4) are summarized in Table 1. The overall ion transport coefficients of the membrane permeation, as defined by Equation (6) in later text, are calculated and listed in Table 1 as well. The VPG membrane exhibited proton selectivity over the vanadium ions of all valences that are 30%–50% lower than that by the Nafion-117 membrane. The higher rejection rates of the Vn+ on the Nafion-117 membrane may be attributed to its smaller pore size (dp ~2.5 nm in the “water channel” structure [12]) and stronger electrostatic repulsion effect at its highly ionic surface than the nonionic glass surface. Because of the larger pore size, the VPG membrane measured higher overall ion transport coefficients (Ki) than did the Nafion membrane for both proton (H3O+) and vanadium ions. The coefficient Ki is determined by resistances of both steps of ion entering and diffusing through the membrane pores [25,26]. However, because the thickness (δ) of the glass membrane (δ ~500 μm) was nearly three-times that of the Nafion-117 membrane (dry based δ ~183 μm), the former had vanadium ion fluxes comparable to those on the Nafion membrane but had moderately smaller proton flux than the latter.
Although both membranes have nominal pore sizes of nanometer scale that are large enough for all ions to enter and diffuse through, the transport coefficient and flux of H+ (H3O+ in aqueous solutions) appeared to be affected by the coexisting vanadium ions. The KH+ and JH+ was found to be higher when the coexisting vanadium ions also had greater overall transport coefficients and fluxes (e.g., VO2+ and VO2+). This observation suggests that, under the confinement of nanometer pore space, the transport of proton, including processes of entering the pore opening and diffusing through the pore channel, is hindered by the coexisting hydrated vanadium ions, which have much bigger kinetic sizes than the H3O+.
2.3. Existence of Vn+ in Membrane Pores
The existence and contents of the vanadium ions in the membranes’ porosity were investigated by energy dispersive X-ray spectroscopy (EDS) examination of the membrane samples after equilibrating in the acidic solution of each vanadium sulfate (2 M vanadium sulfate in 2 M H2SO4). The membrane samples were immersed in the electrolyte solution for 14 days to ensure equilibration of ion sorption.
Table 2 presents the results of EDS elemental survey over the external surfaces of the dried VPG and Nafion membranes. The contents of V2+ and V3+ were much higher in the Nafion than in the VPG membrane, indicating that exchange of these single-atomic metal ions with the protons likely occurred at the ionic surface in the Nafion membrane; while the nonionic VPG does not have ion exchange capacity and hence the contents of V2+ and V3+ were similarly low as those of VO2+ and VO2+. It is also apparent that ion exchange was far more extensive for V2+ than for V3+ in the Nafion because of the availability of exchange sites for the former (i.e. two adjacent “−SO3− H+” sites) is expected to be much larger than for the latter (i.e., three adjacent “−SO3− H+” sites). The attachments of metal ions to the surface and the entrances of nanometer-sized water channels of the Nafion membrane not only reduce the C′H+ at the membrane surface to lower the transport driving force but also create steric hindrance for proton (H3O+) to enter the water channels of Nafion. Thus, the proton flux and transport coefficient was the lowest in the Nafion when coexisting with the V2+.
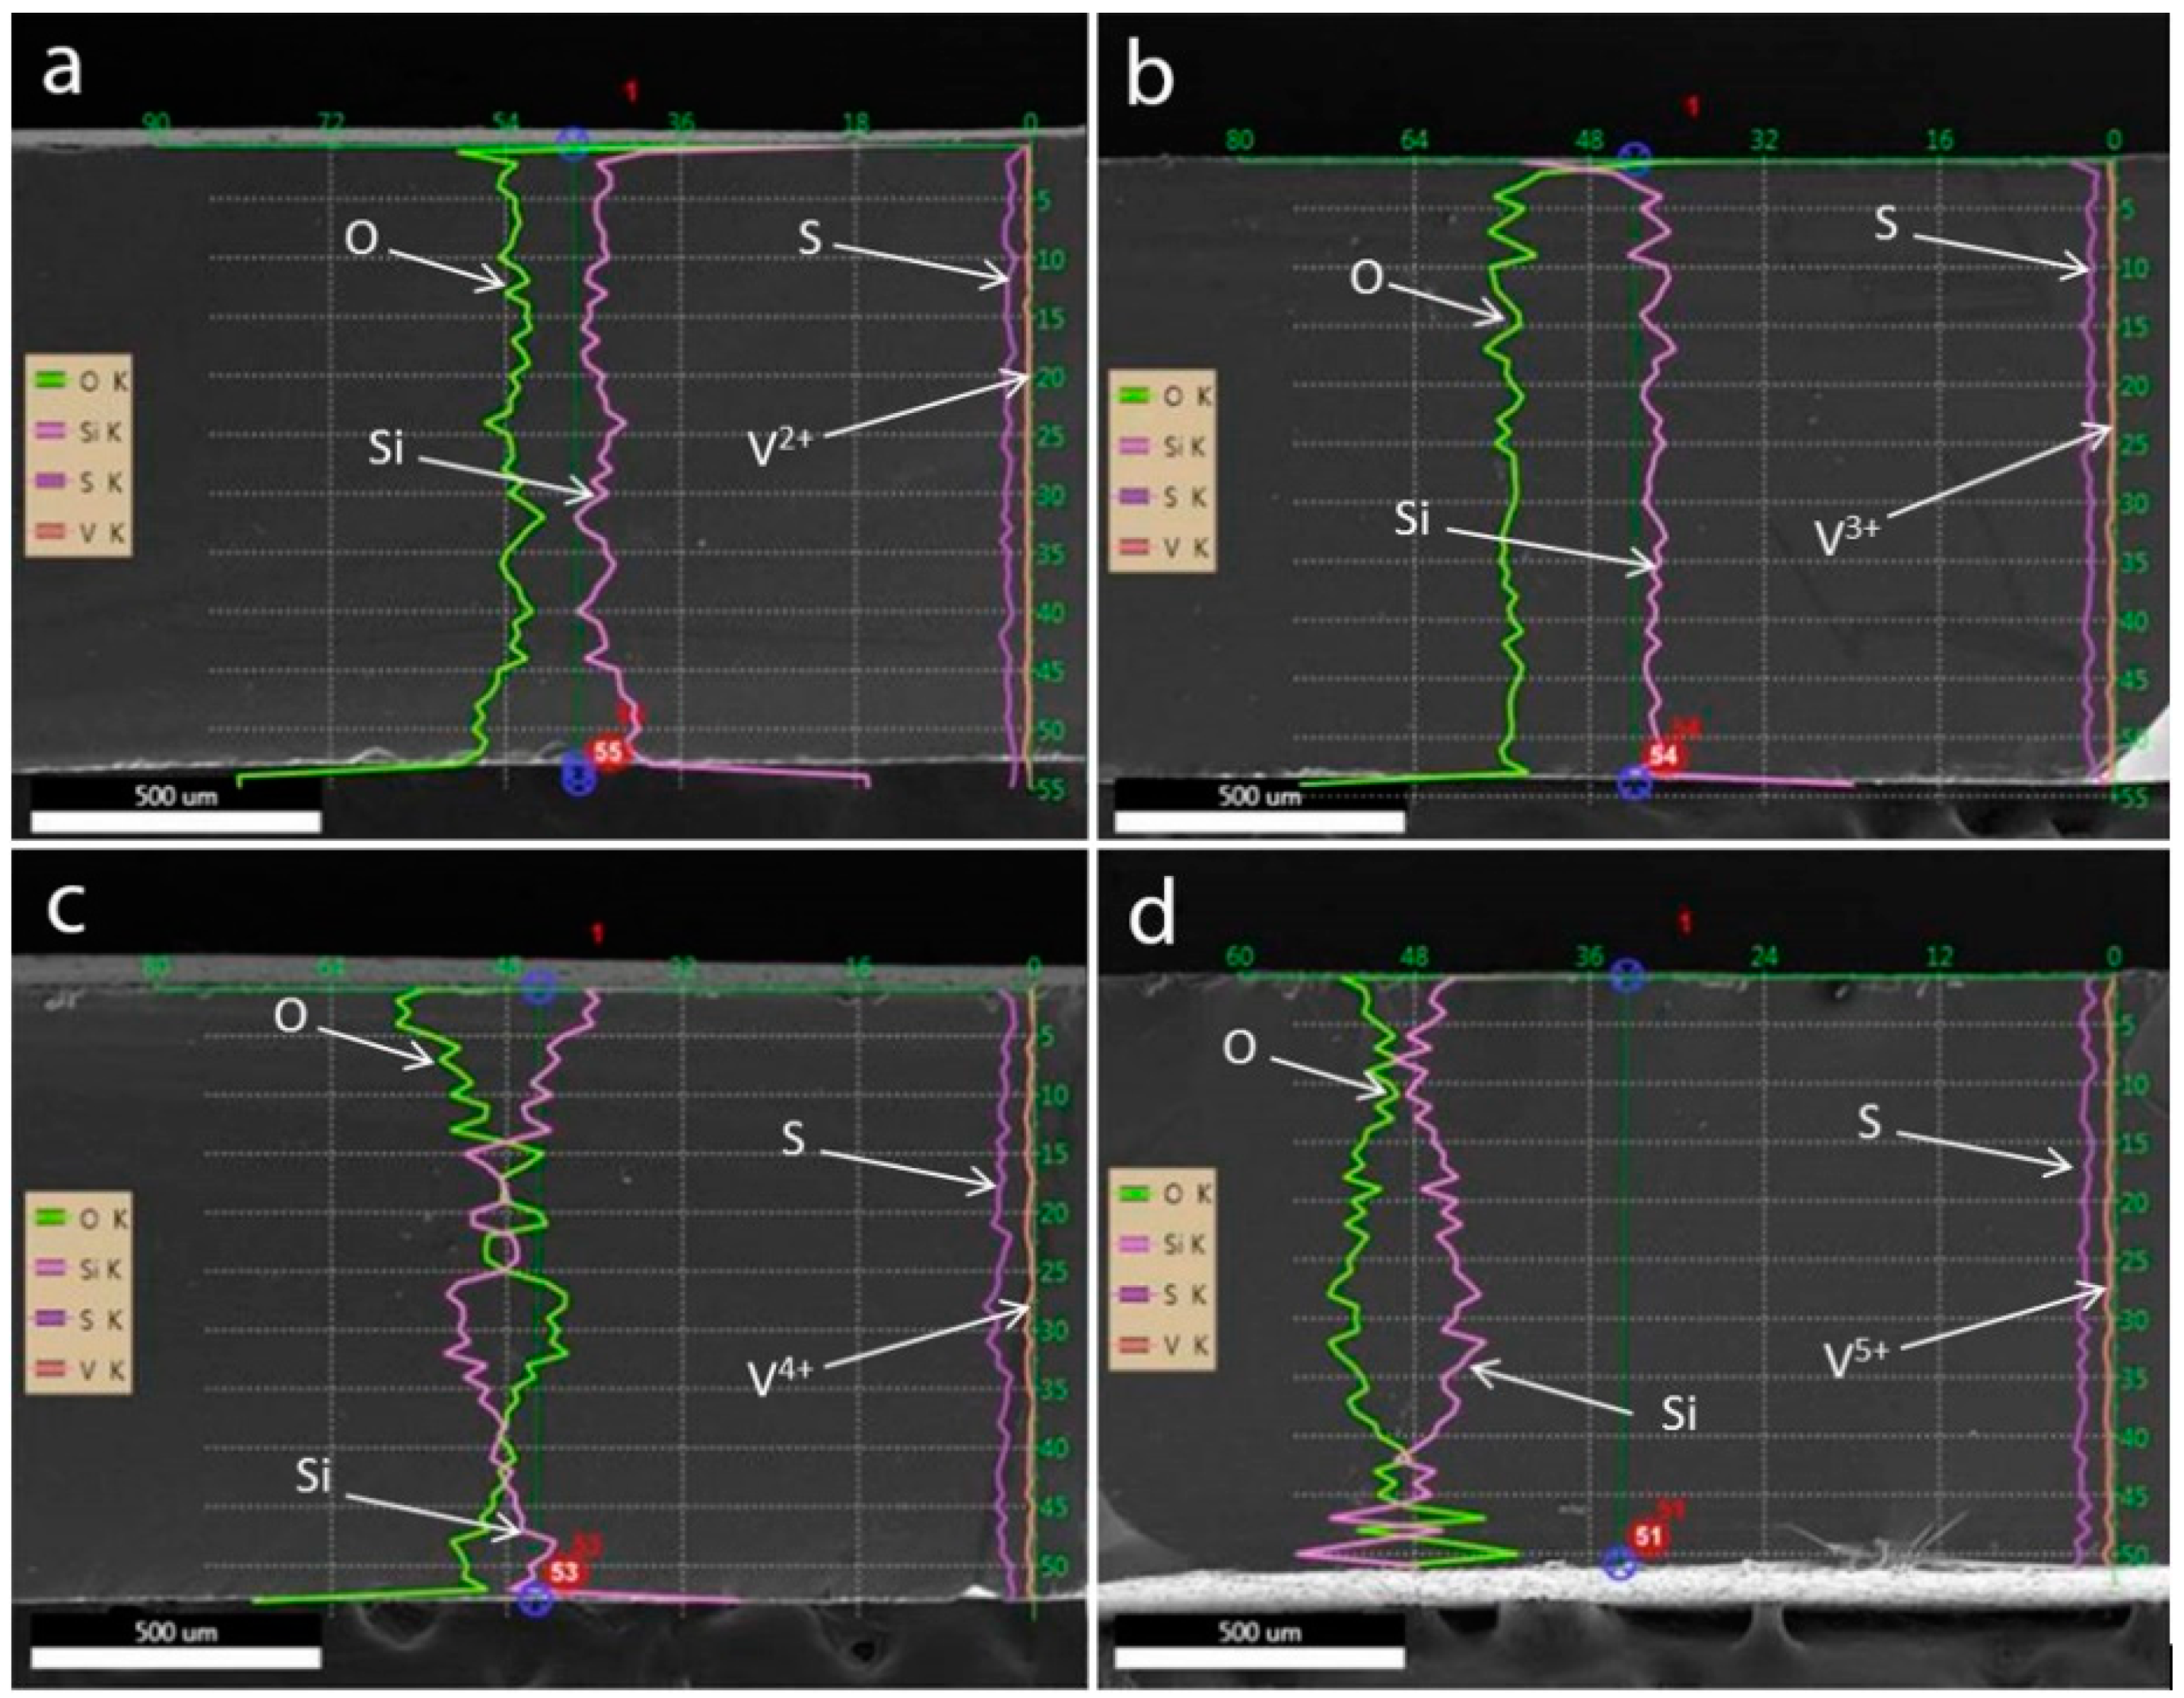
EDS line scan and point survey were also conducted along the thickness of the membrane cross-sections to observe the vanadium ion contents inside the ion separators and the results are presented in Figure 3 and Figure 4 for VPG and Nafion membrane samples, respectively. The membrane samples were also treated in each of the vanadium sulfate (V2+, V3+, VO2+, and VO2+) solutions in 2 M H2SO4. EDS elemental survey was also made by point analysis at locations of different distances from the membrane surfaces for the same VPG and Nafion membranes. The results of both EDS line-scan examination and point survey (Figure 5 and Figure 6) indicated that the contents of vanadium ions of all four oxidation states were very minor inside the membranes without significant variation at different depth. The vanadium ion contents were also similar in the VPG and Nafion membranes, indicating that presence of vanadium ions in the membrane porosity is rather minor. Thus, it can be concluded that the V2+ and V3+ contamination of the Nafion membrane happened primarily at its surface and much less deep inside the membrane.
2.4. Ion Conduction and Transport Diffusivity
EIS measurements were performed for the VRFB single cell when equipped with the VPG and Nafion ion separators, respectively, when both sides of the membrane were filled with H2SO4 solutions of identical concentration varying from 0.1 M to 2.0 M. The resultant EIS spectra are presented in Figure 7.
From the EIS data in Figure 7, the total resistance of the cell (Rcell) is obtain at Zimag = 0 Ω and then the ASR and ion conductivity (σ) of the VPG and Nanfion-117 membranes are calculated using Equation (3), as presented in Figure 8 and Figure 9, respectively [18,26]. The ion conductivity σ of both membranes increased with increasing acid concentration, i.e., CH+. However, the VPG membrane exhibited a much greater increase in σ with the acid solution concentration, namely from 0.5 × 10⁻² S/cm to 2.85 × 10⁻² S/cm, than the Nafion membrane of which the σ increased moderately from 3.5 × 10⁻² S/cm to 4.3 × 10⁻² S/cm (i.e., a 22.8% increase), when the H2SO4 concentration rose from 0.1 to 2.0 M. The largest difference in the dependence of σ on H2SO4 concentration between the two membranes was observed at low acid concentrations (e.g., 0.1 M) where the σ of the VPG (0.005 S/cm) was far less than the Nafion (0.43 S/cm) because VPG is nonionic and its ion conductivity relies on protons from the aqueous solution entering the porosity; on the contrary, Nafion carries a large amount of protons by the functional groups in its water channel structure and hence its σ is less sensitive to the acid solution concentration. The ion conductivity of Nafion membrane and its dependency on acid concentration observed in this work are consistent with literature reports [27].
The proton diffusivity values for the two membranes are calculated based on the conductivity data and the values determined by titration. The equilibrium inside the VPG membrane pore volume measured by titration method was 2.04 M when immersed in a 2 M H2SO4 solution at room temperature. Considering the experimental error, which was ±5%, the H2SO4 partitioning factor for the VPG membrane can be taken as 1.0, i.e., the H2SO4 concentration inside the VPG pores is approximately the same as that in the bulk solution. However, for estimating the from the membrane ASR, the needs to be on the basis of “membrane volume”, i.e., = (C′H+)VPG,Pore × ε, where ε is the VPG porosity and (C′H+)VPG,Pore is determined by titration. The estimated for the VPG membrane is presented as a function of acid concentration in Figure 10 The proton diffusivity in the VPG membrane decreased drastically from 7.8 × 10⁻⁹ m2/s in 0.1 M H2SO4 to 1.7 × 10⁻⁹ m2/s in 0.5 M H2SO4, which is opposite to the conductivity dependence on acid concentration; in the VPG continued to decrease but at a much smaller magnitude and tended to reach a constant as the H2SO4 concentration further increased from 0.5 to 2 M. The dependence of in the VPG pores on acid solution concentration suggests a change of the controlling transport mechanism from surface diffusion (since silica is protonated at high pH) and Grotthuss transfer at low to ordinary mass diffusion of H3O+ at high [27]. The proton diffusivity in the fully hydrated Nafion membrane was found to be lower than that in the VPG membrane and decreased more moderately with acid concentration increase because a high concentration of solvated protons exist intrinsically and its is relatively insensitive to the acid concentration in the surrounding solution [28].
2.5. OCV Decay
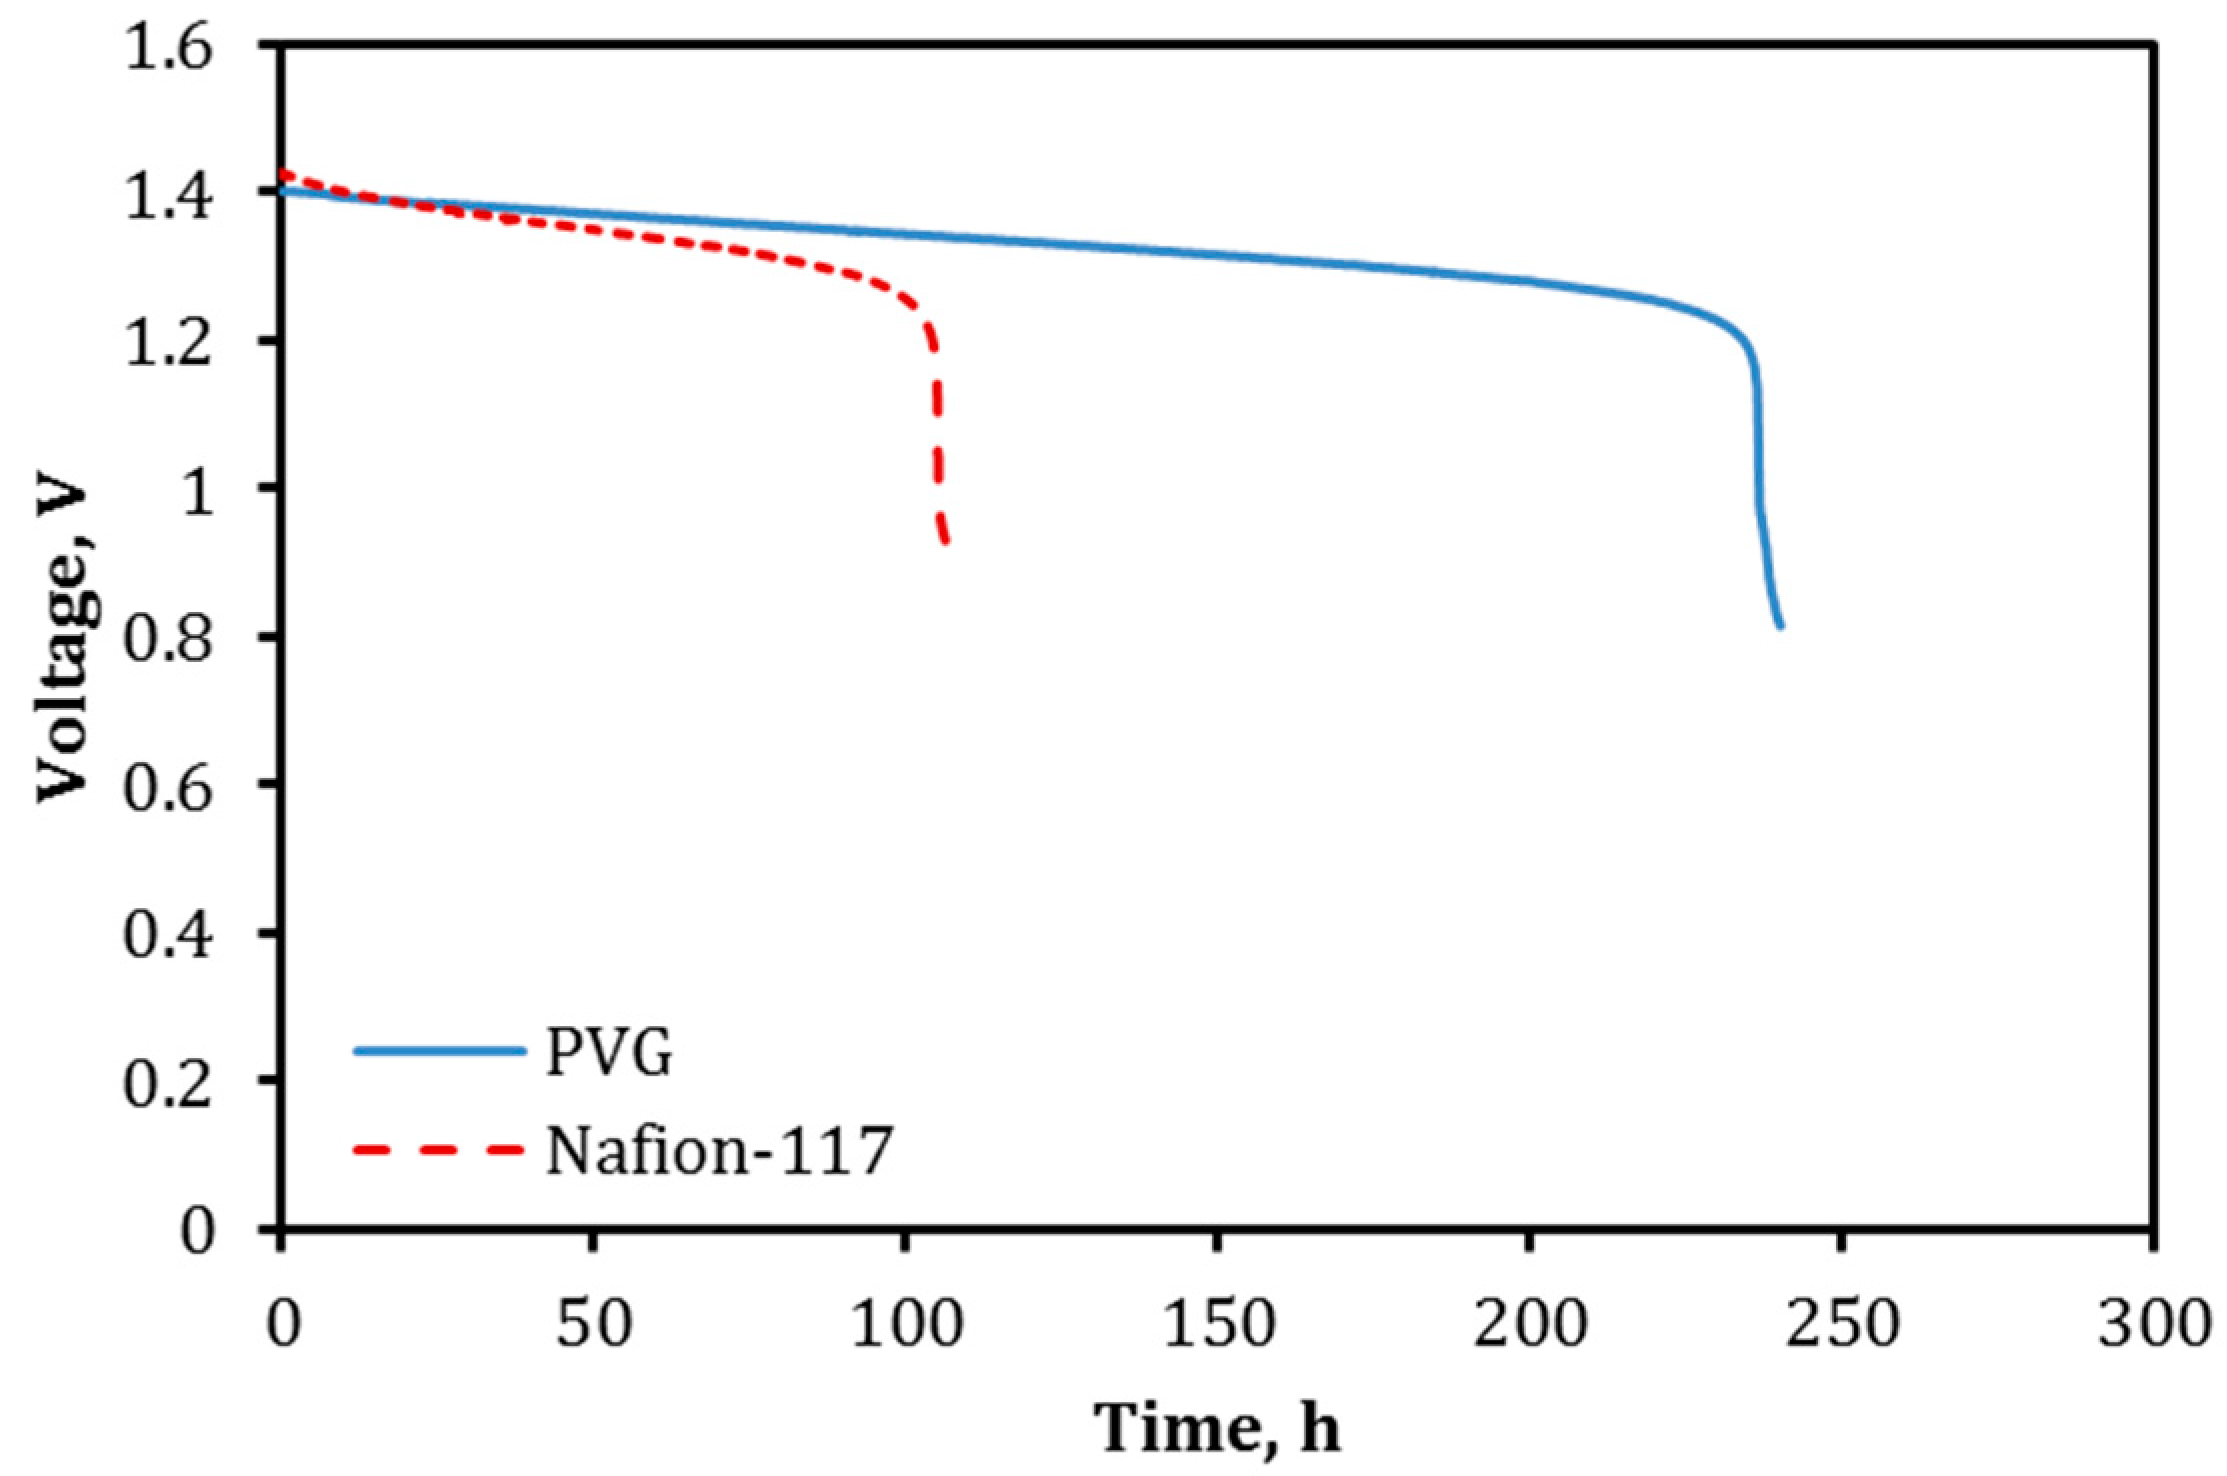
Figure 11 shows the OCV decay curves (i.e., self-discharge curves) for the VRFBs equipped with a 500 μm-thick VPG ion separator (VPG-VRFB) and a Nafion-117 membrane (Nafion-VRFB), respectively. The OCV decay experiments used 10 mL of 2 M V3+/V2+sulfate in 2 M H2SO4 and 10 mL of 2 M VO2+/VO2+ sulfate in 2 M H2SO4 as the negative and positive electrolyte solutions, respectively. The self-discharge of the VRFB was monitored at room temperature starting from OCV of ~1.4 V. The OCV remained above 1.2 V for about 240 h for the VPG-VRFB, which was more than double the time as compared to the Nafion-VRFB (~105 h). The much slower self-discharge rate for the VPG-VRFB is rather intriguing considering the VPG membrane had slightly higher metal ion fluxes and lower proton transport selectivity than the Nafion-117 membrane. One possible cause is that fluxes of metal ions through the Nafion membrane may be accelerated under the electrochemical potential gradient in the charged VRFB because the conductivity of the Nafion membrane is much higher than the VPG membrane and hence the rates of vanadium ion crossover are larger through the Nafion membrane when driven by electric fields.
2.6. VRFB Charge–Discharge Efficiency
The charge–discharge operation of the VRFB single cell was tested using electrolyte solutions the same as those for the OCV decay tests. Figure 12a presents an example of the charge–discharge curves of the VPG-VRFB and Nafion-VRFB at a constant current density of 30 mA/cm2. The VPG-VRFB achieved CE comparable to the Nafion-VRFB at tested current densities from 10 to 60 mA/cm2 (Figure 12b) although the VPG membrane had lower proton selectivity than the Nafion-117 membrane. The VE of the VPG-VRFB was similar to Nafion-VRFB at current density of 10 mA/cm2 and became increasingly lower at higher current densities because of its larger ASR (Figure 12c). Consequently, the VPG-VRFB exhibited relatively lower EE than the Nafion-VRFB as shown in Figure 12d.
2.7. Stability in Long-Term Cyclic Operation
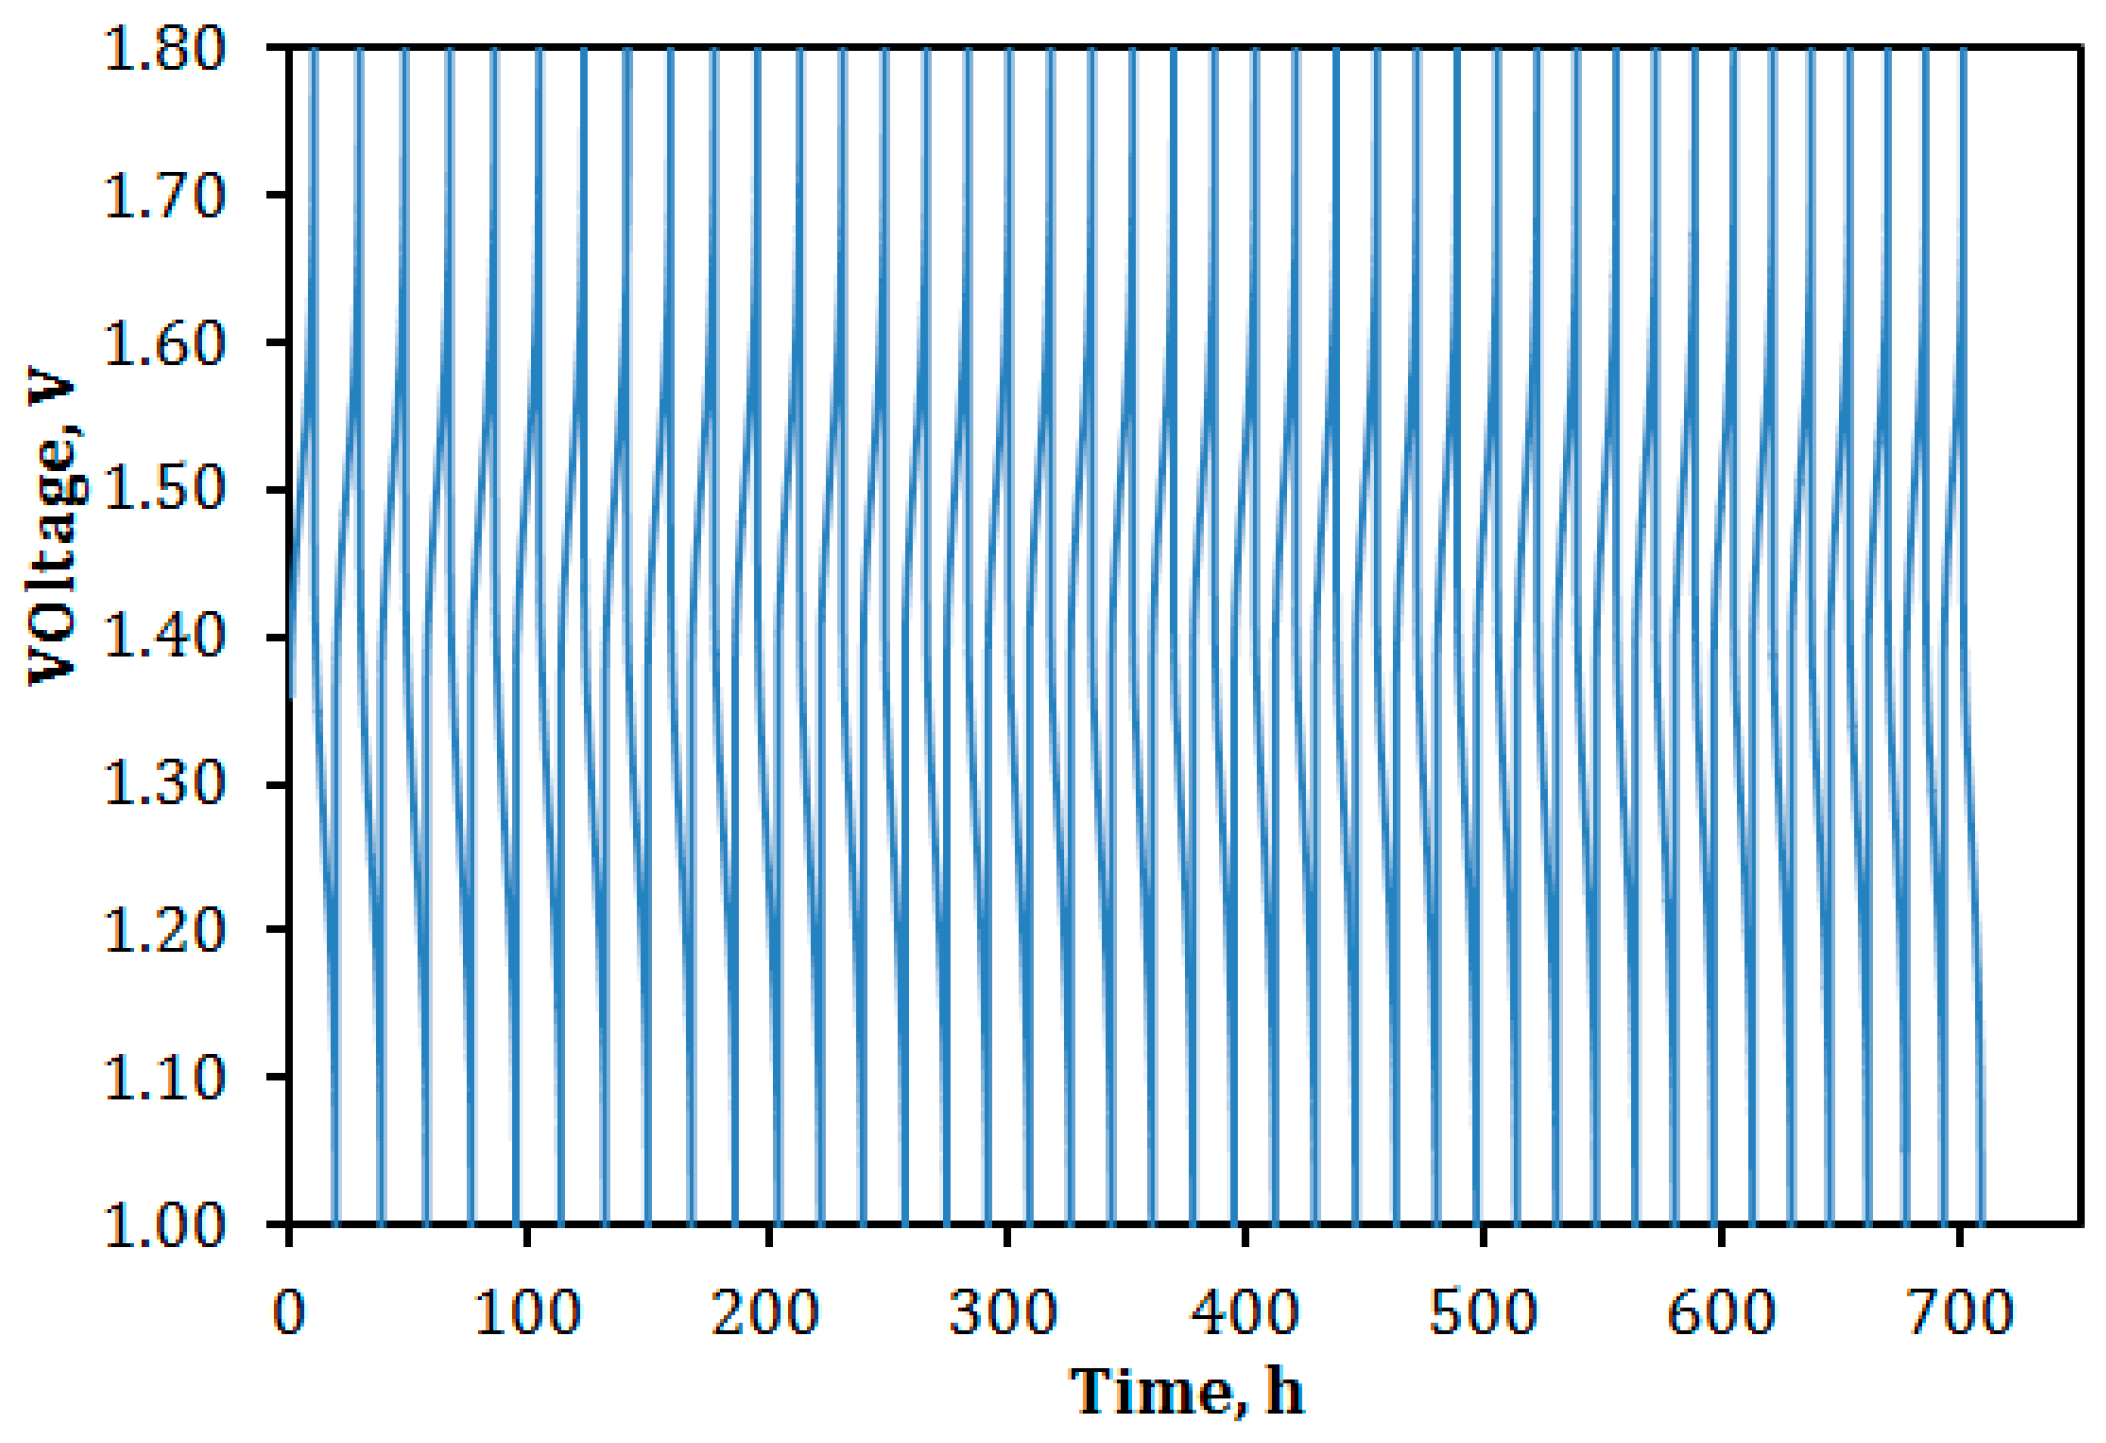
The VPG-VRFB was tested for 40 cycles of continued charge–discharge operation at a current density of 30 mA/cm2 using charging and discharging cutoff voltages of 1.8 and 0.8 V, respectively. This cyclic operation was completed over a 30-day period and the continuous charge–discharge curves are shown in Figure 13. In Figure 13, the cutoff discharging voltage is shown to be 1.0 V for better presentation because the data acquisition speed was not fast enough to record data for ≤0.8 V in some cycles before switching to charging operation.
Figure 14a shows the CE, VE, and EE as functions of cycle number for the VPG-VRFB in comparison with those of the Nafion-VRFB. The CE of both the VPG-VRFB and Nafion-VRFB were stable and comparable over the entire cyclic operation. The VE of VPG-VRFB also exhibited excellent stability but that of the Nafion-VRFB decreased gradually with the cycle number. The VE of VPG-VRFB was moderately lower than the Nafion-VRFB in the initial 20 cycles and became higher than the Nafion-VRFB afterwards. As a result, EE of the VPG-VRFB was lower in the first 20 cycles and became higher than the Nafion-VRFB thereafter. The better cyclic operation stability of the VPG-VRFB can be attributed to the much less intrusion and contamination of V2+ in the VPG porosity than in the Nafion membrane as evidenced by the above elemental analyses. Exchange of the large vanadium ions into the hydrated Nafion membrane can decrease the proton conductivity due to the increased steric hindrance to proton diffusion and reduced proton concentration in the water channels.
The decay rate of discharge capacity for the VPG-VRFB, as shown in Figure 14b, was also notably slower than for the Nafion-VRFB, especially during the first 15 cycles, which is consistent with the previous observation of slower self-discharge rate for the VPG-VRFB. The VPG-VRFB exhibited a linear decrease of discharge capacity with cycle number while the discharge capacity decay rate for the Nafion-VRFB was much faster in the beginning (first 15 cycles) and then tended to stabilize. This difference of the capacity decay rate for the Nafion-VRFB between the initial and late periods of operation may be a result of reduced vanadium ion crossover rate by vanadium ion exchange and contamination, which saturates after a certain time. The metal ion transport rate in the nonionic VPG is not expected to change over time. However, the vanadium ion cross-mixing rate in the Nafion membrane could experience major variations before and after contamination of the water channels by the exchanged vanadium ions [13].
2.8. Temperature Tolerance and Stability
The VPG membrane stability in the VRFB was tested over a temperature range of 5–45 °C by charge–discharge operation at a current density of 40 mA/cm2. The resultant CE, VE, and EE of the VPG-VRFB are presented in Figure 15 together with those of the Nafion-VRFB for comparison. Both VPG-VRFB and Nafion-VRFB exhibited moderate increases in VE because of decreasing ASR (i.e., increasing conductivity) of the membranes with increasing operating temperature (Figure 16). The ion conductivity is a function of ion permeability (Pb,i = Ci × Di), which increases with temperature because of the activated ion diffusion process. On the other hand, the CE of the VPG-VRFB increased slightly while CE of the Nafion-VRFB decreased slightly as the temperature increased from 5–45 °C. The difference in temperature effects on CE between VPG-VRFB and Nafion-VRFB may be explained by their distinct membrane structural properties. The VPG has a rigid and non-swelling pore system, which has excellent resistance to pore structure distortions by temperature fluctuations; while the polymeric structure of Nafion is flexible with swelling that causes severe pore structure distortion at elevated temperatures to allow for higher metal ion flux. The EE of both the VPG-VRFB and Nafion-VRFB increased moderately as temperature increased.
To study the temperature tolerance of the VPG and Nafion membranes in VRFB operation, the VPG-VRFB and Nafion-VRFB underwent 40 cycles of continued charge–discharge operations at 45 °C, which were completed in about 20 days. As can be seen in Figure 17, both VRFBs appeared to have excellent stability in CE over the entire 40-cycle operation, indicating that both PVG and Nafion ion separators maintained good proton selectivity at 45 °C. The Nafion-VRFB had a slightly better CE than the VPG-VRFB because of its relatively higher proton-to-vanadium permeation selectivity as shown before. The VPG-VRFB, while having a lower VE and EE in the beginning (<5 cycles), achieved higher VE and EE afterwards than the Nafion-VRFB. The more rapid loss in EE for the Nafion-VRFB is caused by a conductivity decrease in the Nafion membrane due to contamination of vanadium ions exchanged into the water channels because the kinetics of ion exchange is favored at elevated temperature. The discharge capacity of the Nafion-VRFB also declined notably faster than the VPG-VRFB which is consistent with the observation of slower OCV decay for the VPG-VRFB. The discharge capacity decay for both VRFBs were found to be much faster at 45 °C than at 25 °C because transport of the larger hydrated metal ions is an activated process.
After operating at 45 °C, the two VRFBs were retested by charge–discharge operation at room temperature under a current density of 40 mA/cm2 and compared with the membrane performances before operating at high temperature.
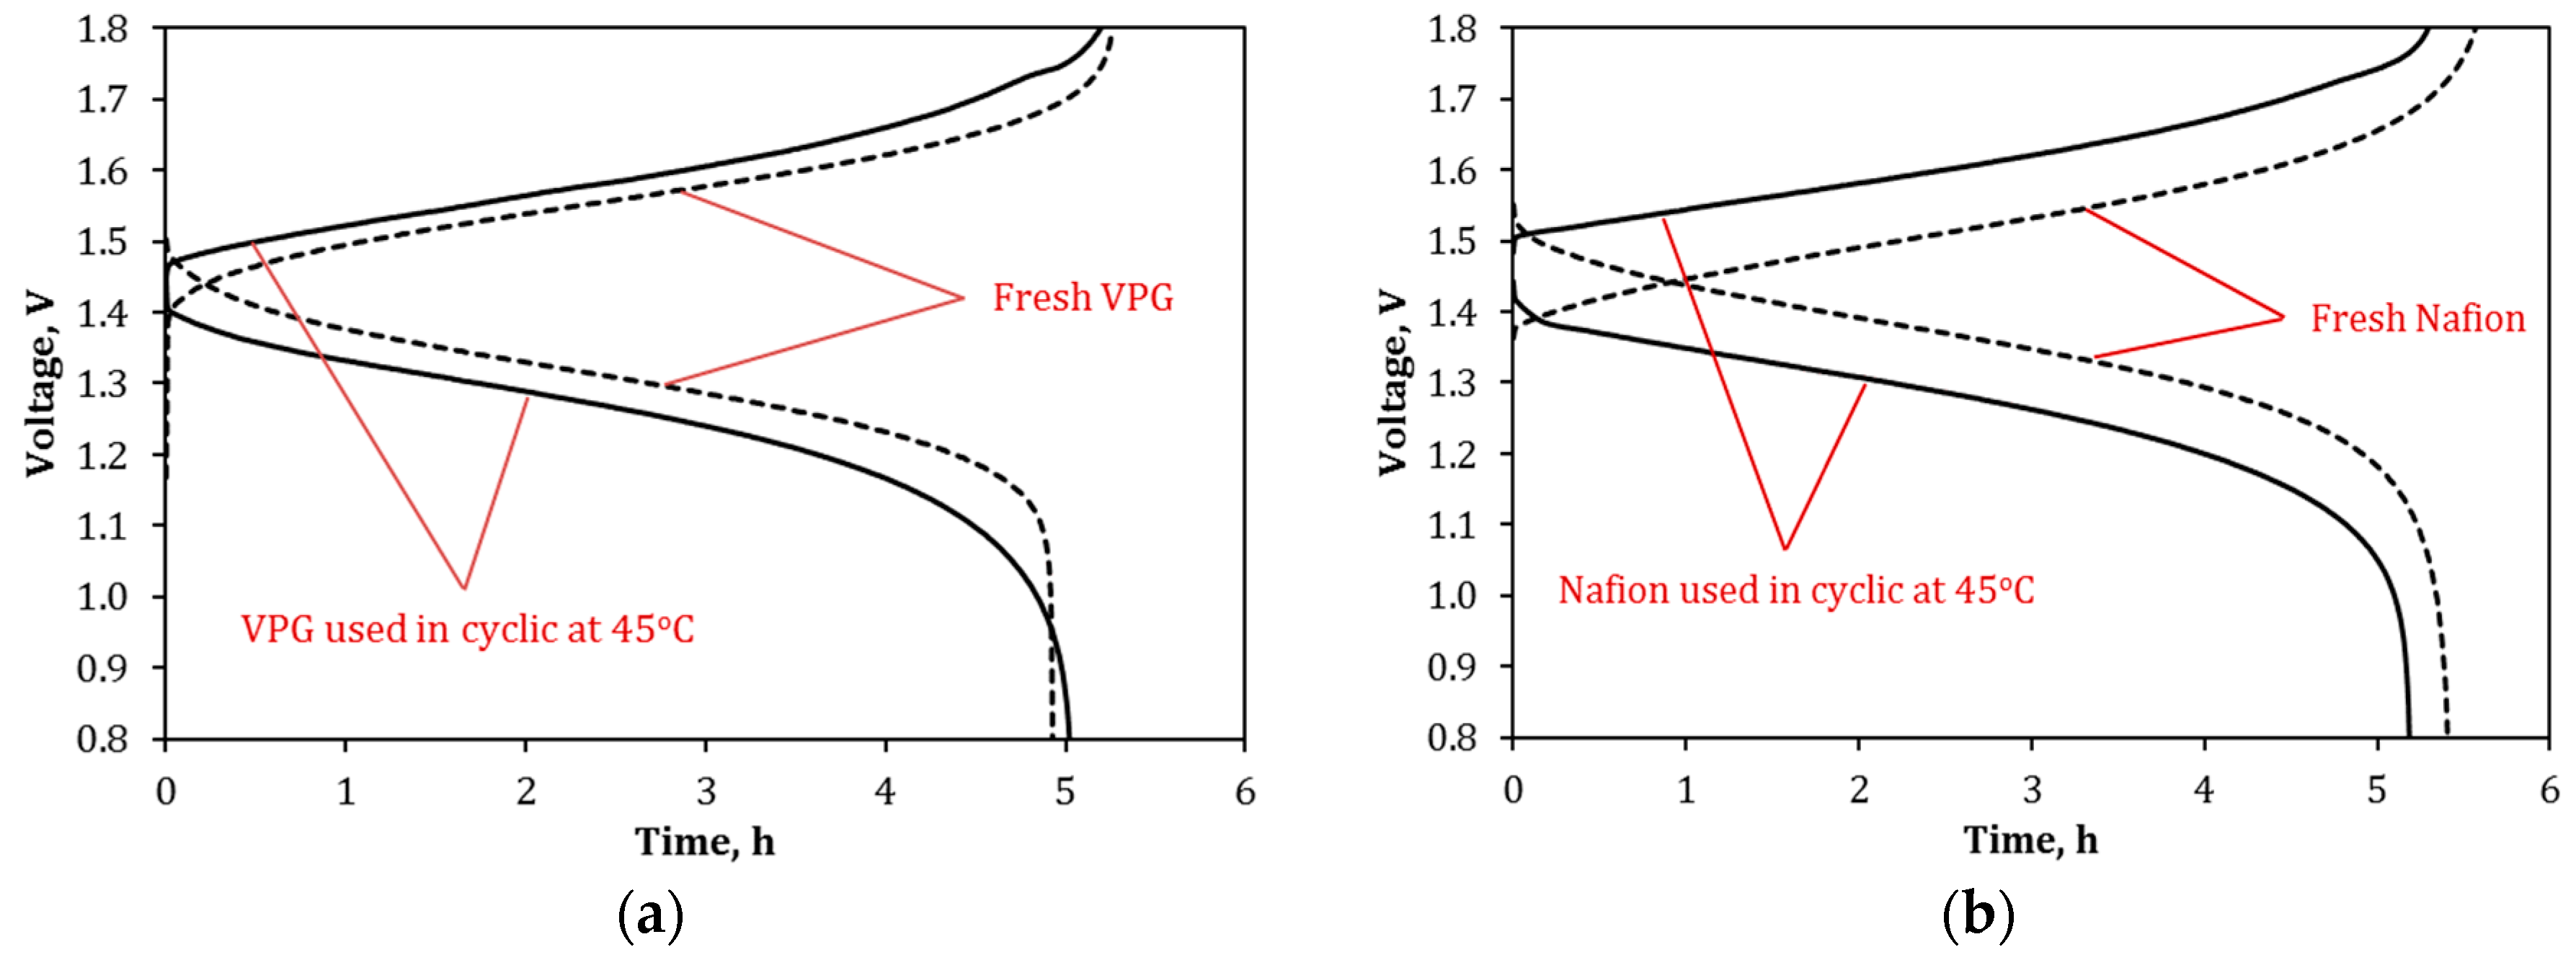
Figure 18 presents the charge–discharge curves of the VPG-VRFB and Nafion-VRFB taken at 25 °C before and after 40 cycles of operations at 45 °C. For both VPG-VRFB and Nafion-VRFB, the charge voltages became higher and the discharge voltages became lower after operating at 45 °C. This means that operating at 45 °C caused permanent losses in VE (or increase in ASR as shown in Figure 16) and consequently lowered the EE for both VRFBs. However, the permanent loss of VE and EE was much less for the VPG-VRFB than for the Nafion-VRFB. Table 3 compares the performance of the two VRFBs before and after the high temperature operations. Compared to the VRFBs with fresh membranes, the CE increased slightly by 2.8% and 1.1% for VPG-VRFB and Nafion-VRFB respectively, likely because the vanadium ions trapped in the membrane porosity at high temperature reduced the permeation of the large hydrated metal ions in later operations at 25 °C. On the other hand, the VE decreased by 4.9% for VPG-VRFB and by 10.6% for Nafion-VRFB as compared to the VRFBs with fresh membranes; and the EE (= CE × VE) was decreased by 2.3% for VPG-VRFB and 9.7% for Nafion-VRFB after high temperature operations. As a result, the VPG-VRFB exhibited an EE of 77.3%, which became more similar to that of the Nafion-VRFB (EE = 78.4%) after operating at 45 °C although the EE of the VPG-VRFB (79.1%) was significantly lower than that of the Nafion-VRFB (86.8%) before operating at high temperature. This suggests that the increased amount of vanadium ions exchanged into the Nafion membrane and the distortion of the flexible Nafion pore structure occurring at high temperature are irreversible but such adverse changes caused by high temperature operation were much smaller for the rigid and nonionic VPG membrane.
3. Conclusions
In summary, the Vycor® porous glass membrane with an average pore size of 4 nm and porosity of ~28% exhibited good proton selectivity over the vanadium ions, e.g., αH+/V4+ = 18.5, and remarkable chemical and structural stabilities in the practically meaningful VRFB electrolyte solutions. The VPG ion separator exhibited higher proton diffusivity but lower ion conductivity than the Nafion-117 membrane because the former lacks exchangeable protons in its pore surface and thus has lower proton permeability. The VPG-VRFB consequently had lower VE and EE then the Nafion-VRFB. However, the VPG-VRFB exhibited much better stability during long term cyclic operation than the Nafion-VRFB because the Nafion membrane could be contaminated by vanadium ions exchanged into its water channels to increase its ASR while the VPG does not have ion exchange capacity and hence has less vanadium ion contamination. As a result, the VPG-VRFB was found to outperform the Nafion-VRFB after a certain period of continued cyclic operation. Experimental studies revealed that operating at a relatively high temperature of 45 °C caused permanent increases in ASR and irreversible losses in EE for both the VPG-VRFB and Nafion-VRFB when returning to operation at room temperature. However, the VPG-VRFB recorded a much smaller ASR increase and more moderate EE decrease than Nafion-VRFB after operating at 45 °C. The outstanding thermal stability and temperature tolerance of the VPG ion separator is due primarily to its rigid and non-swelling pore structure and nonionic surface, which are much more resistant to structure distortion under temperature fluctuation and ion exchange-caused vanadium ion contamination. At both room temperature and high temperature (e.g., 45 °C), the 500-μm thick VPG ion separator outperformed the 183-μm thick Nafion-117 membrane in long term VRFB cyclic operations in terms of EE and preservation of discharge capacity. The excellent temperature tolerance of the VPG is desirable for practical applications because climate control could be very costly and difficult in many locations of renewable energy production. Although the practical applications of the VPG ion separators, and mesoporous and microporous ceramic membranes in general, are currently limited by their required large thickness due to the material brittleness, part of the highly desired structural and chemical stability of the porous inorganic materials may be utilized through their embedment in polymer matrixes.
4. Materials and Methods
4.1. Materials and Chemicals
The mesoporous Vycor glass membrane and the Nafion®-117 membrane used in this study were obtained from commercial sources. The glass membrane, Vycor® porous glass (VPG) 7930, a product of Corning Inc. (Corning, NY, USA), was purchased through Advanced Glass & Ceramics (Holden, MA, USA). The VPG membrane was disc-shaped with a diameter of 2.54 cm and a thickness of 500 μm (1000-μm thick discs were also used for some material property tests). The average pore diameter (dp), porosity (ε), and specific mesopore surface area of the VPG membrane were 4 nm, 0.28, and ~250 m2/g, respectively, by manufacturer data and reports in references [24,29]. The Nafion-117 membrane, a product of DuPont, which is commonly used as a benchmark ion exchange membrane for hydrogen fuel cells and ion separators for RFBs, was obtained through Alfa Aesar (Tewksbury, MA, USA). The Nafion-117 membrane had a dry thickness of ~183 μm and exchange capacity 0.9 meq/g. The VPG and Nafion membranes were used as received without any modifications. The carbon felt used as electrodes for the VRFB was of 99.0% carbon purity and 6-mm thick without compression (Alfa Aesar, Tewksbury, MA, USA). Chemicals including vanadyl sulfate (VOSO4·4–6H2O, 99.9%), sulfuric acid (6 M H2SO4), and magnesium sulfate (MgSO4, >99.5%) were purchased from Sigma (St. Louis, Mo, USA) and used without further purification.
4.2. Ion Diffusion Measurement
The overall transport coefficient (Ki) of proton and vanadium ions V2+, V3+, VO2+, and VO2+ of the membranes were measured by the conventional diffusion method using an experimental procedure established in our previous work and the measurement apparatus is schematically shown in Figure 19 [30]. For ion diffusion measurement, the cell was used without installing carbon felt electrodes in the chambers on the two sides of the ion separator. During the diffusion measurement, the two reservoir tanks were filled with 20 mL of 1 M vanadium sulfate solution in 2 M H2SO4 and 20 mL of 2.25 M MgSO4, respectively. The MgSO4 solution was used to balance the ionic strengths and minimize the osmotic pressure difference between the two sides of the membrane. The permeation measurement was conducted with solutions on both sides circulated to minimize the effects of concentration polarization. The changes in proton and vanadium ion concentrations in the permeate side solution were measured periodically to determine the ion flux and proton transport selectivity over the metal ions. The proton concentration was obtained by monitoring the pH value using a pH meter (Thermo Scientific Orion 320; Thermo Scientific, Laguna Hills, CA, USA) and the vanadium ion concentrations were determined by a UV/Vis spectrometer (Ocean Optics HR2000+CG-UV-NIR, detection limit ~0.0001 M; Ocean Optics, Winter Park, FL, USA) for small quantity samples (~0.05 mL per sample) taken periodically. The calibration curves for quantifying the concentrations of the vanadium ions including V2+, V3+, V4+ (VO2+), and V5+ (VO2+), were pre-determined using the same UV/Vis spectrometer [16].
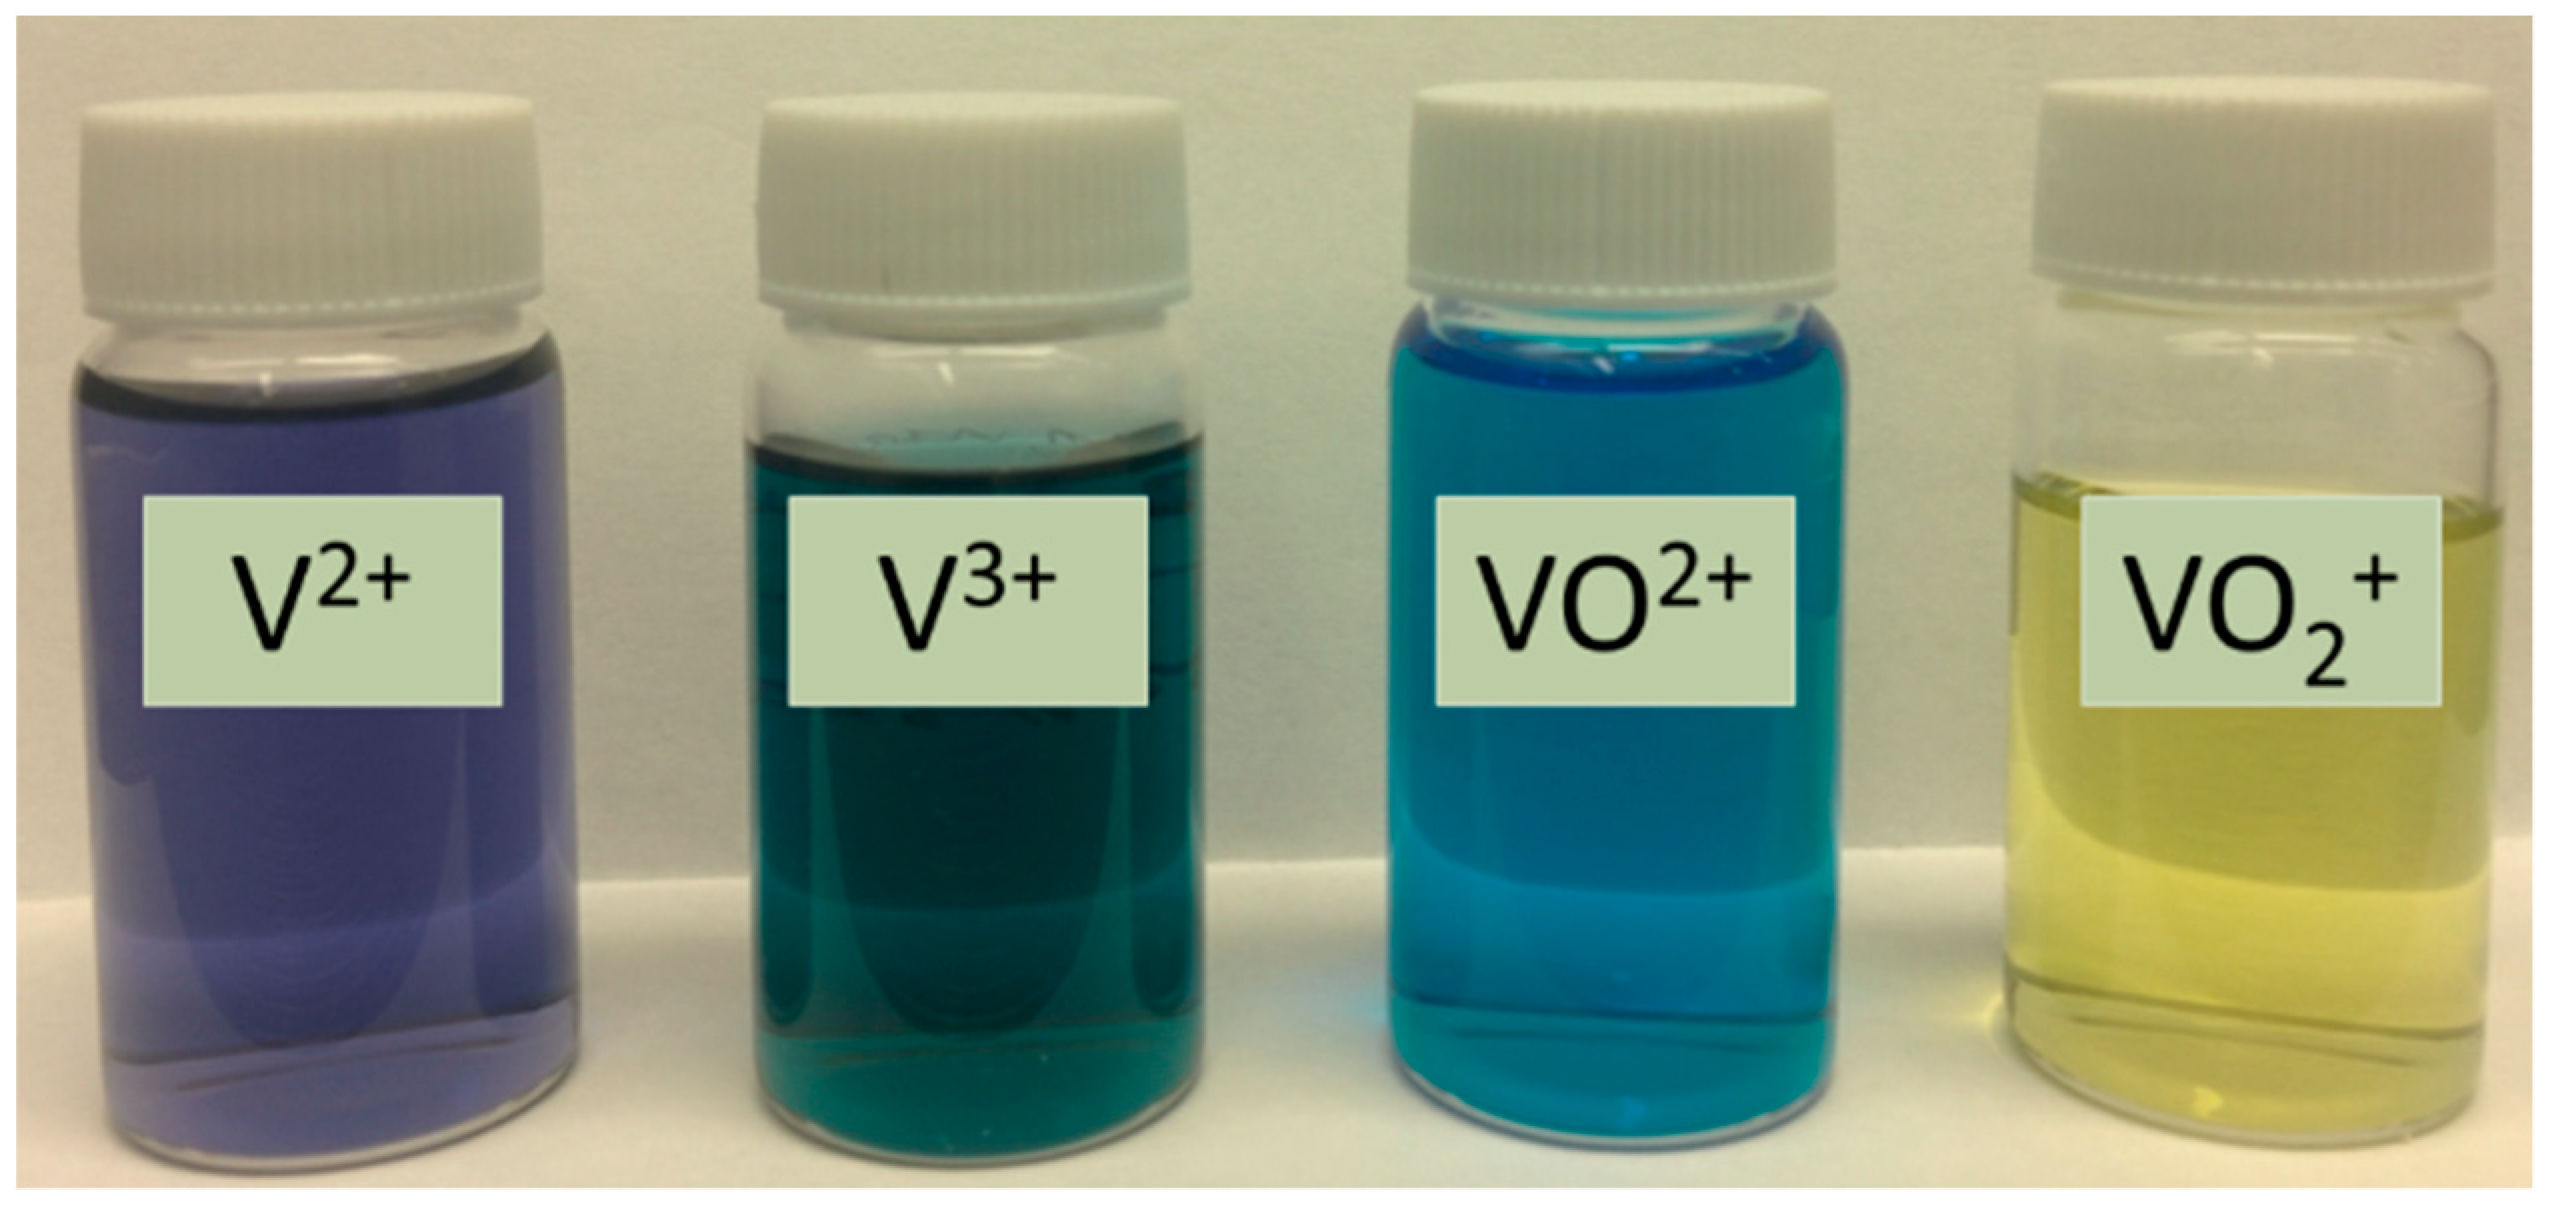
The 1 M VOSO4 (VO2+) solution was prepared directly using the purchased chemicals. The V2+, V3+, and V5+ (VO2+) sulfate solutions where obtained by electrochemical reduction and oxidation through VRFB charge–discharge operations. The RFB charge–discharge operation was performed in an apparatus depicted in Figure 19, except that the chambers on two sides of the ion separator were installed with carbon felt electrodes and a high-selectivity zeolite membrane ion separator was used for achieving ~100% state of charge (SOC) and preventing ion crossover [18,26]. The purities of the V2+, V3+, and V5+ (VO2+) were estimated to be >99% based on the SOC-dependent terminal voltages in charging and discharging processes and observation of the characteristic colors of the solutions [18,31]. The V2+ sulfate was obtained from the cathodic side of charging when the voltage reached 1.75 V and the solution color turned into the characteristic color of purple; meanwhile, the solution at the anodic side was taken for V5+ (VO2+) which appeared with the characteristic yellow color. The solution of V3+ was obtained after the discharge voltage dropped to zero and the solution turned into the characteristic color of green. The photographs of the different vanadium ion solutions obtained in this work by the charging and discharging processes are shown in Figure 20.
The proton and vanadium ion fluxes, and were determined by the rates of ion concentration changes () in the permeate side MgSO4 solution:
where is the volume of MgSO4 solution and is the active area of the membrane. After measuring the ions fluxes, the overall ion transport coefficient (Ki) was calculated using the following defining equation:
where and are the ion concentrations of solutions in the feed and permeate side chambers, respectively. Equation (6) defines the overall ion transport coefficient , which accounts for resistances contributed by the steps of ion entering and diffusing through the membrane [25].
4.3. Examination of Proton Conductivity and Permeability
The ion conductivity and proton transport diffusivity in the membranes were studied by electrochemical impedance spectroscopy (EIS; Gamry® Reference-600™; Gamry Instruments, Warminster, PA, USA) using the same setup shown in Figure 19 and a procedure detailed in our previous publications [18,26]. The electrical resistances of the VPG and the Nafion-117 ion separators were determined by measuring the electrical resistances of the entire VRFB cell with and without the installation of ion separators, respectively. The EIS measurements were performed over a frequency range from 100 Hz to 100 kHz. The effective area of the membrane (Am) was 2 cm2 in the setting for RFB operations or EIS measurements after excluding the edge area covered by the O-ring seal. The ion conductivity was measured in 0.1, 0.5, 1.0, 1.5, and 2.0 M H2SO4 solutions, respectively. For measurements over a temperature range of 5–45 °C, a 1.5-M VO2+ sulfate solution in 4 M H2SO4 was used. The temperature control stability was within ±0.5 °C using a large volume chiller/bath. The electrical resistance of the membrane was obtained by subtracting the cell resistance without an ion separator (Rcell) from that with the separator (Rtot). Note that the two pieces of compressed electronically conducting carbon felts are in direct contact when no ion separator is installed in the cell. Thus, the membrane ASR and ion conductivity are given by the following expression and Equation (3), respectively [18,26],
When is very large, the contribution of metal ion conduction can be neglected, i.e., . The proton diffusivity () is then obtained from the ASR:
4.4. Membrane Characterizations
The concentration of protons in the pores of the VPG was measured by a titration method. A 1000-μm-thick VPG disc with 25.4 mm diameter was cleaned by a solution of 0.1 M NaOH and washed thoroughly with DI water afterwards. The disc was then treated in 2 M H2SO4 solution and then washed again with DI water. The processes of washing by basic and acidic solutions were repeated 5 times to ensure removal of any contaminants. The cleaned VPG disc was washed with DI water until the water pH reached a stable value of 6.9–7.0 and then dried in a vacuum oven at 150 °C for 3 h. After drying, the disc was immersed in 10 mL of 2 M H2SO4 solution in a sealed vessel and kept at 85 °C for 12 h to ensure that membrane pores were fully filled with the aqueous solution. The same processes of washing and soaking in acid solutions were performed for a completely dense glass disc of the same external surface area as the VPG disc, to serve as reference for calibrating possible external surface adsorption. Finally, the VPG disc and the dense glass disc were recovered and immersed in 5 mL of DI water after the excessive solution on the external surface was removed by powderless cleaning tissues. The amounts of H+ in the glass samples were determined by titration approach and the values are averages of three independent experiments, which were found to have relative deviations of ±3%. The amount of acid in the VPG porosity was the difference between values measured for the dense glass chip () and VPG (); The H+ concentration in the VPG ( is obtained by
where is the total volume of the VPG disc. Thus, the and subsequently obtained are values on the basis of overall membrane volume but not the pore volume so that direct comparisons with the Nafion membrane can be made.
4.5. Membrane Performance in VRFB Operation
The performance of the VPG membrane as an ion separator was examined in comparison with the Nafion-117 membrane through the VRFB charge–discharge operation and OCV decay rate measurements. The electrolyte solutions used were 2 M (V2+/V3+) sulfate in 2 M H2SO4 for anolyte and 2 M (VO2+/VO2+) sulfate in 2 M H2SO4 for catholyte. The VRFB cell consisted of two carbon felt electrodes between which the ion separator was sandwiched. When assembled in the cell, the 6-mm thick carbon felt was compressed to a thickness of 4 mm. The amounts of anolyte and catholyte solutions used were both 10 mL. The VRFB operation was carried out using a Gamry® Reference 600 potentionstat/galvanostat station (Gamry Instruments, Warminster, PA, USA) and a battery analyzer (BST8-3, MTI Corporation, Richmond, CA, Canada). The charge–discharge curves of the VRFB were measured at room temperature for various current densities. The CE, VE, and EE were calculated by the following defining equations,
where Id and Ic are the discharge and charge currents, respectively, which were kept identical in this work; Vd and Vc are the discharge and charge voltages at time t, respectively; and tc and td are total time used for charging and discharging, respectively. The VRFB with the VPG and Nafion were tested by continuous cyclic operation for more than 40 cycles at a current density (i) of 30 mA/cm2, which was completed over a period of about one month. The cutoff voltages for charging and discharging processes were 1.8 V and 0.8 V, respectively, in order to prevent electrode corrosion and hydrogen evolution. The OCV decay (i.e., self-discharge) curves were also taken for the fully charged electrolytes for both the VPG-VRFB and Nafion-VRFB.
The effects of operating temperature on the RFB performance are multifaceted. First, temperature influences the thermodynamics and kinetics properties of the electrochemical reactions and the mass transport behaviors across the membrane and between the cell components; and second, variation of temperature can cause material structure changes especially to the membrane ion separator. This study only evaluated the thermal stability of the ion separator, which is likely to be the biggest concern under large variation of operating temperature. The transport properties of both VPG and Nafion membranes and operations of their respective VRFBs were tested at 5, 15, 25, 35, and 45 °C. The compositions of the electrolyte solutions used for investigating temperature effects were 1.5 Μ V2+/V3+ in 4 M H2SO4 for the anolyte and 1.5 M V5+/V4+ (VO2+/VO2+) in 4 M H2SO4 for the catholyte. These concentrations of vanadium ions were relatively lower and the acid concentration higher than those used in room temperature tests because higher acid concentration and lower Vn+ concentrations are necessary for avoiding precipitation of VO2+ at high temperature (45 °C) [32,33]. The charge–discharge curves of the VRFBs with the VPG and Nafion membranes were measured at a current density of 40 mA/cm2. Similar to room temperature tests, the VRFBs with the VPG and Nafion ion separators were also tested by cyclic operation at 45 °C for more than 40 cycles at 40 mA/cm2 to evaluate the long-term stability over a period of more than 20 days.
4.6. SEM and EDS Measurements
The equilibrium amounts of metal ions inside the pores of both VPG and Nafion membranes were measured for samples that were immersed in the acidic electrolyte solutions (2 M H2SO4) of V2+, V3+, VO2+, and VO2+ sulfates for 14 days. The membranes recovered from the electrolyte solutions were quickly rinsed with DI water and gently wiped by filtration paper before drying in a vacuum oven at 40 °C for overnight. During the drying process, the liquid solution was kept in the nanometer sized pores by strong capillary action. The dry membrane samples were then examined by scanning electron microscopy (SEM) and energy dispersive X-ray spectroscopy (EDS) elemental analyses. The SEM samples of the Nafion-117 membrane were prepared by razer cutting after being frozen in liquid nitrogen to minimize deformation of the cross-section. The SEM and EDS examinations were performed by a FEI Scios DualBeam microscope equipped with Ametek Octane Super EDAX.
Author Contributions
I.M. led the experiments on membrane characterizations, RFB tests, and data analysis and interpretation. Z.X. designed and constructed the RFB cells and helped with some RFB tests. Z.C. worked on membrane properties measurements. W.J. was involved in design and improvement of the cell and testing systems and helped with some materials characterizations. J.D. conceived and directed the research project and performed data interpretation and manuscript writing.
Funding
This research received no external funding.
Acknowledgments
This research was funded by the U.S. National Science Foundation grant number CBET-1263860 and I.M. was funded by University of Cincinnati Graduate Scholarship.
Conflicts of Interest
The authors declare no conflict of interest.
References
- Darling, R.M.; Gallagher, K.G.; Kowalski, J.A.; Ha, S.; Brushett, F.R. Pathways to low-cost electrochemical energy storage: A comparison of aqueous and nonaqueous flow batteries. Energy Environ. Sci. 2014, 7, 3459–3477. [Google Scholar] [CrossRef]
- Dunn, B.; Kamath, H.; Tarascon, J.M. Electrical energy storage for the grid: A battery of choices. Science 2011, 334, 928–935. [Google Scholar] [CrossRef] [PubMed]
- Ge, B.M.; Wang, W.L.; Bi, D.Q.; Rogers, C.B.; Peng, F.Z.; de Almeida, A.T.; Abu-Rub, H. Energy storage system-based power control for grid-connected wind power farm. Int. J. Electr. Power 2013, 44, 115–122. [Google Scholar] [CrossRef]
- Rychcik, M.; Skyllas-Kazacos, M. Characteristics of a new all-vanadium redox flow battery. J. Power Sources 1988, 22, 59–67. [Google Scholar] [CrossRef]
- Skyllas-Kazacos, M.; Kazacos, G.; Poon, G.; Verseema, H. Recent advances with unsw vanadium-based redox flow batteries. Int. J. Energy Res. 2010, 34, 182–189. [Google Scholar] [CrossRef]
- Zeng, Y.K.; Zhao, T.S.; An, L.; Zhou, X.L.; Wei, L. A comparative study of all-vanadium and iron-chromium redox flow batteries for large-scale energy storage. J. Power Sources 2015, 300, 438–443. [Google Scholar] [CrossRef]
- Crawford, A.; Viswanathan, V.; Stephenson, D.; Wang, W.; Thomsen, E.; Reed, D.; Li, B.; Balducci, P.; Kintner-Meyer, M.; Sprenkle, V. Comparative analysis for various redox flow batteries chemistries using a cost performance model. J. Power Sources 2015, 293, 388–399. [Google Scholar] [CrossRef] [Green Version]
- Schwenzer, B.; Zhang, J.L.; Kim, S.; Li, L.Y.; Liu, J.; Yang, Z.G. Membrane development for vanadium redox flow batteries. Chemsuschem 2011, 4, 1388–1406. [Google Scholar] [CrossRef]
- Wei, X.L.; Nie, Z.M.; Luo, Q.T.; Li, B.; Chen, B.W.; Simmons, K.; Sprenkle, V.; Wang, W. Nanoporous polytetrafl uoroethylene/silica composite separator as a high-performance all-vanadium redox flow battery membrane. Adv. Energy Mater. 2013, 3, 1215–1220. [Google Scholar] [CrossRef]
- Luo, T.; David, O.; Gendel, Y.; Wessling, M. Porous poly(benzimidazole) membrane for all vanadium redox flow battery. J. Power Sources 2016, 312, 45–54. [Google Scholar] [CrossRef]
- Zhao, Y.Y.; Li, M.R.; Yuan, Z.Z.; Li, X.F.; Zhang, H.M.; Vankelecom, I.F.J. Advanced charged sponge-like membrane with ultrahigh stability and selectivity for vanadium flow batteries. Adv. Funct. Mater. 2016, 26, 210–218. [Google Scholar] [CrossRef]
- Schmidt-Rohr, K.; Chen, Q. Parallel cylindrical water nanochannels in nafion fuel-cell membranes. Nat. Mater. 2008, 7, 75–83. [Google Scholar] [CrossRef] [PubMed]
- Vijayakumar, M.; Bhuvaneswari, M.S.; Nachimuthu, P.; Schwenzer, B.; Kim, S.; Yang, Z.G.; Liu, J.; Graff, G.L.; Thevuthasan, S.; Hu, J.Z. Spectroscopic investigations of the fouling process on nafion membranes in vanadium redox flow batteries. J. Membr. Sci. 2011, 366, 325–334. [Google Scholar] [CrossRef]
- Li, X.; Zhang, H.; Mai, Z.; Zhang, H.; Vankelecom, I. Ion exchange membranes for vanadium redox flow battery (VRB) applications. Energy Environ. Sci. 2011, 4, 1147–1160. [Google Scholar] [CrossRef] [Green Version]
- Ye, R.; Henkensmeier, D.; Yoon, S.J.; Huang, Z.; Kim, D.K.; Chang, Z.; Kim, S.; Chen, R. Redox Flow Batteries for Energy Storage: A Technology Review. J. Electrochem. Energy. Convers. Storage 2017, 15, 010801. [Google Scholar] [CrossRef] [Green Version]
- Yang, R.D.; Xu, Z.; Yang, S.W.; Michos, I.; Li, L.F.; Angelopoulos, A.P.; Dong, J.H. Nonionic zeolite membrane as potential ion separator in redox-flow battery. J. Membr. Sci. 2014, 450, 12–17. [Google Scholar] [CrossRef]
- Hinkle, K.R.; Wang, X.; Gu, X.; Jameson, C.J.; Murad, S. Computational Molecular Modeling of Transport Processes in Nanoporous Membranes. Processes 2018, 6, 124. [Google Scholar] [CrossRef]
- Xu, Z.; Michos, I.; Wang, X.R.; Yang, R.D.; Gu, X.H.; Dong, J.H. A zeolite ion exchange membrane for redox flow batteries. Chem. Commun. 2014, 50, 2416–2419. [Google Scholar] [CrossRef]
- Xu, Z. Investigations on Molecular Sieve Zeolite Membranes as Proton-Selective Ion Separators for Redox Flow Batteries. Ph.D. Dissertation, University of Cincinnati, Cincinnati, OH, USA, 2015. [Google Scholar]
- Bennett, J.M. Non-identity of the zeolites erionite and offretite. Nature 1967, 214, 1005–1006. [Google Scholar] [CrossRef]
- Michos, I. Studies on Ion Transport in Mesoporous and Microporous Inorganic Membranes as Ion Separators for Redox Flow Batteries. Ph.D. Dissertation, University of Cincinnati, Cincinnati, OH, USA, 2016. [Google Scholar]
- Yan, L.G.; Li, D.; Li, S.Q.; Xu, Z.; Dong, J.H.; Jing, W.H.; Xing, W.H. Balancing osmotic pressure of electrolytes for nanoporous membrane vanadium redox flow battery with a draw solute. ACS Appl. Mater. Interfaces 2016, 8, 35289–35297. [Google Scholar] [CrossRef]
- Mogelin, H.; Yao, G.; Zhong, H.; dos Santos, A.R.; Barascu, A.; Meyer, R.; Krenkel, S.; Wassersleben, S.; Hickmann, T.; Enke, D.; et al. Porous glass membranes for vanadium redox-flow battery application—Effect of pore size on the performance. J. Power Sources 2018, 377, 18–25. [Google Scholar] [CrossRef]
- Shelekhin, A.B.; Pien, S.; Ma, Y.H. Permeability, surface-area, pore volume and pore-size of vycor glass membrane heat-treated at high-temperatures. J. Membr. Sci. 1995, 103, 39–43. [Google Scholar] [CrossRef]
- Li, L.X.; Dong, J.H.; Nenoff, T.M. Transport of water and alkali metal ions through mfi zeolite membranes during reverse osmosis. Sep. Purif. Technol. 2007, 53, 42–48. [Google Scholar] [CrossRef]
- Xu, Z.; Michos, I.; Cao, Z.S.; Jing, W.H.; Gu, X.H.; Hinkle, K.; Murad, S.; Dong, J.H. Proton-selective ion transport in zsm-5 zeolite membrane. J. Phys. Chem. C 2016, 120, 26386–26392. [Google Scholar] [CrossRef]
- Choi, P.; Jalani, N.H.; Datta, R. Thermodynamics and proton transport in nafion—II. Proton diffusion mechanisms and conductivity. J. Electrochem. Soc. 2005, 152, E123–E130. [Google Scholar] [CrossRef]
- Morris, D.R.; Sun, X.D. Water-sorption and transport-properties of nafion-117-h. J. Appl. Polym. Sci. 1993, 50, 1445–1452. [Google Scholar] [CrossRef]
- Elmer, T.H. Porous and Reconstructed Glasses. Engineered Materials Handbook Vol. 4: Ceramics and Glasses; ASM International: Materials Park, OH, USA, 1992; pp. 427–432. [Google Scholar]
- Llewellyn, P.; Grossmith, F.; Fane, A.; Skyllas-Kazacos, M. Membrane evaluation for vanadium redox cell. In Proceedings of the Symposium on Energy Storage: Load Levelling and Remote Applications; The Electrochemical Society: Pennington, NJ, USA, 1988; Volume 88-11. [Google Scholar]
- Baccino, F.; Marinelli, M.; Norgard, P.; Silvestro, F. Experimental testing procedures and dynamic model validation for vanadium redox flow battery storage system. J. Power Sources 2014, 254, 277–286. [Google Scholar] [CrossRef]
- Gencten, M.; Gursu, H.; Sahin, Y. Electrochemical investigation of the effects of v(v) and sulfuric acid concentrations on positive electrolyte for vanadium redox flow battery. Int. J. Hydrogen Energy 2016, 41, 9868–9875. [Google Scholar] [CrossRef]
- Kazacos, M.; Cheng, M.; Skyllas-Kazacos, M. Vanadium redox cell electrolyte optimization studies. J. Appl. Electrochem. 1990, 20, 463–467. [Google Scholar] [CrossRef]
Figure 1.
Characterizations of the VPG membrane: (a) Weight loss as a function of time immersed in the solution of 2 M V5+ (VO2+) in 2 M H2SO4 (insert is the pore size distribution from reference [24]), (b) SEM image of cross-section, and (c) SEM image of surface.
Figure 1.
Characterizations of the VPG membrane: (a) Weight loss as a function of time immersed in the solution of 2 M V5+ (VO2+) in 2 M H2SO4 (insert is the pore size distribution from reference [24]), (b) SEM image of cross-section, and (c) SEM image of surface.

Figure 2.
Results of ion diffusion measurements for VPG (a1–a4) and Nafion-117 (b1–b4) membranes using feeds of 2 M vanadium sulfate solutions in 2 M H2SO4: (a1,b1)—V2+ vs. H+, (a2,b2)—V3+ vs. H+, (a3,b3)—V4+ (VO2+) vs. H+, and (a4,b4)—V5+ (VO2+) vs. H+.
Figure 2.
Results of ion diffusion measurements for VPG (a1–a4) and Nafion-117 (b1–b4) membranes using feeds of 2 M vanadium sulfate solutions in 2 M H2SO4: (a1,b1)—V2+ vs. H+, (a2,b2)—V3+ vs. H+, (a3,b3)—V4+ (VO2+) vs. H+, and (a4,b4)—V5+ (VO2+) vs. H+.


Figure 3.
Results of EDS line-scan along the thickness of the VPG samples after equilibration in solutions of different vanadium ions: (a) V2+, (b) V3+, (c) VO2+, and (d) VO2+ solution in 2 M H2SO4, respectively.
Figure 3.
Results of EDS line-scan along the thickness of the VPG samples after equilibration in solutions of different vanadium ions: (a) V2+, (b) V3+, (c) VO2+, and (d) VO2+ solution in 2 M H2SO4, respectively.

Figure 4.
Results of EDS line-scan along the thickness of the Nafion membrane samples after being treated in solutions of different vanadium ions: (a) V2+, (b) V3+, (c) VO2+, and (d) VO2+ solution in 2 M H2SO4, respectively.
Figure 4.
Results of EDS line-scan along the thickness of the Nafion membrane samples after being treated in solutions of different vanadium ions: (a) V2+, (b) V3+, (c) VO2+, and (d) VO2+ solution in 2 M H2SO4, respectively.

Figure 5.
Results of elemental survey by EDS point analysis at various depths of the VPG membrane after being equilibrated in different vanadium ion solutions: (a) V2+, (b) V3+, (c) VO2+, and (d) VO2+ solution in 2 M H2SO4, respectively.
Figure 5.
Results of elemental survey by EDS point analysis at various depths of the VPG membrane after being equilibrated in different vanadium ion solutions: (a) V2+, (b) V3+, (c) VO2+, and (d) VO2+ solution in 2 M H2SO4, respectively.

Figure 6.
Results of elemental survey by EDS point analysis at various depths of the Nafion-117 membrane after being equilibrated in different vanadium ion solutions: (a) V2+, (b) V3+, (c) VO2+, and (d) VO2+ solution in 2 M H2SO4, respectively.
Figure 6.
Results of elemental survey by EDS point analysis at various depths of the Nafion-117 membrane after being equilibrated in different vanadium ion solutions: (a) V2+, (b) V3+, (c) VO2+, and (d) VO2+ solution in 2 M H2SO4, respectively.

Figure 7.
EIS measurements for the VRFB cell when equipped with (a) VPG ion separator, (b) Nafion-117 membrane separator, and (c) no membrane, and cell chambers filled with H2SO4 solutions of various concentrations.
Figure 7.
EIS measurements for the VRFB cell when equipped with (a) VPG ion separator, (b) Nafion-117 membrane separator, and (c) no membrane, and cell chambers filled with H2SO4 solutions of various concentrations.

Figure 8.
ASR of the VPG and Nafion membranes as a function of H2SO4 concentrations.

Figure 9.
Ion conductivity in the VPG and Nafion membranes as a function of H2SO4 concentrations.

Figure 10.
Proton diffusivity in the VPG and Nafion membranes as a function of H2SO4 concentration in the solution.
Figure 10.
Proton diffusivity in the VPG and Nafion membranes as a function of H2SO4 concentration in the solution.

Figure 11.
The OCV decay curves of the VRFB equipped with the VPG ion separator in comparison to that equipped with the Nafion-117 membrane.
Figure 11.
The OCV decay curves of the VRFB equipped with the VPG ion separator in comparison to that equipped with the Nafion-117 membrane.

Figure 12.
Performance of the VPG-VRFB and Nafion-VRFB in charge–discharge operations: (a) Charging and discharging curves at a current density of 30 mA/cm2, (b) CE as a function of current density, (c) VE as a function of current density, and (d) EE as a function of current density.
Figure 12.
Performance of the VPG-VRFB and Nafion-VRFB in charge–discharge operations: (a) Charging and discharging curves at a current density of 30 mA/cm2, (b) CE as a function of current density, (c) VE as a function of current density, and (d) EE as a function of current density.

Figure 13.
Cyclic charge–discharge curves of VPG-VRFB over a period of 30 days.

Figure 14.
Comparison of cyclic operation between VPG-VRFB and Nafion-VRFB: (a) CE, VE, and EE and (b) discharge capacity decay.
Figure 14.
Comparison of cyclic operation between VPG-VRFB and Nafion-VRFB: (a) CE, VE, and EE and (b) discharge capacity decay.

Figure 15.
The CE, VE, and EE of the VPG-VRFB and Nafion-VRFB as functions of temperature at a charge and discharge current density of 40 mA/cm2.
Figure 15.
The CE, VE, and EE of the VPG-VRFB and Nafion-VRFB as functions of temperature at a charge and discharge current density of 40 mA/cm2.

Figure 16.
ASR of the VPG and Nafion-117 membranes measured by EIS at different temperatures under VRFB operation conditions.
Figure 16.
ASR of the VPG and Nafion-117 membranes measured by EIS at different temperatures under VRFB operation conditions.

Figure 17.
Comparisons of cyclic operation between the VPG-VRFB and Nafion-VRFB at 45 °C for a current density of 40 mA/cm2: (a) CE, VE, and EE as functions of cycle number and (b) discharge capacity as a function of cycle number.
Figure 17.
Comparisons of cyclic operation between the VPG-VRFB and Nafion-VRFB at 45 °C for a current density of 40 mA/cm2: (a) CE, VE, and EE as functions of cycle number and (b) discharge capacity as a function of cycle number.

Figure 18.
Charge–discharge curves at 40 mA/cm2 and 25 °C for VRFBs before and after the 40-cycle operations at 45 °C: (a) VPG-VRFB and (b) Nafion-VRFB.
Figure 18.
Charge–discharge curves at 40 mA/cm2 and 25 °C for VRFBs before and after the 40-cycle operations at 45 °C: (a) VPG-VRFB and (b) Nafion-VRFB.

Figure 19.
Schematic diagram of the ion diffusion measurement system [16].
Figure 19.
Schematic diagram of the ion diffusion measurement system [16].

Figure 20.
Photograph showing colors of 0.1 M vanadium sulfate solutions in 2 M H2SO4 observed after completing charging (V2+ and VO2+) and discharging (V3+ and VO2+).
Figure 20.
Photograph showing colors of 0.1 M vanadium sulfate solutions in 2 M H2SO4 observed after completing charging (V2+ and VO2+) and discharging (V3+ and VO2+).


Table 1.
Ion fluxes, overall ion transport coefficients, and proton transport selectivity over vanadium ions on the VPG and Nafion membranes determined by the solution diffusion experiments.
Table 1.
Ion fluxes, overall ion transport coefficients, and proton transport selectivity over vanadium ions on the VPG and Nafion membranes determined by the solution diffusion experiments.
| Membrane: VPG | |||||
|---|---|---|---|---|---|
| Ion | Ji (10−4 mol/m2·s) | Ki (10−12 m2/s) | αH+/V(n+) | ||
| JV(n+) | JH+ | KV(n+) | KH+ | ||
| V2+ | 0.102 | 2.42 | 2.55 | 30.3 | 23.7 |
| V3+ | 0.081 | 2.29 | 2.03 | 28.6 | 28.3 |
| V4+ (VO2+) | 0.186 | 3.44 | 4.65 | 43.0 | 18.5 |
| V5+ (VO2+) | 0.131 | 3.69 | 3.28 | 46.1 | 28.2 |
| Membrane: Nafion | |||||
| Ion | Ji (10−4 mol/m2·s) | Ki (10−12 m2/s) | αH+/V(n+) | ||
| JV(n+) | JH+ | KV(n+) | KH+ | ||
| V2+ | 0.079 | 3.69 | 0.723 | 16.9 | 46.7 |
| V3+ | 0.110 | 4.19 | 1.01 | 19.2 | 38.1 |
| V4+ (VO2+) | 0.175 | 4.94 | 1.60 | 22.6 | 28.2 |
| V5+ (VO2+) | 0.098 | 4.19 | 0.897 | 19.2 | 42.8 |
Table 2.
Atomic compositions of the Nafion and VPG membrane surfaces measured by EDS for samples equilibrated in 2 M vanadium sulfate (V2+, V3+, VO2+, and VO2+) solutions in 2 M H2SO4.
Table 2.
Atomic compositions of the Nafion and VPG membrane surfaces measured by EDS for samples equilibrated in 2 M vanadium sulfate (V2+, V3+, VO2+, and VO2+) solutions in 2 M H2SO4.
| Nafion | |||||
| Ion | Fresh | V2+ | V3+ | VO2+ | VO2+ |
| C | 0.345 | 0.154 | 0.237 | 0.308 | 0.349 |
| O | 0.101 | 0.378 | 0.243 | 0.127 | 0.113 |
| F | 0.539 | 0.361 | 0.468 | 0.540 | 0.517 |
| S | 0.016 | 0.078 | 0.041 | 0.021 | 0.019 |
| V | 0.000 | 0.030 | 0.012 | 0.004 | 0.002 |
| Total | 1.000 | 1.000 | 1.000 | 1.000 | 1.000 |
| VPG | |||||
| Ion | Fresh | V2+ | V3+ | VO2+ | VO2+ |
| Si | 0.329 | 0.331 | 0.332 | 0.323 | 0.334 |
| O | 0.671 | 0.657 | 0.658 | 0.662 | 0.657 |
| S | 0.000 | 0.009 | 0.008 | 0.011 | 0.006 |
| V | 0.000 | 0.003 | 0.002 | 0.004 | 0.003 |
| Total | 1.000 | 1.000 | 1.000 | 1.000 | 1.000 |
Table 3.
Charge–discharge efficiencies measured at 25 °C under a current density of 40 mA/cm2 for the VRFBs before and after operating at 45 °C.
Table 3.
Charge–discharge efficiencies measured at 25 °C under a current density of 40 mA/cm2 for the VRFBs before and after operating at 45 °C.
| Ion Separator | CE, % | VE, % | EE, % |
|---|---|---|---|
| VPG after 40 cycles at 45 °C | 97.1 | 79.7 | 77.3 |
| Fresh VPG | 94.4 | 83.8 | 79.1 |
| Nafion after 40 cycles at 45 °C | 98.2 | 79.8 | 78.4 |
| Fresh Nafion | 97.2 | 89.3 | 86.8 |
© 2019 by the authors. Licensee MDPI, Basel, Switzerland. This article is an open access article distributed under the terms and conditions of the Creative Commons Attribution (CC BY) license (http://creativecommons.org/licenses/by/4.0/).
Share and Cite
MDPI and ACS Style
Michos, I.; Cao, Z.; Xu, Z.; Jing, W.; Dong, J. Investigations on a Mesoporous Glass Membrane as Ion Separator for a Redox Flow Battery. Batteries 2019, 5, 6. https://doi.org/10.3390/batteries5010006
AMA Style
Michos I, Cao Z, Xu Z, Jing W, Dong J. Investigations on a Mesoporous Glass Membrane as Ion Separator for a Redox Flow Battery. Batteries. 2019; 5(1):6. https://doi.org/10.3390/batteries5010006
Chicago/Turabian StyleMichos, Ioannis, Zishu Cao, Zhi Xu, Wenheng Jing, and Junhang Dong. 2019. "Investigations on a Mesoporous Glass Membrane as Ion Separator for a Redox Flow Battery" Batteries 5, no. 1: 6. https://doi.org/10.3390/batteries5010006
Note that from the first issue of 2016, this journal uses article numbers instead of page numbers. See further details here.