Article

Updated Assessment of Temperature Extremes over the Middle East–North Africa (MENA) Region from Observational and CMIP5 Data

1
Climate and Atmosphere Research Center (CARE-C), The Cyprus Institute, 20 Konstantinou Kavafi Street, Nicosia 2121, Cyprus
2
Department of Atmospheric Chemistry, Max Planck Institute for Chemistry (MPIC), Hahn-Meitner-Weg 1, 55128 Mainz, Germany
*
Author to whom correspondence should be addressed.
Atmosphere 2020, 11(8), 813; https://doi.org/10.3390/atmos11080813
Submission received: 10 July 2020 / Revised: 29 July 2020 / Accepted: 29 July 2020 / Published: 31 July 2020

Abstract

:
The objective of this analysis is to provide an up-to-date observation-based assessment of the evolution of temperature extremes in the Middle East–North Africa (MENA) region and evaluate the performance of global climate model simulations of the past four decades. A list of indices of temperature extremes, based on absolute level, threshold, percentile and duration is used, as defined by the Expert Team on Climate Change Detection and Indices (ETCCDI). We use daily near-surface air temperature (Tmax and Tmin) to derive the indices of extremes for the period 1980–2018 from: (i) re-analyses (ERA-Interim, MERRA-2) and gridded observational data (Berkeley Earth) and (ii) 18 CMIP5 model results combining historical (1950–2005) and scenario runs (2006–2018 under RCP 2.6, RCP 4.5 and RCP 8.5). The CMIP5 results show domain-wide strong, statistically significant warming, while the observation based ones are more spatially variable. The CMIP5 models capture the climatology of the hottest areas in the western parts of northern Africa and the Gulf region with the thewarmest day (TXx) > 46 °C and warmest night (TNx) > 33 °C. For these indices, the observed trends are about 0.3–0.4 °C/decade while they are 0.1–0.2 °C/decade stronger in the CMIP5 results. Overall, the modeled climate warming up to 2018, as reflected in the indices of temperature extremes is confirmed by re-analysis and observational data.

1. Introduction

The global average air temperature near the Earth’s surface has increased by approximately 1 °C above the pre-industrial levels and this warming was likely due to man-made forcing by increased green-house gas (GHG) levels, as reported in the Intergovernmental Panel on Climate Change (IPCC) Special Report on Global Warming of 1.5 °C [1]. In addition to this shift in the mean climate, changes in weather and climate extremes have been observed. During 1951–2003 over 70% of the global land area sampled showed a significant decrease in annual occurrence of cold nights and a significant increase in the annual occurrence of warm nights [2]. In situ observations reveal widespread significant changes in temperature extremes consistent with warming, especially for those indices derived from daily minimum temperature over the whole 110 years of record but with stronger trends in more recent decades [3].
In this global background, the Middle East–North Africa (MENA) region emerges as a climate change hotspot, with temperature increases and rainfall reductions since the middle of the 20th century [4,5,6,7]. Several studies based on long-term temperature station data suggest that since the 1970s, not only the mean climate, but also temperature related extremes have intensified in the MENA [8,9,10]. El Kenawy et al. [11] found that in Egypt, the frequency, intensity, and persistence of warm extremes increased significantly from 1983 to 2015, with a clear spatial gradient from southeast (larger) to northwest (smaller). Almazroui et al. [12] showed that in more than 90% of the analyzed station data from Saudi Arabia displayed an increase in the annual occurrence of warm days and nights and decrease in the occurrence of cool days and nights, with accelerating trends in the more recent past (1996–2010) compared to an earlier period (1981–1995).
Analysis of projections from the Coupled Model Intercomparison Project Phase 5 (CMIP5) [13], can provide estimates for future changes in temperature related extremes, which vary according to world region, emissions scenario, and time period in the 21st century [14]. For the MENA, the CMIP5 models project sharp increases in the number of warm days and nights, and in the maximum temperature during the hottest days which may reach 50 °C by the end of the century according to the business-as-usual Representative Concentration Pathway (RCP 8.5) [15]. Similar results are obtained for the region, when the Global Climate Model (GCM) projections are dynamically downscaled with the use of regional climate models (RCM), suggesting an alarming intensification of future heat stress conditions [16,17,18,19,20]. Heat extremes are recognized as the major weather-related cause of premature mortality [21,22], hence their augmentation in the MENA is of particular concern. Heat stress can also cause substantial loss of labor productivity [23] and it may be linked to conflict and migration [24] thus, apart from the direct health consequences, social, economic and political contexts are also important and are all relevant for the MENA [25].
Considering the intensifying warming trend and impact of heat extremes it is important to thoroughly evaluate the performance of the still commonly used CMIP5 models over the MENA region. The analysis of climate extremes is facilitated by a standard procedure that defines a set of temperature and precipitation indices, the Expert Team on Climate Change Detection and Indices (ETCCDI) [26]. Sillmann et al. [27] compared ETCCDI indices computed from observations and CMIP5 model simulations for the globe, and found that the GCMs were generally able to reproduce the historical trend patterns of the climate extreme indices. The comparison by Lelieveld et al. [15] of the temperature ETCCDI for the period 1986–2005 for the MENA region indicated a good agreement between the HadEX2 observational dataset [3] and the CMIP5 historical simulation.
In this study, we update and assess the evolution of the observed and modeled temperature extremes in the MENA region up to 2018. In the CMIP5 analysis we consider the output of 18 GCMs from the historical forcing runs until 2005, and beyond 2005 from the Representative Concentration Pathway (RCP) model simulations [28] for radiative forcing values 2.6, 4.5 and 8.5 W/m2, thus extending, by more than one decade (up to 2018), the model dataset available for evaluation, covering the more recent past. For this purpose, we use two re-analysis datasets, the ERA-Interim [29] and MERRA-2 [30] as well as the Berkeley Earth gridded observational data [31]. These datasets include the daily values of maximum and minimum temperature required for the calculation of the ETCCDI indices up to 2018 and allow for an up-to-date assessment of their evolving climatology and trends.
We organize the paper as follows. The analyzed data sets and the employed tools and methods for the computation and analysis of the indices are described in Section 2. In Section 3 the observed and modeled ETCCDI for temperature are analyzed for climatology and trends spatially, temporally and with boxplots, and including bias estimations for the 18 CMIP5 models individually. Section 4 contains a summary and the conclusions.

2. Data and Methodology

2.1. Data

2.1.1. Global Climate Models

Daily minimum and maximum near-surface air temperatures (TN and TX, respectively) were retrieved from the Earth System Grid Federation (ESGF) data portal (https://esgf-node.llnl.gov/projects/esgf-llnl/) for 18 CMIP5 models. For model evaluation in the present study we consider only one (typically the first) ensemble member of each model. The data were acquired from the historical simulations for the period 1950–2005 and scenario projections for the period 2006–2018 (under the RCP 2.6, RCP 4.5 and RCP 8.5). The complete set of 18 models is summarized in Table 1.

2.1.2. Re-Analyses and Observations

For the purposes of assessing the model performance, re-analysis data were used. Such data sets are often used for model evaluation also because of their gridded format, complete global spatial coverage and similarity of scales represented. They are produced via data assimilation, a process that relies on both observations and model-based forecasts with variables that are directly assimilated in the re-analysis forecast model to be typically closer to observations.
In this study, we derived indices for two re-analysis datasets: ERA-Interim [29] and MERRA-2 [46]. ERA-Interim was developed by the European Centre for Medium-Range Weather Forecasts (ECMWF), and is available from 1979 until August 2018. The data assimilation method used to produce ERA-Interim is based on a 4-D variational scheme (4D-Var) with a 12 h analysis window [47]. The Modern-Era Retrospective Analysis for Research and Applications, version 2 (MERRA-2) is created by NASA’s Global Modeling and Assimilation Office (GMAO) and is produced with version 5.12.4 of Goddard Earth Observing System (GEOS) atmospheric data assimilation system. For both, daily maximum and minimum temperature data were downloaded from the Climate Explorer website (https://climexp.knmi.nl). The ERA-Interim data are available on a regular 0.7 ° × 0.7 ° longitude/latitude 512 × 216 grid for the period from 1979 to 2018. The MERRA-2 dataset is available for the MENA region grid boxes on a 0.63 ° × 0.5 ° longitude/latitude 135 × 69 grid for the period from 1980 to 2018.
In addition, we used the gridded Berkeley Earth dataset [31]. The Berkeley Earth initiative has developed a new mathematical framework for producing maps and large-scale averages of temperature changes from weather station data for the purpose of climate analyses. The framework contains a weighting process that assesses the quality and consistency of a spatial network of temperature stations as an integral part of the averaging process. This permits data with varying levels of quality to be used without compromising the accuracy of the resulting reconstructions. The Berkeley dataset is provided only over land on a 1 ° × 1 ° grid from the Climate Explorer website (at the time of the performed analysis the last available year of the data was 2017). Therefore, due to the unavailability of data for 2018, the subsequent calculations and results for the Berkeley Earth dataset refer to the 1980–2017 period.

2.2. Methodology

2.2.1. Climate Extreme Indices Definition

The indices under investigation are defined and described in detail by Klein Tank et al. [48] and Zhang et al. [49] and can be subdivided into four categories: (1) absolute value indices, which describe, for instance, the hottest or the coldest day of the year; (2) threshold indices, which count the number of days when a fixed temperature threshold is exceeded, for instance, frost days; (3) duration indices, which provide the duration of hot or dry spells; (4) percentile-based threshold indices, which are the exceedance rates above or below a threshold, which is defined, as the 10th or 90th percentile derived from the 1981–2010 base period. The set of the 12 indices used is summarized in Table 2.

2.2.2. Data Processing and Calculations

The temperature-based indices are derived for the CMIP5 output, the two re-analyses, and the Berkeley Earth datasets. The calculations are performed with the R package climdex.pcic as documented at The Comprehensive R Archive Network website (https://cran.r-project.org/web/packages/climdex.pcic/climdex.pcic.pdf). In this analysis we used the 1981–2010 interval as a base period for the percentile-based calculations, as we focus on the recent past (until 2018), which is also possible considering the temporal coverage of the re-analyses daily data.
Since our analysis addresses the MENA region, we focused on a domain that extends from 12° N to 46° N, and from 20° W to 64° E, covering North Africa, Middle East, the Mediterranean and parts of south Europe. For the purpose of comparing indices among datasets of different native spatial resolution, we regridded the original daily temperature data to a common 45 × 19 grid ( 1.87 ° × 1.87 ° ), to maintain a balance between the coarser resolution of the CMIP5 models and the higher resolution of the re-analysis datasets. For the regridding we used a distance-weighted average remapping procedure (https://code.mpimet.mpg.de/projects/cdo/embedded/index.html#x1-6230002.12.4). We consider only grid points over land to focus on populated land areas. Due to the coarse resolution of the common grid, major islands in the Mediterranean, and southern Italy, are excluded from the analysis.
For the CMIP5 data, the indices were derived from the Tmax and Tmin daily timeseries for each model and RCP scenario, and the multi-model averages were subsequently estimated. For all datasets, the obtained annual time series of the indices were statistically treated and plotted as spatial climatologies, timeseries, trends and box-and-whisker plots (boxplots). For the trends, the slope was estimated by fitting a linear model (https://stat.ethz.ch/R-manual/R-devel/library/stats/html/lm.html) and its statistical significance was evaluated by the Mann-Kendall, ranked, non-parametric, test for monotonic trend (https://cran.r-project.org/web/packages/Kendall/Kendall.pdf). In the rest of the text we use the term “climatology” in the sense of long-term time average.

3. Results and Discussion

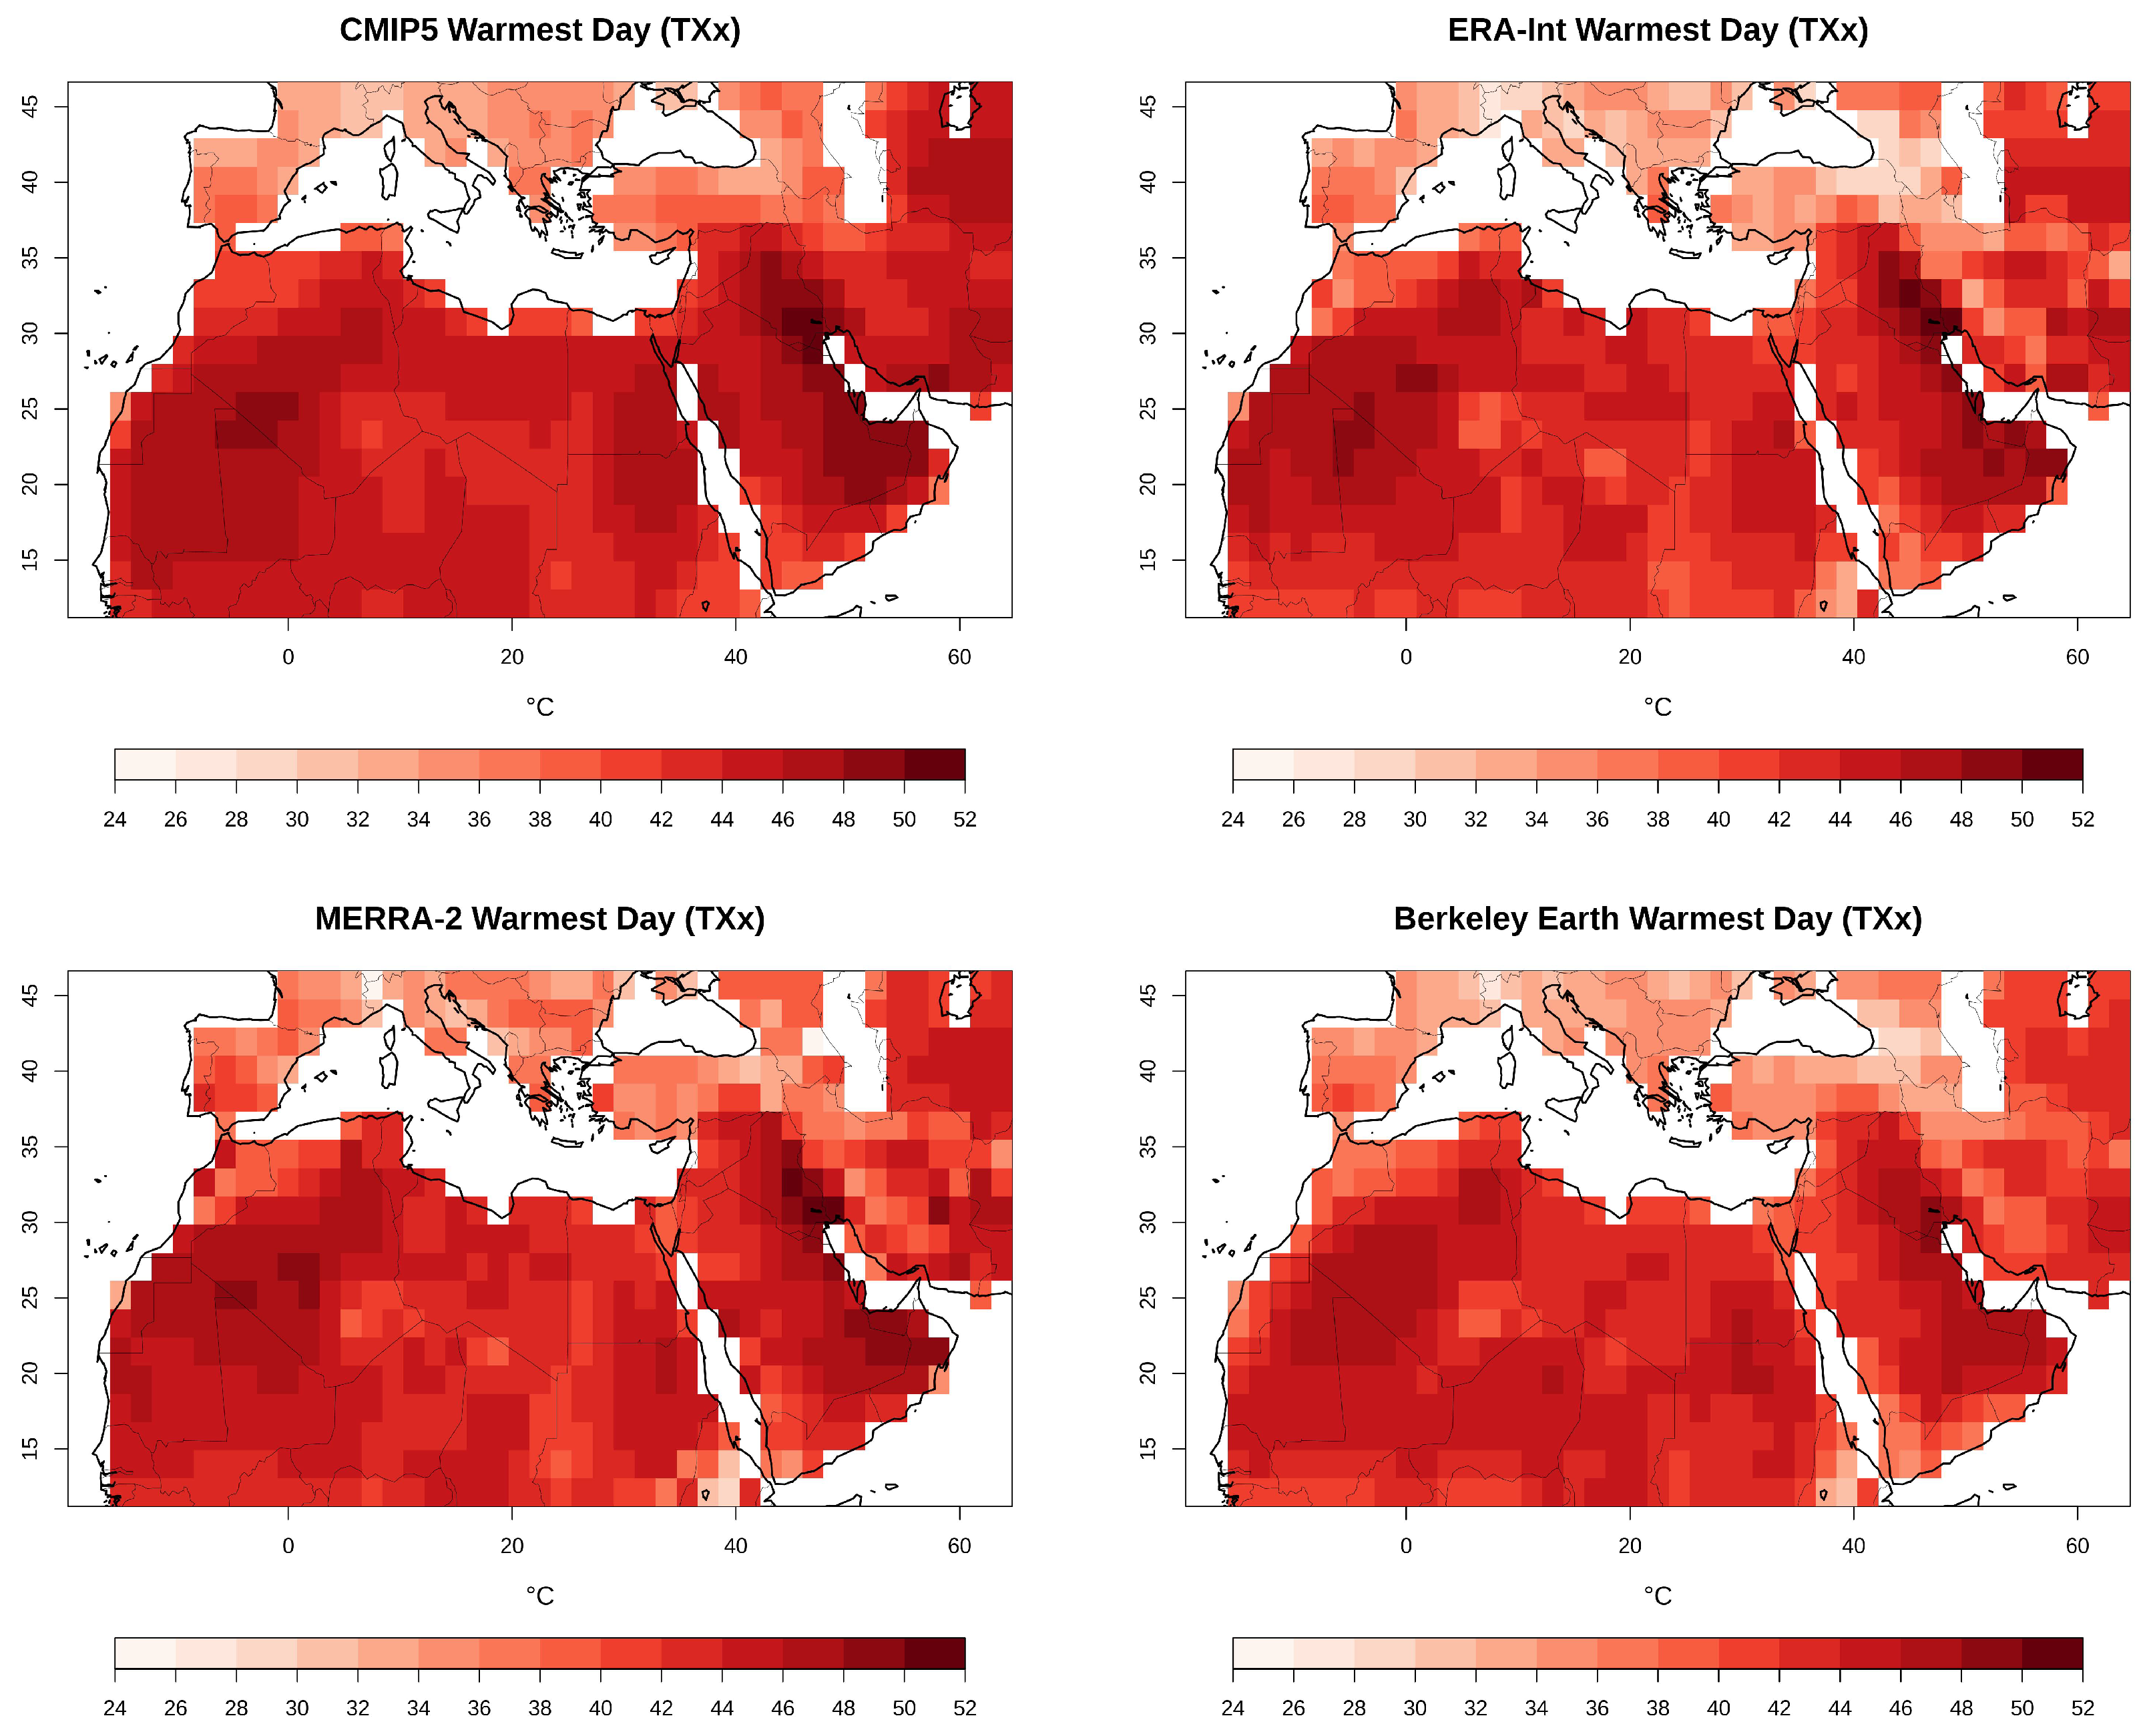
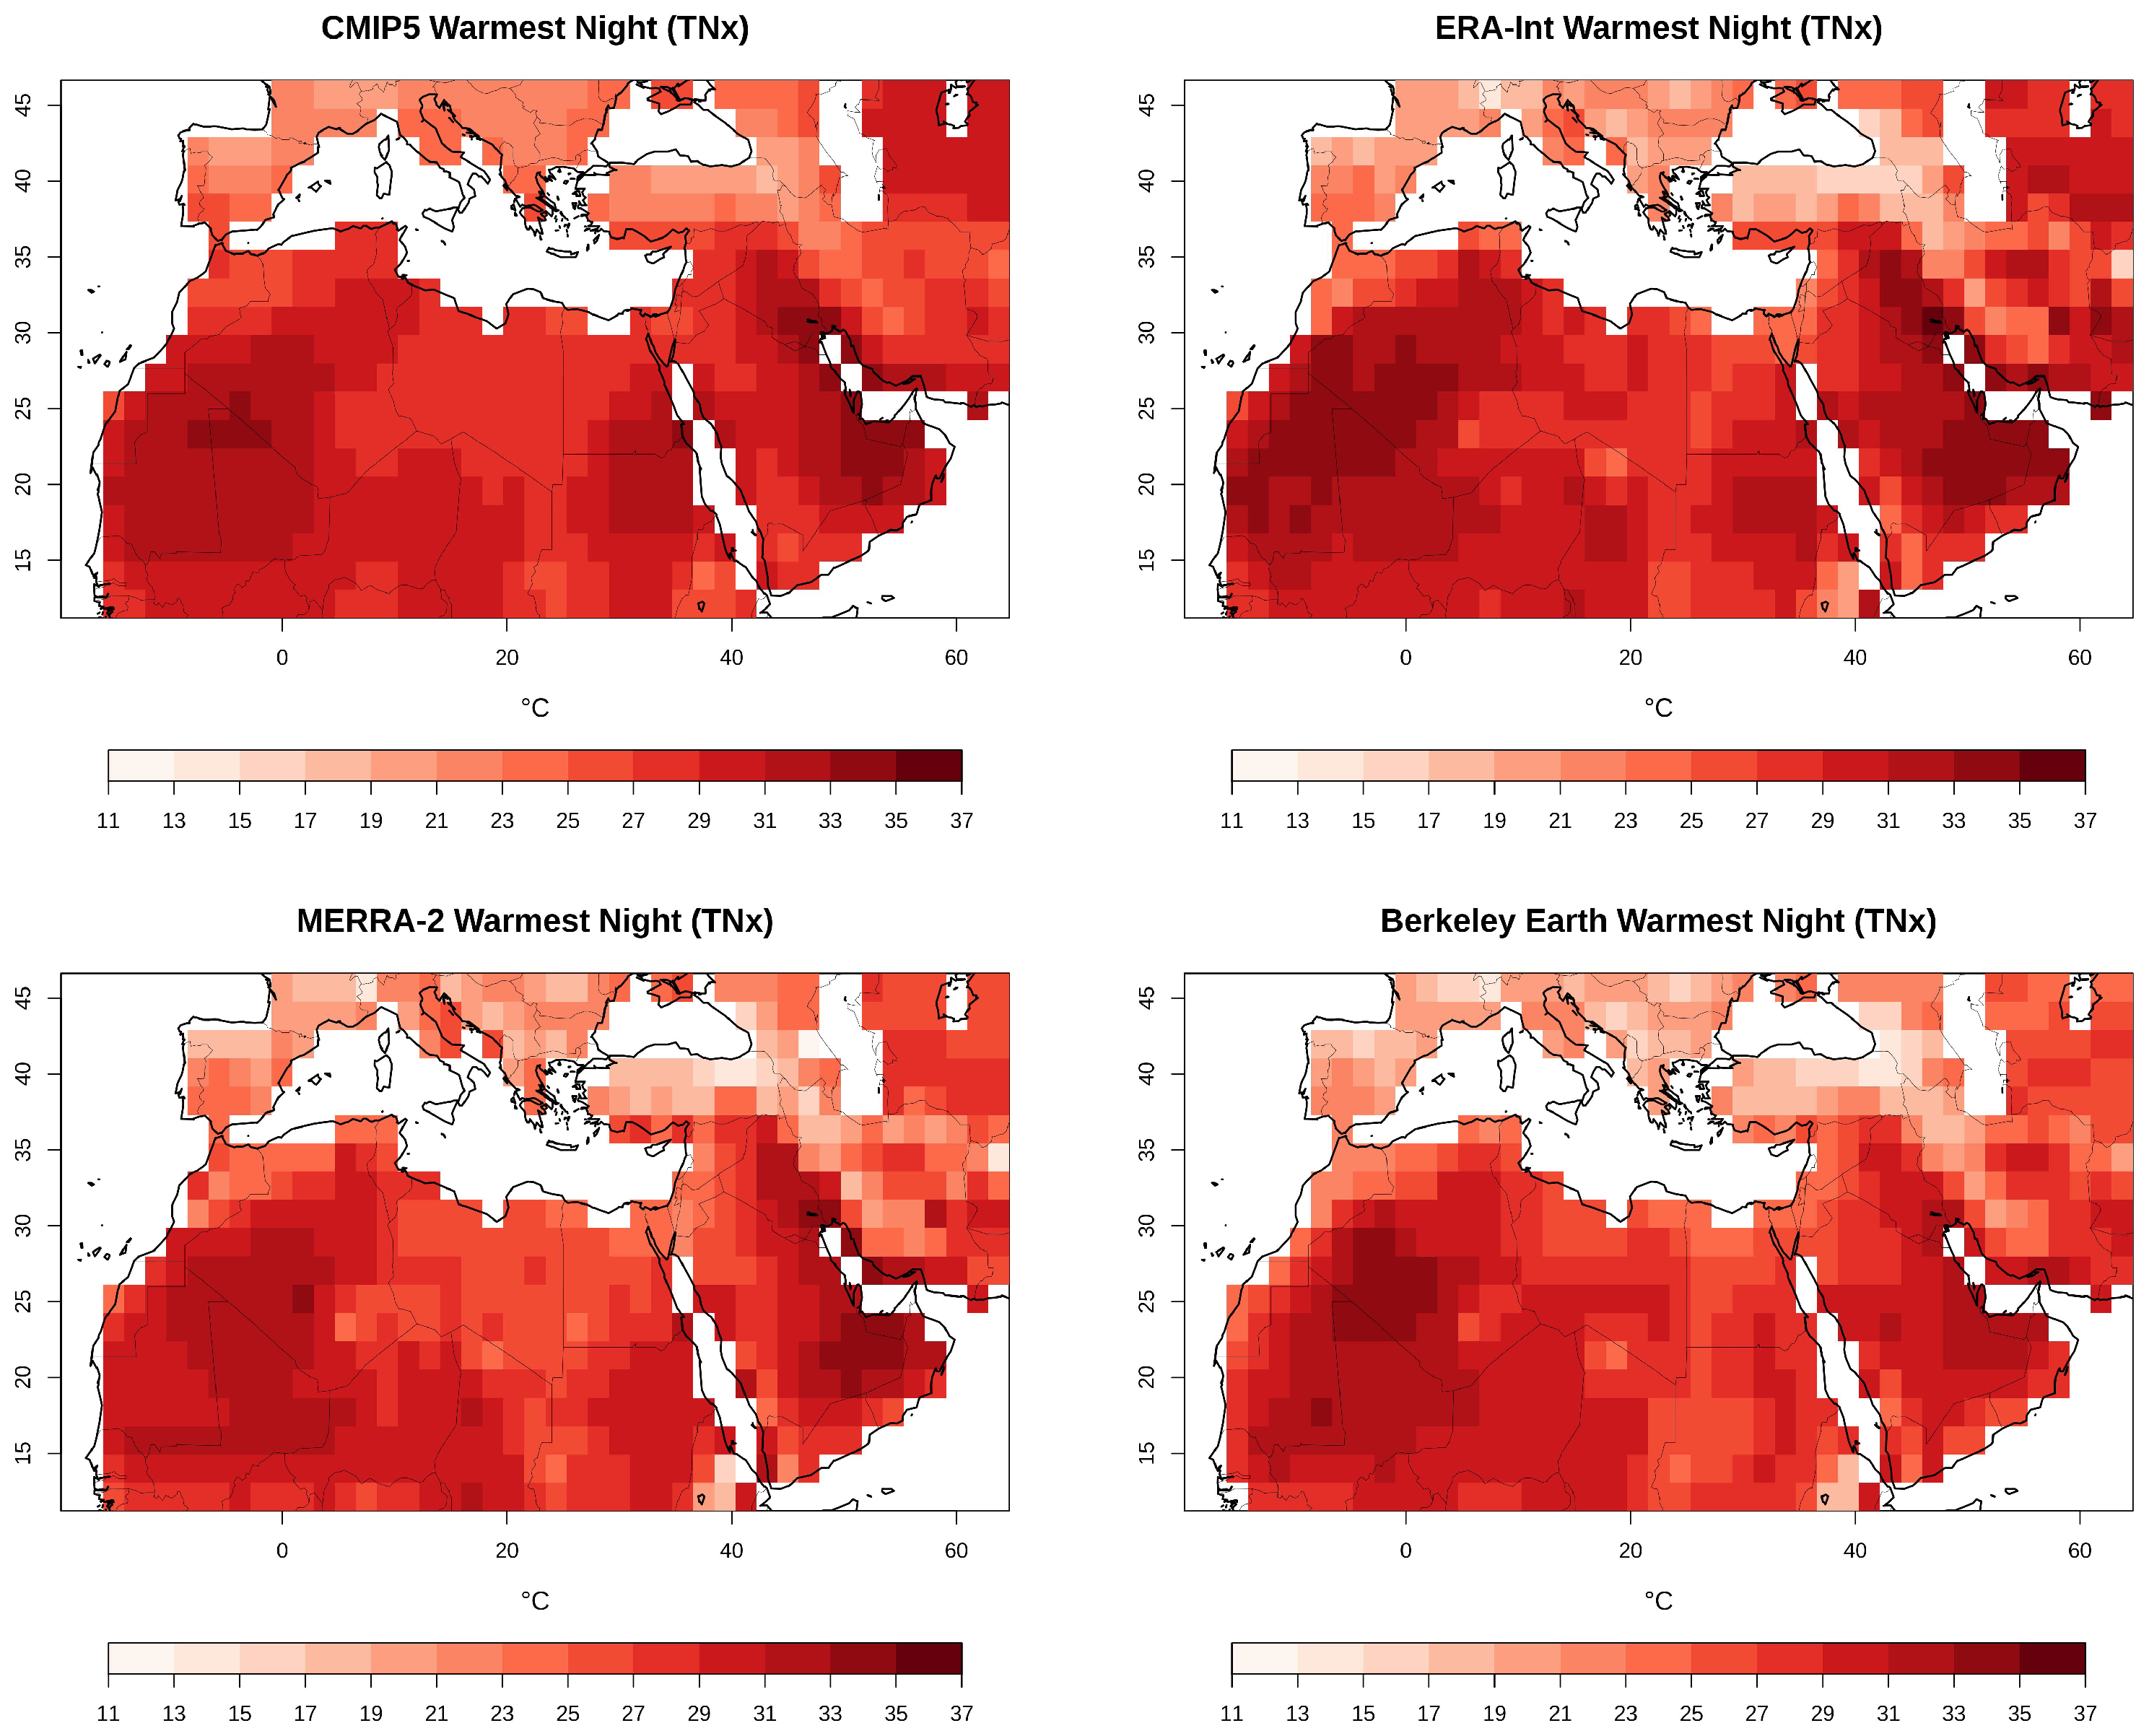
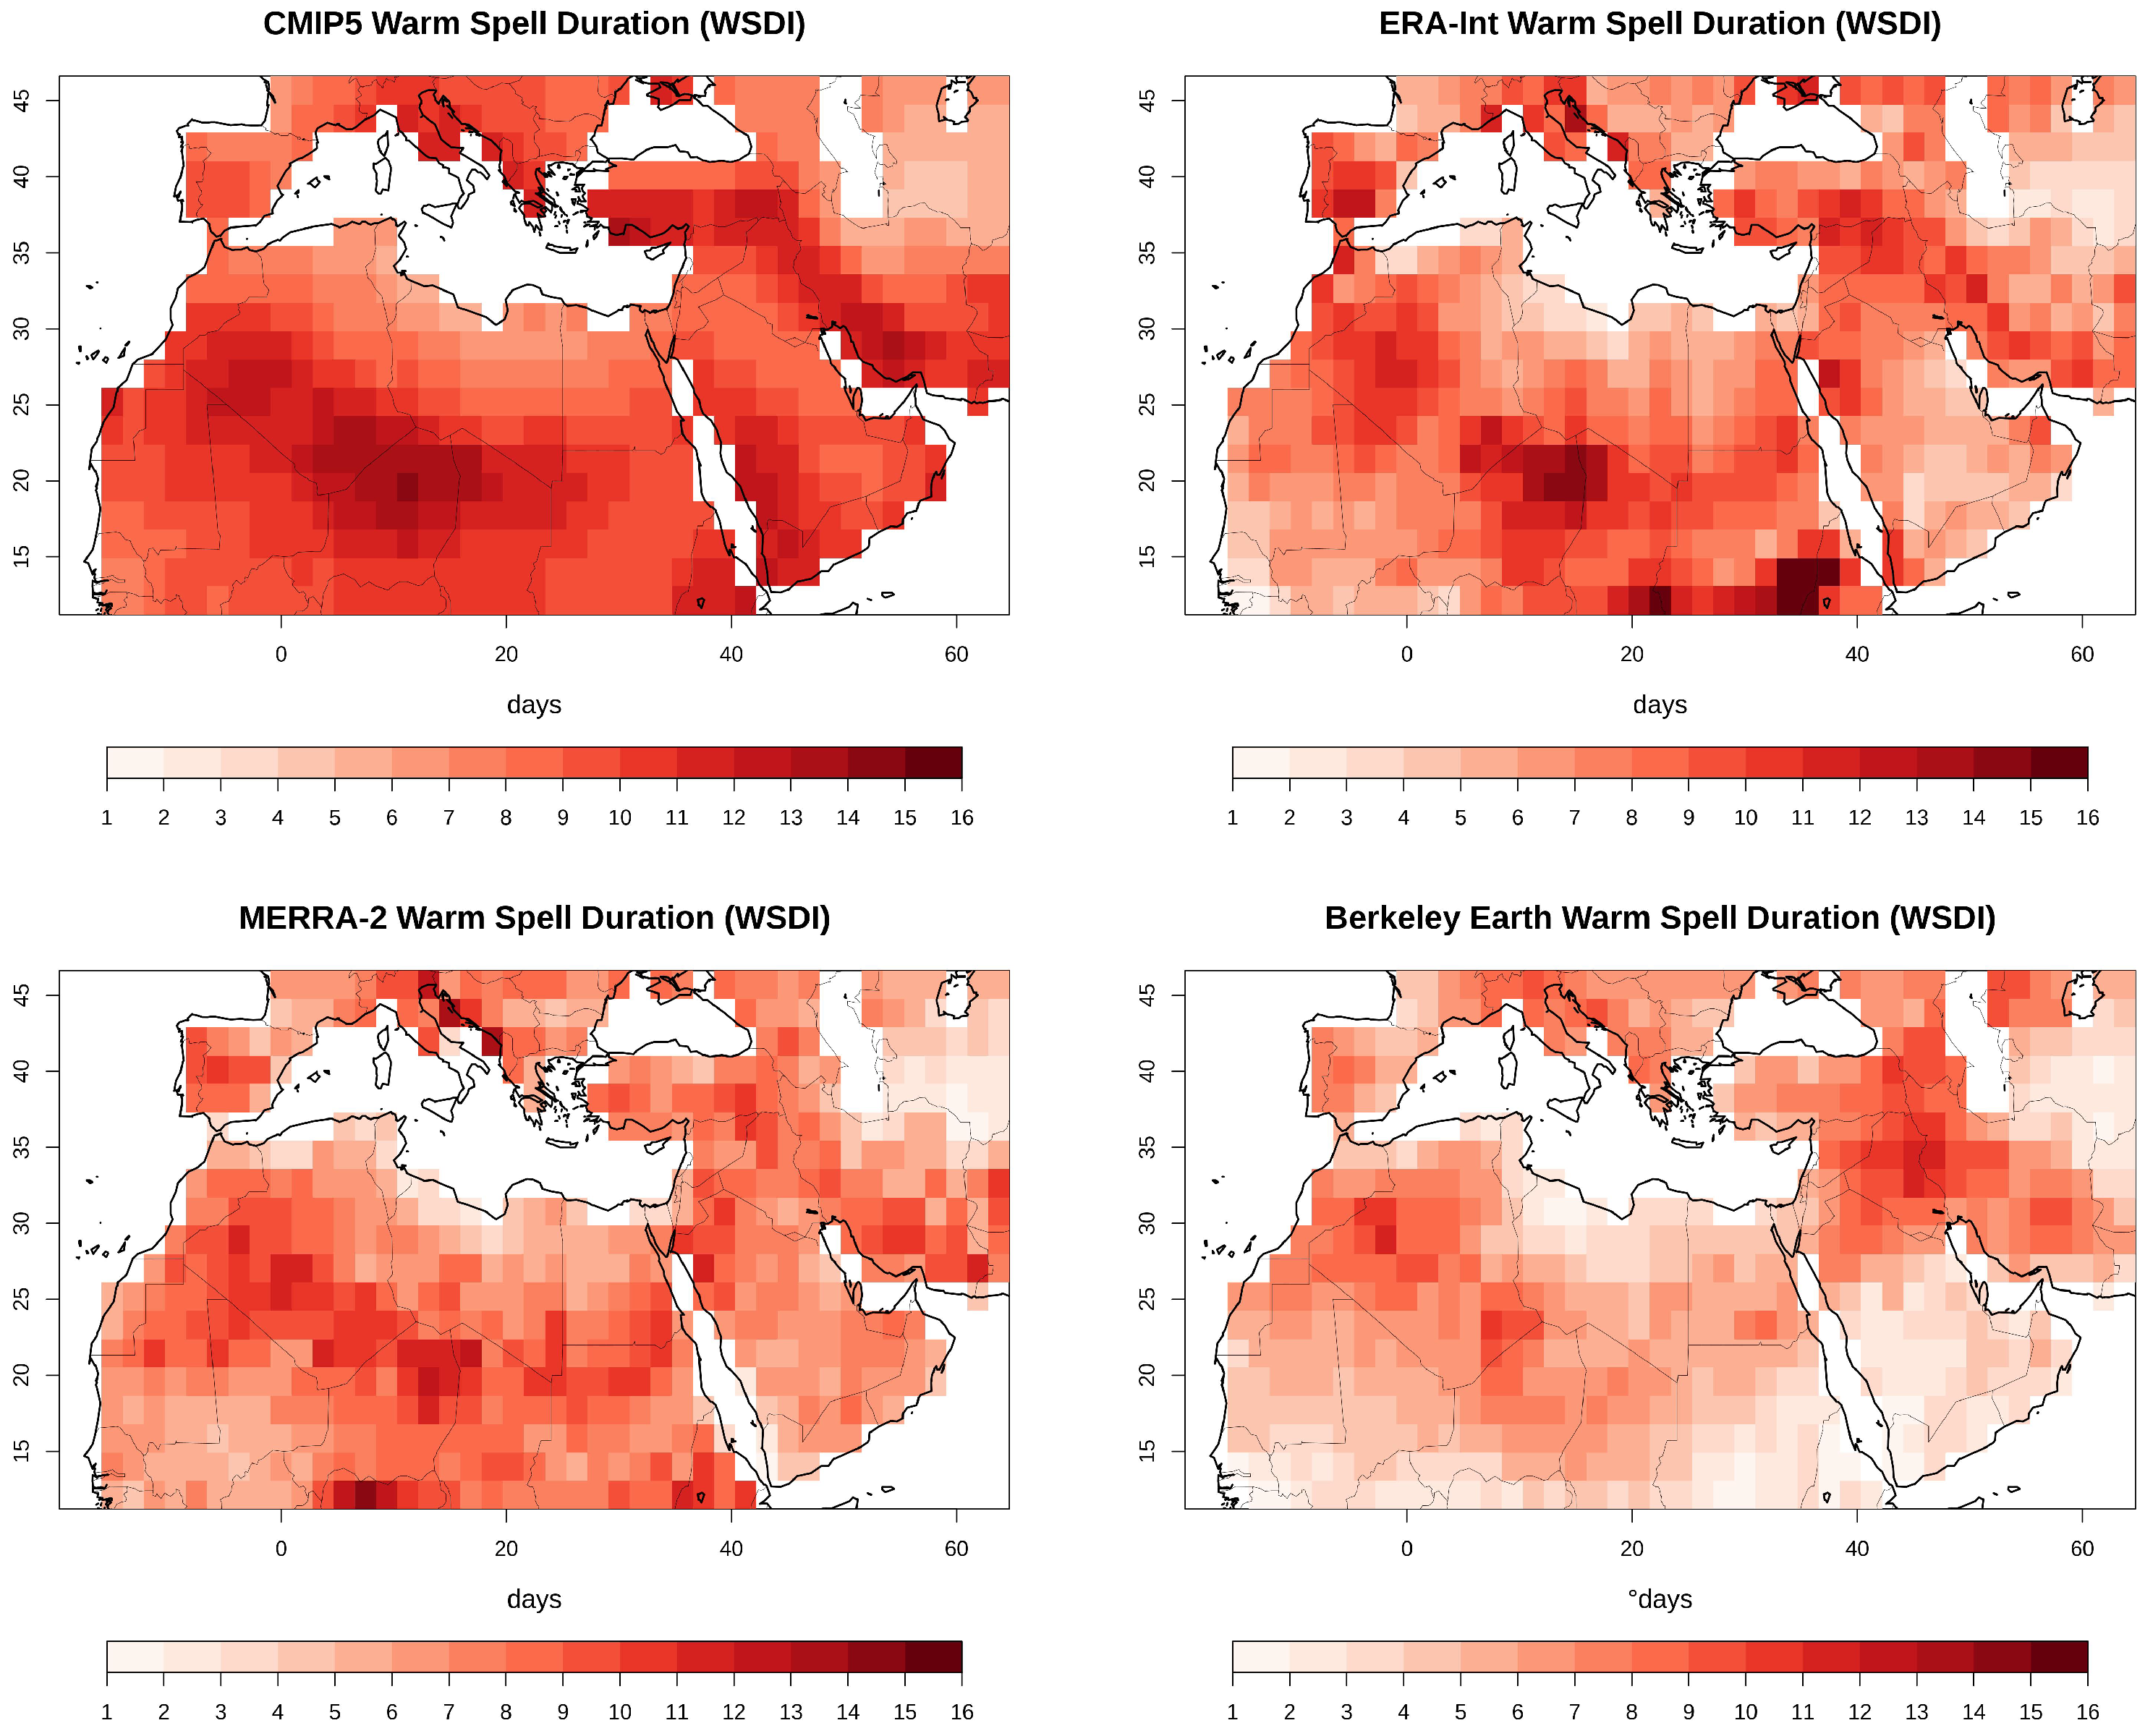
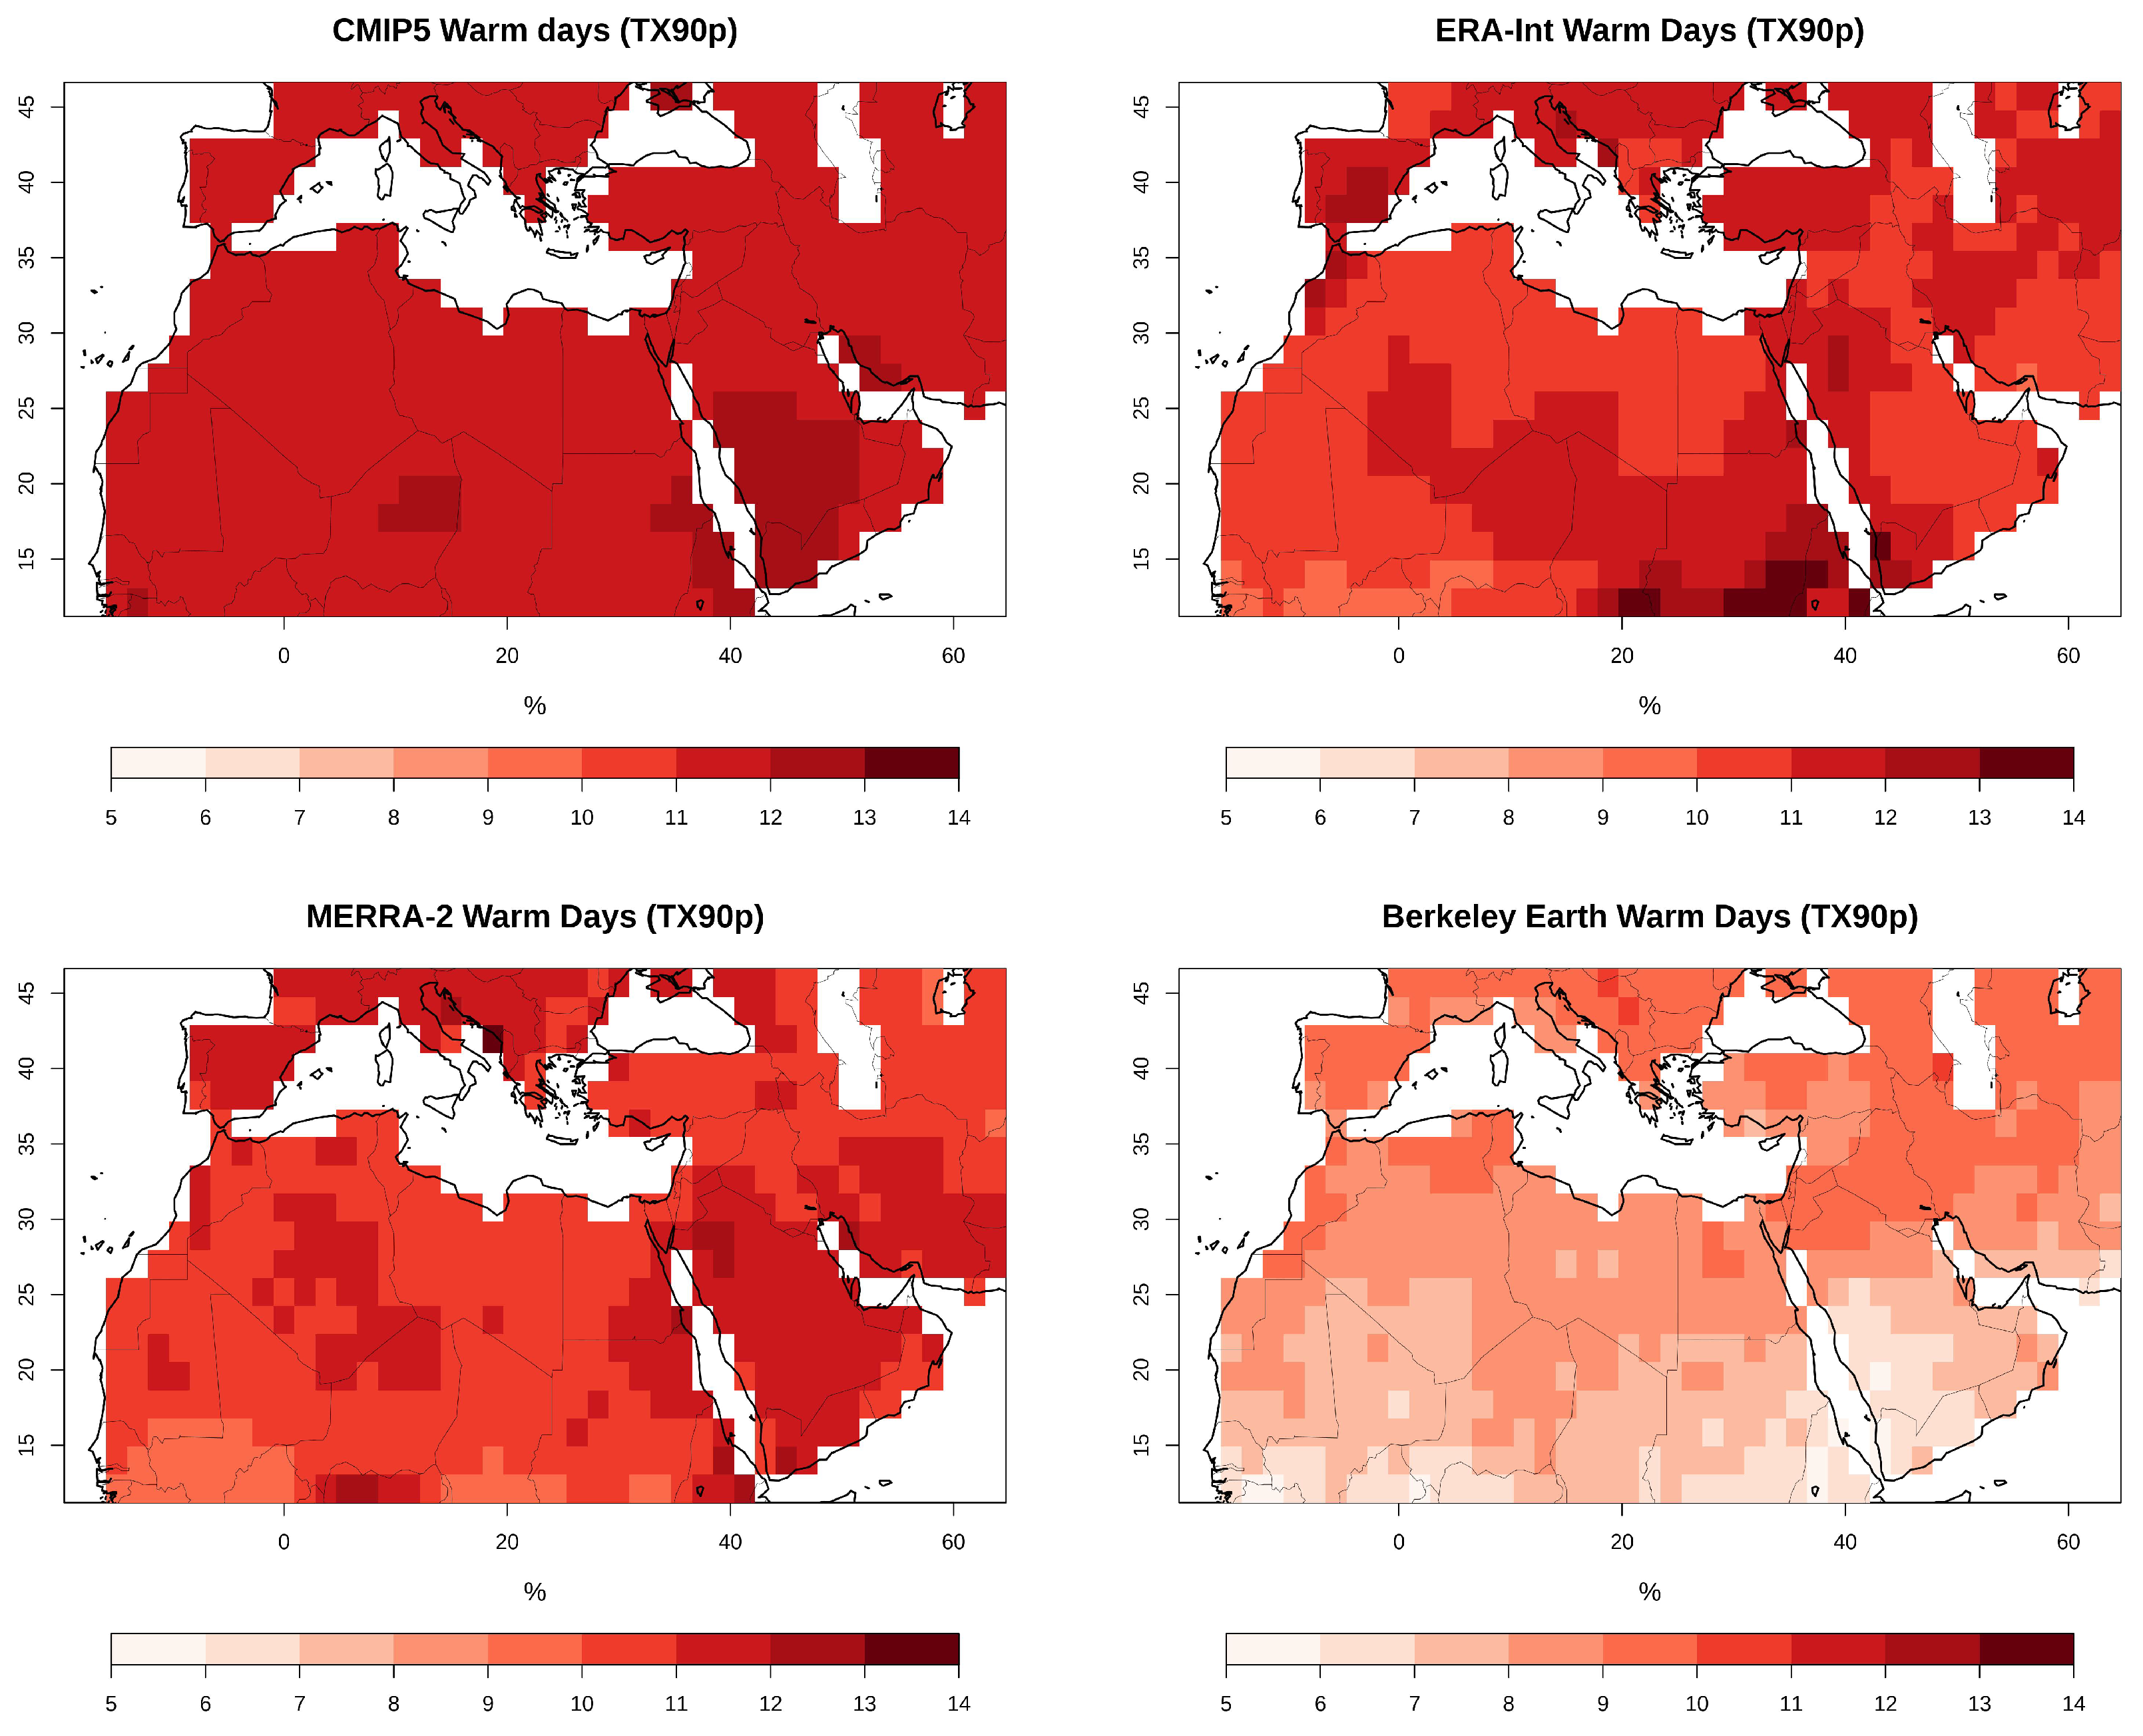
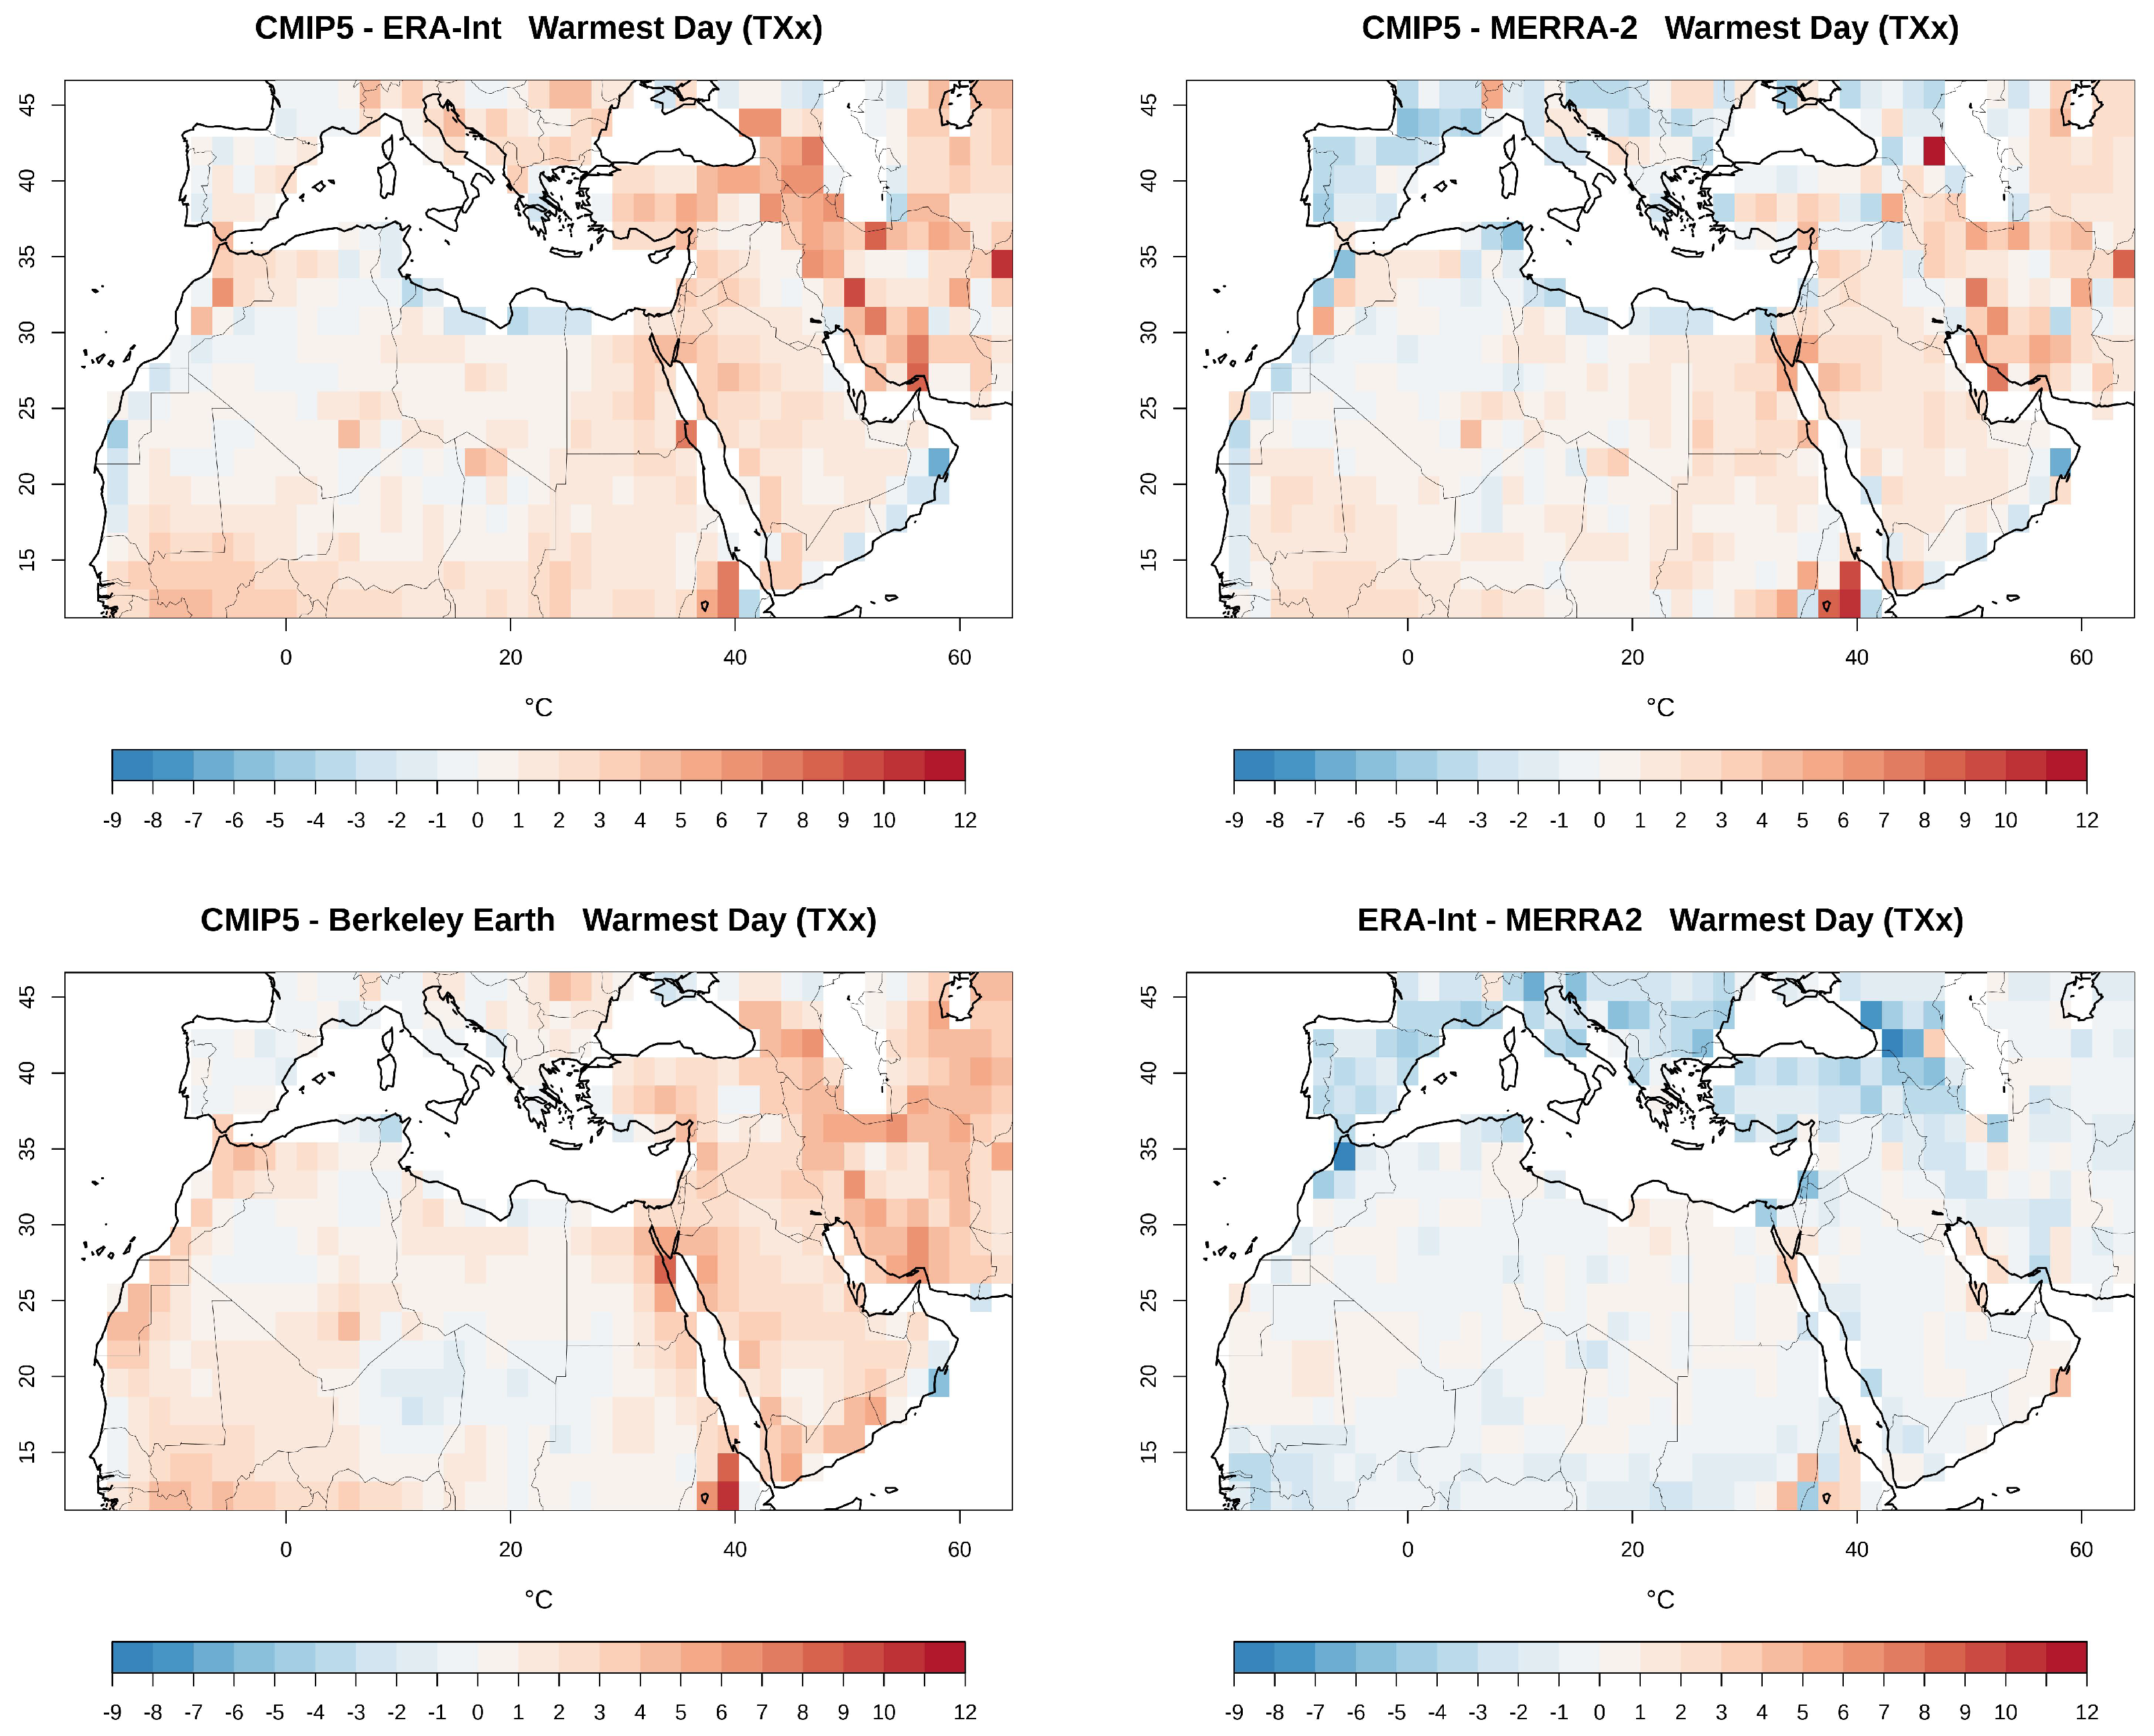
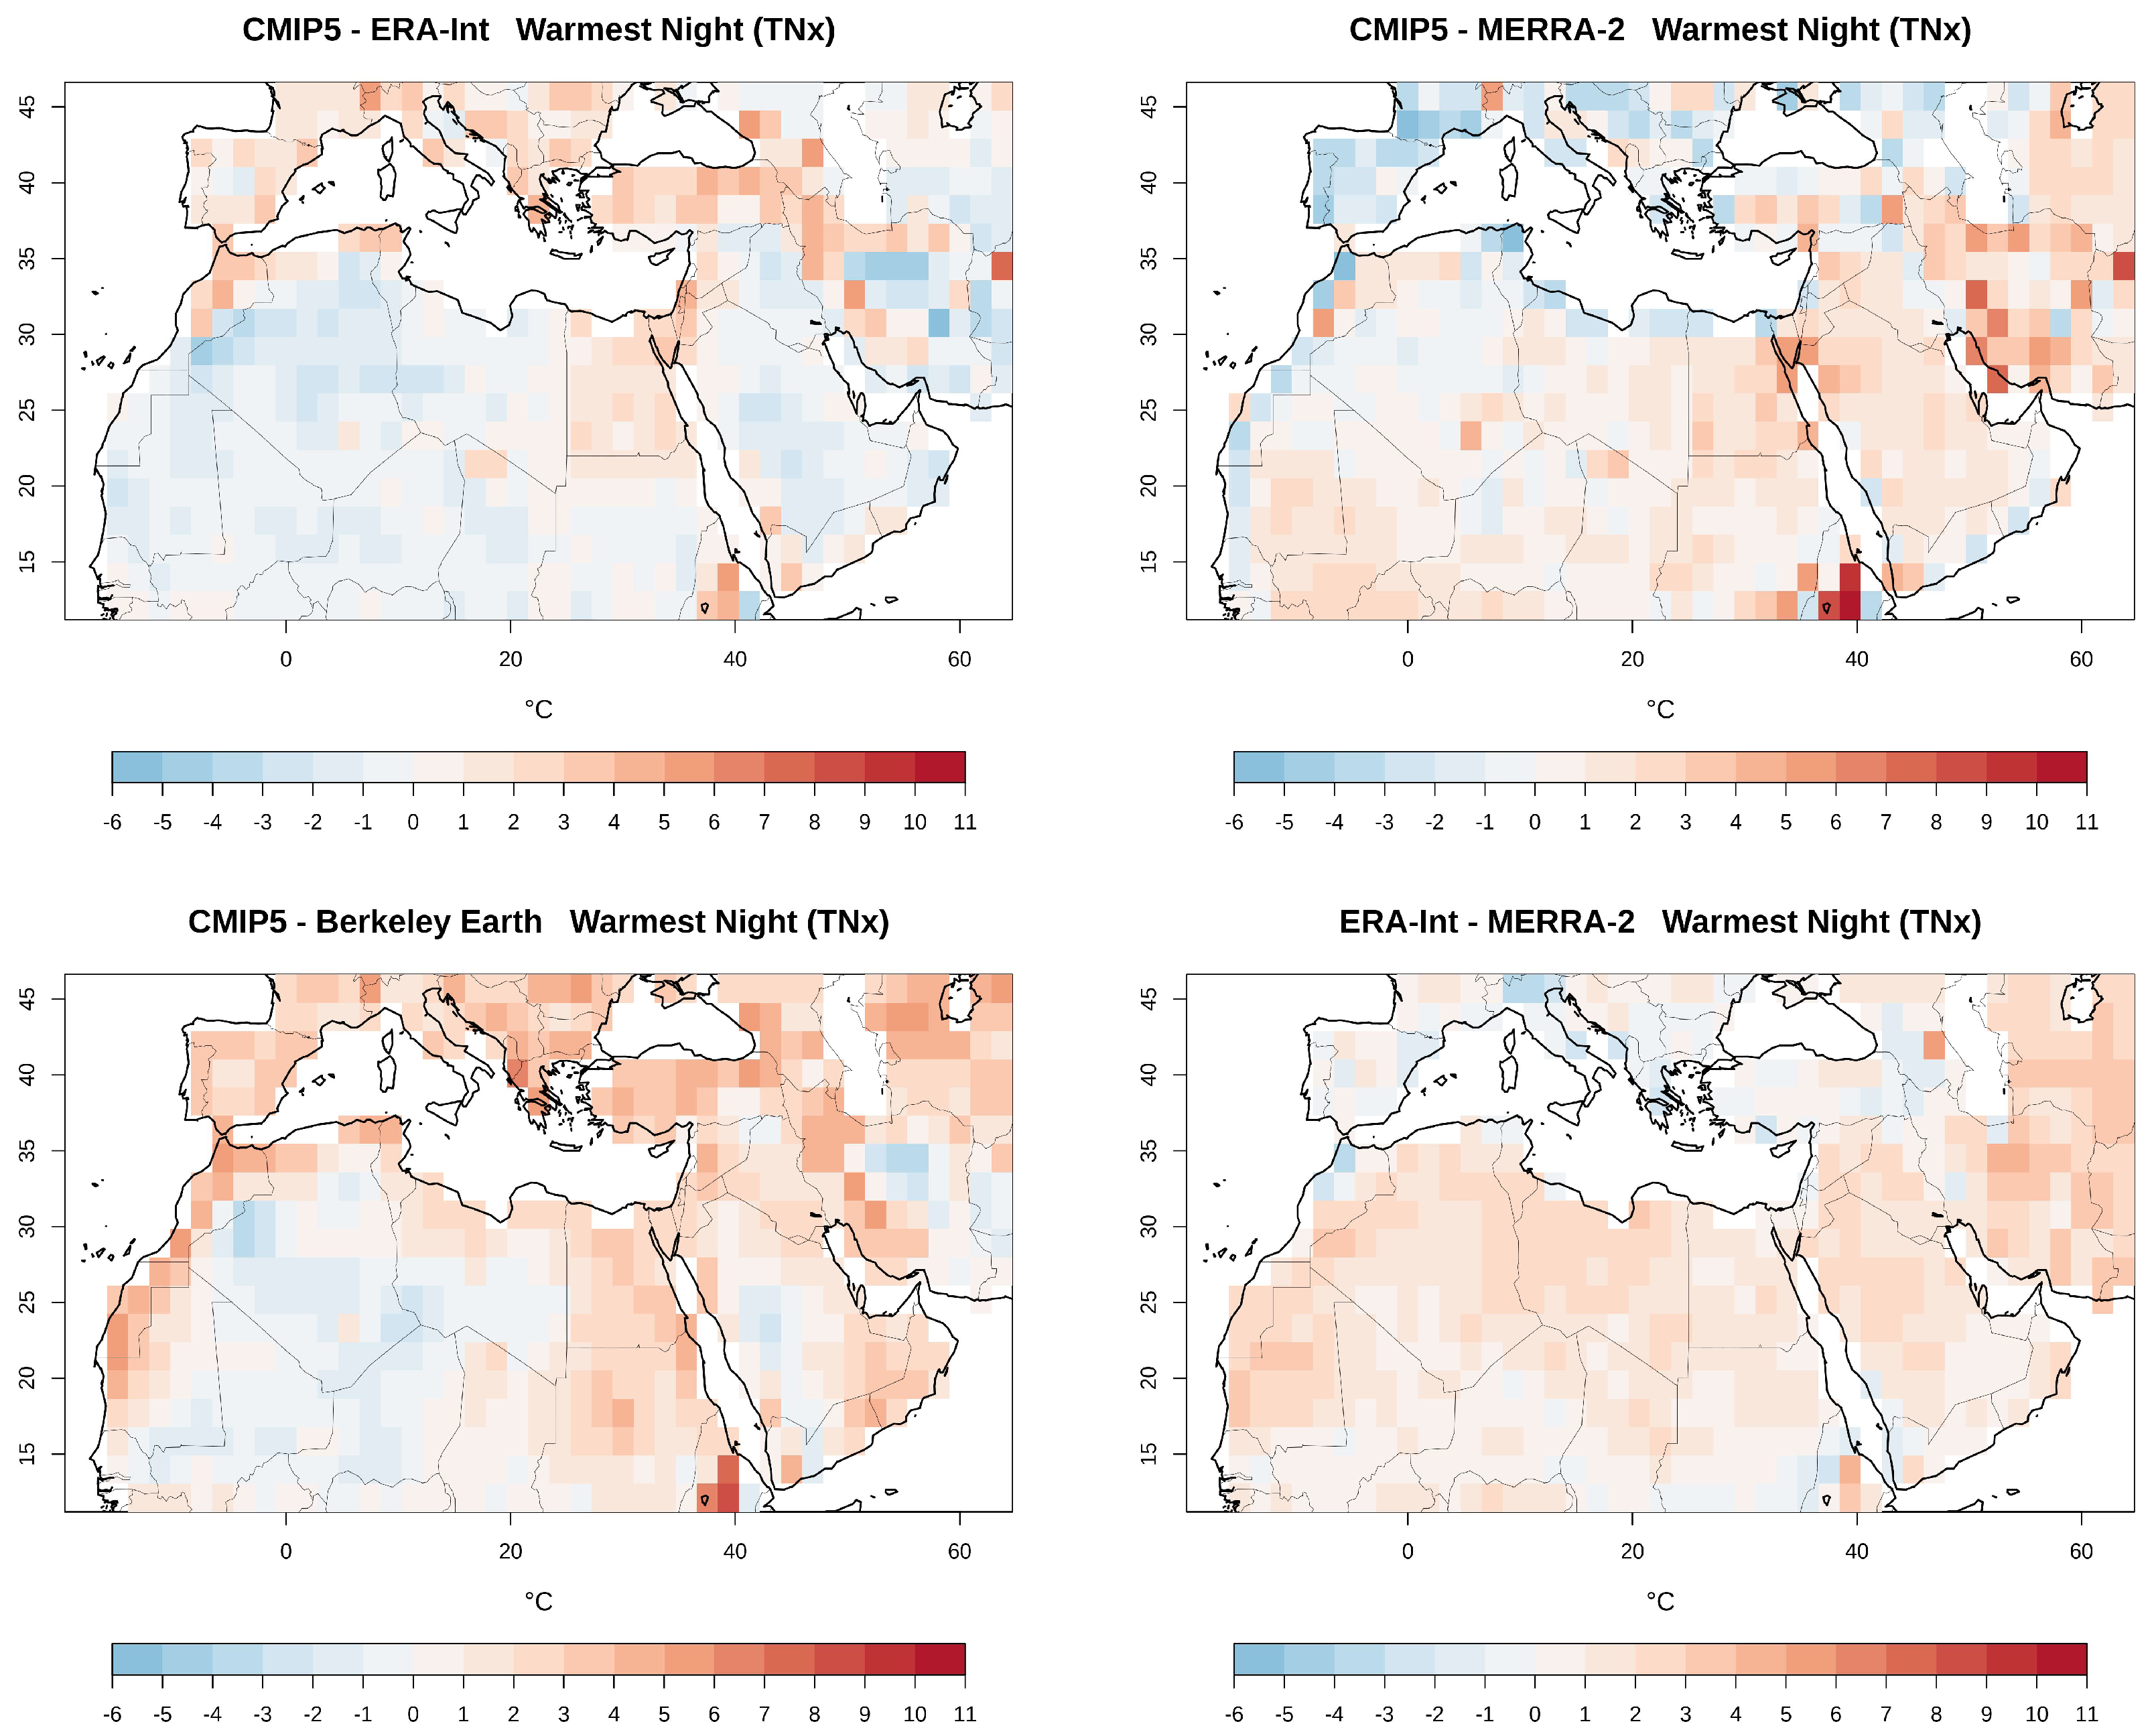
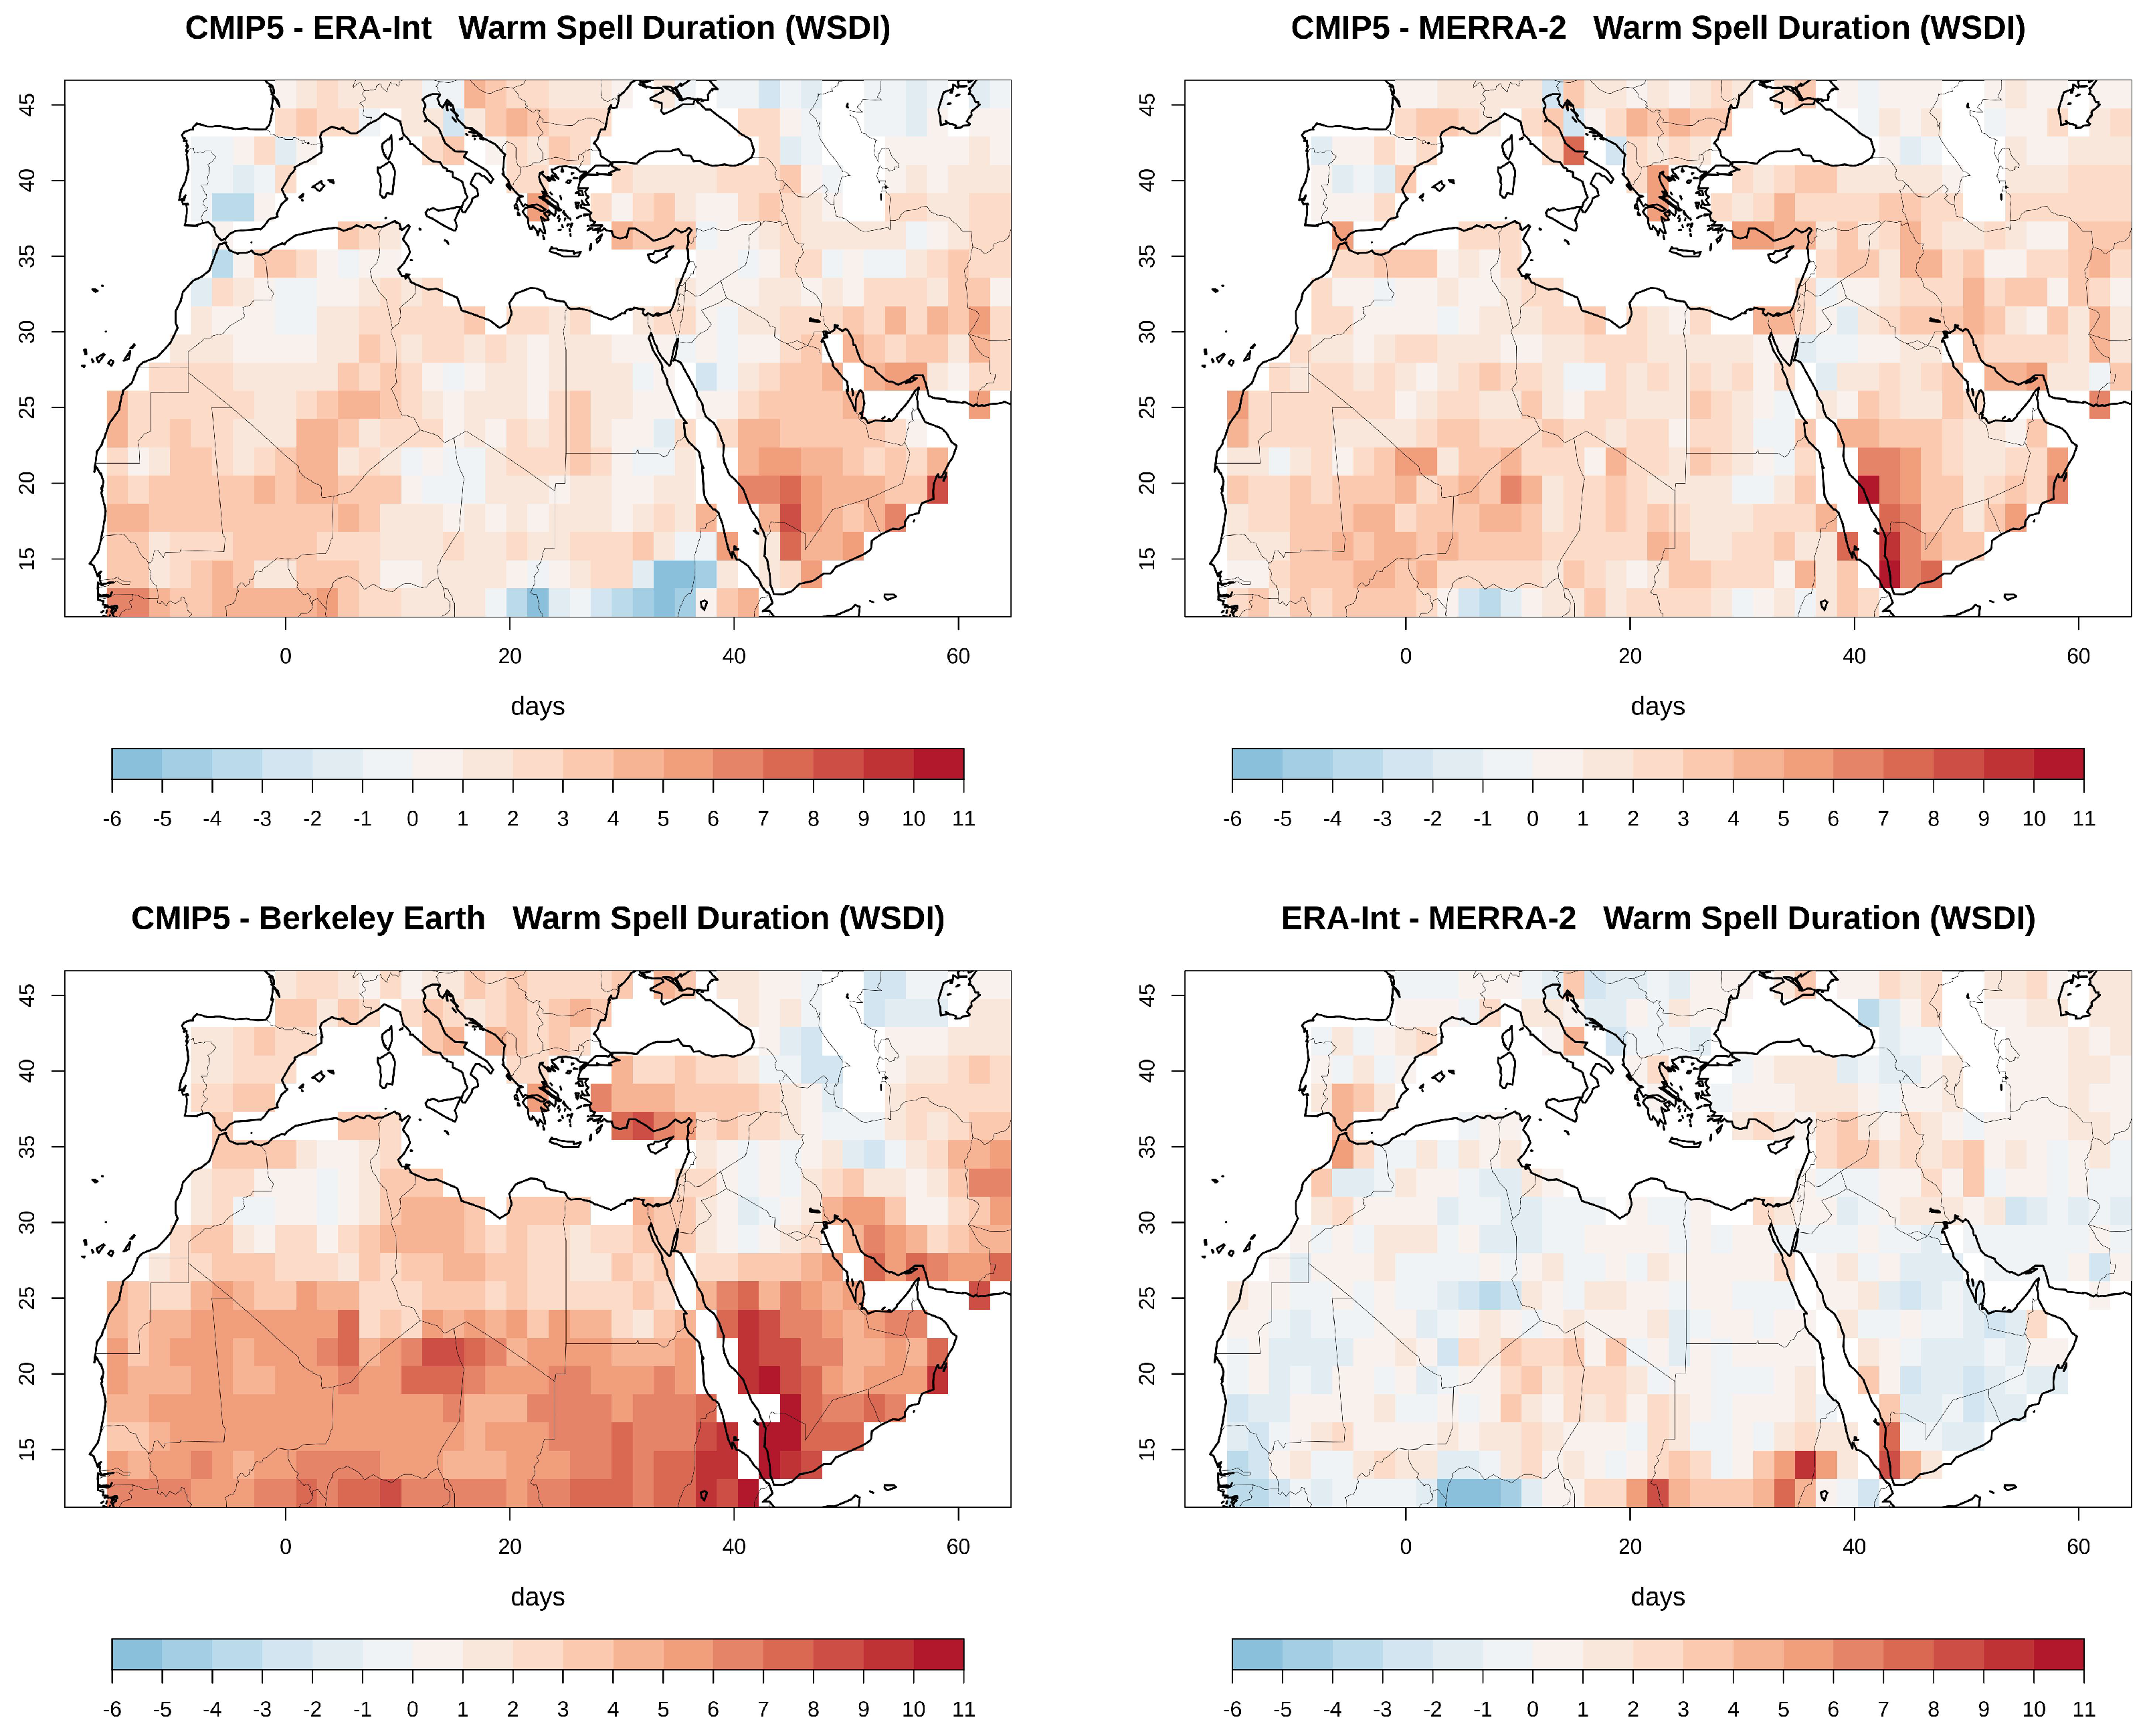
3.1. Spatial Representation

In the following (climatology and trend) maps we compare the CMIP5 multi-model ensemble mean, combining output from the historical runs (1980–2005) and the RCP4.5 (2006–2018), with the two re-analyses (ERA-Int, MERRA-2) and Berkeley gridded observational data.

3.1.1. Climatology

The 1980–2018 climatology of selected indices for the MENA region are presented in Figure 1, Figure 2, Figure 3 and Figure 4, with maps of TXx (hottest day), TNx (hottest night), WSDI (warm spell duration), TX90p (warm days), respectively.
First we examine the climatology of the absolute maxima of daily maximum and minimum temperature (TXx and TNx, or warmest day and warmest night, respectively) in Figure 1 and Figure 2. The spatial distribution and magnitude of the CMIP5 derived indices are in good agreement with the ones obtained from the two re-analysis and the station-based observational datasets. The CMIP5 ensemble mean captures the observed hottest areas within the region well (western parts of northern Africa and the Gulf region with TXx > 46 °C and TNx > 33 °C). In the northern parts of the domain, where milder conditions exist, the CMIP5 ensemble tends to overestimate those indices, especially over high terrain areas, whereas there is agreement among the three observational datasets (Figure A1 and Figure A2). This slight warm bias can be attributed to the coarse spatial resolution of the global models compared with the ERA-Interim, MERRA-2 and Berkeley datasets, as the models tend to underestimate the topography and thus represent the surface at lower altitudes.
As depicted in Figure 3 the CMIP5 multi-model mean results in longer warm spells over the whole region (with WSDI values greater than 5 days almost everywhere), overestimating the values derived from the three observational datasets (Figure A3). Interestingly, though, the CMIP5 models capture quite well the “hotspot” areas of the index (with WDSI > 10 days) over the west Balkan region, central Sahara and Middle East, in good agreement with the observed data (although less so with Berkeley Earth). In Figure 4, the CMIP5 data simulate values greater than 11 for the Warm Days index (TX90p) everywhere, while the three observational datasets indicate values less than 11 for almost half of the MENA region. Berkeley Earth (constructed solely by station observations) stands out as the dataset with the smaller number of Warm Days, with TX90p values less than 10 days everywhere, in contrast with the two re-analysis.

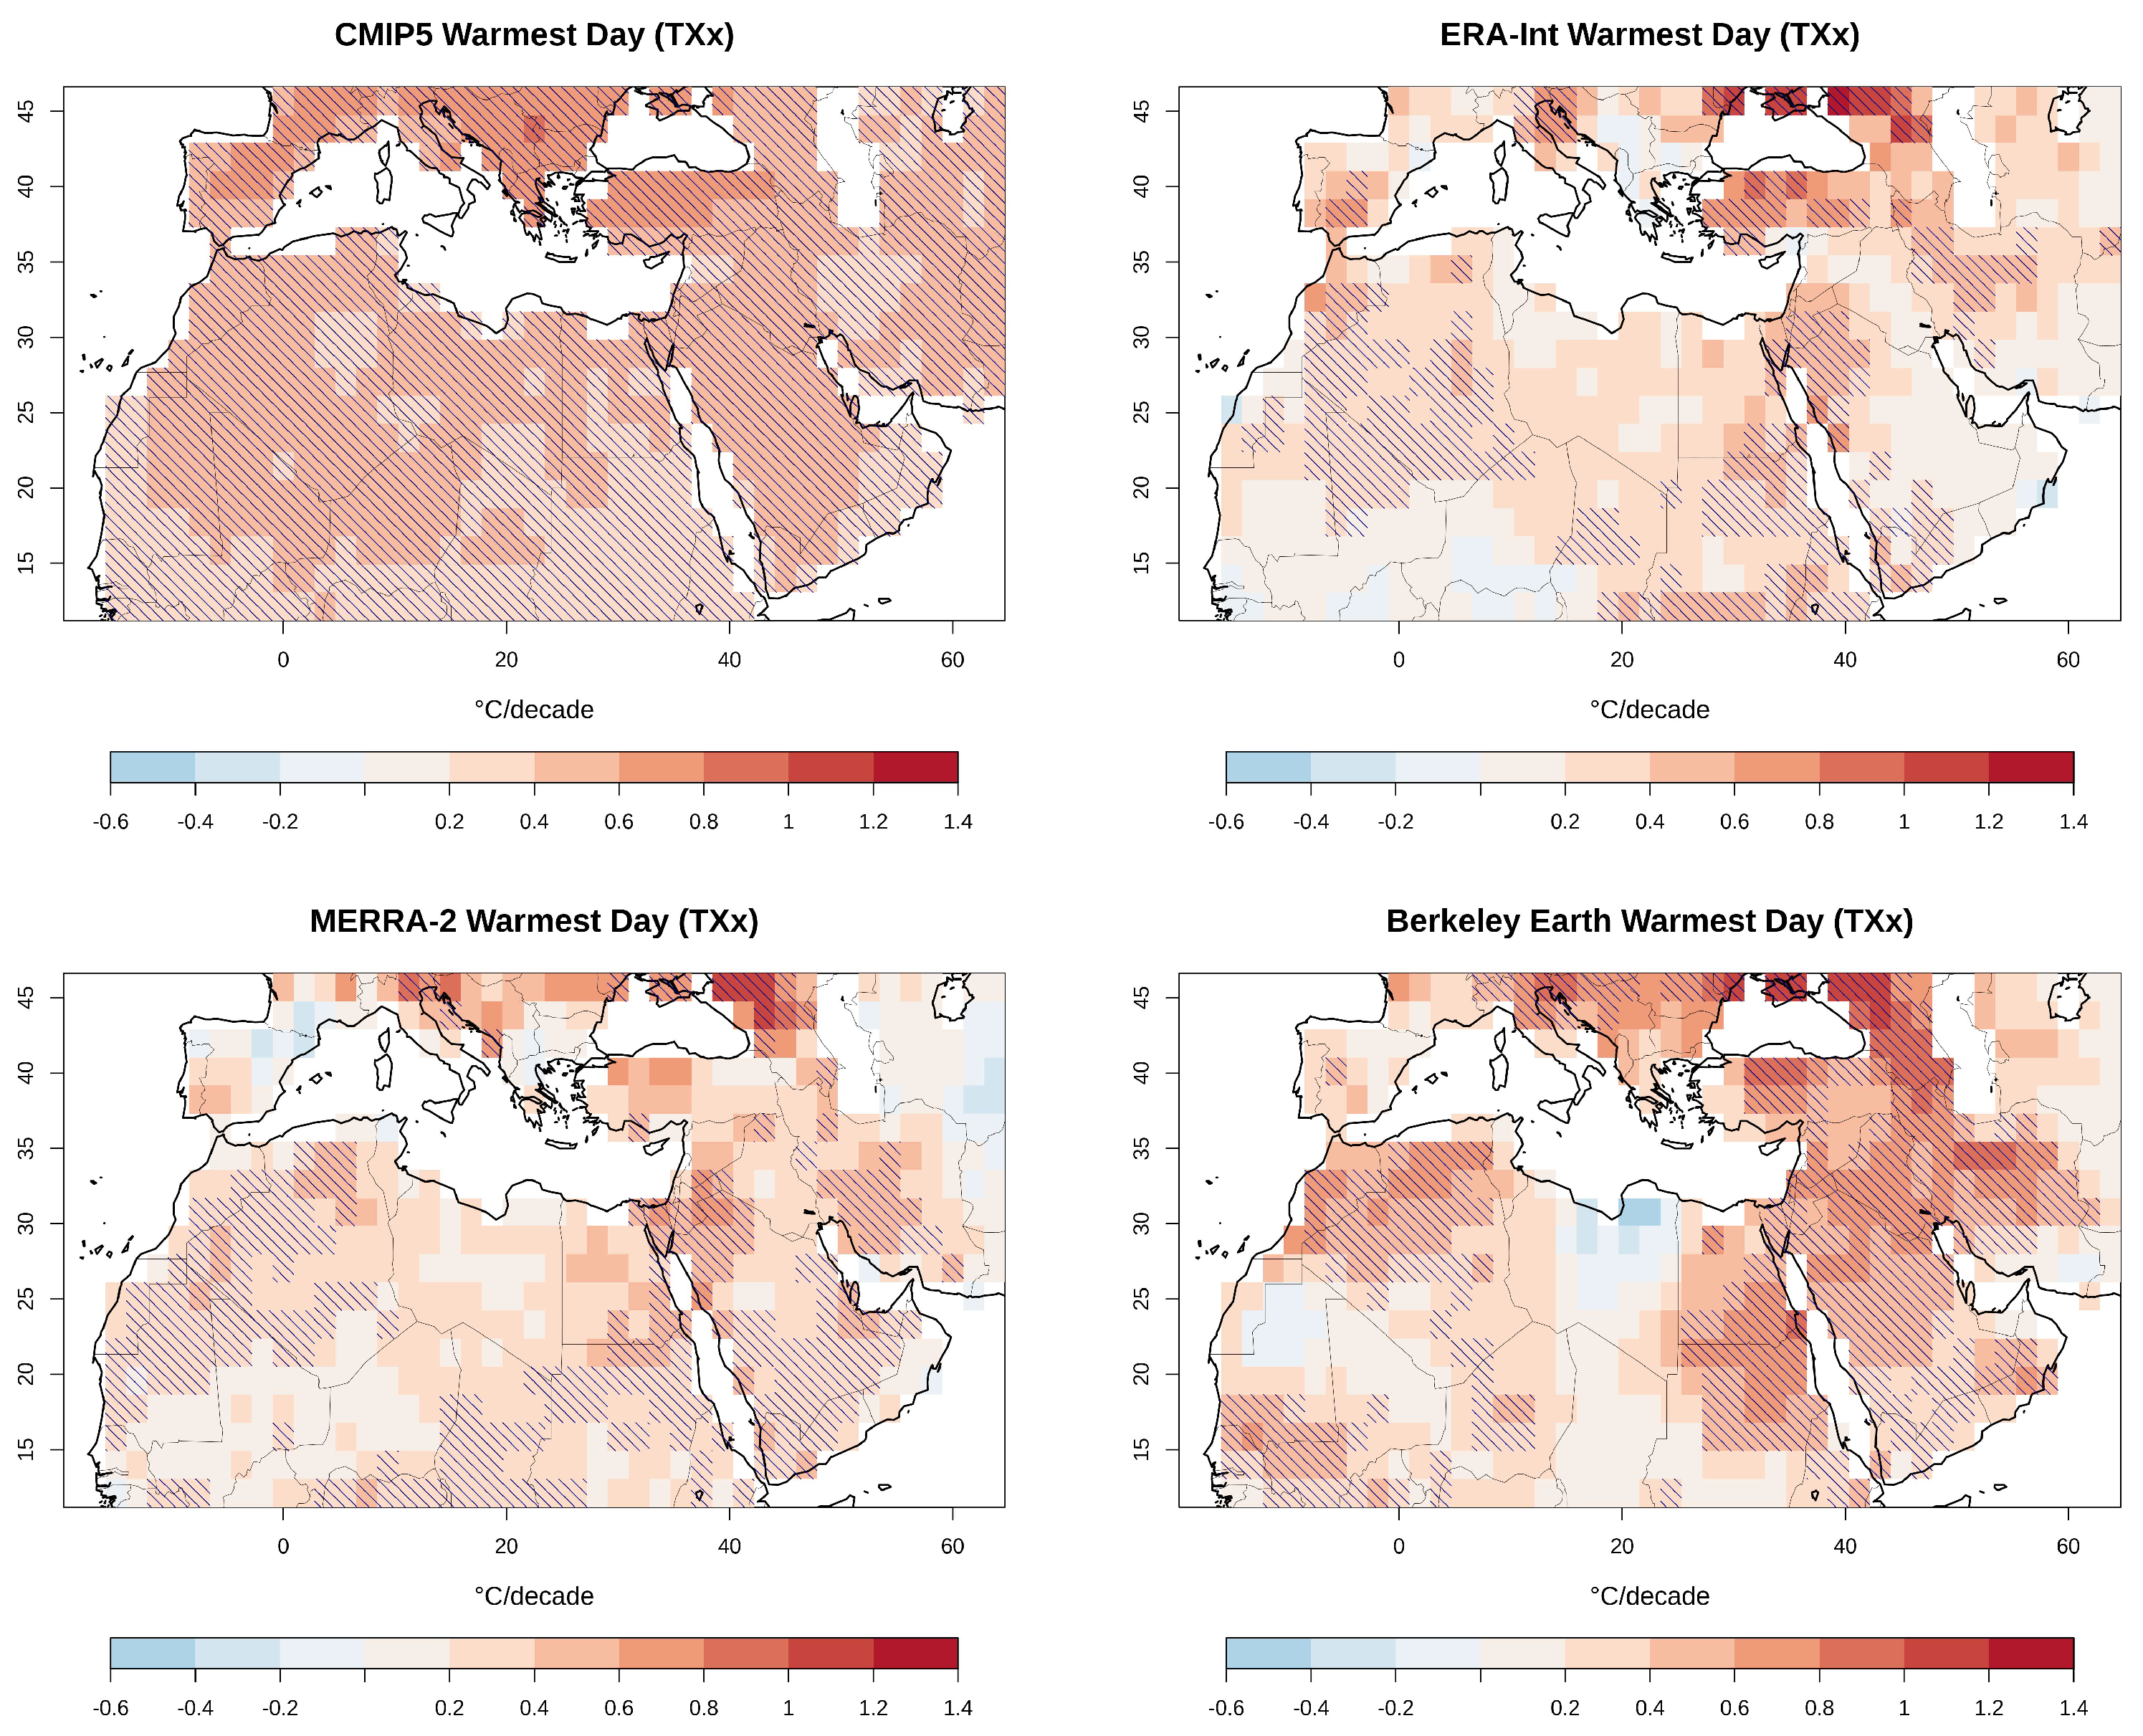
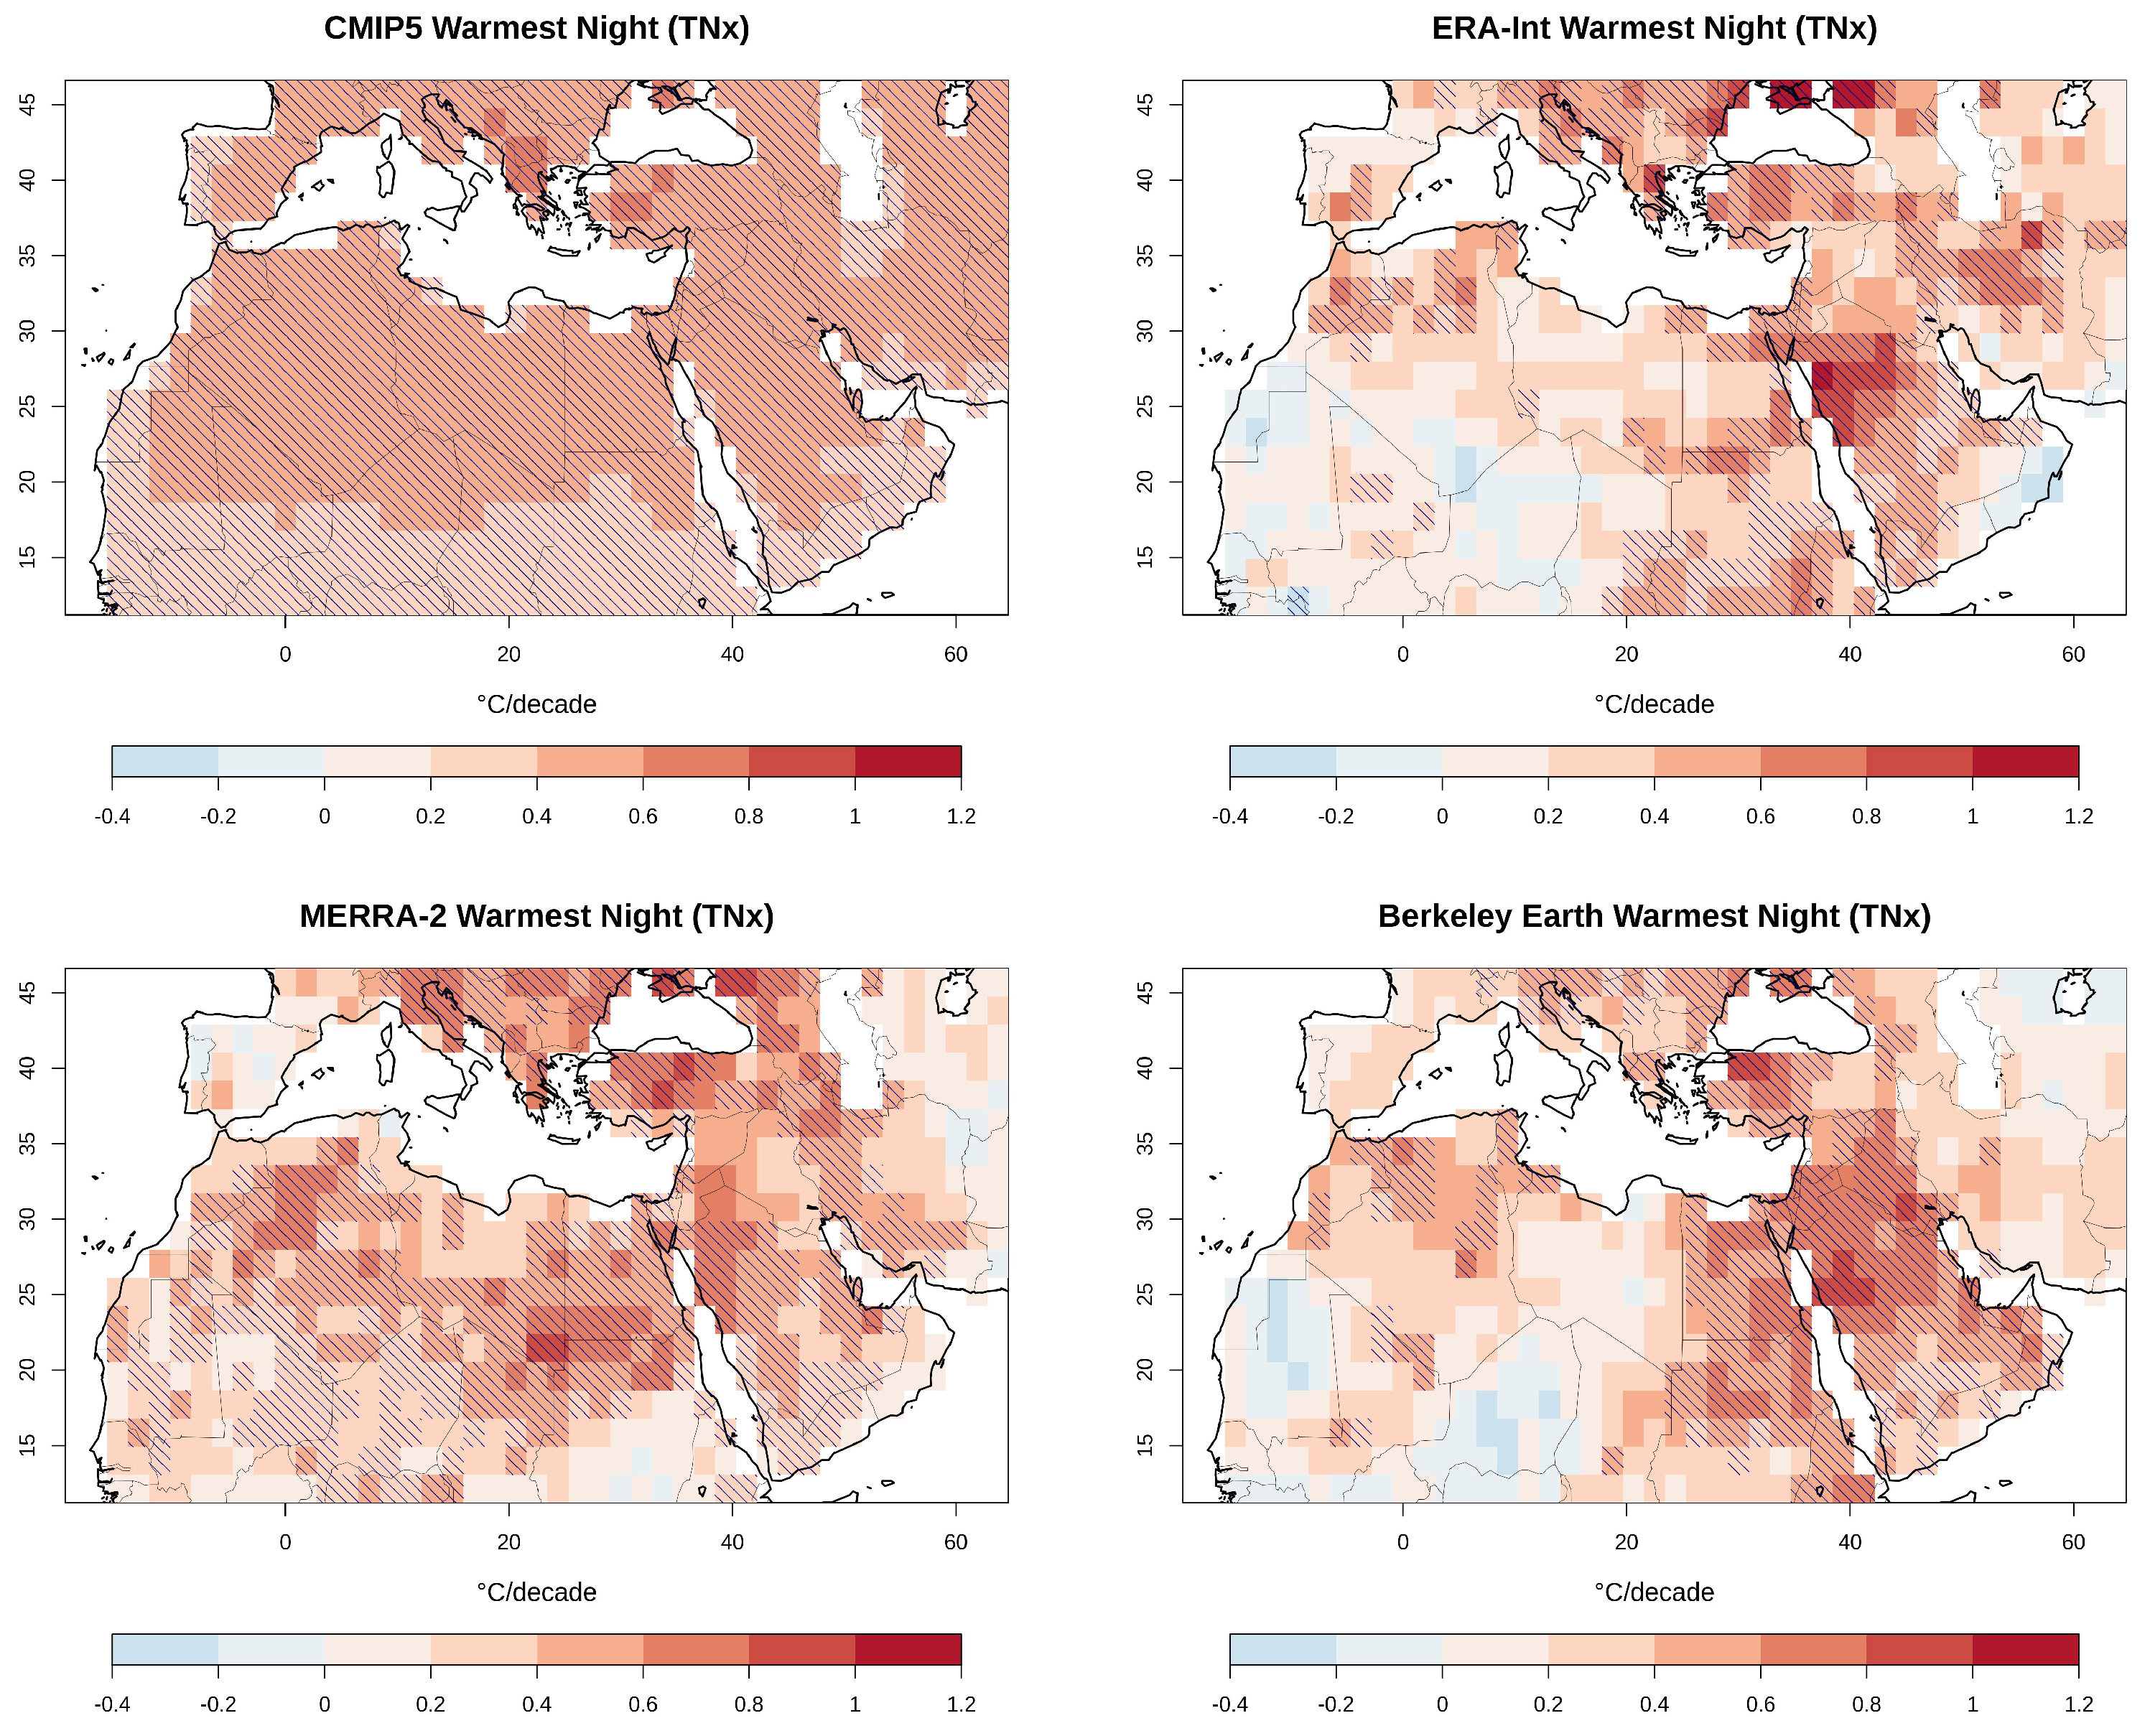
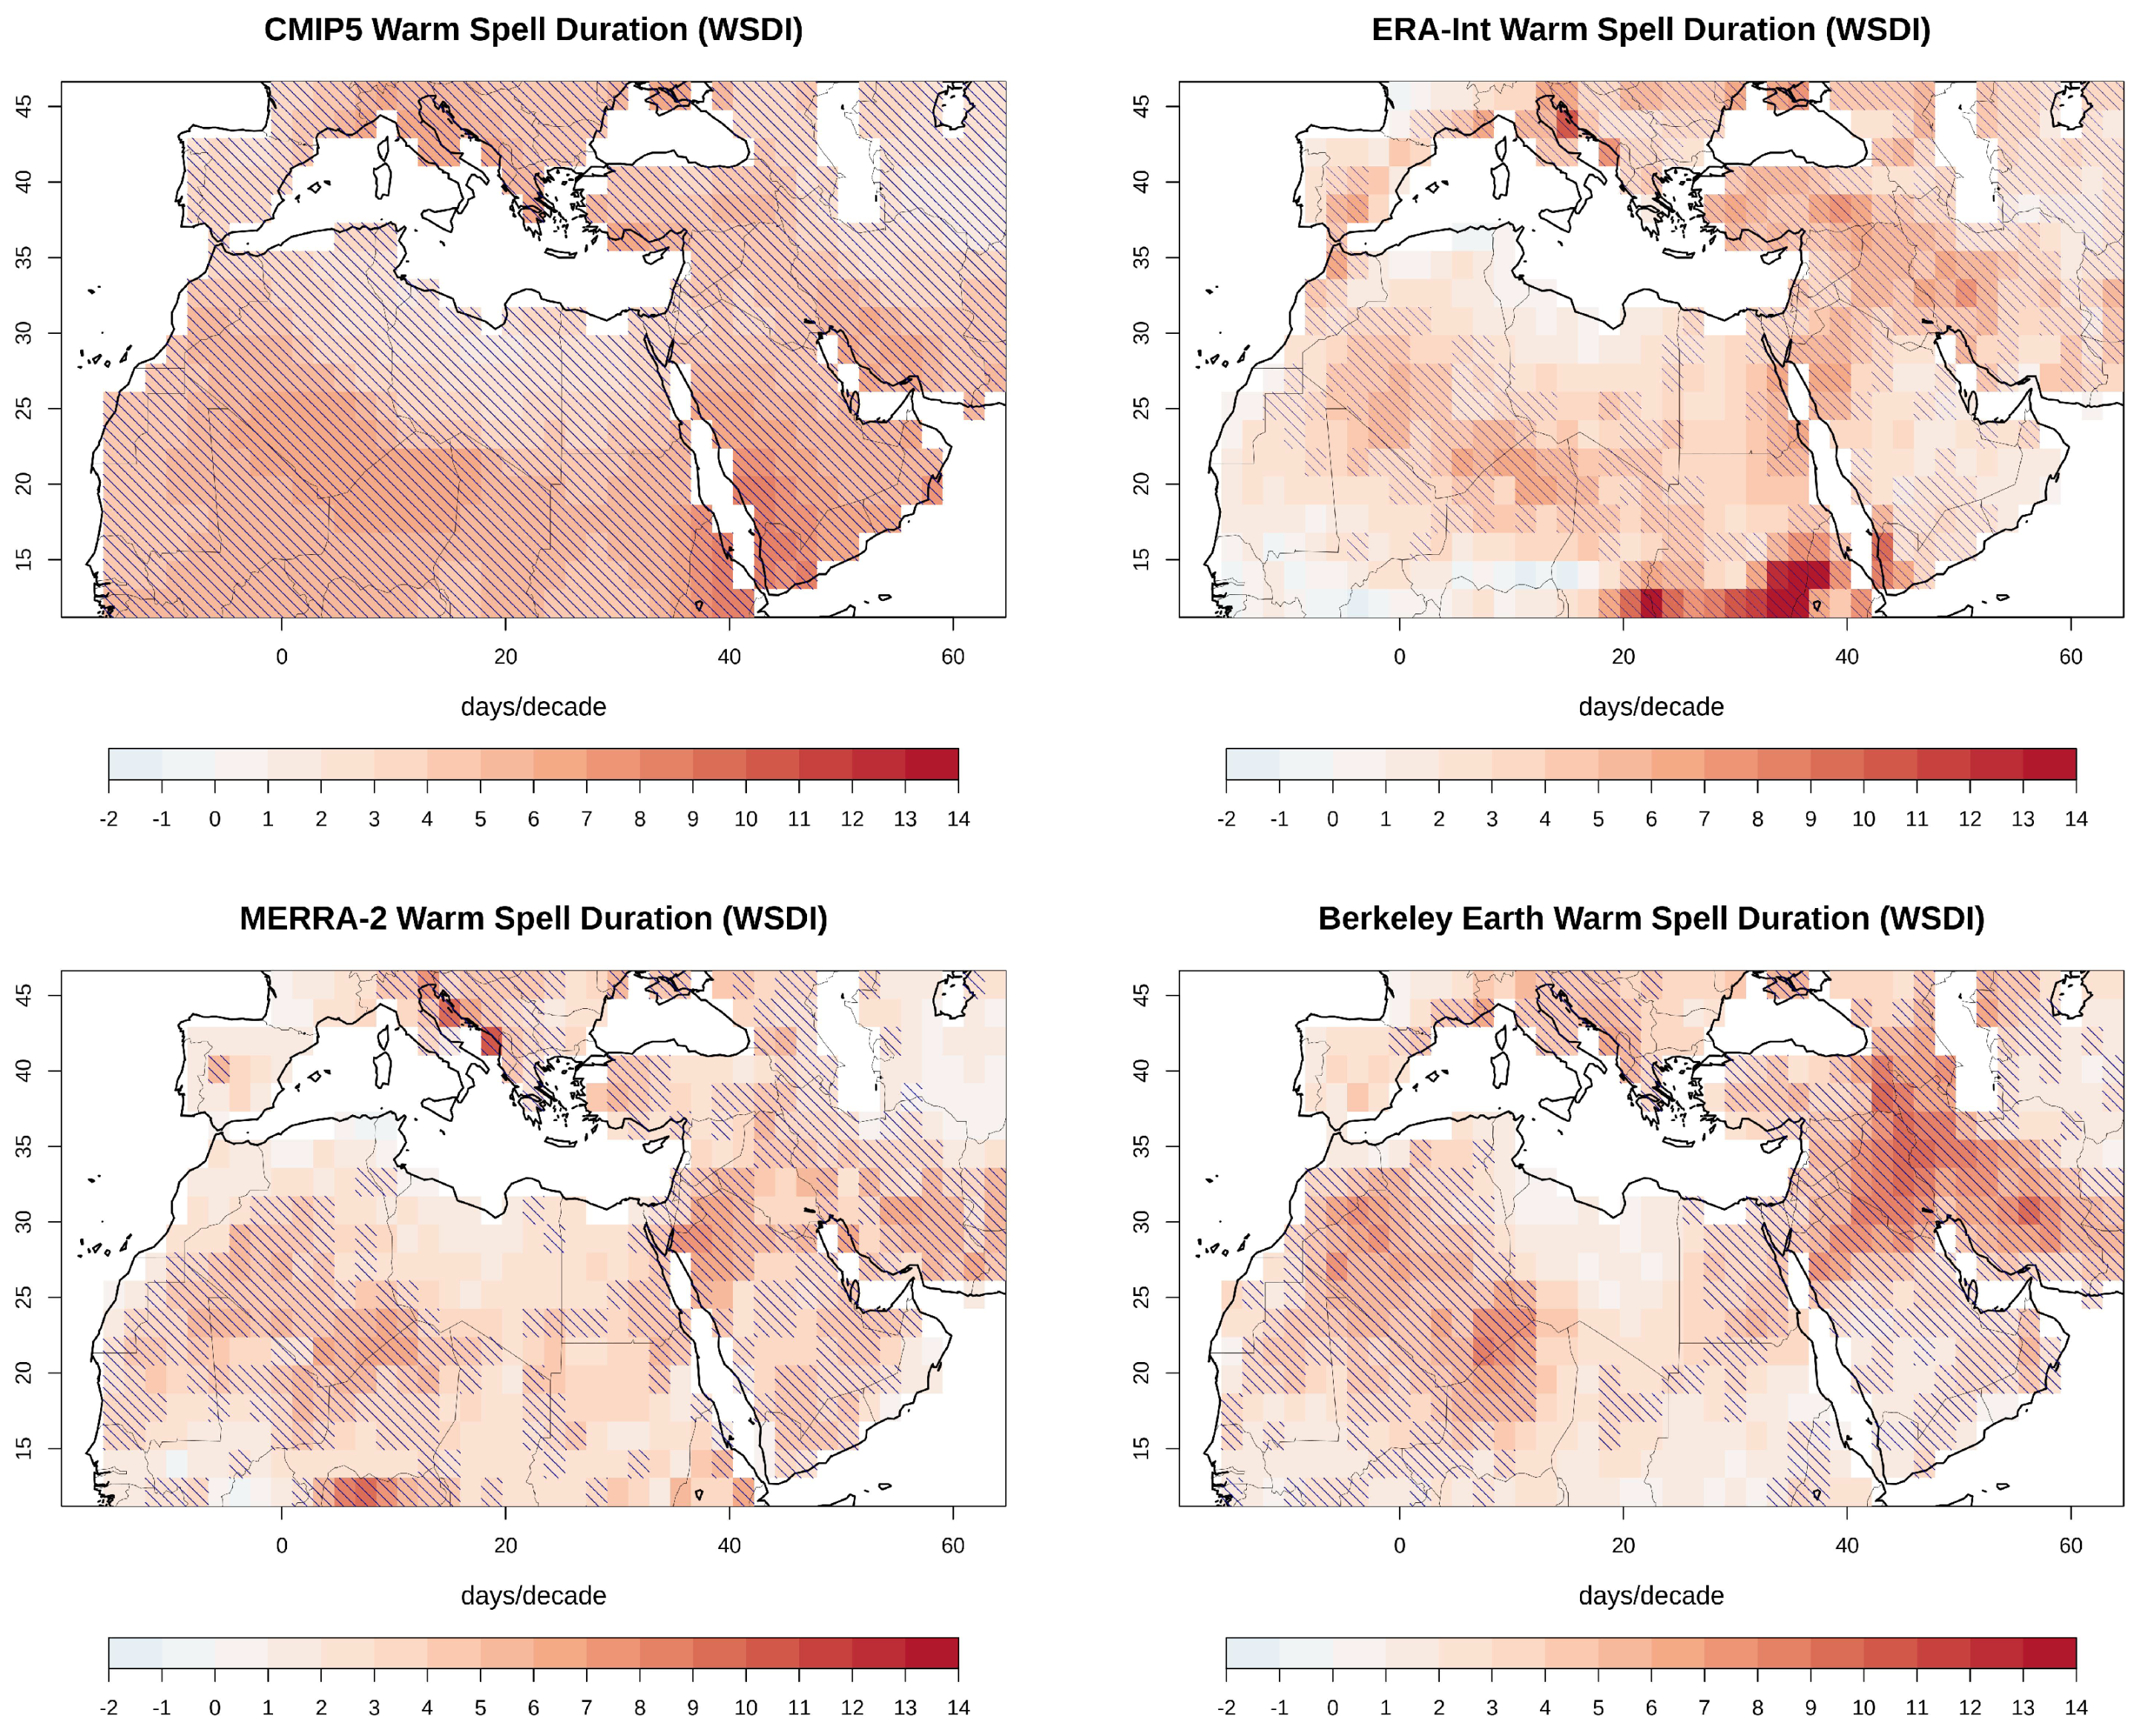
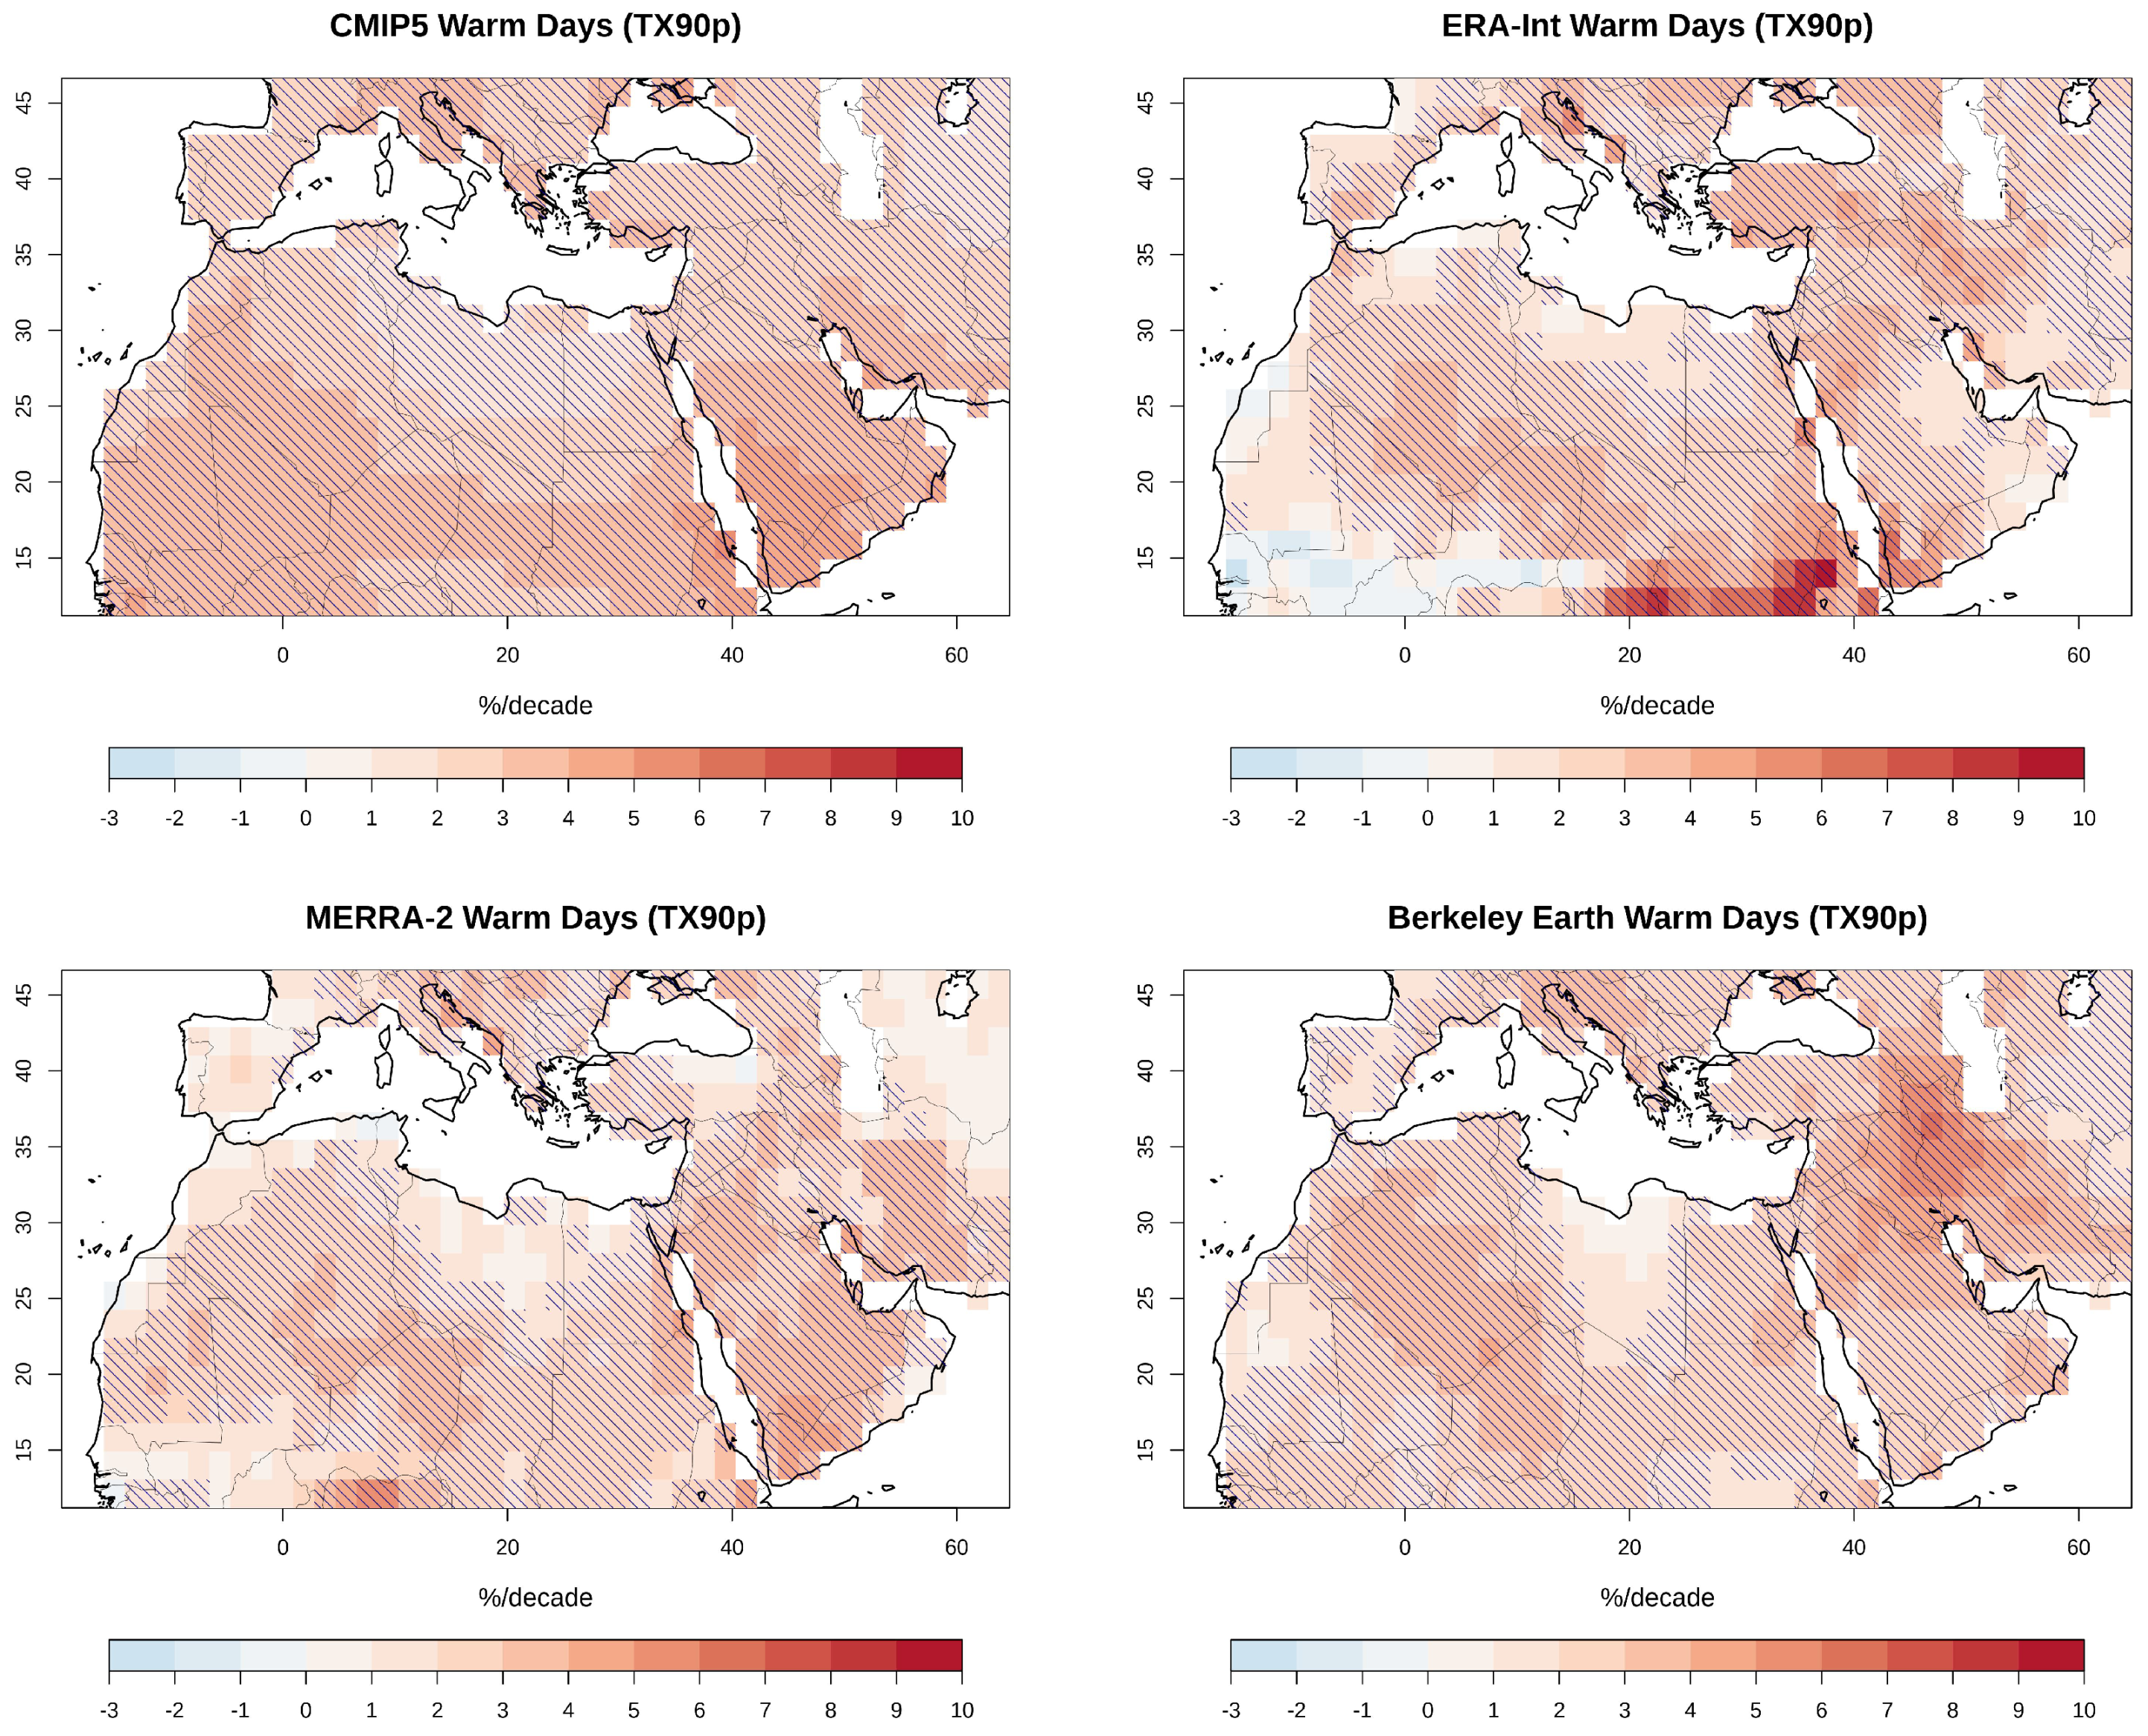
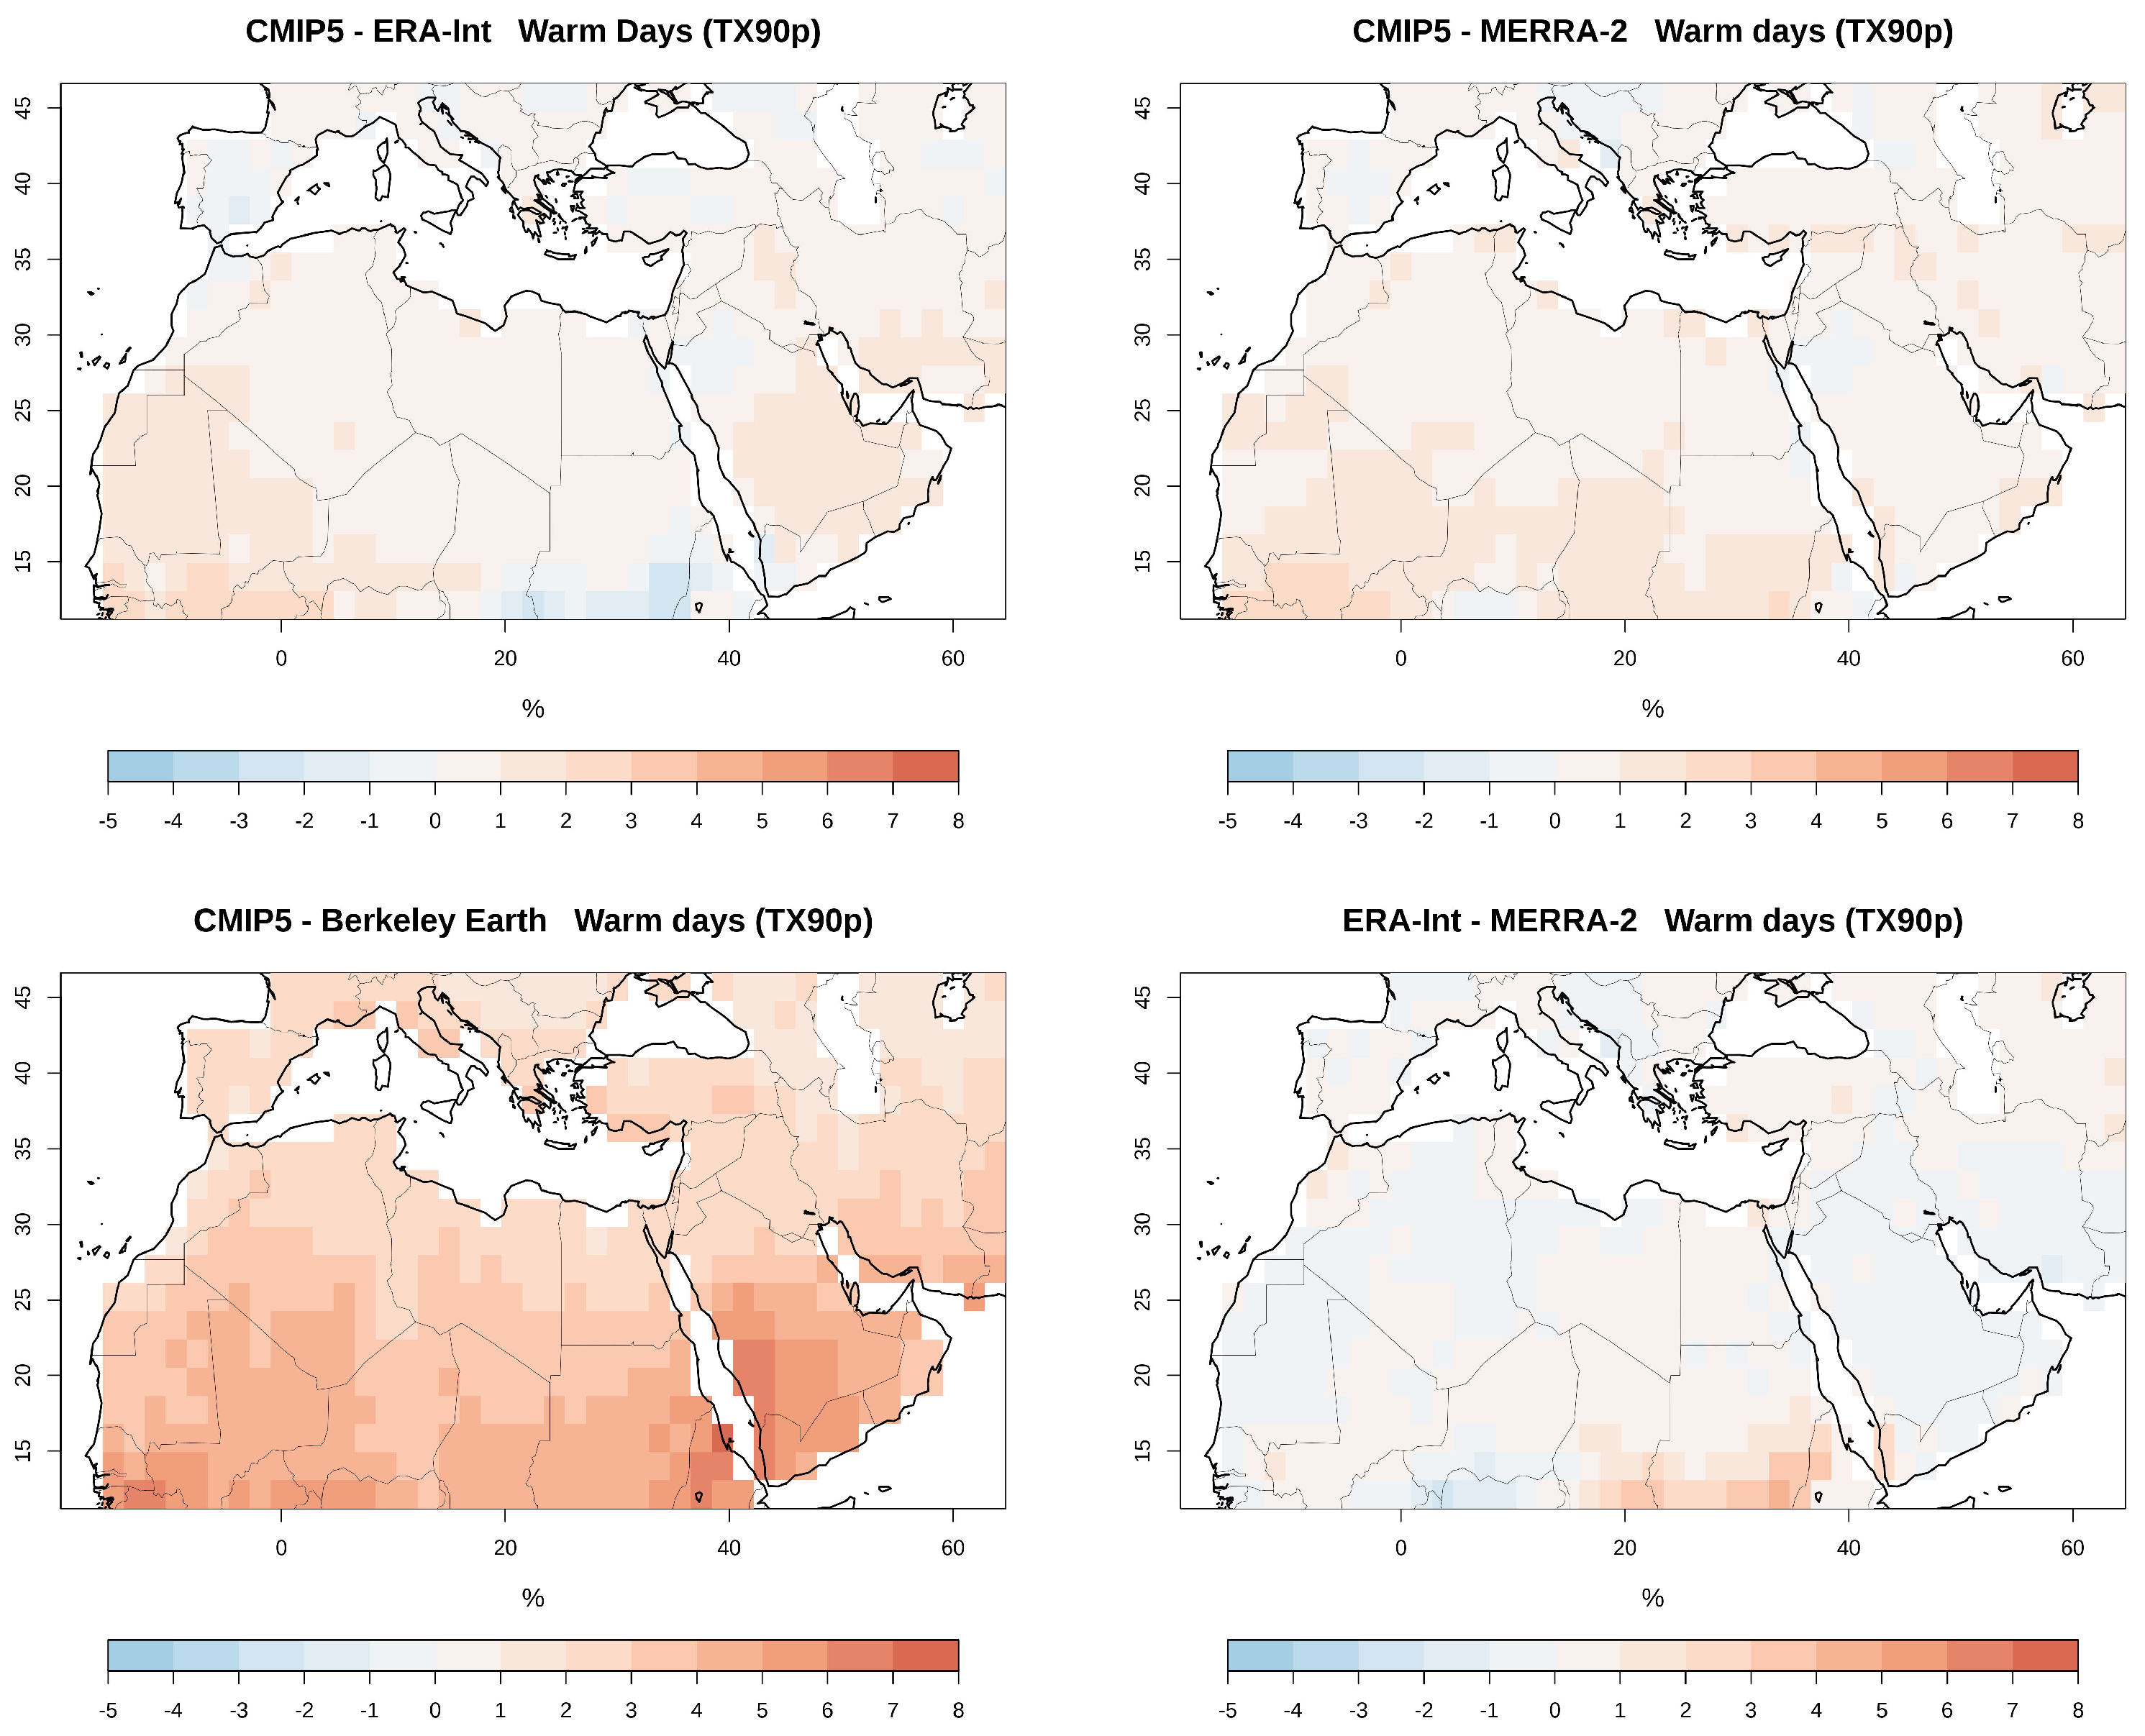
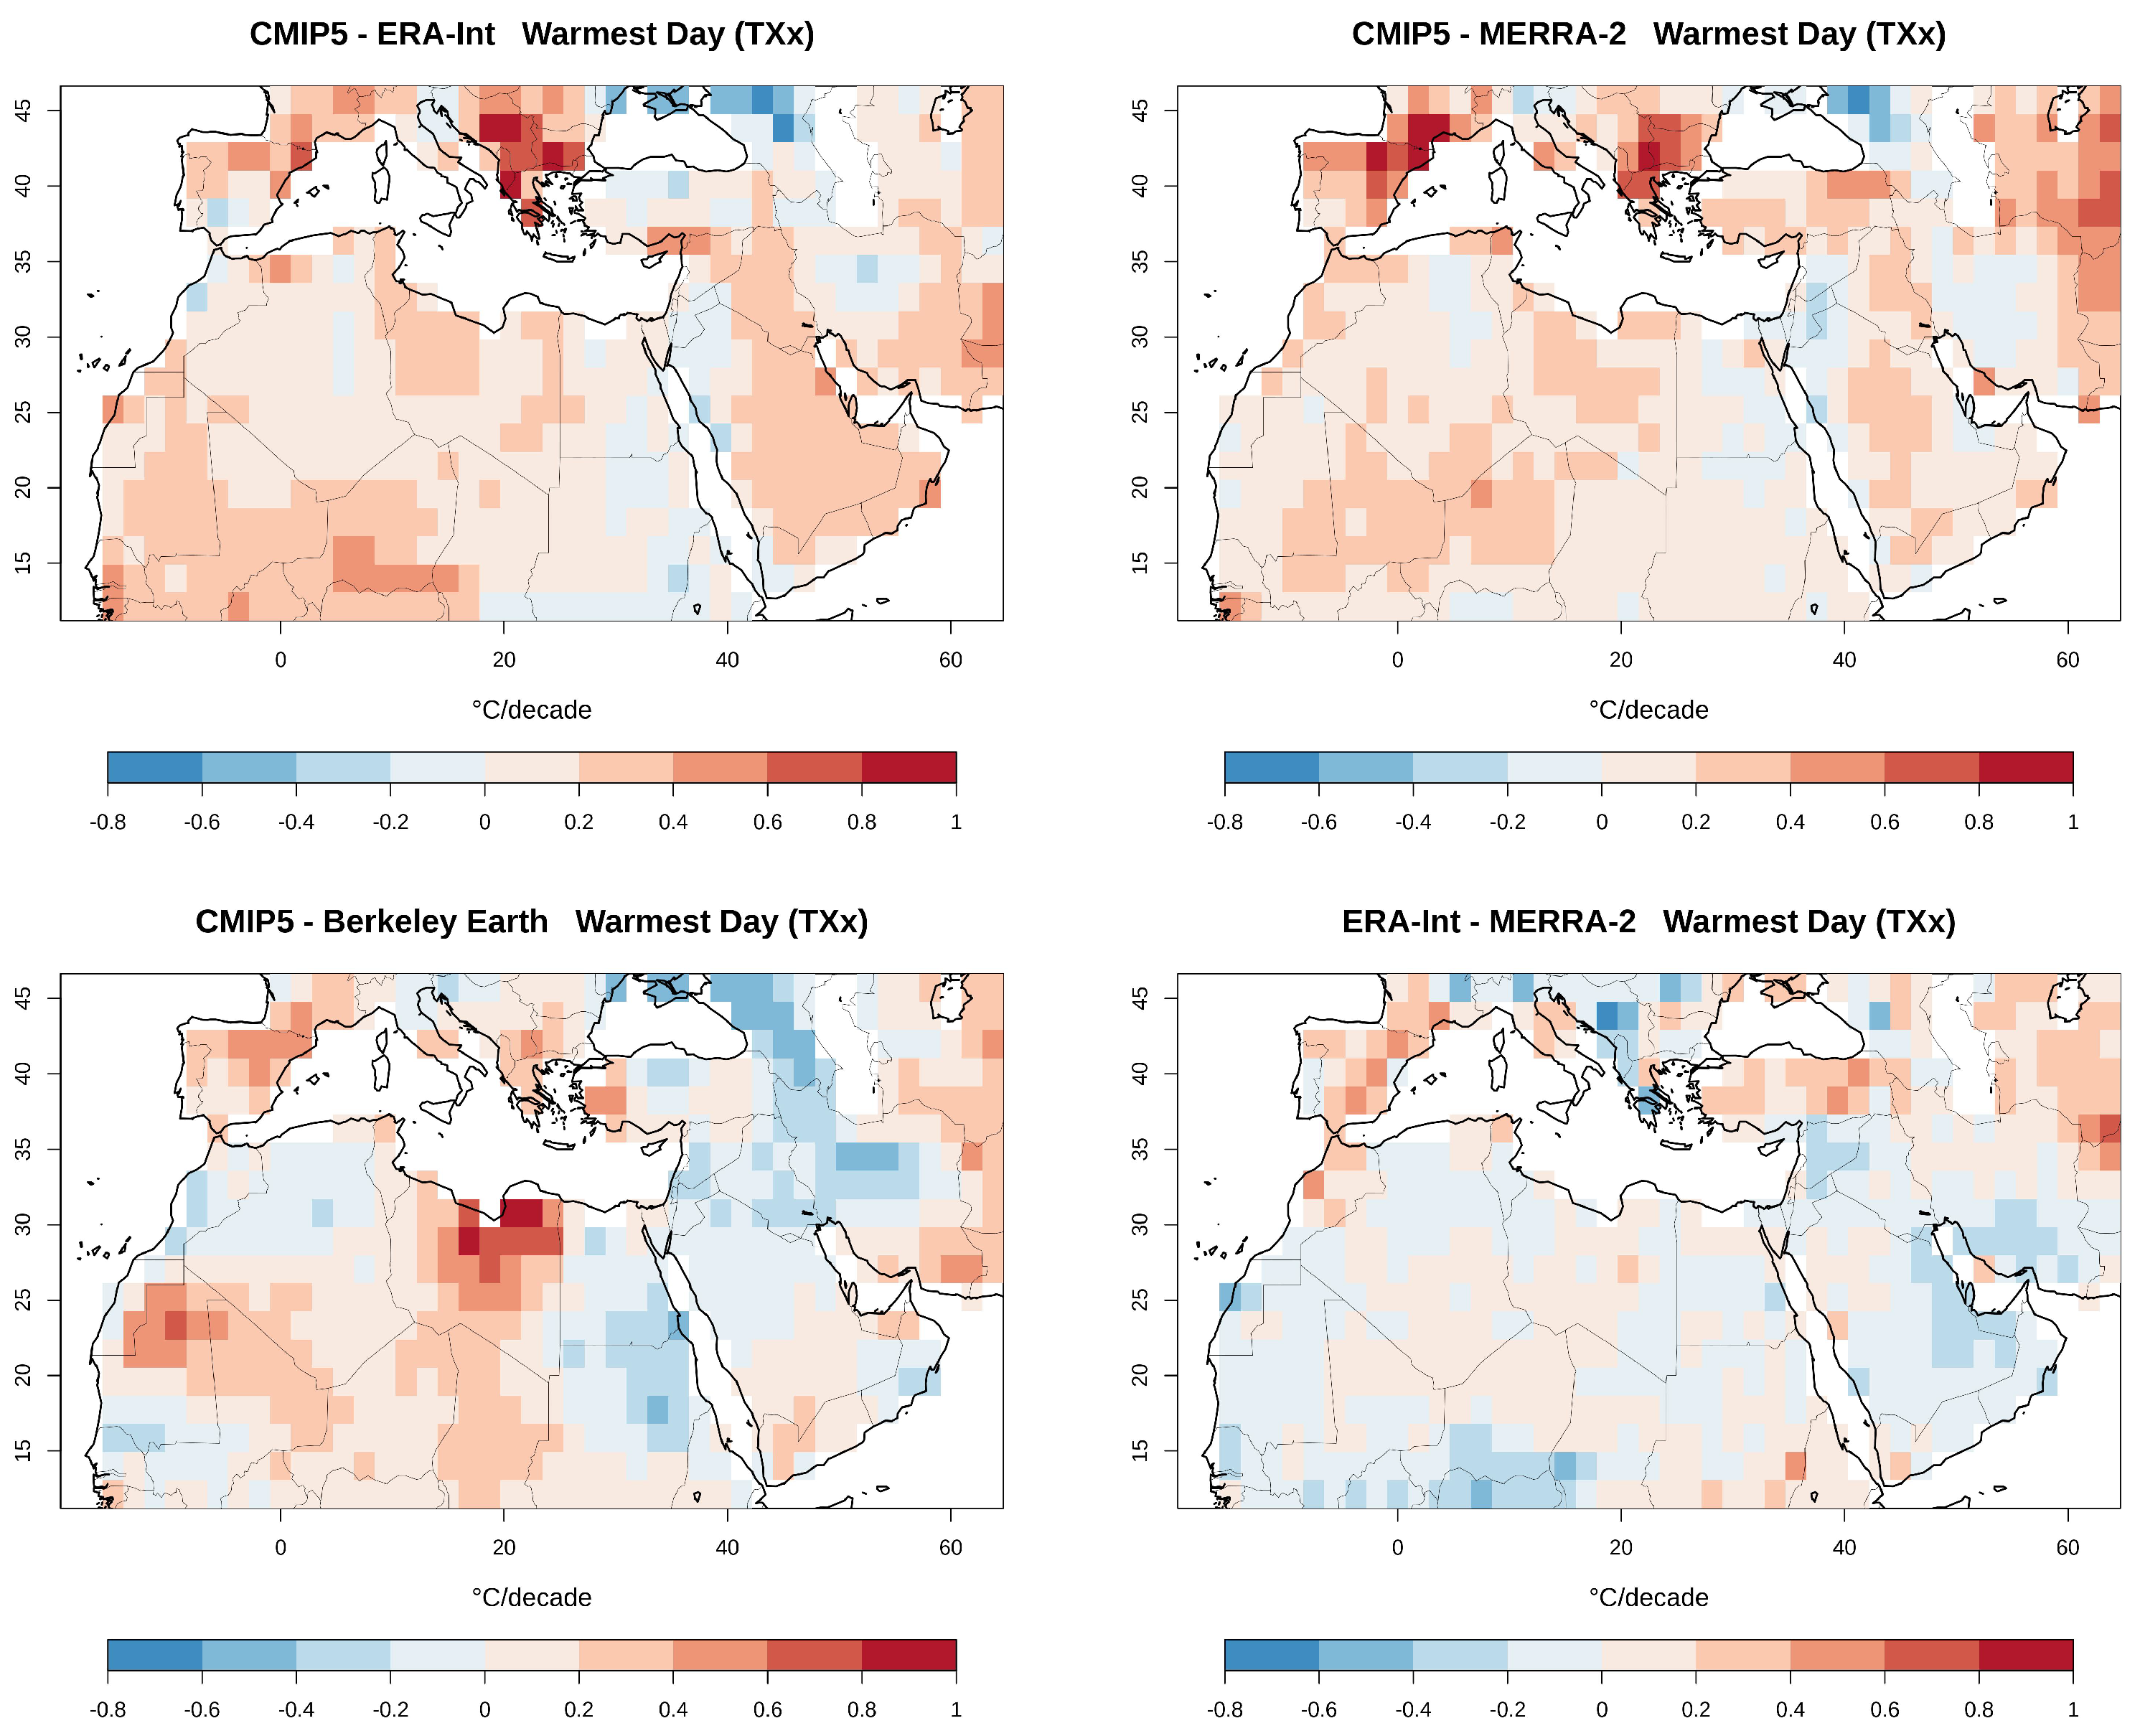
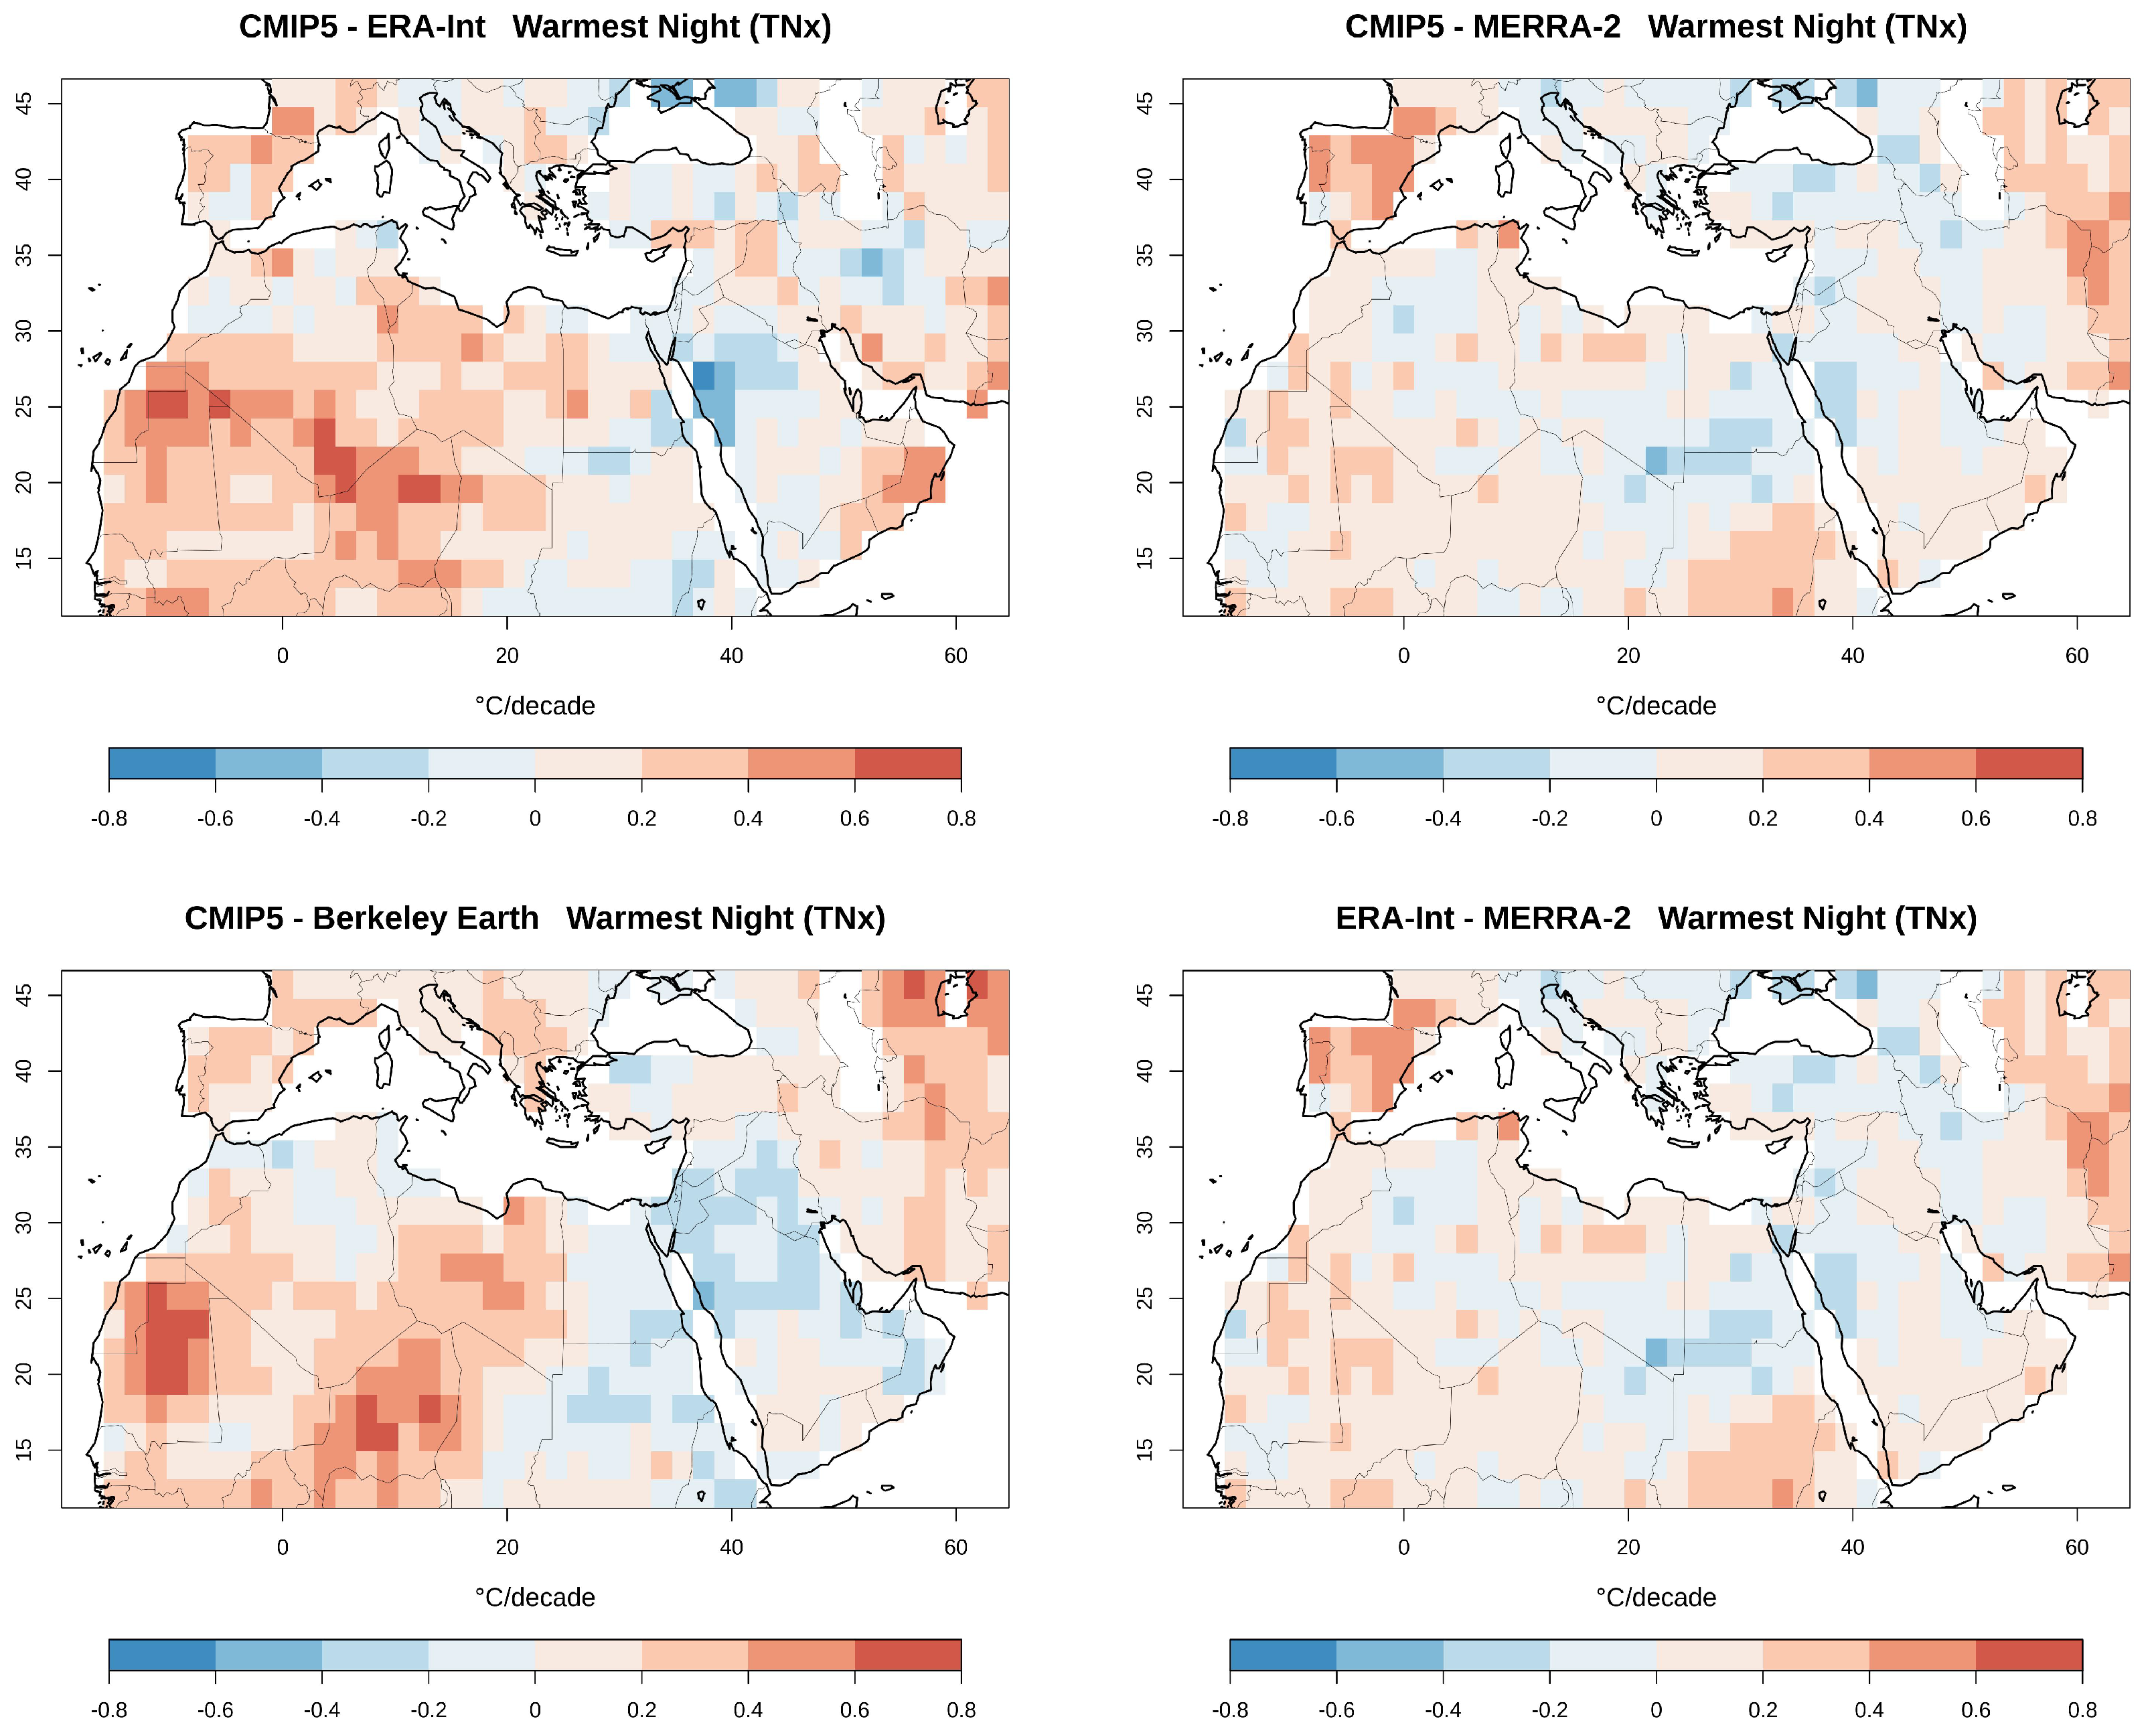
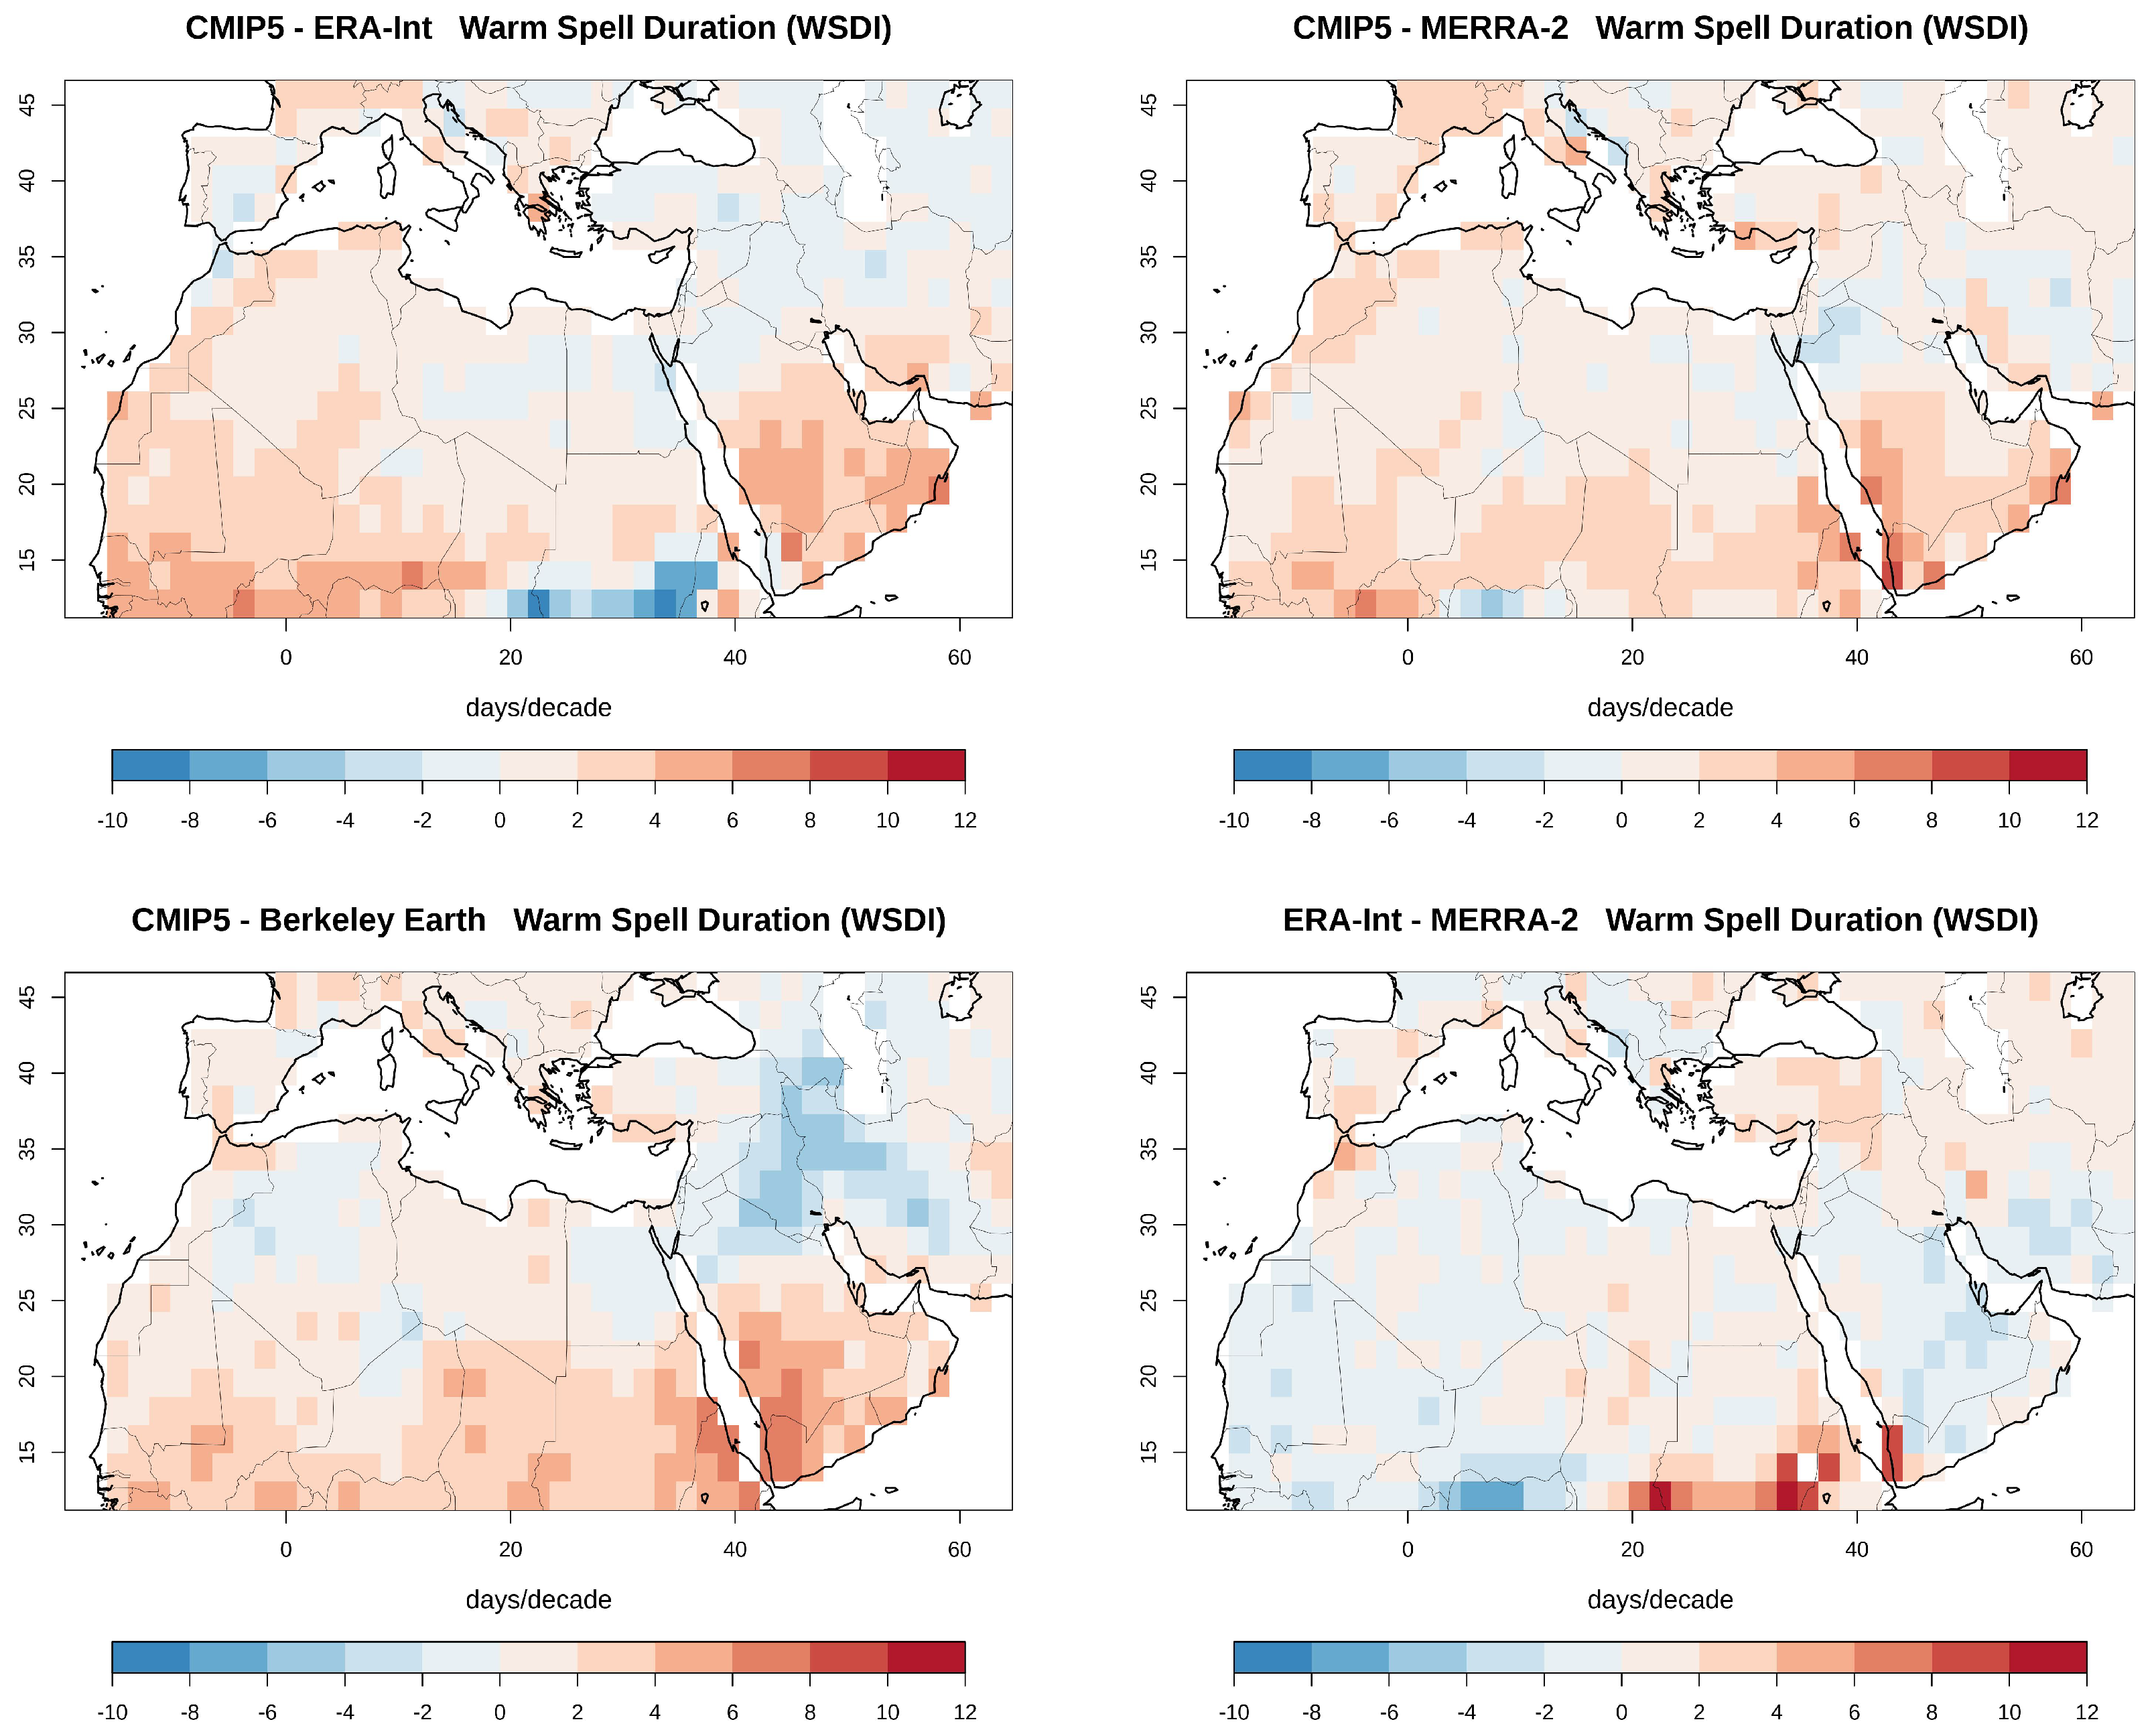
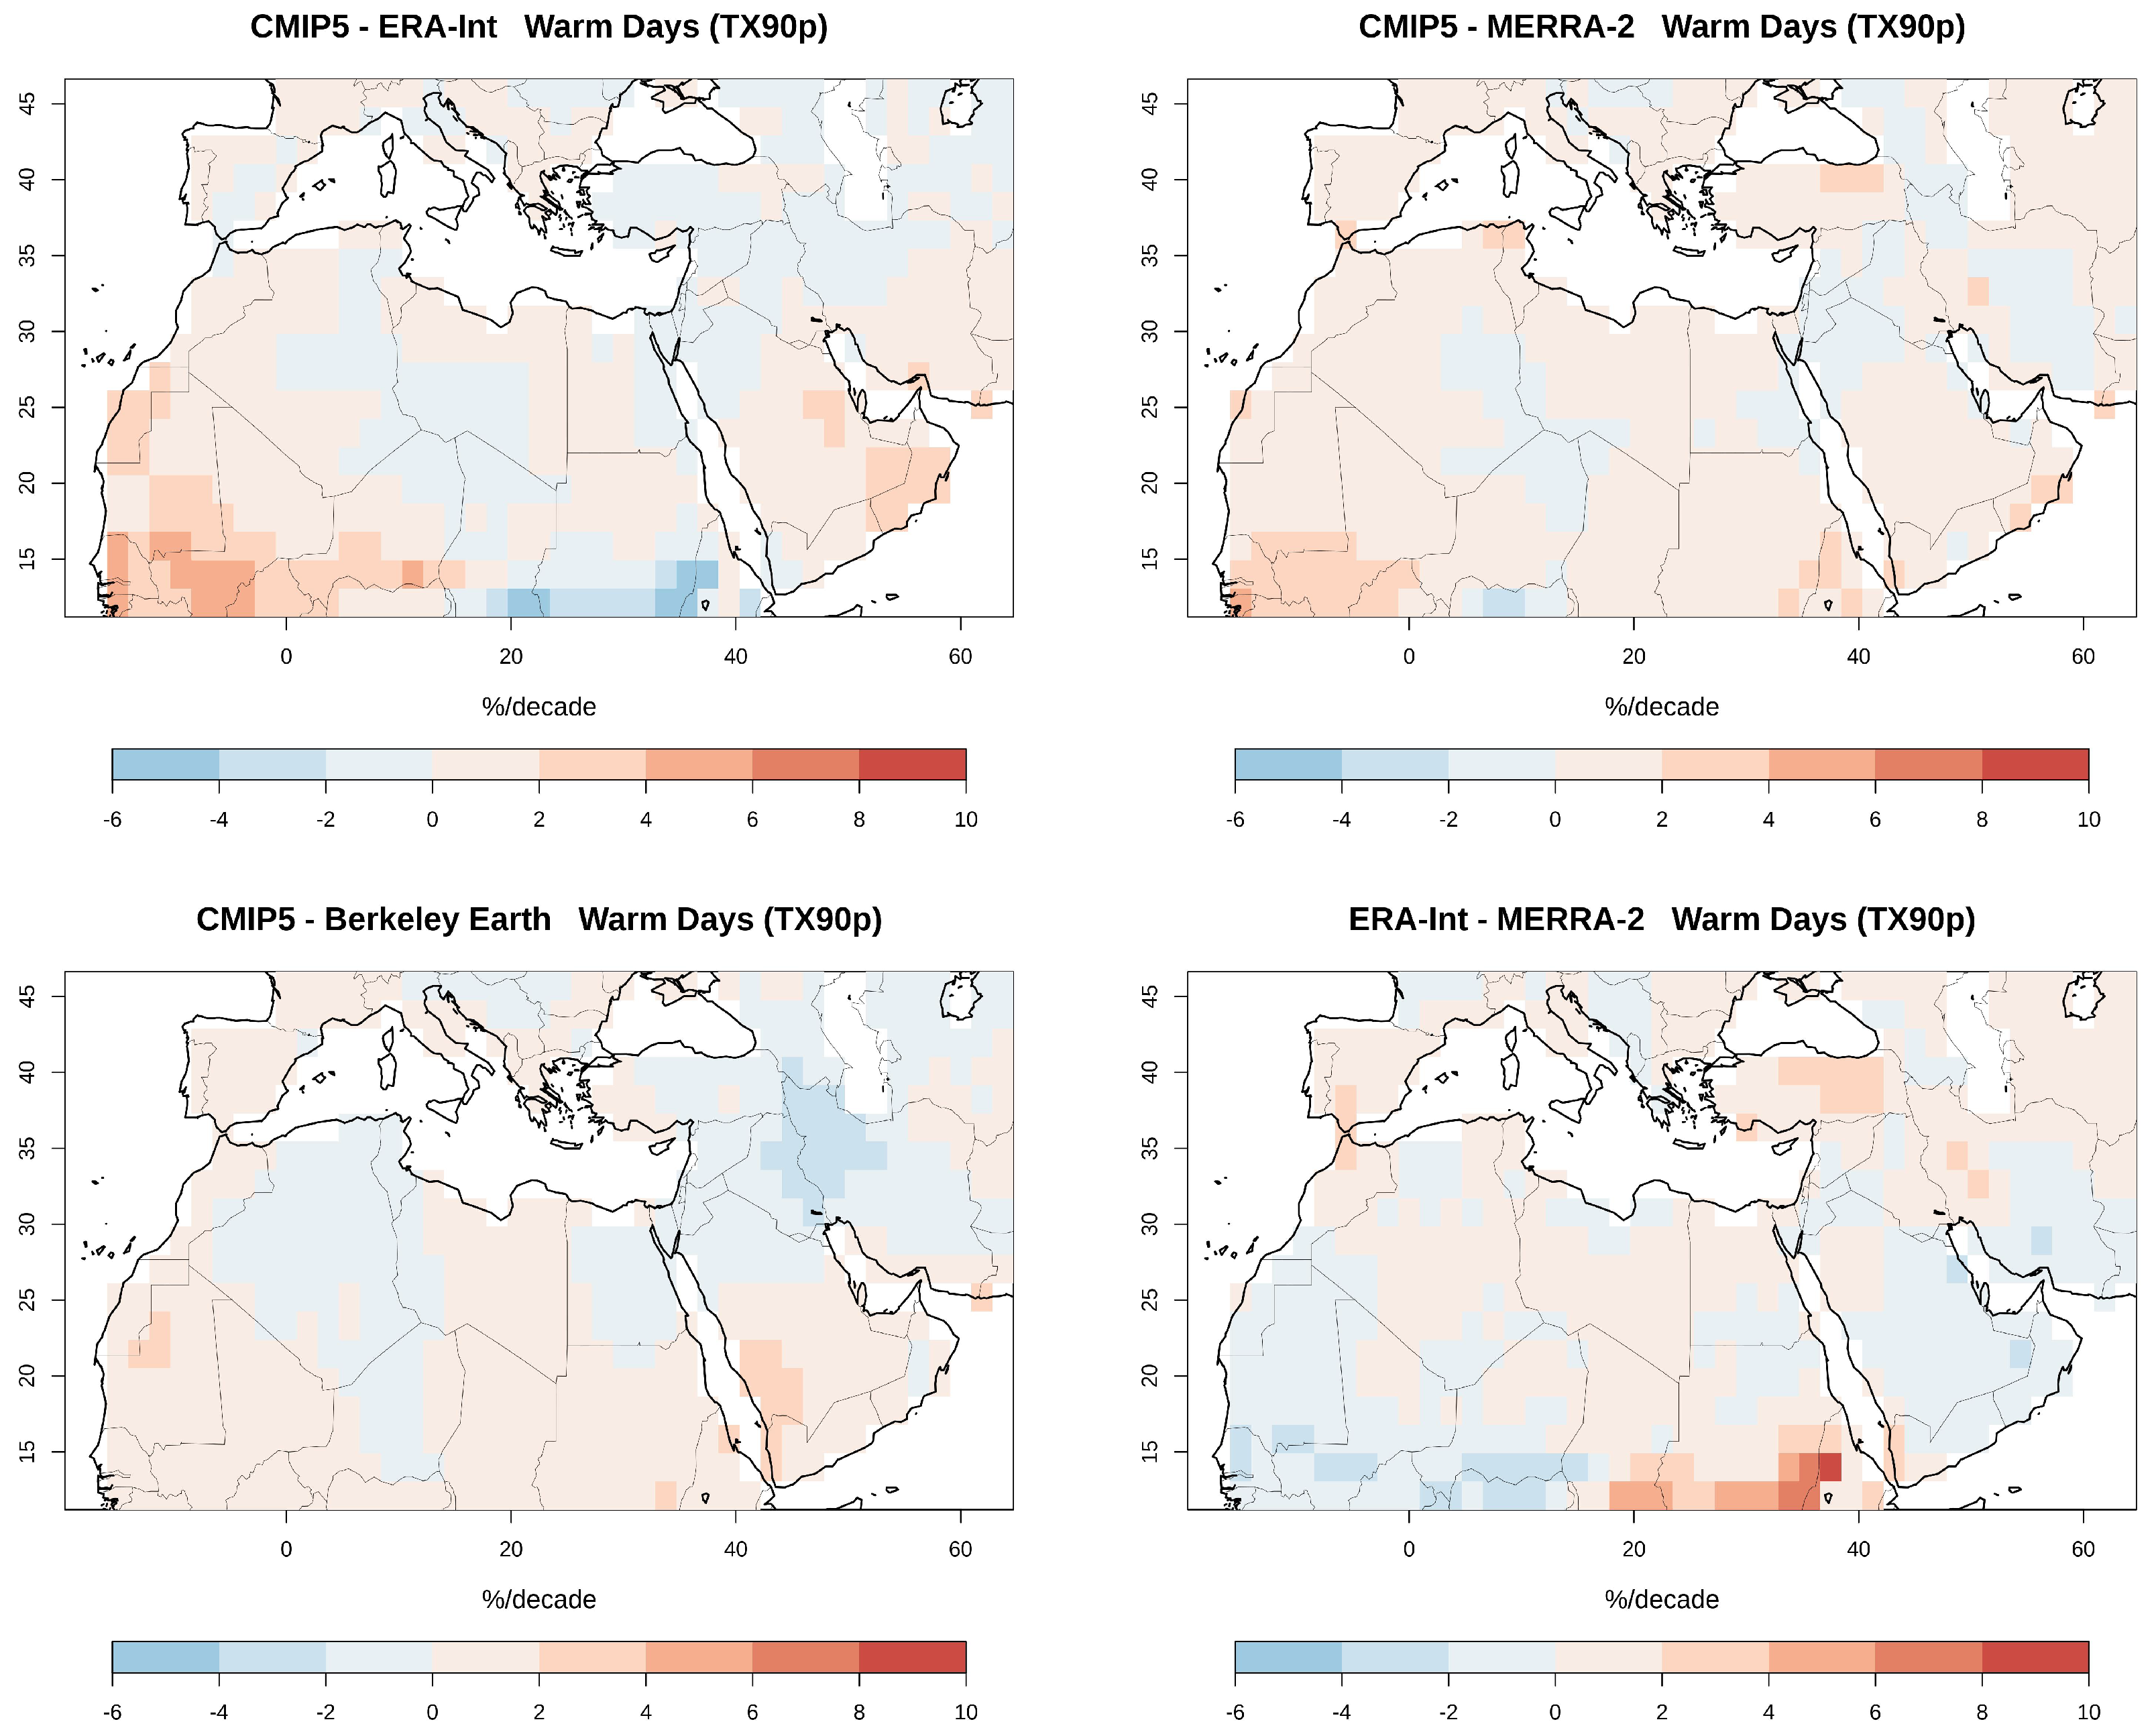
3.1.2. Decadal Trends

Figure 5, Figure 6, Figure 7 and Figure 8 present the decadal trends for TXx, TNx, WSDI and TX90p. We compare again the CMIP5 multi-model ensemble with the two re-analyses (ERA-Int, MERRA-2) and Berkeley Earth gridded observational data. The statistical significance of the trends at 95% confidence is illustrated in the maps by the hatching. It is noticeable that the CMIP5 models show strong positive trends for all four indices that are also statistically significant throughout the MENA domain. This is expected from the clearly monotonic positive trend driven by the overall, linearly increasing warming related to the RCPs (evident in the timeseries Figure 9 and Figure 10). It can be also attributed to the suppressed interannual variability of the 18-model ensemble average compared to the individual observationally-based datasets.
In Figure 5, the CMIP5 results show a region-wide, large, positive trend for TXx, ranging from 0.4 °C/decade mainly in parts of northern Africa desert and Middle East to almost 0.8 °C/decade in Europe, especially in the Balkans. The re-analyses and Berkeley Earth exhibit smaller warming (Figure A5), much more spatially variable and in some places of opposite sign (i.e., cooling, not statistically significant, for example MERRA-2 in Iberia and Berkeley Earth over Libya). The three observation-based datasets show a maximum warming trend, larger than 1 °C/decade, around the Caucasus region. This is may be driven by the positive snow-albedo feedback, which is underestimated in the coarse resolution CMIP5 models with their simplified representation of key snow processes and vegetation [50].
There is generally agreement regarding the spatial distribution and magnitude of the TXx trend in the two re-analysis datasets (Figure A5), which is not always in line with the one derived from Berkeley Earth (for example, the latter presents a distinct warming in south-east Europe). In Figure 6, a MENA region widespread positive trend of 0.4–0.6 °C/decade is evident in the CMIP5 data for the TNx index, which reaches 0.6–0.8 °C/decade in parts of south-east Europe, in better agreement with the MERRA-2 data than the other two (Figure A6). In fact, ERA-Interim and Berkeley Earth exhibit similar patterns of warming (e.g., over Maghreb) and cooling (in the south-west part of the domain).
Figure 7 indicates that the CMIP5 multi-model mean represents the observed decadal trend in the WSDI index rather well. The GCMs apparently capture the patterns also derived from the three observational datasets. Increasing duration of warm spells (of at least 5 days per decade), is thus evident in the western and parts of northern Africa, the western Balkans and Italy, and the African and Arabian coasts of the southern Red Sea (with ERA-Interim only), also evident in Figure A7. Similar agreement in the spatial patterns is apparent in the trend of the exceedance rate of warm days, TX90p (Figure 8). In parts of southern Europe, northern Africa and the Middle East, a 3–5% exceedance per decade is calculated for the CMIP5 and the other three datasets, although the latter include also extended areas without trend (Figure A8).

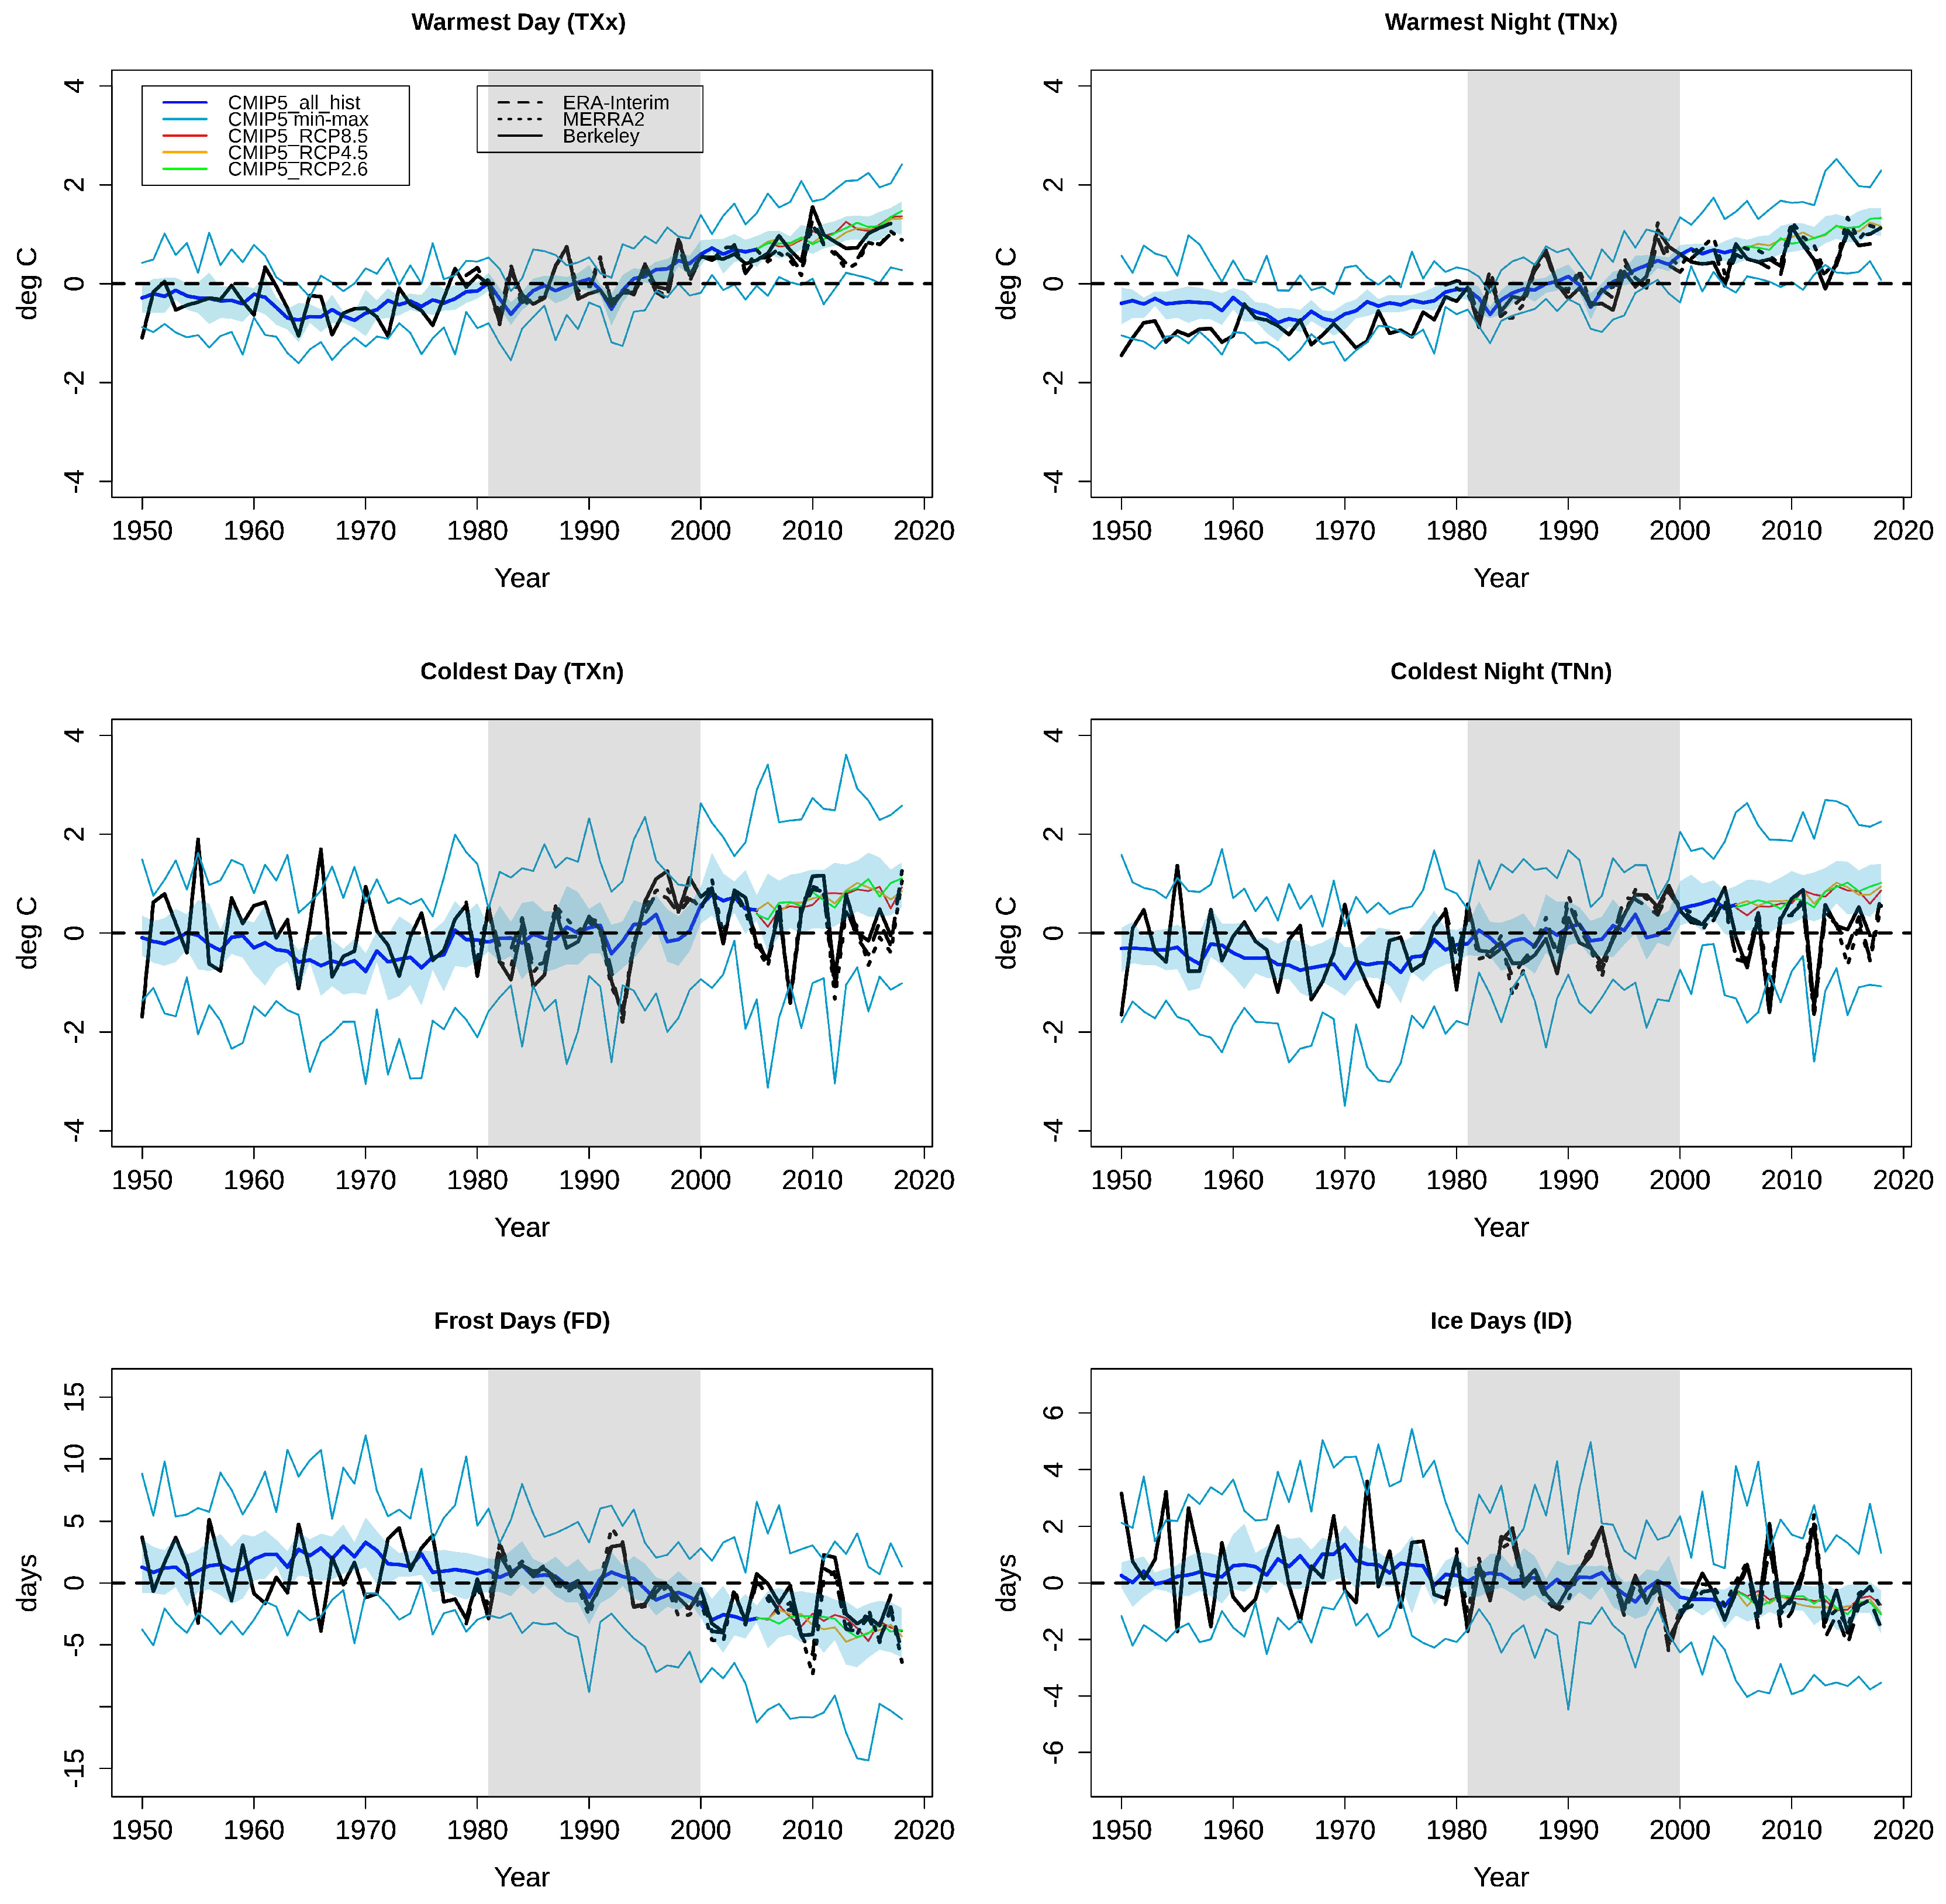
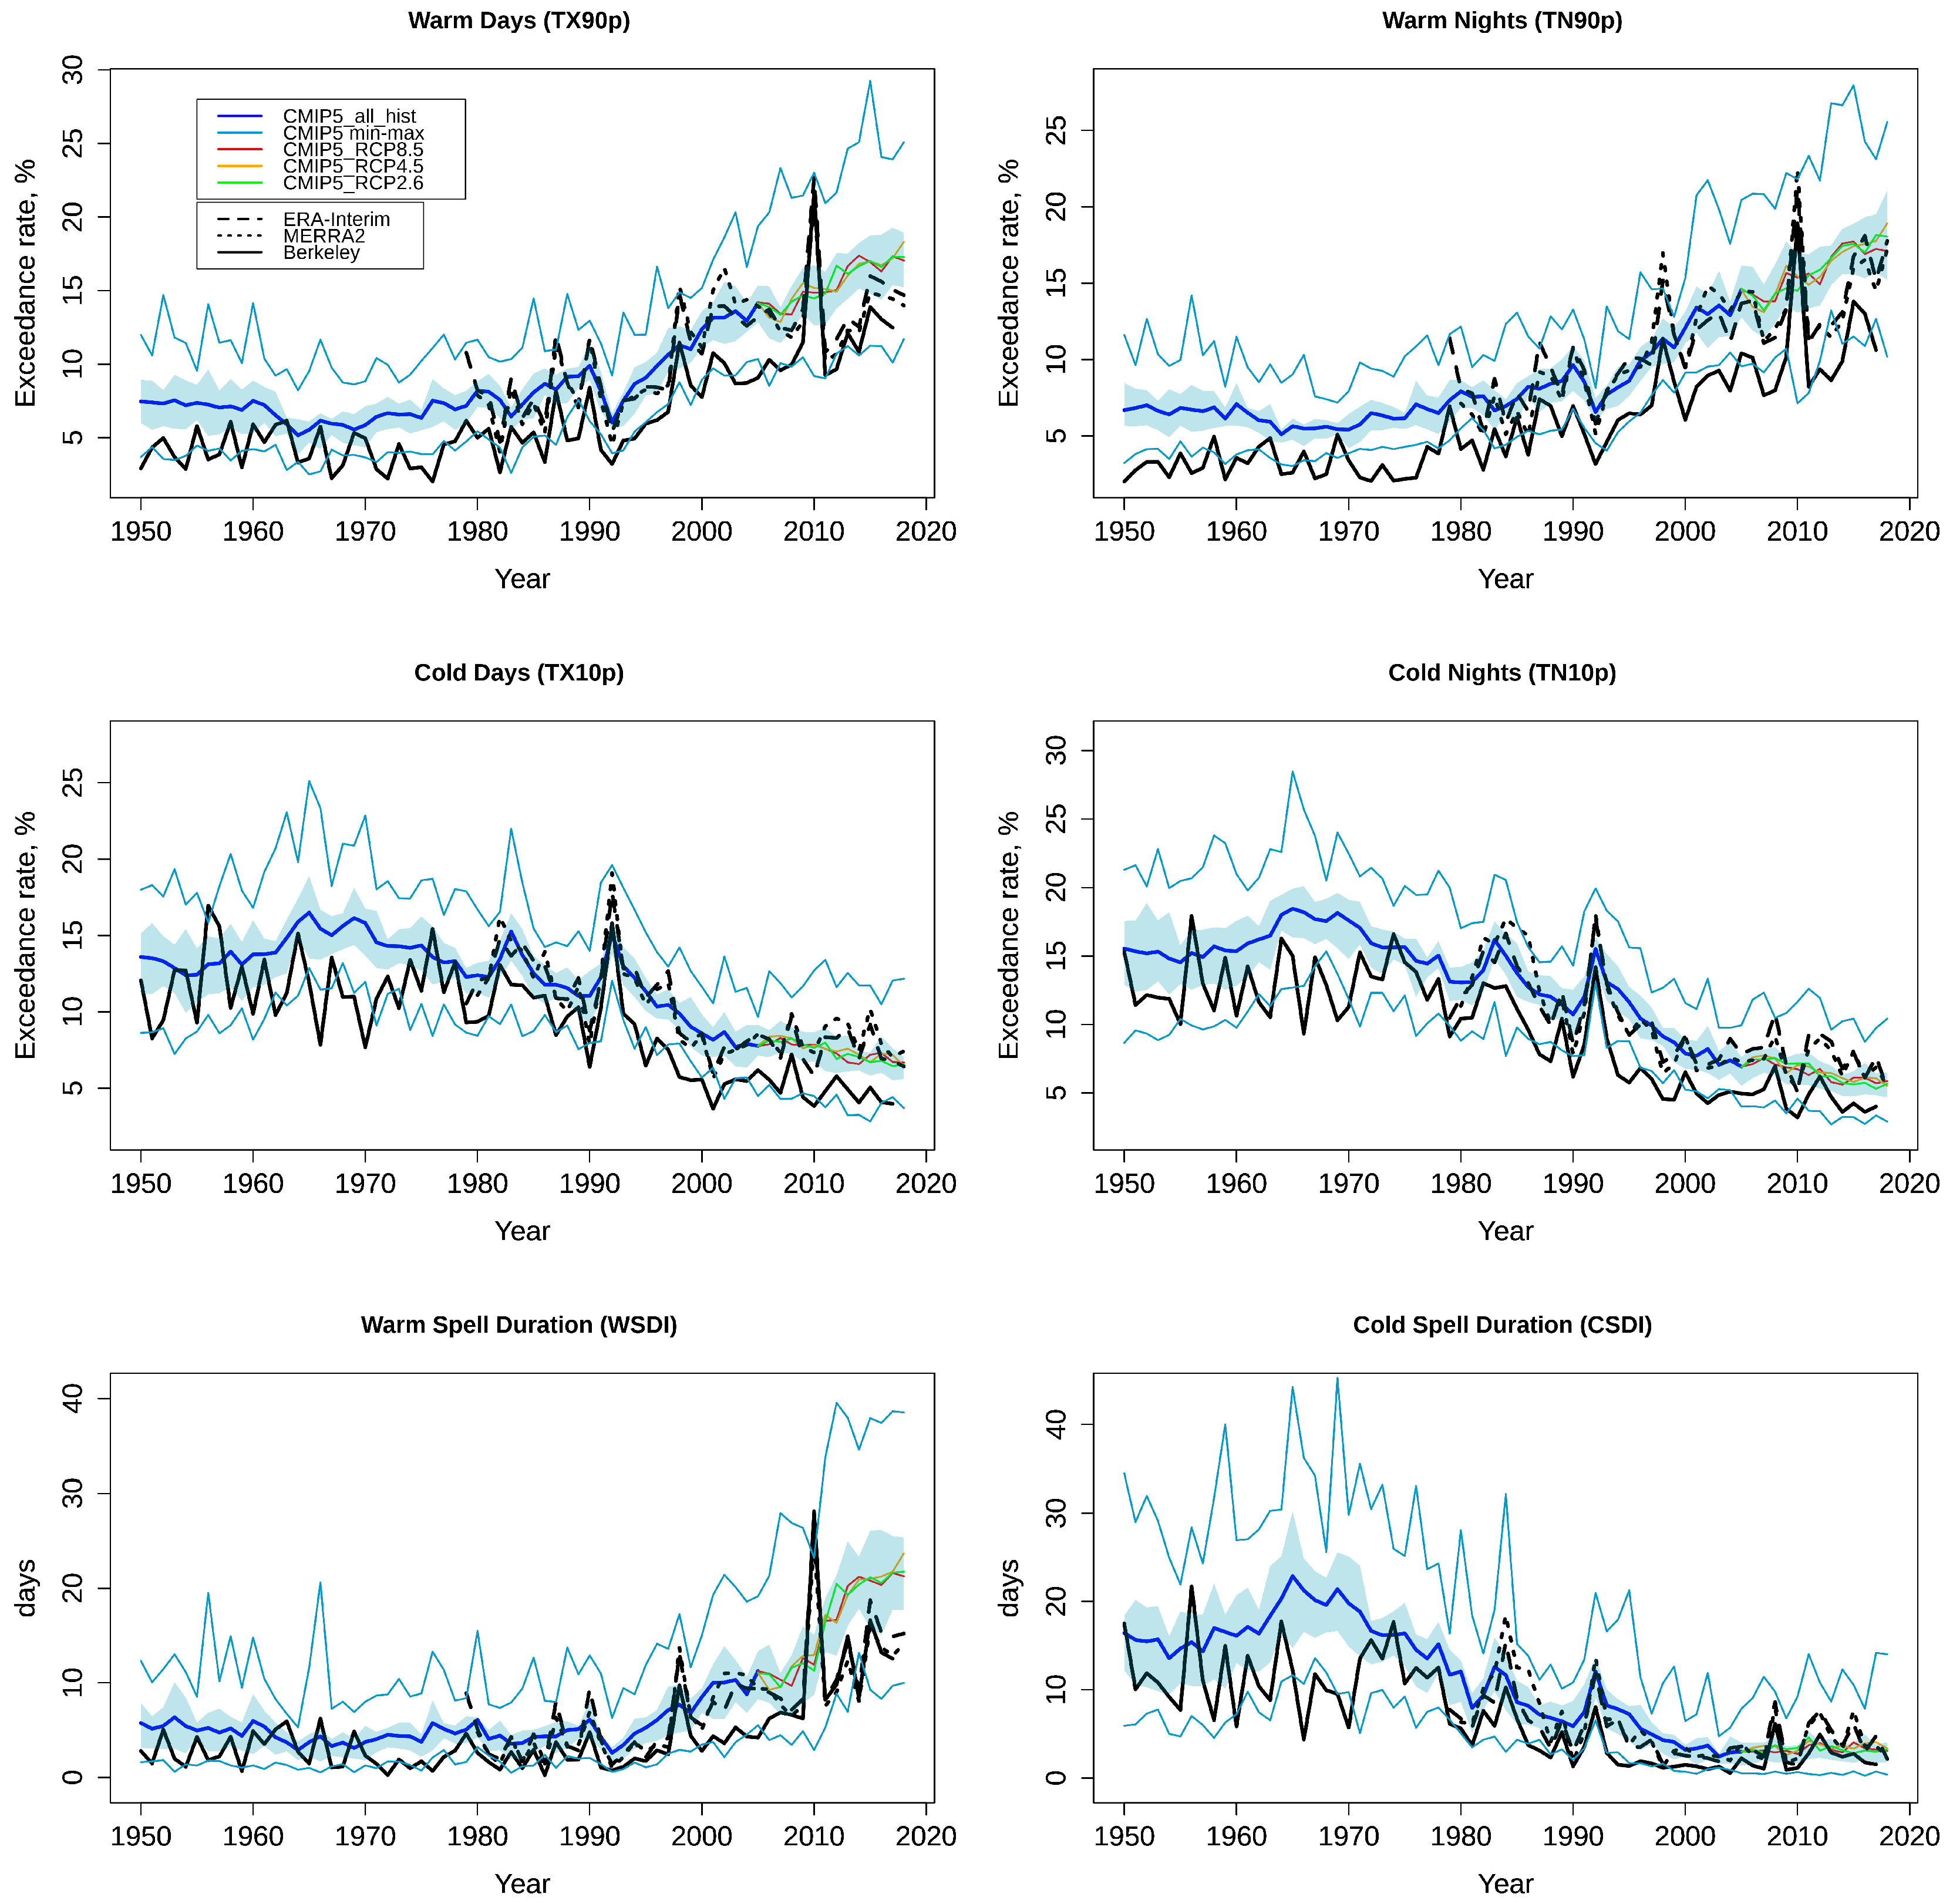
3.2. Temporal Evolution

The temporal evolution of the indices averaged for the MENA domain (land only) is shown in Figure 9 and Figure 10. Here we plot CMIP5 data for the historical period (1950–2005). For the 2006–2018 period we plot, separately, the high emissions scenario (RCP 8.5), the intermediate mitigation scenario (RCP 4.5) and the stringent mitigation scenario (RCP 2.6). It can be seen that the three RCP scenarios do not result in different temporal variation during this short period after 2005. This is in accordance with the global average temperature projections, where a differential warming due to the RCP scenarios is discernible only after 2030 [51].
Figure 9 depicts the temporal evolution of absolute and threshold indices displayed as anomalies relative to the reference period 1981–2000. Regarding the absolute heat extremes (TXx, TNx) the evolution of the CMIP5 multi-model ensemble closely follows the warming trends in the re-analysis and observation-based data, most evident from the 1990s and onwards, resulting in a warming, by 2018, of 1 °C. Note though that the values presented here represent the MENA averages and, as shown in Section 3.1.2, specific sub-regions warm at much faster rates. For the absolute cold extremes (TNn, TXn), the GCMs indicate a warming, in contrast to the re-analysis/observations which do not show significant trends. For all observational data, the TNn and TXn indices exhibit greater interannual variability than TXx and TNx, a feature that as expected, cannot be seen in the CIMP5 ensemble mean, but it is evident in the minima and maxima of the individual model values. In some recent years the observed cold anomalies (TNn, TXn) reach 2 °C, which is within the CMIP5 multi-model min-max range and in accordance with documented extreme cold winter weather events in the middle latitudes over Eurasia [52,53].
Regarding the FD index, the CMIP5 models follow the decreasing trend in the re-analysis and Berkeley Earth, being about 5 days in the past four decades. Until about 2000 the decrease in frost days although evident, was not flagged as significant in earlier assessments for the region [8], but our updated analysis identifies a persistent trend. Frost days are usually related with nighttime minimum temperatures and the FD index temporal variation is indeed mirrored by the one in TNx. It is also worth noting the significant discrepancies among datasets in absolute values (not shown), of the order of 10 days. For the ID index there is overall agreement between CMIP5 models and re-analysis/observations suggestive that we have entered a period of fewer Ice Days in the 21st century. However, due to the absence of ice days in large parts of the MENA region, the absolute values of the index are small and there is a large interannual variability.
Figure 10 illustrates the time series of the percentile-based and duration indices. Overall, the models follow the evolution of re-analysis and observational datasets. The increasing trend that is observed for warm days/nights and WSDI and the decreasing trend of cold days/nights and CSDI is in line with the trends obtained at the global scale [27]. In contrast with the absolute and threshold indices, the CMIP5 model minima and maxima can capture to some extent the interannual variability indicated in the other three datasets. For instance, the GCM range captures the observed peaks in cold days (TX10p) and cold nights (TN10p), but to a lesser extent the lows in Warm Days (TX90p) and Warm Nights (TN90p), in the years following the 1982 El Chichon and 1991 Mt. Pinatubo volcanic eruptions. The presence of the volcanic forcing signal corroborates for the MENA region, the findings of the global analysis of CMIP5 by Paik and Min [54], who demonstrated that temperature extremes follow the mean temperature response due to the volcanic forcing.
Further scrutiny of the graphs in Figure 10 reveals that while the variation of the model ensemble mean in the historical period (1950–2005) closely follows that of the re-analyses/observations, the upward trend in the scenario simulations after 2005 is twice that compared to the observed warm extreme indices (TX90P, TN90P, WSDI). The observed indices indicate less pronounced warming in recent years and, except for a warm peak in 2010, lie outside the model inter-quartile range (IQR, between the 25th and 75th percentile), at the lower end of the model range. This observed increase in the warm extremes (mainly the TX90P, TN90P, and WSDI) after 2005, within the period during which the apparent global mean surface temperature (GMST) trend appears to level-off, may be linked to sea surface temperature variations associated with the Atlantic Multidecadal Oscillation [55].

3.3. Box and Whisker Plots
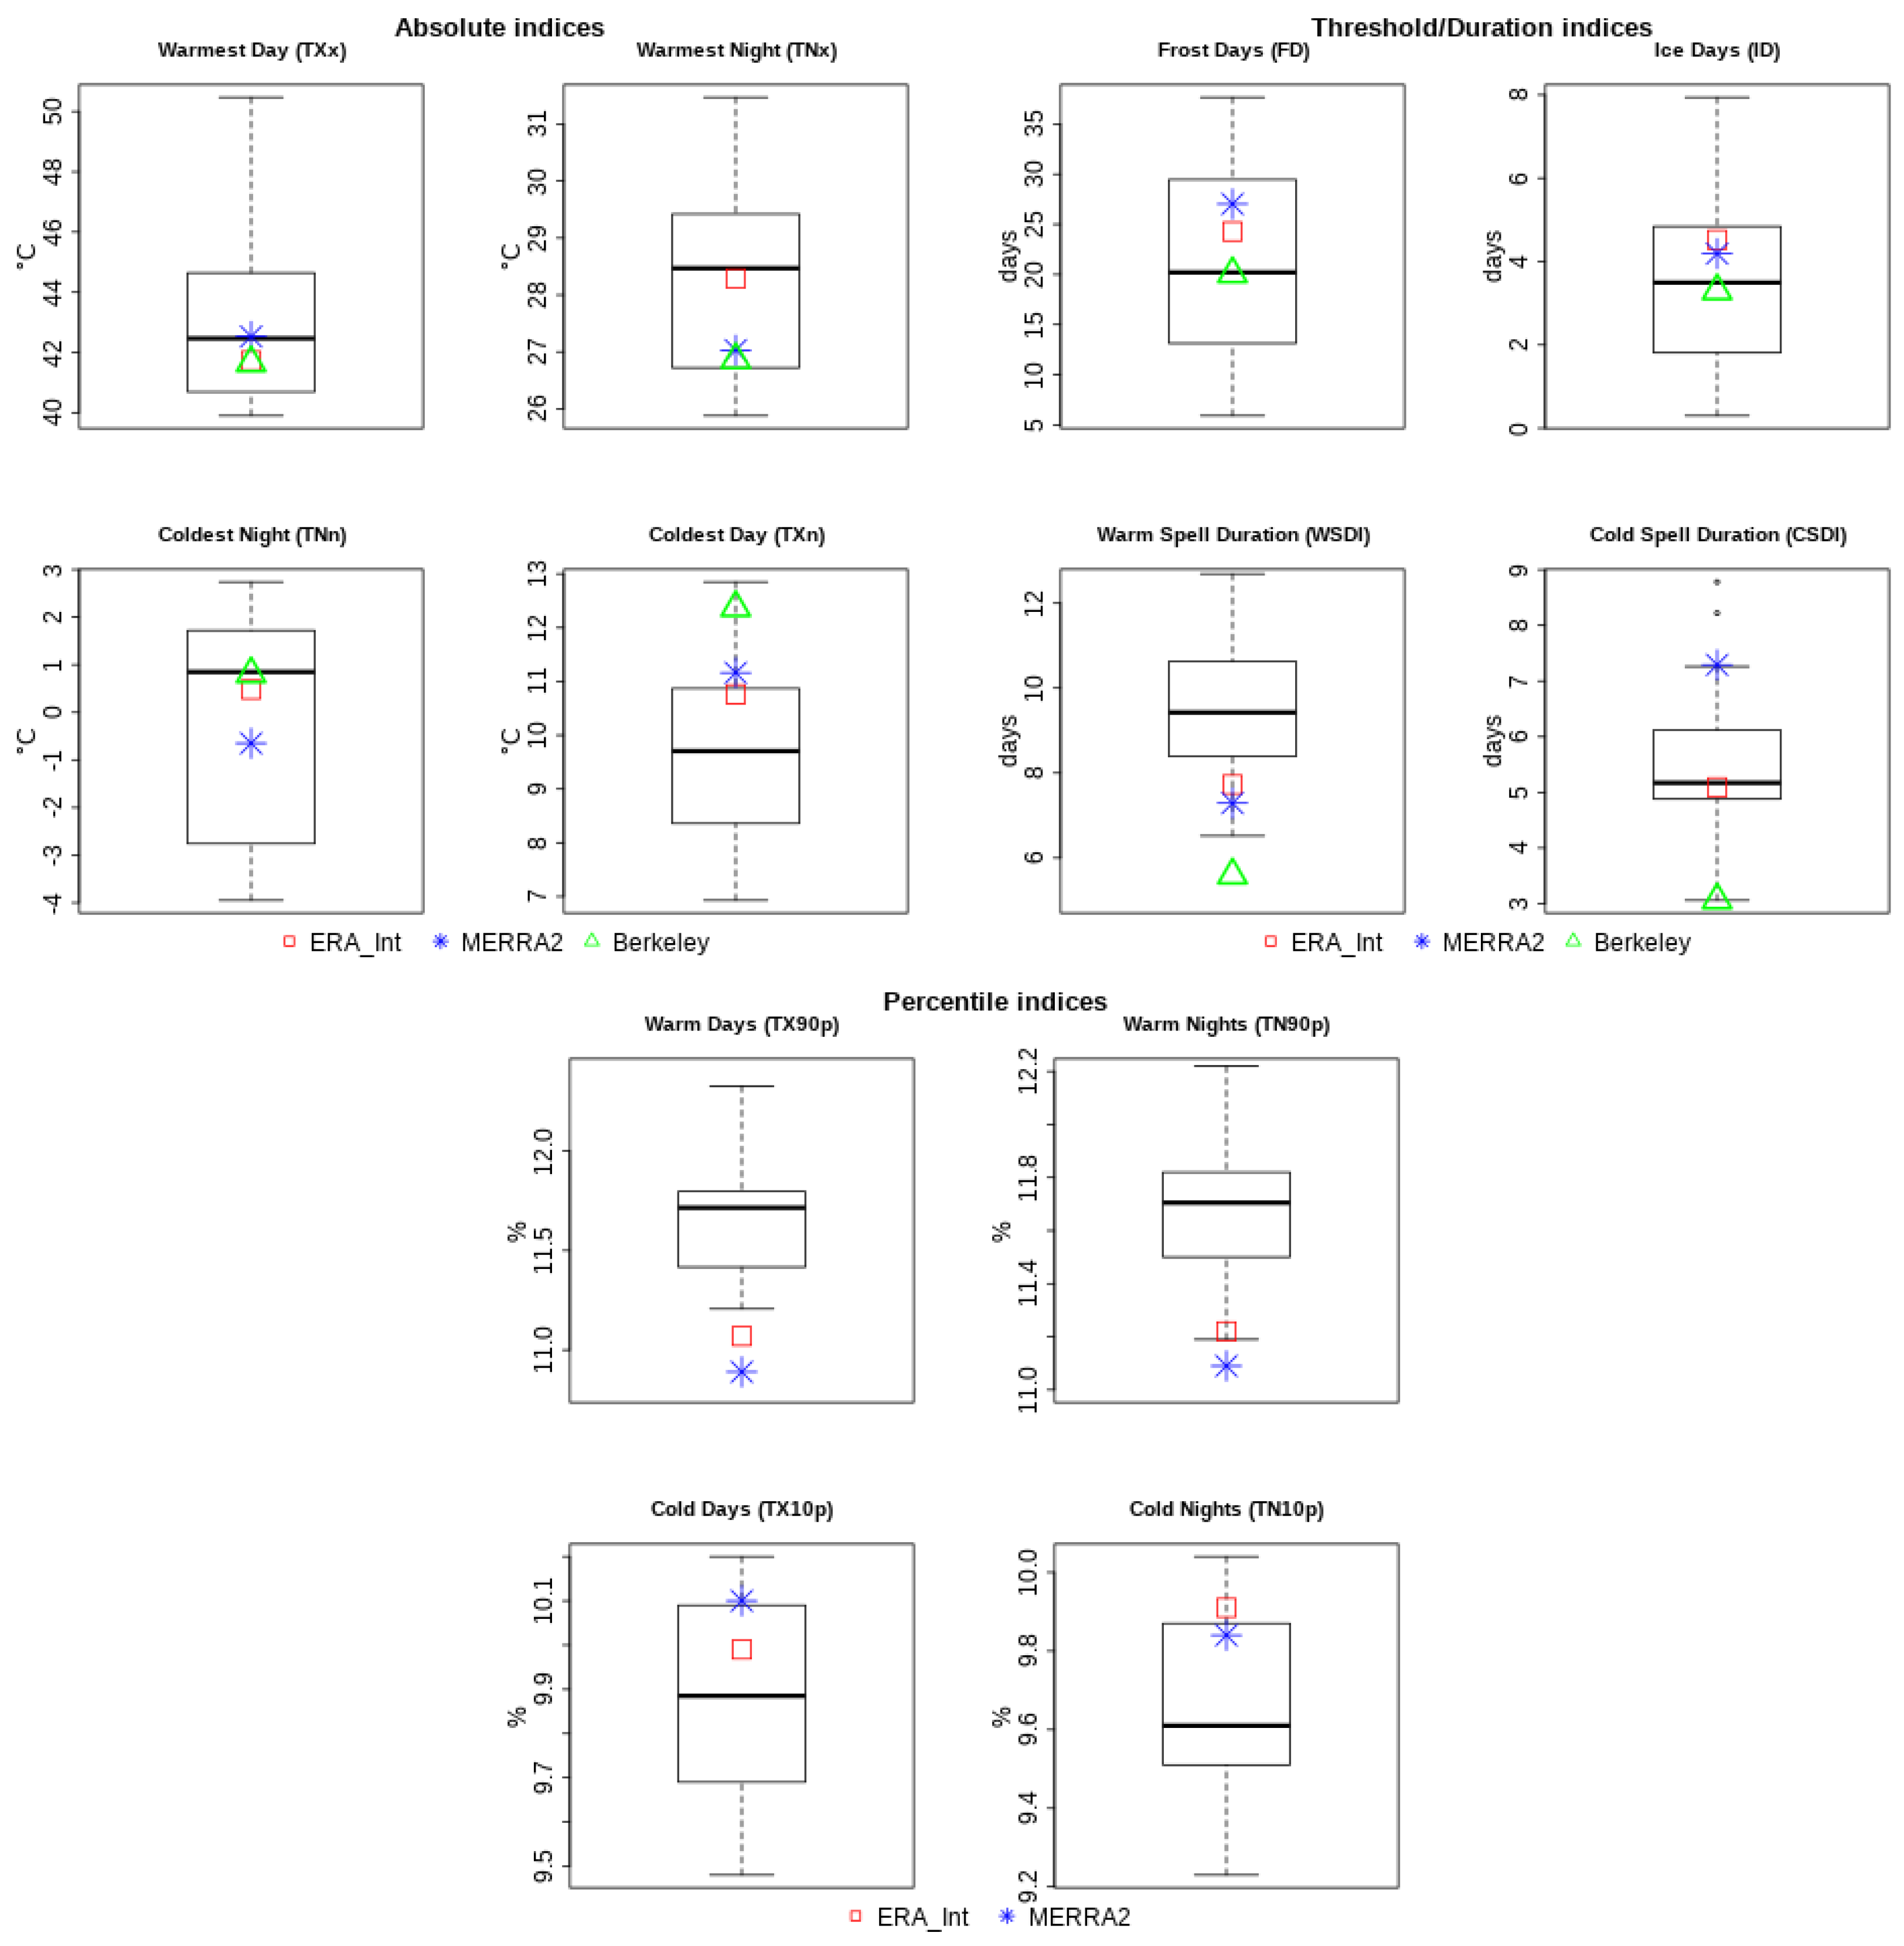
3.3.1. Climatology

A more detailed analysis of the climatology (absolute values) of temperature indices of extremes (MENA domain average) shows the CMIP5 model percentiles and min-max range compared with the Berkeley Earth and the two re-analysis datasets, graphically summarized by the box-and-whisker plots in Figure 11. For the absolute indices, the Berkeley and re-analyses values lie within the models IQR, indicating overall good agreement with the CMIP5 results, except for TXn, which is underestimated by the majority of models. The best agreement is obtained for TXx, with the CMIP5 median almost coinciding with the compact, observed values (and a model outlier by >8 °C). Note also that the CMIP5 IQR (representing half of the models) for all four indices is about 3–4 °C, while the range in the observed datasets is up to 2 °C, for which apart for TXx, all three datasets disagree, a reminder of the observational uncertainty and the importance of using several data sources in climate model evaluation [56].
For frost days (FD) and ice days (ID), the spread of the Berkeley Earth and re-analysis datasets is quite small and falls within the CMIP5 IQR. The observed spread is also small for WSDI, but below the 25th percentile of the multi-model ensemble meaning that most models overestimate the index (by about 2 days). For CSDI there is overall agreement between models and observational datasets, except for a notable, off scale, model outlier. The GCM median value lies in the middle of the other datasets spread, which is large though.
For the percentile indices, the inter-quartile model range is small for all. This is expected from the definition of these indices as the 1980–2018 range is very similar to the baseline period 1981–2010 for which the average exceedances for the upper and lower deciles of TX and TN are the nominal 10%. To obtain a clearer illustration of the model spread, the index values for Berkeley are not shown since they have lower values (7–8%) and out of the plotted space. The re-analysis values are similar and lower than most models in the representation of warm days and nights (TX90p, TN90p), suggesting a slight overestimation by the CMIP5 results.

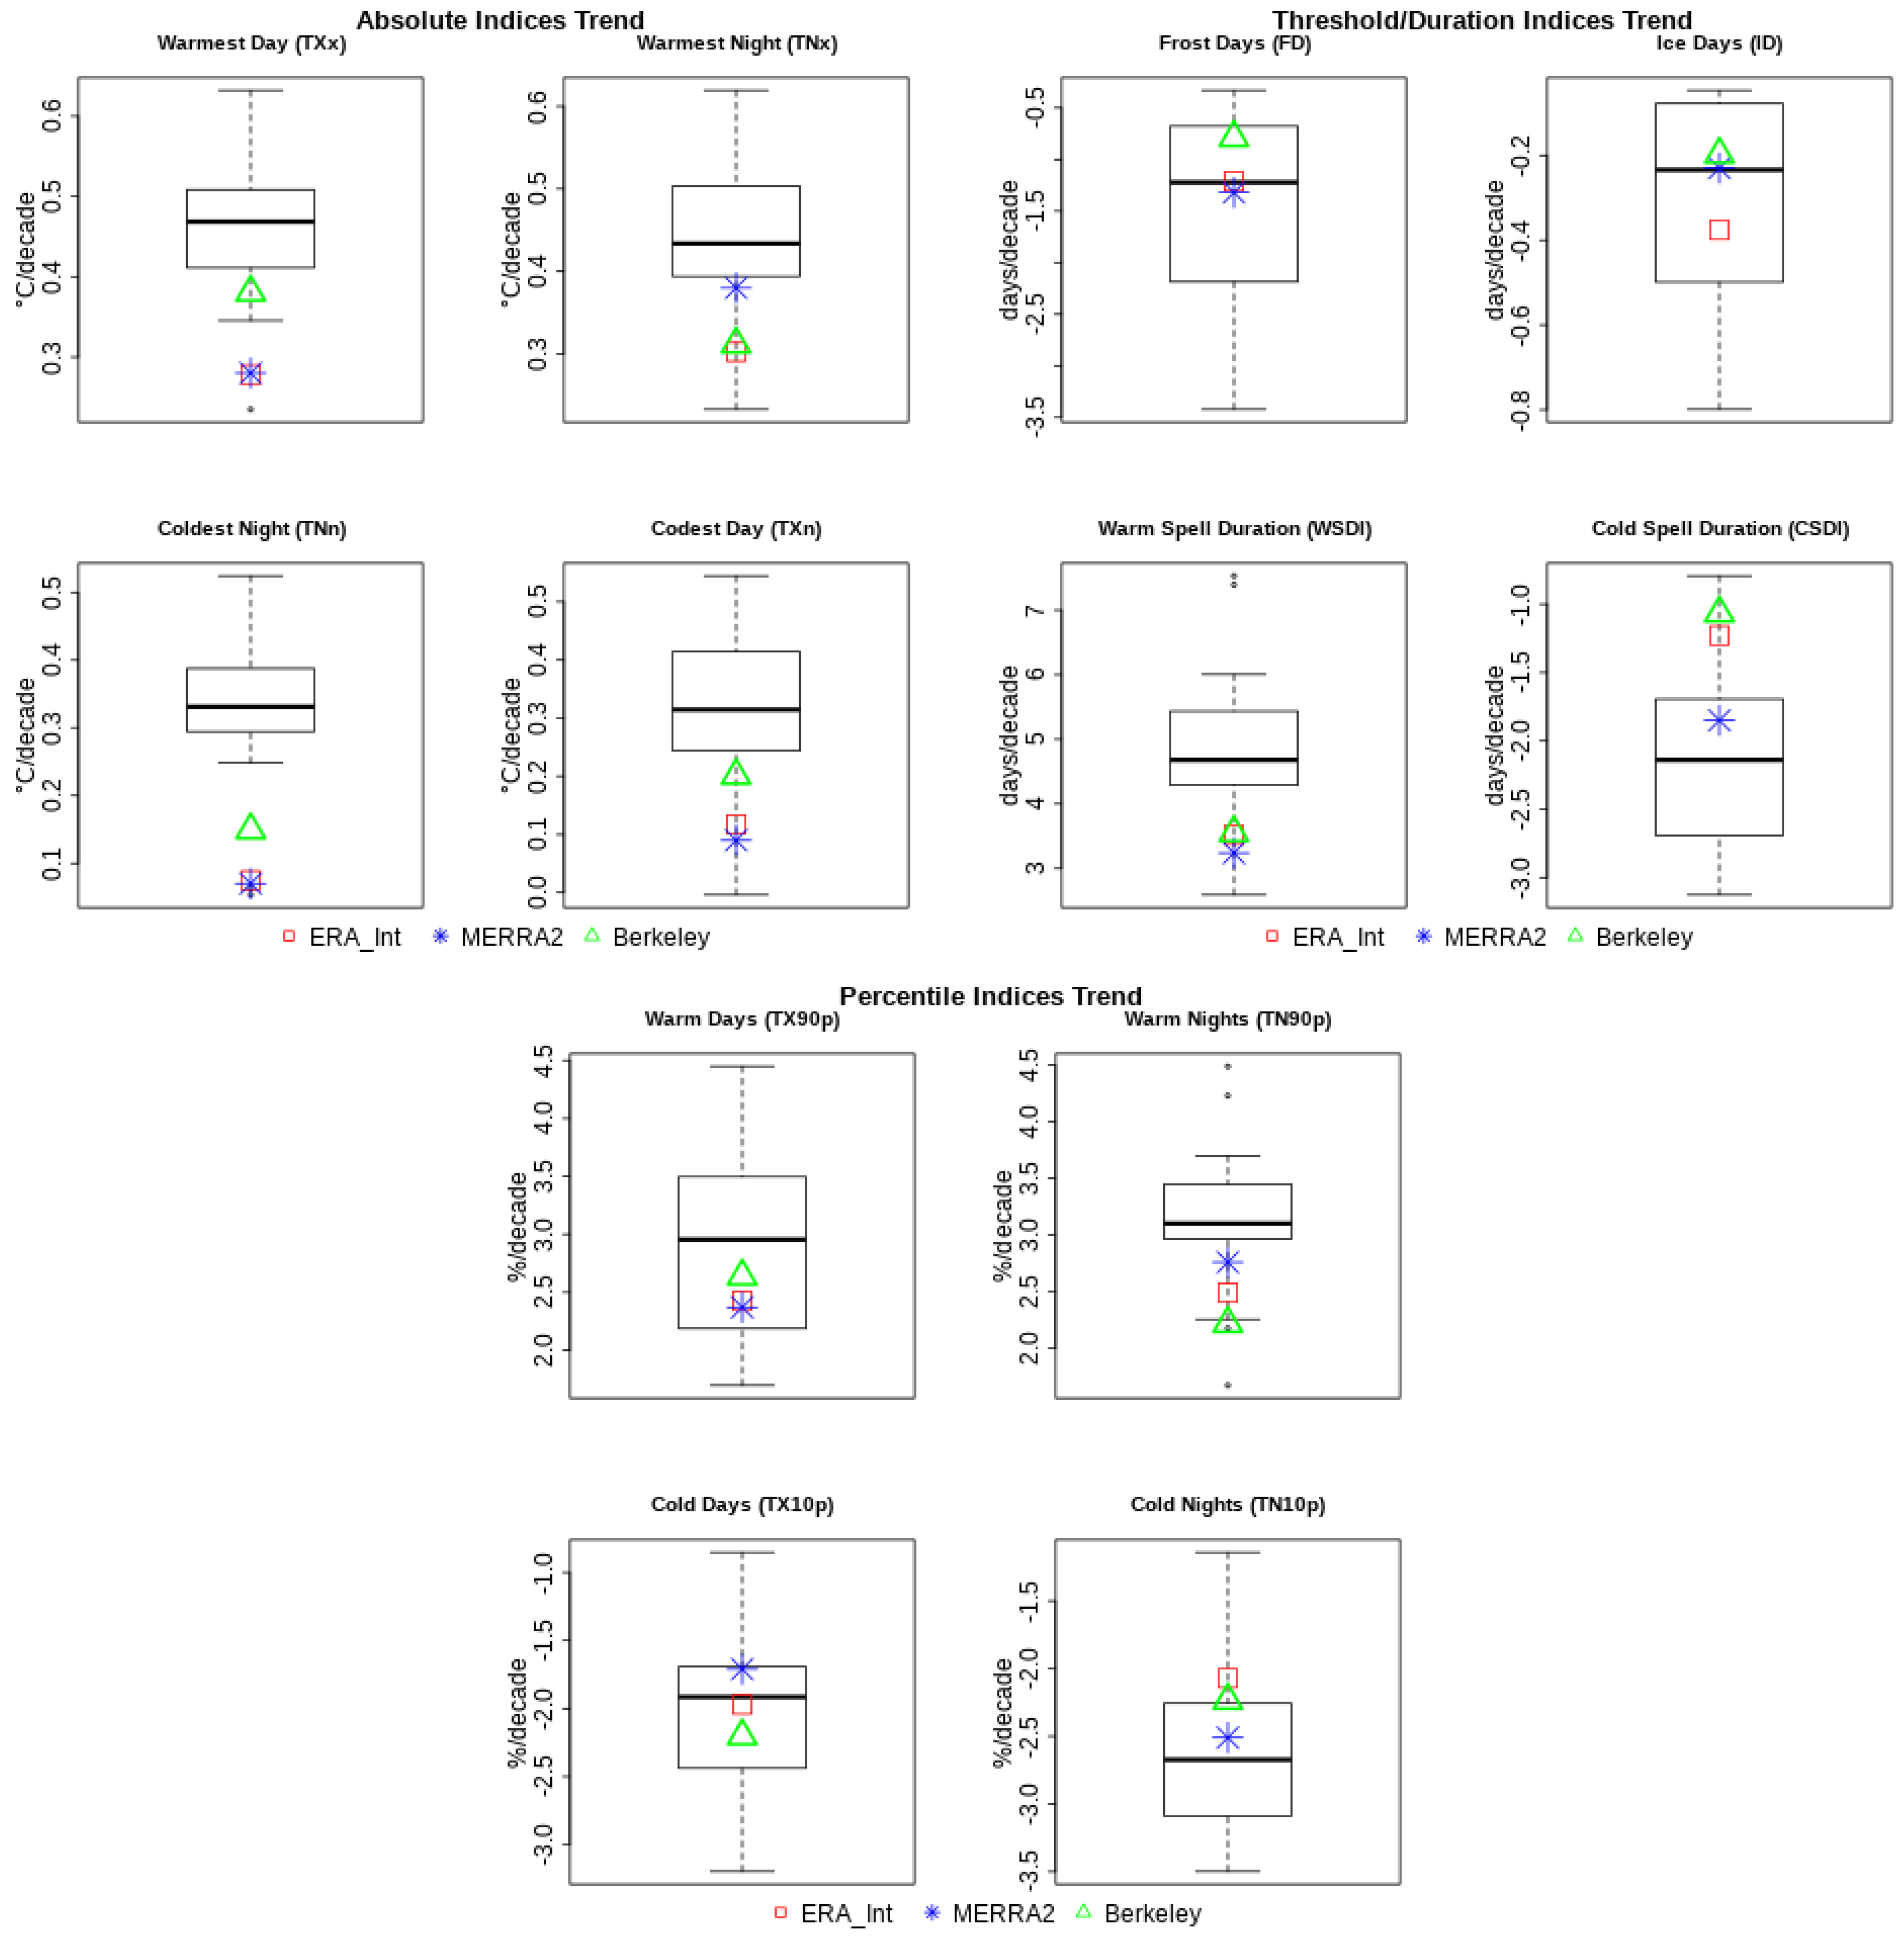
3.3.2. Decadal Trends

We repeat the boxplot analysis for the decadal trends of the indices, shown in Figure 12. For the absolute indices, the CMIP5 inter-quartile range indicates a warming trend of the order of 0.4–0.5 °C/decade for the warmest day and night (TXx and TNx) and 0.3–0.4 °C/decade for the coldest day and night (TNn and TXn) respectively. These are about twice the rate derived from the three observational datasets, indicating a faster warming in the GCMs than the observed. According to the same numbers, the CMIP5 models simulate a slightly larger warming trend in these absolute value warm extremes than in the cold ones. Interestingly, a larger warming in the warm extremes is also obtained from the re-analyses and Berkeley Earth datasets.
For the FD and ID indices, good agreement between the GCMs and re-analyses/Berkeley Earth is obtained, as all three datasets fall within the inter-quartile model range. The average decadal trend is much less pronounced for the ID index, which is reasonable due to the low average value of this index in the MENA region. The larger overall model warming compared to the observations is also apparent in the duration indices. A pronounced positive trend in the WSDI index, with the ensemble model median trend roughly 5 days/decade, is about 1 day higher than the re-analysis and Berkeley Earth. There is also a negative trend in CMIP5 for the CSDI index (−2 days/decade), slightly stronger than the observed (which is also negative) by 1 to 2 days per decade.
In contrast with the climatology comparison, the Berkeley Earth average decadal trends agree with the re-analyses for the percentile indices. According to the CMIP5 ensemble median, there is an increasing rate of roughly 3% per decade for the warm days (TX90p) and the warm nights (TN90p), although the inter-quartile model range is broader for TX90p. Lower values (by 0.5 % on average) are derived for the re-analyses and Berkeley Earth. The models show a negative trend of 2.5 %/decade for the cold nights (TN10p), with MERRA-2 (and to a lesser extent ERA-Interim and Berkeley Earth), very close to the model median. A negative trend ( 2.0 %/decade) in the cold days (TX10p) is derived for the GCMs, in very good agreement with the observational datasets. From the overall results of the present section we can infer that the increasing trend of heat extremes is larger than the decreasing trend of cold extremes. This asymmetry has been documented on a global level and it is linked with differences in seasonal trends in the Northern Hemisphere [57], which seems to affect the MENA region to some extent [58].

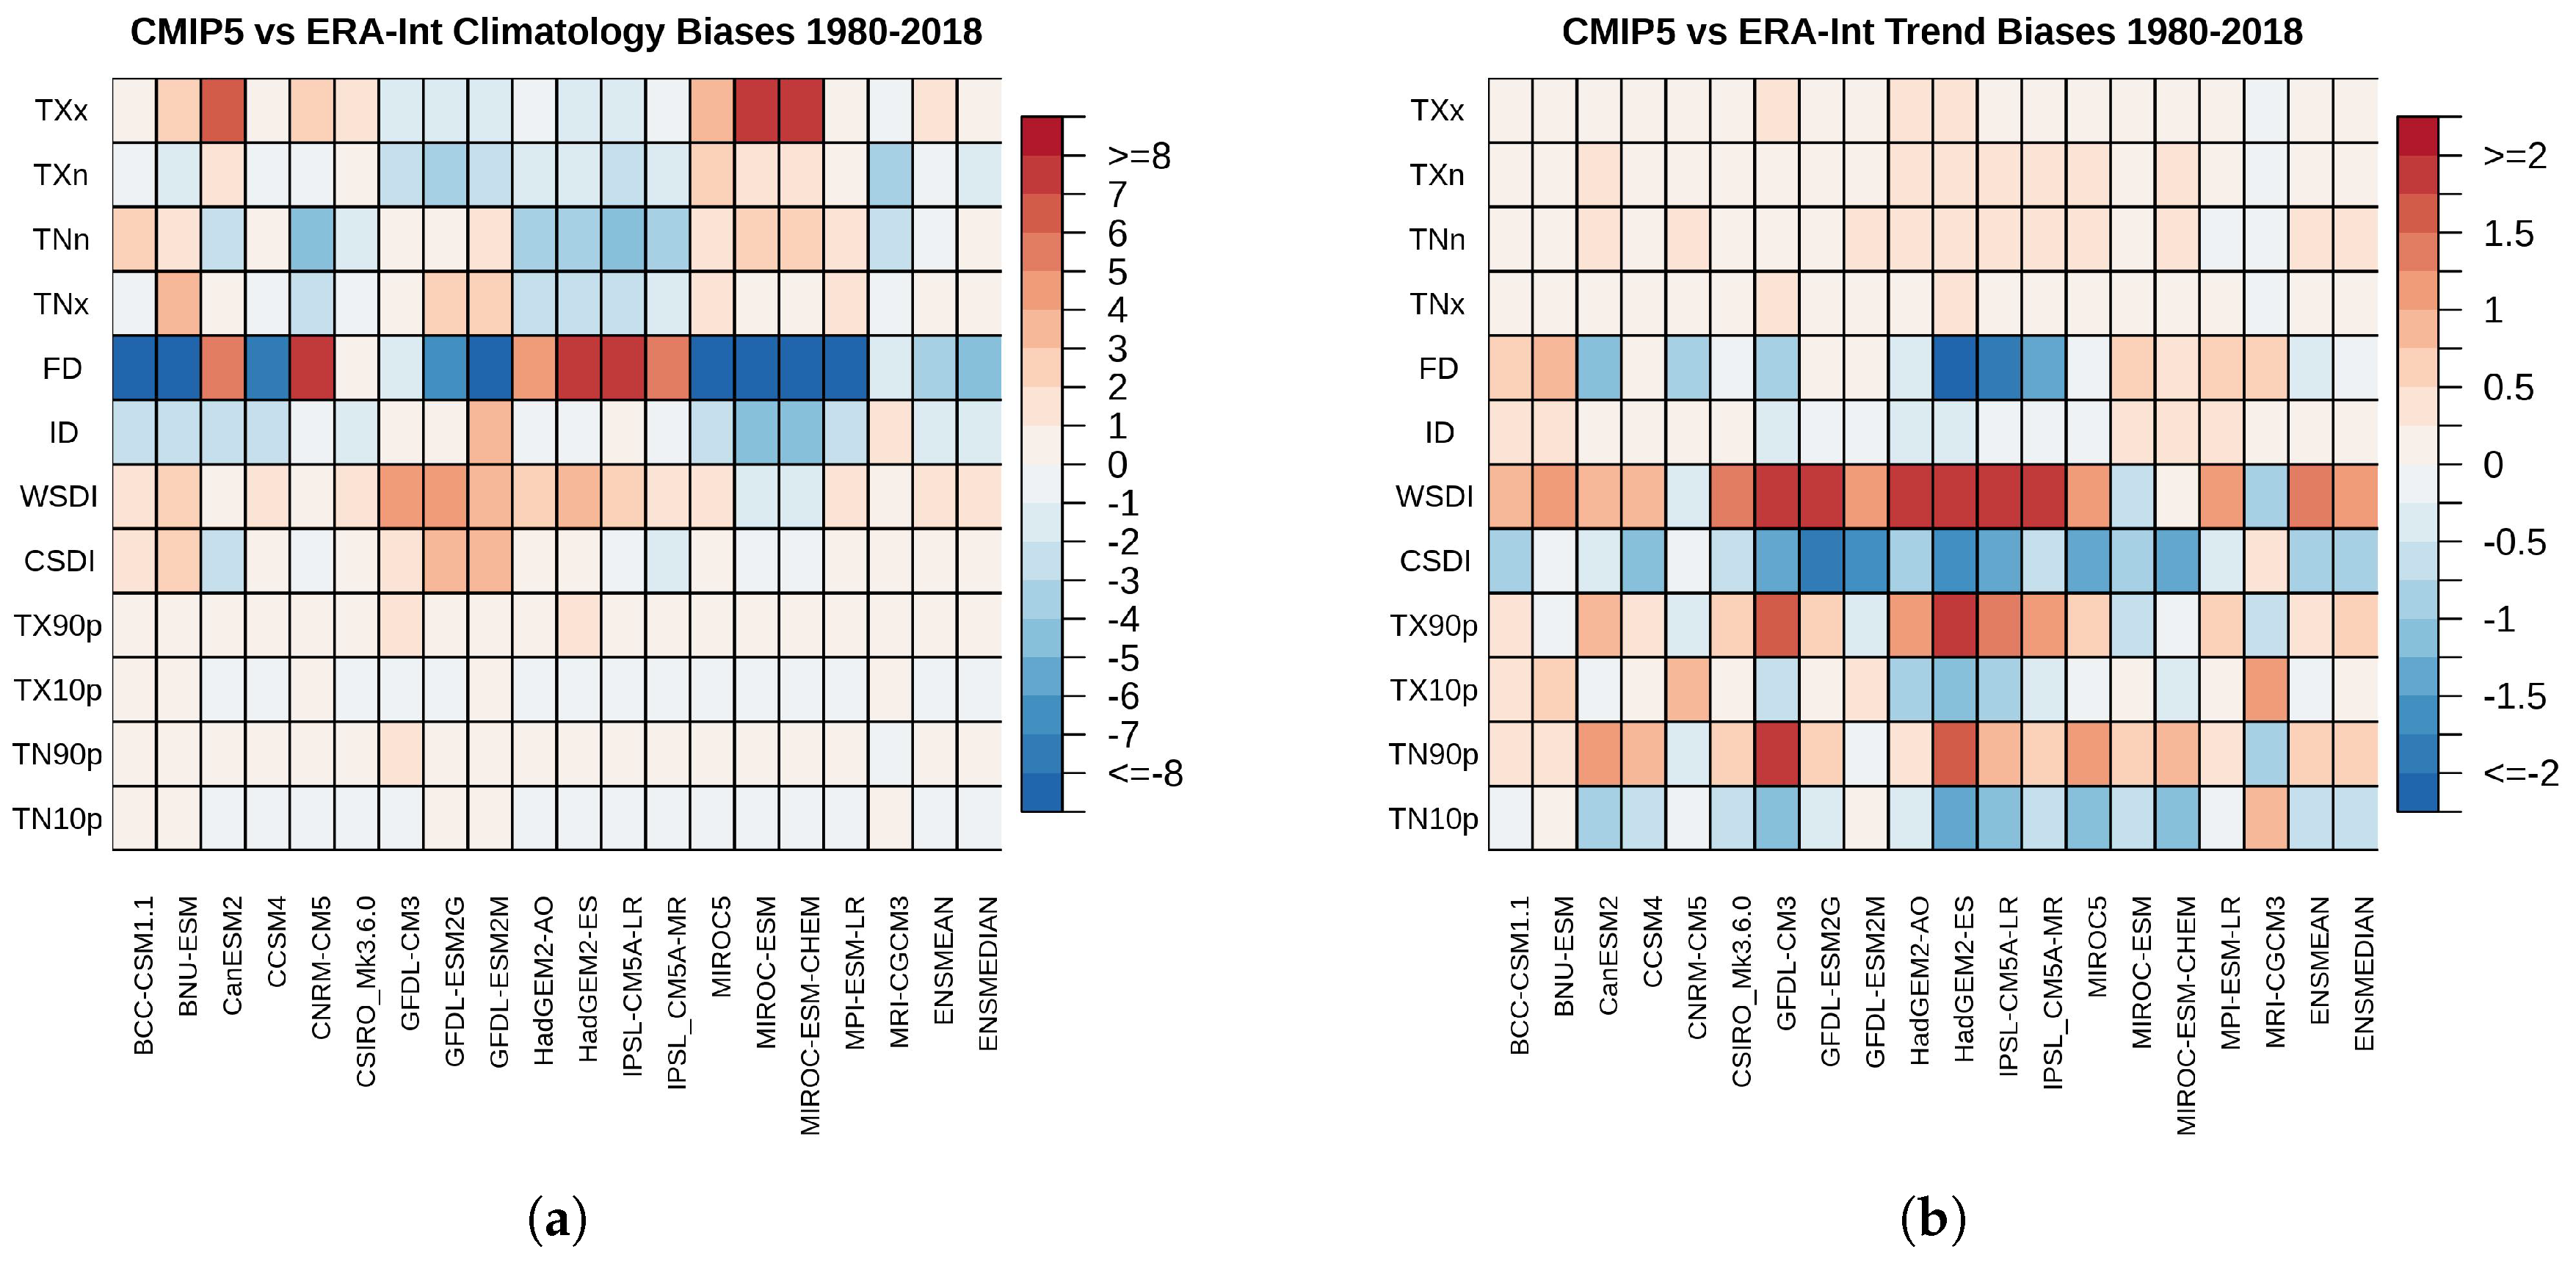
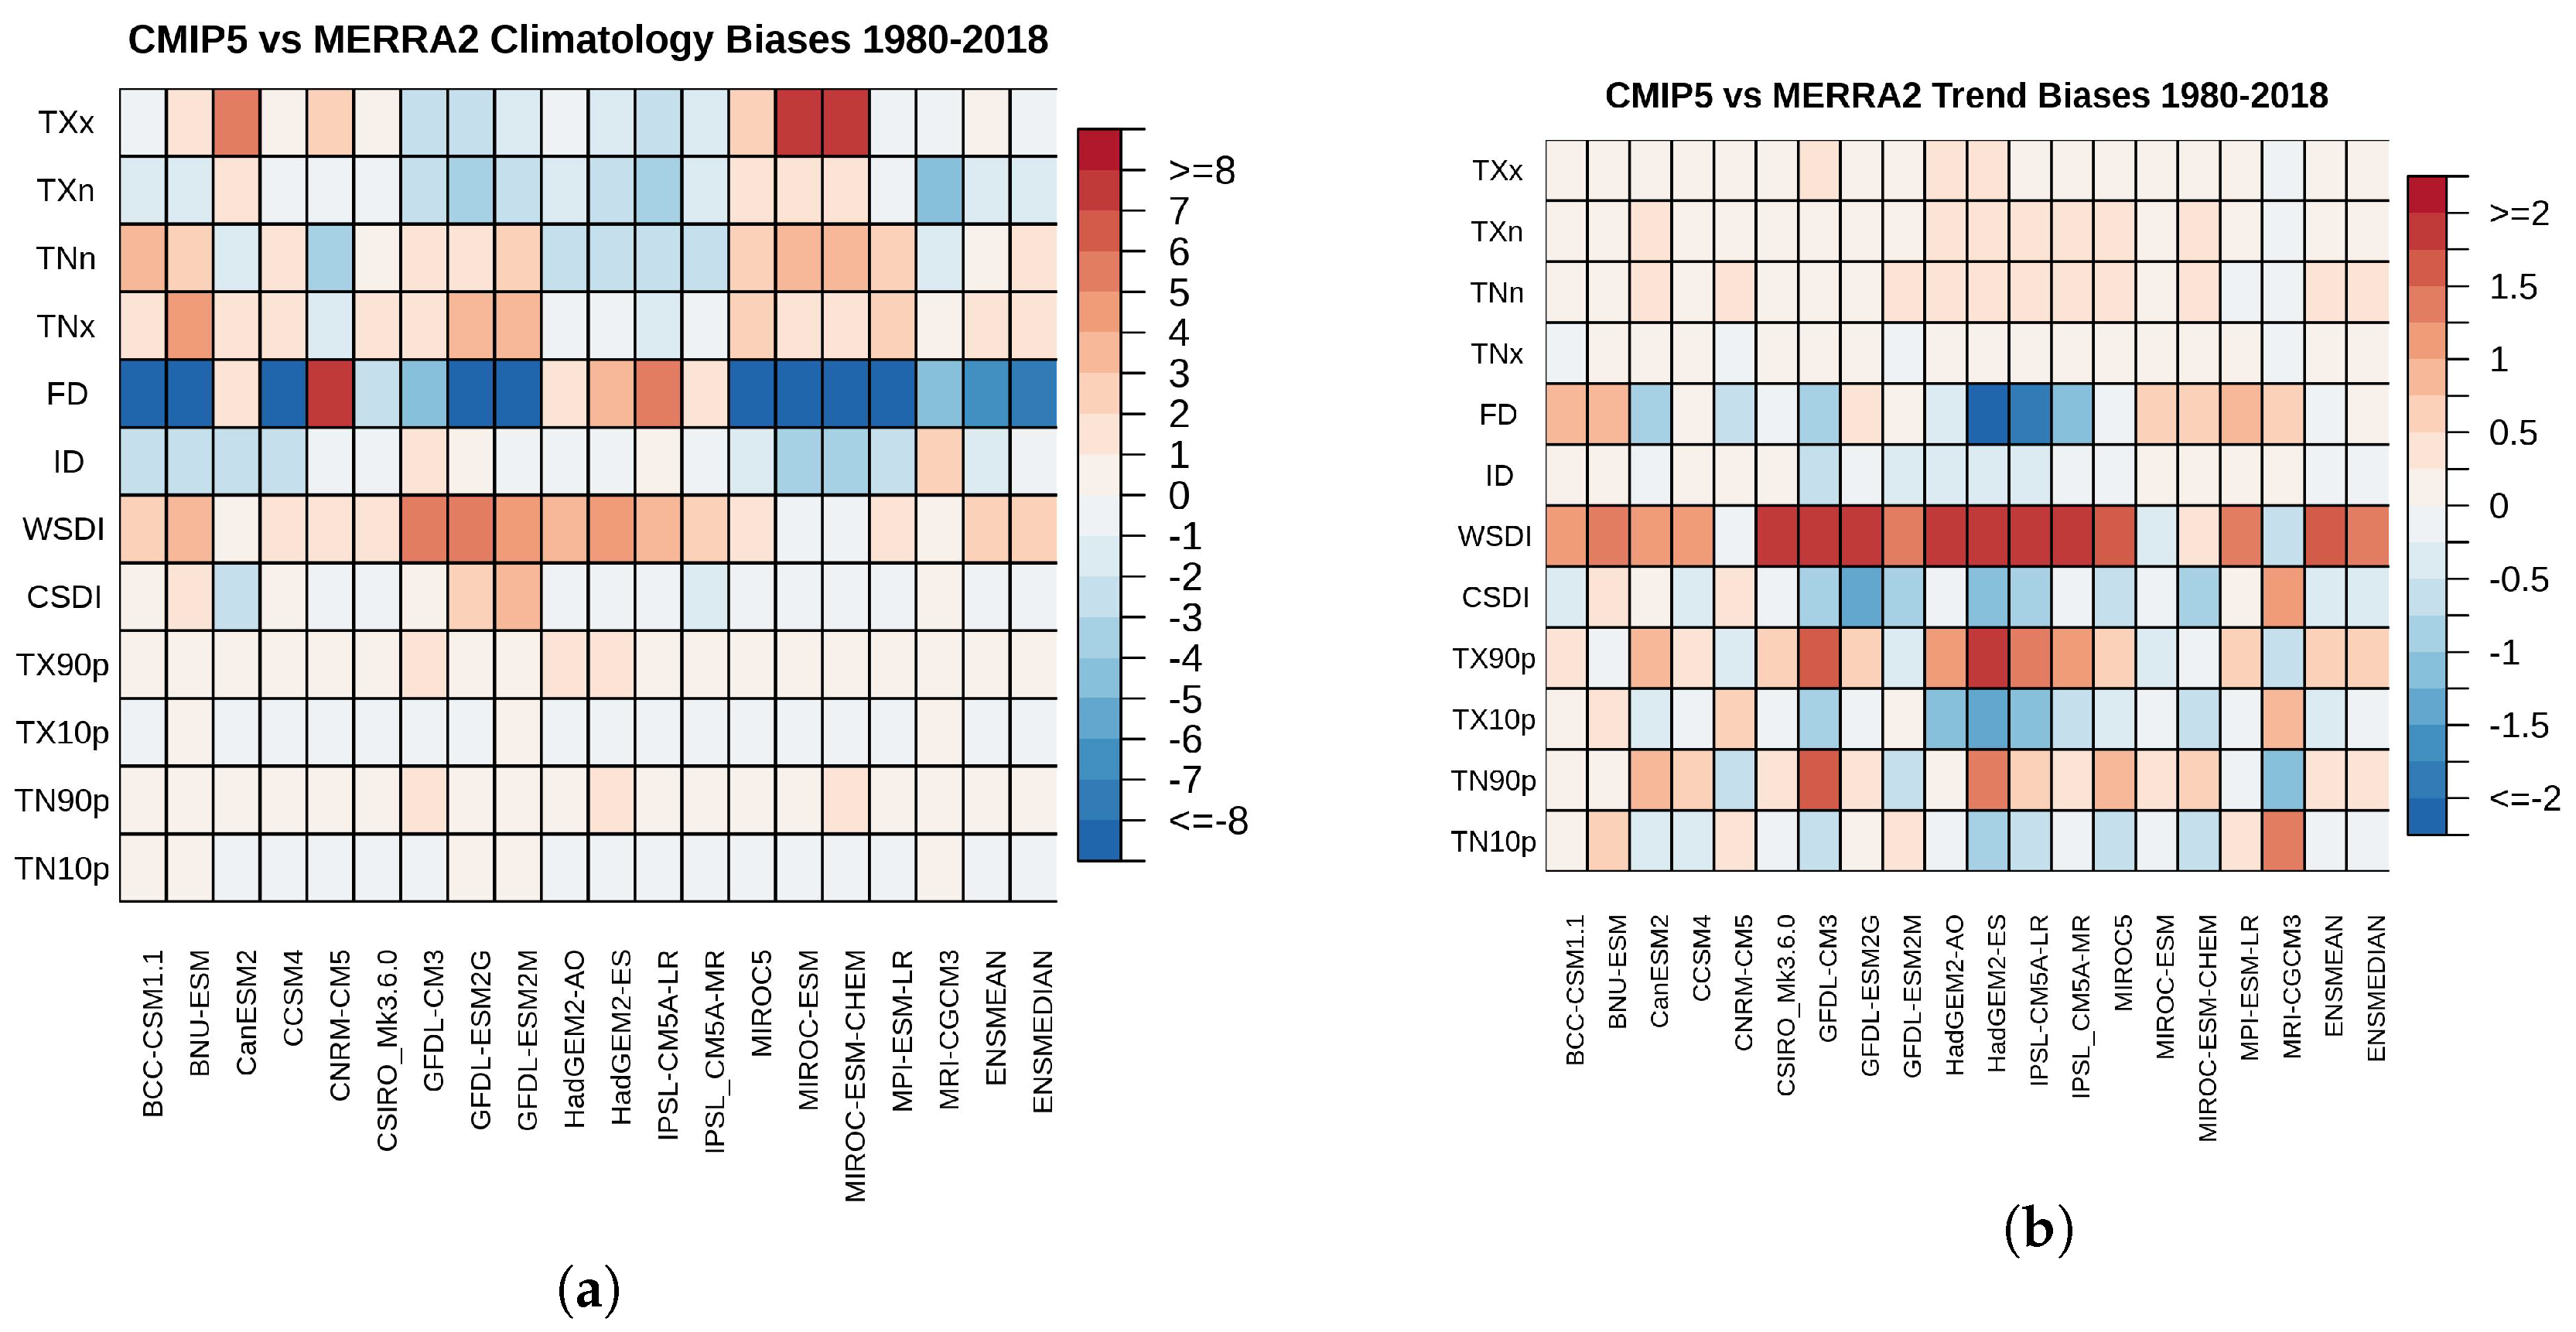
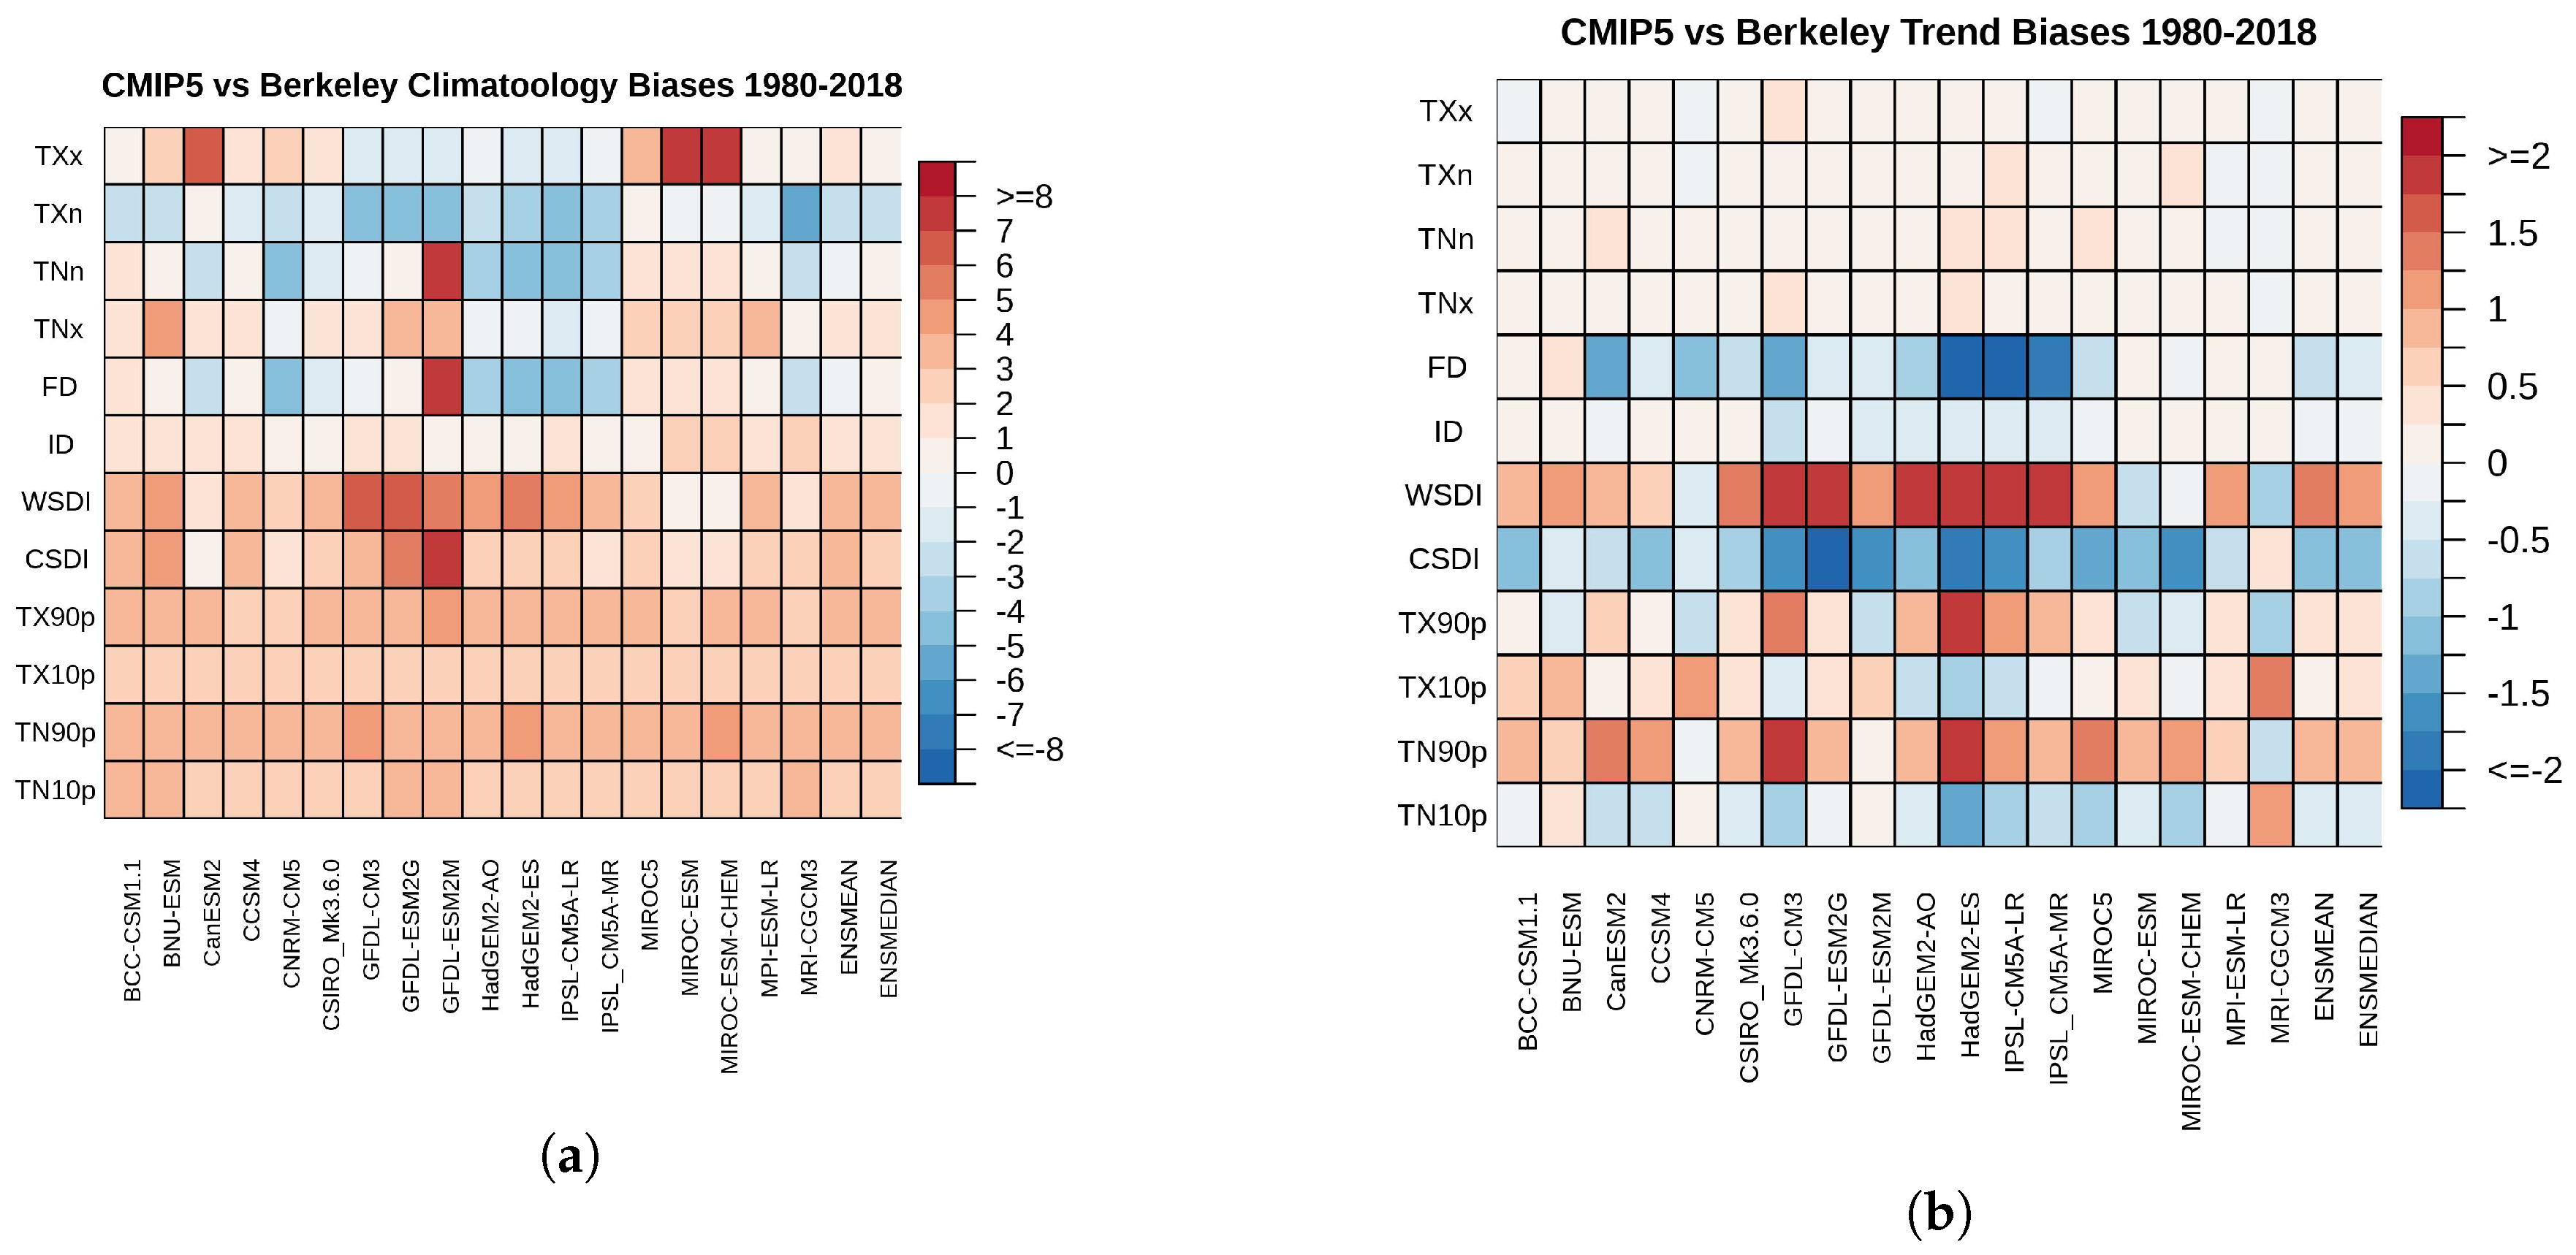
3.4. Quantification of Individual Model Biases

The overall performance of individual models in simulating the 1980–2018 climatology and decadal trends of the indices is summarized in the “portrait” diagrams of Figure 13. The portrait diagrams display the relative magnitude of spatially averaged bias for each index (rows) and for each model (columns). The warmer colors indicate models with positive bias and colder colors indicate models with negative bias. Here the model performance is assessed with respect to the ERA-Interim re-analyses. In addition to the individual models the performance of the so-called mean and median models is displayed in the last two columns.
Regarding the model representation of 1980–2018 climatology (Figure 13a), the diagram indicates that the multi-model mean outperforms individual models because some of the systematic errors in individual models are cancelled out in the ensemble mean. For the percentile indices (i.e., TX90p, TX10p, TN90p, and TN10p), the models generally perform well. This is not surprising, since for the calculation of these indices we used 1981–2010 as the base period, so we expect values from all datasets to be, as mentioned before, around 10% for that period and thus leading to trivial biases.
For the other indices, most models perform reasonably well apart from some outlying models in the TXx index (MIROC-ESM, MIROC-ESM-CHEM, CanESM2). McSweeney et al. [59] also showed that MIROC-ESM and MIROC-ESM-CHEM were simulating key regional aspects of Europe’s climate poorly. We identify MRI-CGCM3, CCSM4 and CSIRO_Mk3.6.0 as the best performing models. An exception is the frost days (FD) index which seems to be poorly represented by most models. We find that some models show large negative and some other large positive biases for FD compared to the ERA-Interim data. As already mentioned, the ERA-Interim, MERRA-2 and Berkeley Earth datasets do show differences, therefore, no conclusion can be drawn regarding the model ability to accurately simulate this index.
For the decadal trends (Figure 13b), the GCMs exhibit small biases for the absolute indices (TXx, TXn, TNn, and TNx). Most models have a small positive bias, in other words, they slightly overestimate the trend compared to ERA-Interim. Similar to Figure 13a, the multi-model mean tends to outperform the individual models. For ice days (ID) index, models exhibit small biases which can be attributed to the general stability of the trend and the relatively small ID value of the MENA region. With respect to the FD index, models and re-analyses show noticeable uncertainty, but for the trend most models are in good agreement with the ERA-Interim, except for a few outliers (HadGEM2-ES, IPSL-CM5A-LR). The biases are more prominent for the percentile-based indices. Overall, based on the ensemble mean and median, positive biases are observed for the warm extreme indices (WSDI, TX90p, TN90p) and negative biases for the cold extreme indices (CSDI, TX10p, TN10p). Hence, most CMIP5 models overestimate the average MENA region warming rate, as also shown—in Figure 6. A more detailed analysis of the diagrams reveals a few individual models which appear to perform better for these indices. For the WSDI index, CNRM-CM5 simulates a trend relatively close to ERA-Interim, showing a slight negative bias, quite different from the positive bias of the ensemble mean. The same is true for the respective comparison with MERRA-2 and Berkeley Earth in Figure A9 and Figure A10 of the Appendix A. Other models with good performance in the simulation of decadal trends are MRI-CGCM3, MIROC-ESM and CCSM4.
A correlation analysis between the models’ grid-box area and the derived biases for all the indices did not reveal any noteworthy association between the model horizontal resolution and the representation of temperature indices. Only for TXx we find a significant correlation (r = 0.55). These results are in line with the global study of Sillmann et al. [27], who also did not find any noticeable effect of model resolution in the biases. Finally, we examined (not shown) if model performance (biases in Figure 13) was linked to the inclusion of aerosol and/or atmospheric chemistry coupling in some of the CMIP5 models, according to Table 9.1 in Flato et al. [60], but no connection was found.

4. Summary and Conclusions

We have analyzed the long-term average and evolution of observed and modeled temperature extremes defined by the ETCCDI for a recent period up to 2018. This was possible by using gridded re-analysis (ERA-Interim and MERRA-2) and station-based (Berkeley Earth) observational datasets and output from 18 CMIP5 models. For the CMIP5 models we combined information from the historical runs (1950–2005) and emission scenario simulations (2006–2018 under RCP 2.6, RCP 4.5 and RCP 8.5) and the statistical analysis of the derived indices focused on the period 1980–2018. It emerged, as expected, that the use of the three scenario runs does not influence the analysis of the CMIP5 data for the period 1980–2018.
Results from MENA climatology maps indicate that the ensemble mean of the CMIP5 models reproducesthe observed patterns of climate extremes well and captures the hottest areas in the western parts of northern Africa and the Gulf region with TXx > 46 °C and TNx > 33 °C. Due to the relatively low horizontal resolution of the models, and the consequent underestimation of topographical texture, some warm biases occur over elevated terrain regions for the absolute value indices. For the 1980–2018 trend, the multi-model mean exhibits less spatial variability and more widespread statistical significance than the observations and indicates a rate of increase of 0.4–0.8 °C/decade for TXx and TNx.
The analysis of the temporal evolution of temperature extremes reveals that the MENA region follows the global trends [2,27,61]. For most indices model trends are in agreement with re-analyses and observations, especially the percentile-based indices, for which CMIP5 models capture the observed temporal variations relatively well, including signals following major volcanic eruptions at the end of the 20th century. The modeled warm days and warm nights (cold days and cold nights) continued to increase (decrease) throughout the second decade of the 21st century, in general agreement with the observations. This confirms that in the MENA region, temperature extremes continue to follow a trend of accelerated warming, regardless of the recent slowdown (the so-called global warming hiatus) in the global mean temperature increase [55,62].
The warmest day (TXx) and warmest night (TNx) indices increase steadily for the last 40 years while the coldest day (TXn) and coldest night (TNn) decrease at a smaller rate, both in CMIP5 and observational data. Our updated analysis shows a persistent negative trend in the number of frost days (FD) in the region. Further analysis of processes that control nighttime minimum temperatures, such as regional circulation changes, cloud cover and soil moisture [61], could shed light on the driving mechanisms. The climatology comparison is best quantified with the box-and-whisker plots, indicating good agreement for the absolute values (within 1–2 °C) and threshold/duration indices between models and observations. The respective trend comparison indicates that for the warmest day (TXx) and warmest night (TNx) indices, the observed trends are about 0.3–0.4 °C/decade while they are 0.1–0.2 °C/decade stronger in the CMIP5 results. The observed trend is smaller for the coldest day (TXn) and night (TNn) but not for CMIP5 which is again strong. This larger positive trend in the heat extremes than the negative trend in the cold extremes, is also calculated for the duration and percentile indices, with variable agreement between the GCMs and the observational data. In the portrait diagrams of biases, the multi-model ensemble mean, and the ensemble median generally outperform individual models, in agreement with previous multi-model studies [27]. Among individual models, the performance is variable for the different indices in the climatology and trend biases, but some overall consistency can be assigned to MRI-CGCM3 and CCSM4.
The additional 13 years after 2005 (the end of the period of the CMIP5 simulations with historical forcings) provide a ”post-historical” record to retrospectively assess the RCP generation projections [63]. The results of the 1980–2018 analysis for most of the indices of temperature extremes point to continued and significant warming in the MENA region broadly in line with the CMIP5 model projections. Follow-up work could include output from the new projections driven by the Shared Socioeconomic Pathways (SSP) scenarios from the CMIP6 model simulations to investigate how temperature extremes are represented, considering that several of the participating models have ECS values higher than any of the CMIP5 models [64]. A complete assessment of the evolution of the ETCCDI indices for the MENA region should also use the data from the CMPI5 dynamical downscaling results over the MENA-CORDEX (COordinated Regional Downscaling EXperiment) domain [20,65,66,67].

Author Contributions

Conceptualization, P.H., A.N., G.Z., J.L.; methodology A.N., G.Z. and P.H.; writing—original draft preparation, A.N.; writing—review and editing, P.H., G.Z. and J.L.; supervision, P.H. All authors have read and agreed to the published version of the manuscript.

Funding

This work was co-funded by the European Regional Development Fund and the Republic of Cyprus through the Research Innovation Foundation CELSIUS Project EXCELLENCE/1216/0039. It was also supported by the EMME-CARE project that has received funding from the European Union’s Horizon 2020 Research and Innovation Program, under grant agreement No. 856612, as well as matching co-funding by the Government of the Republic of Cyprus.

Acknowledgments

We would like to thank the CMIP5 modeling groups that performed simulations and publicly shared their data and the Earth System Grid Federation(ESGF) facilities for hosting them.

Conflicts of Interest

The authors declare no conflict of interest.

Appendix A

Figure A1. Maps of differences for the 1980-2018 climatology of the Warmest Day (TXx) for: CMIP5—ERA-Interim (top left), CMIP5—MERRA-2 (top right), CMIP5—Berkeley Earth (bottom left), ERA-Interim—MERRA-2 ((bottom right).
Atmosphere 11 00813 g0a1
Figure A2. Same as Figure A1 but for the Warmest Night (TNx).
Atmosphere 11 00813 g0a2
Figure A3. Same as Figure A1 but for the Warm Spell Duration (WSDI).
Atmosphere 11 00813 g0a3
Figure A4. Same as Figure A1 but for the Warm Days (TX90p).
Atmosphere 11 00813 g0a4
Figure A5. Maps of differences for the 1980–2018 decadal trend of the Warmest Day (TXx) for: CMIP5—ERA-Interim (top left), CMIP5—MERRA-2 (top right), CMIP5—Berkeley Earth (bottom left), ERA-Interim—MERRA-2 (bottom right).
Atmosphere 11 00813 g0a5
Figure A6. Same as Figure A5 but for the Warmest Night (TNx).
Atmosphere 11 00813 g0a6
Figure A7. Same as Figure A5 but for the Warm Spell Duration (WSDI).
Atmosphere 11 00813 g0a7
Figure A8. Same as Figure A5 but for the Warm Days (TX90p).
Atmosphere 11 00813 g0a8
Figure A9. Portrait diagrams of domain-averaged biases of the 1980–2018 climatology (a) and the average decadal trend (b) of temperature indices simulated by the CMIP5 models with respect to MERRA-2 re-analyses. The biases are spatially averaged over MENA region land grid points.
Atmosphere 11 00813 g0a9
Figure A10. Portrait diagrams of domain-averaged biases of the 1980–2018 climatology (a) and the average decadal trend (b) of temperature indices simulated by the CMIP5 models with respect to Berkeley observational data set. The biases are spatially averaged over MENA region land grid points.
Atmosphere 11 00813 g0a10

References

  1. Allen, M.; Dube, O.; Solecki, W.; Aragón-Durand, F.; Cramer, W.; Humphreys, S.; Kainuma, M.; Kala, J.; Mahowald, N.; Mulugetta, Y.; et al. Chapter 1: Framing and Context. In Global Warming of 1.5 °C; Masson-Delmotte, V., Zhai, P., Pörtner, H.-O., Roberts, D., Skea, J., Shukla, P.R., Pirani, A., Moufouma-Okia, W., Péan, C., Pidcock, R., Eds.; An IPCC Special Report on the Impacts of Global Warming of 1.5 °C above Pre-Industrial Levels and Related Global Greenhouse Gas Emission Pathways, in the Context of Strengthening the Global Response to the Threat of Climate Change, Sustainable Development, and Efforts to Eradicate Poverty; IPCC: Geneva, Switzerland, 2018. [Google Scholar]
  2. Alexander, L.V.; Zhang, X.; Peterson, T.C.; Caesar, J.; Gleason, B.; Klein Tank, A.M.; Haylock, M.; Collins, D.; Trewin, B.; Rahimzadeh, F.; et al. Global observed changes in daily climate extremes of temperature and precipitation. J. Geophys. Res. Atmos. 2006, 111, 1607. [Google Scholar] [CrossRef] [Green Version]
  3. Donat, M.G.; Alexander, L.V.; Yang, H.; Durre, I.; Vose, R.; Dunn, R.J.; Willett, K.M.; Aguilar, E.; Brunet, M.; Caesar, J.; et al. Updated analyses of temperature and precipitation extreme indices since the beginning of the twentieth century: The HadEX2 dataset. J. Geophys. Res. Atmos. 2013, 118, 2098–2118. [Google Scholar] [CrossRef]
  4. Lelieveld, J.; Hadjinicolaou, P.; Kostopoulou, E.; Chenoweth, J.; El Maayar, M.; Giannakopoulos, C.; Hannides, C.; Lange, M.A.; Tanarhte, M.; Tyrlis, E.; et al. Climate change and impacts in the Eastern Mediterranean and the Middle East. Clim. Chang. 2012, 114, 667–687. [Google Scholar] [CrossRef] [PubMed] [Green Version]
  5. Tanarhte, M.; Hadjinicolaou, P.; Lelieveld, J. Intercomparison of temperature and precipitation data sets based on observations in the Mediterranean and the Middle East. J. Geophys. Res. Atmos. 2012, 117. [Google Scholar] [CrossRef]
  6. Almazroui, M.; Hasanean, H.M.; Al-Khalaf, A.K.; Basset, H.A. Detecting climate change signals in Saudi Arabia using mean annual surface air temperatures. Theor. Appl. Climatol. 2013, 113, 585–598. [Google Scholar] [CrossRef]
  7. Zittis, G. Observed rainfall trends and precipitation uncertainty in the vicinity of the Mediterranean, Middle East and North Africa. Theor. Appl. Climatol. 2018, 134, 1207–1230. [Google Scholar] [CrossRef]
  8. Zhang, X.; Aguilar, E.; Sensoy, S.; Melkonyan, H.; Tagiyeva, U.; Ahmed, N.; Kutaladze, N.; Rahimzadeh, F.; Taghipour, A.; Hantosh, T.H.; et al. Trends in Middle East climate extreme indices from 1950 to 2003. J. Geophys. Res. Atmos. 2005, 110. [Google Scholar] [CrossRef]
  9. Donat, M.G.; Peterson, T.C.; Brunet, M.; King, A.D.; Almazroui, M.; Kolli, R.K.; Boucherf, D.; Al-Mulla, A.Y.; Nour, A.Y.; Aly, A.A.; et al. Changes in extreme temperature and precipitation in the Arab region: Long-term trends and variability related to ENSO and NAO. Int. J. Climatol. 2014, 34, 581–592. [Google Scholar] [CrossRef]
  10. Tanarhte, M.; Hadjinicolaou, P.; Lelieveld, J. Heat wave characteristics in the eastern Mediterranean and Middle East using extreme value theory. Clim. Res. 2015, 63, 99–113. [Google Scholar] [CrossRef] [Green Version]
  11. El Kenawy, A.M.; Lopez-Moreno, J.I.; McCabe, M.F.; Robaa, S.M.; Domínguez-Castro, F.; Peña-Gallardo, M.; Trigo, R.M.; Hereher, M.E.; Al-Awadhi, T.; Vicente-Serrano, S.M. Daily temperature extremes over Egypt: Spatial patterns, temporal trends, and driving forces. Atmos. Res. 2019, 226, 219–239. [Google Scholar] [CrossRef]
  12. Almazroui, M.; Islam, M.N.; Dambul, R.; Jones, P.D. Trends of temperature extremes in Saudi Arabia. Int. J. Climatol. 2014, 34, 808–826. [Google Scholar] [CrossRef]
  13. Taylor, K.E.; Stouffer, R.J.; Meehl, G.A. An overview of CMIP5 and the experiment design. Bull. Am. Meteorol. Soc. 2012, 93, 485–498. [Google Scholar] [CrossRef] [Green Version]
  14. Sillmann, J.; Kharin, V.V.; Zwiers, F.W.; Zhang, X.; Bronaugh, D. Climate extremes indices in the CMIP5 multimodel ensemble: Part 2. Future climate projections. J. Geophys. Res. Atmos. 2013, 118, 2473–2493. [Google Scholar] [CrossRef]
  15. Lelieveld, J.; Proestos, Y.; Hadjinicolaou, P.; Tanarhte, M.; Tyrlis, E.; Zittis, G. Strongly increasing heat extremes in the Middle East and North Africa (MENA) in the 21st century. Clim. Chang. 2016, 137, 245–260. [Google Scholar] [CrossRef] [Green Version]
  16. Diffenbaugh, N.S.; Pal, J.S.; Giorgi, F.; Gao, X. Heat stress intensification in the Mediterranean climate change hotspot. Geophys. Res. Lett. 2007, 34, 205. [Google Scholar] [CrossRef] [Green Version]
  17. Lelieveld, J.; Hadjinicolaou, P.; Kostopoulou, E.; Giannakopoulos, C.; Pozzer, A.; Tanarhte, M.; Tyrlis, E. Model projected heat extremes and air pollution in the eastern Mediterranean and Middle East in the twenty-first century. Reg. Environ. Chang. 2014, 14, 1937–1949. [Google Scholar] [CrossRef] [Green Version]
  18. Zittis, G.; Hadjinicolaou, P.; Fnais, M.; Lelieveld, J. Projected changes in heat wave characteristics in the eastern Mediterranean and the Middle East. Reg. Environ. Chang. 2016, 16, 1863–1876. [Google Scholar] [CrossRef]
  19. Pal, J.S.; Eltahir, E.A. Future temperature in southwest Asia projected to exceed a threshold for human adaptability. Nat. Clim. Chang. 2016, 6, 197–200. [Google Scholar] [CrossRef]
  20. Almazroui, M. Climate Extremes over the Arabian Peninsula using RegCM4 for present conditions forced by several CMIP5 models. Atmosphere 2019, 10, 675. [Google Scholar] [CrossRef] [Green Version]
  21. Kovats, R.S.; Hajat, S. Heat stress and public health: A critical review. Annu. Rev. Public Health 2008, 29, 41–55. [Google Scholar] [CrossRef]
  22. Gosling, S.N.; Lowe, J.A.; McGregor, G.R.; Pelling, M.; Malamud, B.D. Associations between elevated atmospheric temperature and human mortality: A critical review of the literature. Clim. Chang. 2009, 92, 299–341. [Google Scholar] [CrossRef]
  23. Dunne, J.P.; Stouffer, R.J.; John, J.G. Reductions in labour capacity from heat stress under climate warming. Nat. Clim. Chang. 2013, 3, 563–566. [Google Scholar] [CrossRef]
  24. Abel, G.J.; Brottrager, M.; Crespo Cuaresma, J.; Muttarak, R. Climate, conflict and forced migration. Glob. Environ. Chang. 2019, 54, 239–249. [Google Scholar] [CrossRef]
  25. Lange, M.A. Impacts of Climate Change on the Eastern Mediterranean and the Middle East and North Africa Region and the Water nergy Nexus. Atmosphere 2019, 10, 455. [Google Scholar] [CrossRef] [Green Version]
  26. Karl, T.R.; Knight, R.W.; Easterling, D.R.; Quayle, R.G. Indices of climate change for the United States. Bull. Am. Meteorol. Soc. 1996, 77, 279–292. [Google Scholar] [CrossRef] [Green Version]
  27. Sillmann, J.; Kharin, V.V.; Zhang, X.; Zwiers, F.W.; Bronaugh, D. Climate extremes indices in the CMIP5 multimodel ensemble: Part 1. Model evaluation in the present climate. J. Geophys. Res. Atmos. 2013, 118, 1716–1733. [Google Scholar] [CrossRef]
  28. van Vuuren, D.P.; Edmonds, J.; Kainuma, M.; Riahi, K.; Thomson, A.; Hibbard, K.; Hurtt, G.C.; Kram, T.; Krey, V.; Lamarque, J.F.; et al. The representative concentration pathways: An overview. Clim. Chang. 2011, 109, 5–31. [Google Scholar] [CrossRef]
  29. Dee, D.P.; Uppala, S.M.; Simmons, A.J.; Berrisford, P.; Poli, P.; Kobayashi, S.; Andrae, U.; Balmaseda, M.A.; Balsamo, G.; Bauer, P.; et al. The ERA-Interim reanalysis: Configuration and performance of the data assimilation system. Q. J. R. Meteorol. Soc. 2011, 137, 553–597. [Google Scholar] [CrossRef]
  30. Molod, A.; Takacs, L.; Suarez, M.; Bacmeister, J. Development of the GEOS-5 atmospheric general circulation model: Evolution from MERRA to MERRA2. Geosci. Model Dev. 2015, 8, 1339–1356. [Google Scholar] [CrossRef] [Green Version]
  31. Rohde, R.; Muller, R.; Jacobsen, R.; Perlmutter, S.; Mosher, S. Berkeley Earth Temperature Averaging Process. Geoinform. Geostat. Overv. 2013, 1, 20–100. [Google Scholar] [CrossRef]
  32. Wu, T.; Song, L.; Li, W.; Wang, Z.; Zhang, H.; Xin, X.; Zhang, Y.; Zhang, L.; Li, J.; Wu, F.; et al. An Overview of BCC Climate System Model Development and application for climate change studies. J. Meteorlog. Res. 2014, 28, 34–56. [Google Scholar] [CrossRef]
  33. Ji, D.; Wang, L.; Feng, J.; Wu, Q.; Cheng, H.; Zhang, Q.; Yang, J.; Dong, W.; Dai, Y.; Gong, D.; et al. Description and basic evaluation of Beijing Normal University Earth System Model (BNU-ESM) version 1. Geosci. Model Dev. 2014, 7, 2039–2064. [Google Scholar] [CrossRef] [Green Version]
  34. Chylek, P.; Li, J.; Dubey, M.K.; Wang, M.; Lesins, G. Observed and model simulated 20th century Arctic temperature variability: Canadian Earth System Model CanESM2. Atmos. Chem. Phys. Discuss. 2011, 11, 22893–22907. [Google Scholar] [CrossRef]
  35. Gent, P.R.; Danabasoglu, G.; Donner, L.J.; Holland, M.M.; Hunke, E.C.; Jayne, S.R.; Lawrence, D.M.; Neale, R.B.; Rasch, P.J.; Vertenstein, M.; et al. The community climate system model version 4. J. Clim. 2011, 24, 4973–4991. [Google Scholar] [CrossRef]
  36. Voldoire, A.; Sanchez-Gomez, E.; Salas y Mélia, D.; Decharme, B.; Cassou, C.; Sénési, S.; Valcke, S.; Beau, I.; Alias, A.; Chevallier, M.; et al. The CNRM-CM5.1 global climate model: Description and basic evaluation. Clim. Dyn. 2013, 40, 2091–2121. [Google Scholar] [CrossRef]
  37. Collier, M.A.; Jeffrey, S.J.; Rotstayn, L.D.; Wong, K.K.H.; Dravitzki, S.M.; Moeseneder, C.; Hamalainen, C.; Syktus, J.I.; Suppiah, R.; Antony, J.; et al. The CSIRO-Mk3.6.0 Atmosphere-Ocean GCM: Participation in CMIP5 and data publication. In Proceedings of the 19th International Congress on Modelling and Simulation (MODSIM2011), Perth, Australia, 12–16 December 2011; pp. 2691–2697. [Google Scholar]
  38. Griffies, S.M.; Winton, M.; Donner, L.J.; Horowitz, L.W.; Downes, S.M.; Farneti, R.; Gnanadesikan, A.; Hurlin, W.J.; Lee, H.C.; Liang, Z.; et al. The GFDL CM3 coupled climate model: Characteristics of the ocean and sea ice simulations. J. Clim. 2011, 24, 3520–3544. [Google Scholar] [CrossRef]
  39. Dunne, J.P.; John, J.G.; Adcroft, A.J.; Griffies, S.M.; Hallberg, R.W.; Shevliakova, E.; Stouffer, R.J.; Cooke, W.; Dunne, K.A.; Harrison, M.J.; et al. GFDL’s ESM2 global coupled climate-carbon earth system models. Part I: Physical formulation and baseline simulation characteristics. J. Clim. 2012, 25, 6646–6665. [Google Scholar] [CrossRef] [Green Version]
  40. Collins, W.; Bellouin, N.; Doutriaux-Boucher, M.; Gedney, N.; Hinton, T.; Jones, C.D.; Liddicoat, S.; Martin, G.; O’Connor, F.; Rae, J.; et al. Evaluation of HadGEM2 Model; Technical Note 74; Meteorological Office Hadley Centre: Exeter, UK, 2008; p. 47. [Google Scholar]
  41. Dufresne, J.L.; Foujols, M.A.; Denvil, S.; Caubel, A.; Marti, O.; Aumont, O.; Balkanski, Y.; Bekki, S.; Bellenger, H.; Benshila, R.; et al. Climate change projections using the IPSL-CM5 Earth System Model: From CMIP3 to CMIP5. Clim. Dyn. 2013, 40, 2123–2165. [Google Scholar] [CrossRef]
  42. Watanabe, M.; Suzuki, T.; O’Ishi, R.; Komuro, Y.; Watanabe, S.; Emori, S.; Takemura, T.; Chikira, M.; Ogura, T.; Sekiguchi, M.; et al. Improved climate simulation by MIROC5: Mean states, variability, and climate sensitivity. J. Clim. 2010, 23, 6312–6335. [Google Scholar] [CrossRef]
  43. Watanabe, S.; Hajima, T.; Sudo, K.; Nagashima, T.; Takemura, T.; Okajima, H.; Nozawa, T.; Kawase, H.; Abe, M.; Yokohata, T.; et al. MIROC-ESM 2010: Model description and basic results of CMIP5-20c3m experiments. Geosci. Model Dev. 2011, 4, 845–872. [Google Scholar] [CrossRef] [Green Version]
  44. Giorgetta, M.A.; Jungclaus, J.; Reick, C.H.; Legutke, S.; Bader, J.; Böttinger, M.; Brovkin, V.; Crueger, T.; Esch, M.; Fieg, K.; et al. Climate and carbon cycle changes from 1850 to 2100 in MPI-ESM simulations for the Coupled Model Intercomparison Project phase 5. J. Adv. Model. Earth Syst. 2013, 5, 572–597. [Google Scholar] [CrossRef]
  45. Yukimoto, S.; Adachi, Y.; Hosaka, M.; Sakami, T.; Yoshimura, H.; Hirabara, M.; Tanaka, T.Y.; Shindo, E.; Tsujino, H.; Deushi, M.; et al. A new global climate model of the Meteorological Research Institute: MRI-CGCM3: -Model description and basic performance-. J. Meteorol. Soc. Jpn. 2012, 90, 23–64. [Google Scholar] [CrossRef] [Green Version]
  46. Gelaro, R.; McCarty, W.; Suárez, M.J.; Todling, R.; Molod, A.; Takacs, L.; Randles, C.A.; Darmenov, A.; Bosilovich, M.G.; Reichle, R.; et al. The modern-era retrospective analysis for research and applications, version 2 (MERRA-2). J. Clim. 2017, 30, 5419–5454. [Google Scholar] [CrossRef]
  47. Courtier, P.; Thépaut, J.; Hollingsworth, A. A strategy for operational implementation of 4D ar, using an incremental approach. Q. J. R. Meteorol. Soc. 1994, 120, 1367–1387. [Google Scholar] [CrossRef]
  48. Klein Tank, A.M.; Zwiers, F.W.; Zhang, X. WMO Guidelines on Extremes Guidelines on Analysis of Extremes in a Changing Climate in Support of Informed Decisions; Climate Data and Monitoring WCDMP-No. 72; World Meteorological Organization: Geneva, Switzerland, 2009; p. 52. [Google Scholar]
  49. Zhang, X.; Alexander, L.; Hegerl, G.C.; Jones, P.; Tank, A.K.; Peterson, T.C.; Trewin, B.; Zwiers, F.W. Indices for monitoring changes in extremes based on daily temperature and precipitation data. Wiley Interdiscip. Rev. Clim. Chang. 2011, 2, 851–870. [Google Scholar] [CrossRef]
  50. Thackeray, C.W.; Fletcher, C.G.; Derksen, C. Diagnosing the impacts of Northern Hemisphere surface albedo biases on simulated climate. J. Clim. 2019, 32, 1777–1795. [Google Scholar] [CrossRef]
  51. Knutti, R.; Sedláček, J. Robustness and uncertainties in the new CMIP5 climate model projections. Nat. Clim. Chang. 2013, 3, 369–373. [Google Scholar] [CrossRef]
  52. Cattiaux, J.; Vautard, R.; Cassou, C.; Yiou, P.; Masson-Delmotte, V.; Codron, F. Winter 2010 in Europe: A cold extreme in a warming climate. Geophys. Res. Lett. 2010, 37, 238. [Google Scholar] [CrossRef] [Green Version]
  53. Zhang, X.; Lu, C.; Guan, Z. Weakened cyclones, intensified anticyclones and recent extreme cold winter weather events in Eurasia. Environ. Res. Lett. 2012, 7, 044044. [Google Scholar] [CrossRef]
  54. Paik, S.; Min, S.K. Assessing the impact of volcanic eruptions on climate extremes using CMIP5 models. J. Clim. 2018, 31, 5333–5349. [Google Scholar] [CrossRef]
  55. Johnson, N.C.; Xie, S.P.; Kosaka, Y.; Li, X. Increasing occurrence of cold and warm extremes during the recent global warming slowdown. Nat. Commun. 2018, 9, 4–6. [Google Scholar] [CrossRef] [PubMed] [Green Version]
  56. Gómez-Navarro, J.J.; Montvez, J.P.; Jerez, S.; Jiménez-Guerrero, P.; Zorita, E. What is the role of the observational dataset in the evaluation and scoring of climate models? Geophys. Res. Lett. 2012, 39, 35. [Google Scholar] [CrossRef] [Green Version]
  57. Cohen, J.L.; Furtado, J.C.; Barlow, M.; Alexeev, V.A.; Cherry, J.E. Asymmetric seasonal temperature trends. Geophys. Res. Lett. 2012, 39, 93. [Google Scholar] [CrossRef]
  58. Almazroui, M.; Nazrul Islam, M.; Athar, H.; Jones, P.D.; Rahman, M.A. Recent climate change in the Arabian Peninsula: Annual rainfall and temperature analysis of Saudi Arabia for 1978–2009. Int. J. Climatol. 2012, 32, 953–966. [Google Scholar] [CrossRef]
  59. McSweeney, C.F.; Jones, R.G.; Lee, R.W.; Rowell, D.P. Selecting CMIP5 GCMs for downscaling over multiple regions. Clim. Dyn. 2015, 44, 3237–3260. [Google Scholar] [CrossRef] [Green Version]
  60. Flato, J.; Marotzke, B.; Abiodun, P.; Braconnot, S.; Chou, W.; Collins, P.; Cox, F.; Driouech, S.; Emori, V.; Eyring, C.; et al. Evaluation of climate models. In Climate Change 2013 the Physical Science Basis: Working Group I Contribution to the Fifth Assessment Report of the Intergovernmental Panel on Climate Change; Cambridge University Press: Cambridge, UK, 2013; Volume 9781107057, pp. 741–866. [Google Scholar] [CrossRef] [Green Version]
  61. Morak, S.; Hegerl, G.C.; Kenyon, J. Detectable regional changes in the number of warm nights. Geophys. Res. Lett. 2011, 38. [Google Scholar] [CrossRef] [Green Version]
  62. Sillmann, J.; Donat, M.G.; Fyfe, J.C.; Zwiers, F.W. Observed and simulated temperature extremes during the recent warming hiatus. Environ. Res. Lett. 2014, 9, 064023. [Google Scholar] [CrossRef]
  63. Hausfather, Z.; Drake, H.F.; Abbott, T.; Schmidt, G.A. Evaluating the Performance of Past Climate Model Projections. Geophys. Res. Lett. 2020, 47, e2019GL085378. [Google Scholar] [CrossRef]
  64. Tokarska, K.B.; Stolpe, M.B.; Sippel, S.; Fischer, E.M.; Smith, C.J.; Lehner, F.; Knutti, R. Past warming trend constrains future warming in CMIP6 models. Sci. Adv. 2020, 6, eaaz9549. [Google Scholar] [CrossRef] [Green Version]
  65. Bucchignani, E.; Mercogliano, P.; Panitz, H.J.; Montesarchio, M. Climate change projections for the Middle East orth Africa domain with COSMO-CLM at different spatial resolutions. Adv. Clim. Chang. Res. 2018, 9, 66–80. [Google Scholar] [CrossRef]
  66. Ozturk, T.; Turp, M.T.; Türke, M.; Kurnaz, M.L. Future projections of temperature and precipitation climatology for CORDEX-MENA domain using RegCM4.4. Atmos. Res. 2018, 206, 87–107. [Google Scholar] [CrossRef]
  67. Zittis, G.; Hadjinicolaou, P.; Klangidou, M.; Proestos, Y.; Lelieveld, J. A multi-model, multi-scenario, and multi-domain analysis of regional climate projections for the Mediterranean. Reg. Environ. Chang. 2019, 19, 2621–2635. [Google Scholar] [CrossRef] [Green Version]
Figure 1. 1980–2018 climatology of the Warmest Day (TXx) for the: CMIP5 multi-model ensemble mean (top left), ERA-Interim (top right), MERRA-2 (bottom left), and Berkeley Earth (bottom right).
Atmosphere 11 00813 g001
Figure 2. 1980–2018 climatology of the Warmest Night (TNx) for the: CMIP5 multi-model ensemble mean (top left), ERA-Interim (top right), MERRA-2 (bottom left), and Berkeley Earth (bottom right).
Atmosphere 11 00813 g002
Figure 3. 1980–2018 climatology of the Warm Spell Duration (WSDI) for the: CMIP5 multi-model ensemble mean (top left), ERA-Interim (top right), MERRA-2 (bottom left), and Berkeley Earth (bottom right).
Atmosphere 11 00813 g003
Figure 4. 1980–2018 climatology of the exceedance rate of Warm Days (TX90p) for the: CMIP5 multi-model ensemble mean (top left), ERA-Interim (top right), MERRA-2 (bottom left), and Berkeley Earth (bottom right).
Atmosphere 11 00813 g004
Figure 5. 1980–2018 decadal trend of the Warmest Day (TXx) for the: CMIP5 multi-model ensemble mean (top left), ERA-Interim (top right), MERRA-2 (bottom left), and Berkeley Earth (bottom right). The hatching represents the statistical significance of the trends at 95% confidence.
Atmosphere 11 00813 g005
Figure 6. 1980–2018 decadal trend of the Warmest Night (TNx) for the: CMIP5 multi-model ensemble mean (top left), ERA-Interim (top right), MERRA-2 (bottom left), and Berkeley Earth (bottom right).
Atmosphere 11 00813 g006
Figure 7. 1980–2018 decadal trend of the Warm Spell Duration (WSDI) for the: CMIP5 multi-model ensemble mean (top left), ERA-Interim (top right), MERRA-2 (bottom left), and Berkeley Earth (bottom right).
Atmosphere 11 00813 g007
Figure 8. 1980–2018 decadal trend of the exceedance rate of Warm Days (TX90p) for the: CMIP5 multi-model ensemble mean (top left), ERA-Interim (top right), MERRA-2 (bottom left), and Berkeley Earth (bottom right).
Atmosphere 11 00813 g008
Figure 9. Annual anomalies (from the reference period 1981–2000—shaded area) of the MENA domain (land only) average of absolute and threshold temperature indices of extremes derived from: (i) CMIP5 ensemble mean (blue: historical, green: RCP 2.6, yellow: RCP 4.5, red: RCP 8.5). The blue shading indicates the inter-quartile model range and the light blue lines represent the maximum and minimum values. (ii) Observational data (black lines, dashed: ERA-Interim, fine dashed: MERRA-2, solid: Berkeley Earth).
Atmosphere 11 00813 g009
Figure 10. Annual timeseries of the MENA domain (land only) average temperature percentile and duration indices of extremes derived from: (i) CMIP5 ensemble mean (blue: historical, green: RCP 2.6, yellow: RCP 4.5, red: RCP 8.5). The blue shading indicates the inter-quartile model range and the light blue lines represent the maximum and minimum values. (ii) Observational data (black lines, dashed: ERA-Interim, fine dashed: MERRA-2, solid: Berkeley Earth).
Atmosphere 11 00813 g010
Figure 11. Box-and-whisker plots of the temperature indices of extremes climatology calculated from the CMIP5 (RCP4.5) 18-model MENA domain averages for 1980–2018. The boxes indicate the inter-quartile range (IQR, between the 25th and 75th percentiles), the bold horizontal bar in the middle of the box is the median and the whiskers indicate the maximum and minimum values from the multi-model sample. The different symbols represent the corresponding climatology for ERA-Interim (red), MERRA-2 (blue) and Berkeley Earth (green). Arranged as absolute (top left), threshold/duration (top right) and percentile (bottom) indices.
Atmosphere 11 00813 g011
Figure 12. Same as Figure 11, but for the decadal trends of temperature indices.
Atmosphere 11 00813 g012
Figure 13. Portrait diagrams of biases of the 1980–2018 climatology (a) and the decadal trend (b) of temperature indices simulated by the CMIP5 models (RCP 4.5) with respect to ERA-Interim re-analyses. The biases are spatially averaged over MENA region land grid cells. The unit of the color bar scale refers to the respective unit of each index.
Atmosphere 11 00813 g013
Table 1. Set of 18 CMIP5 global models with their respective horizontal resolution, Equilibrium Climate Sensitivity (ECS) and Transient Climate Response (TCR) for CO2 doubling.
Modellon (°)lat (°)ECS (°C)TCR (°C)Reference
BCC-CSM1.12.812.792.81.7[32]
BNU-ESM2.812.794.12.6[33]
CanESM22.812.793.72.4[34]
CCSM41.250.942.91.8[35]
CNRM-CM51.41.43.32.1[36]
CSIRO_Mk3.6.01.871.874.11.8[37]
GFDL-CM32.5242[38]
GFDL-ESM2G2.522.41.1[39]
GFDL-ESM2M2.522.41.3[39]
HadGEM2-AO1.871.254.62.4[40]
HadGEM2-ES1.871.254.62.5[40]
IPSL-CM5A-LR3.751.894.12[41]
IPSL_CM5A-MR2.51.264.12[41]
MIROC51.41.42.71.5[42]
MIROC-ESM2.812.794.72.2[43]
MIROC-ESM-CHEM2.812.794.552.2[43]
MPI-ESM-LR1.871.873.62[44]
MRI-CGCM31.121.122.61.6[45]
Table 2. Set of the 12, temperature-based, indices of extremes, recommended by the ETCCDI, used in this study.
LabelIndex NameIndex CategoryDescriptionUnits
TN10pCold nightsPercentileLet TN i j be the daily minimum temperature on day i in period j and let TN i n 10 be the calendar
day 10th percentile centered on a 5 day window. The percentage of days in a year is determined
where TNij < TN i n 10
%
TX10pCold daysPercentileLet TX i j be the daily maximum temperature on day i in period j and let TX i n 10 be the calendar
day 10th percentile centered on a 5 day window. The percentage of days is determined where
TX i j < TX i n 10
%
TN90pWarm nightsPercentileLet TN i j be the daily minimum temperature on day i in period j and let TN i j 90 be the calendar
day 90th percentile centered on a 5 day window. The percentage of days is determined where
TN i j > TN i n 90
%
TX90pWarm daysPercentileLet TX i j be the daily maximum temperature on day i in period j and let TX i n 90 be the calendar
day 90th percentile centered on a 5 day window. The percentage of days is determined where
TX i j > TX i n 90
%
WSDIWarm spell durationThreshold/DurationLet TX i j be the daily maximum temperature on day i in period j and let TX i n 90 be the calendar
day 90th percentile centered on a 5 day window for the base period 1981–2010. Then the number
of days per period is summed where, in intervals of at least 6 consecutive days: TX i j > TX i n 90
days
CSDICold spell durationThreshold/DurationLet TN i j be the daily minimum temperature on day i in period j and let TN i n 10 be the calendar
day 10th percentile centered on a 5 day window for the base period 1981–2010. Then the number
of days per period is summed where, in intervals of at least 6 consecutive days:TN i j < TN i n 10
days
TXxWarmest dayAbsoluteLet TXx be the daily maximum temperature in month k, periodj. The maximum daily
maximum temperature each month is then: TXx k j = max(TXx k j )
°C
TXnColdest dayAbsoluteLet TXn be the daily maximum temperature in month k, periodj. The minimum daily
maximum temperature each month is then: TXn k j = min(TXn k j )
°C
TNxWarmest nightAbsoluteLet TNx be the daily minimum temperature in month k, periodj. The maximum daily
minimum temperature each month is then: TNx k j = max(TNx k j )
°C
TNnColdest nightAbsoluteLet TNn be the daily minimum temperature in month k, periodj. The minimum daily
minimum temperature each month is then: TNn k j = min(TNn k j )
°C
FDFrost daysThreshold/DurationLet TN be the daily minimum temperature on day i in periodj. Count the number of
days where TN i j < 0 °C
days
IDIce daysThreshold/DurationLet TX be the daily maximum temperature on day i in periodj. Count the number of
days where TX i j < 0 °C
days

