Exercise-Induced Hemodynamic Changes in Muscle Tissue: Implication of Muscle Fatigue
by
 , ,
, ,
Qitao Tan
1 ,
,
Yan Wang
1,
Tony Lin-Wei Chen
1,
Duo Wai-Chi Wong
1 ,
,
Fei Yan
1,
Zengyong Li
2 and
Ming Zhang
1,* 1
Department of Biomedical Engineering, The Hong Kong Polytechnic University, Hong Kong, China
2
Beijing Key Laboratory of Rehabilitation Technical Aids for Old-Age Disability, National Research Center for Rehabilitation Technical Aids, Beijing 100176, China
*
Author to whom correspondence should be addressed.
Appl. Sci. 2020, 10(10), 3512; https://doi.org/10.3390/app10103512
Submission received: 30 April 2020
/
Revised: 12 May 2020
/
Accepted: 14 May 2020
/
Published: 19 May 2020
(This article belongs to the Special Issue Applied Biomechanics in Sport, Rehabilitation and Ergonomy)
Abstract
:This research aims to investigate the development of muscle fatigue and the recovery process revealed by tissue oxygenation. The tissue hemodynamics were measured by near-infrared spectroscopy (NIRS) during a 30-min pre-exercise rest, a 40-cycle heel-lift exercise and a 30-min post-exercise recovery. Wavelet transform was used to obtain the normalized wavelet energy in six frequency intervals (I–VI) and inverse wavelet transform was applied to extract exercise-induced oscillations from the hemodynamic signals. During the exercise phase, the contraction-related oscillations in the total hemoglobin signal (ΔtHb) showed a decreasing trend while the fluctuations in the tissue oxygenation index (TOI) displayed an increasing tendency. The mean TOI value was significantly higher (p < 0.001) under recovery (65.04% ± 2.90%) than that under rest (62.35% ± 3.05%). The normalized wavelet energy of the ΔtHb signal in frequency intervals I (p < 0.001), II (p < 0.05), III (p < 0.05) and IV (p < 0.01) significantly increased by 43.4%, 23.6%, 18.4% and 21.6% during the recovery than that during the pre-exercise rest, while the value in interval VI (p < 0.05) significantly decreased by 16.6%. It could be concluded that NIRS-derived hemodynamic signals can provide valuable information related to muscle fatigue and recovery.
1. Introduction
Muscle fatigue is usually defined as a progressive reduction of sustained muscle force or power output induced by muscle contraction [1,2,3]. It is generally accepted that muscle fatigue has two physiological origins: central fatigue, which means the central nervous system fails to activate motoneurons sufficiently, and peripheral (or local) fatigue, which may correspond to changes in excitation–contraction coupling and metabolic factors [4,5]. Parameters obtained from surface electromyography (EMG) can reflect the development of localized muscle fatigue noninvasively. Studies have demonstrated that the mean power frequency of EMG signal decreases significantly and progressively as fatigue develops [6,7]. One disadvantage of EMG is that it only provides neural information of the selected muscle, whereas studies have indicated that metabolic factors, such as exercise-induced metabolite accumulation and declined tissue oxygenation level, play a key role in muscle fatigue [8,9]. Studies have reported that hypoxia or ischemia exacerbated the process of local muscle fatigue and influenced the endurance capacity of locomotor muscles [8,9]. Hence, localized muscle fatigue may be related to tissue oxygenation and associated with metabolic perturbation in muscle tissues.
Near-infrared spectroscopy (NIRS) can measure tissue oxygenation noninvasively by means of the good transparency of human tissues in the near-infrared region of the spectrum [10]. NIRS techniques use near-infrared light to illuminate human tissues and then detect the optical intensity of the emergent light that penetrates through the tissues [10].Compared to EMG, NIRS provides a relatively high spatial resolution and acceptable signal-to-noise ratios during exercise, when movement artifacts are properly taken into consideration [11]. More importantly, this technique could measure tissue oxygenation and detect hemodynamic oscillations in the microcirculatory system, which could be used to investigate metabolic processes during exercise [12]. Due to its ability to continuously record tissue oxygenation, its low cost, and its portability, NIRS has been widely utilized to assess muscle fatigue and performance in sports science and clinical medicine [13,14,15]. According to a recent study, NIRS might be more sensitive to muscle fatigue than EMG, especially at low levels of activity [16]. Several studies have confirmed the ability of NIRS to measure oxygen consumption in exercise muscle tissues, which can reflect muscle oxidative metabolism under different conditions [17,18,19]. The hemodynamic components measured by NIRS mostly come from small vessels including capillaries and arteriolar and venular beds [13]. Thus, these signals could sensitively reflect metabolic activities of the surrounding muscle tissues.
Currently, most of the studies using NIRS to investigate the development of muscle fatigue were conducted by analyzing the hemodynamic signals in the time domain [15,16,20]. Considering that peripheral hemodynamic responses are nonstationary, analysis in the frequency or time–frequency domain may provide additional information that may be useful to comprehensively understand muscle fatigue and the recovery process. Studies have confirmed that blood flow in the peripheral circulation shows a specific frequency characteristic, especially in the low frequency band (0.005–2 Hz), which may contain information related to metabolic responses in local tissues [21,22,23]. Stefanovska and colleagues defined six frequency intervals in the low frequency band (0.005–2 Hz) of the hemodynamic signals, with each interval corresponding to one physiological activity: I: 0.6–2 Hz, cardiac activity; II: 0.145–0.6 Hz, respiratory activity; III: 0.052–0.145 Hz, myogenic activity; IV: 0.021–0.052 Hz, neurogenic activity; V: 0.0095–0.021 Hz, endothelial metabolic activity and VI: 0.005–0.0095 Hz, endothelial activity [24,25,26]. An experiment conducted by Li showed that the frequency characteristics of NIRS-derived signals could be used to explore the fatigue process of lumber muscle during whole-body vibration [21].
The current study aimed to investigate muscle fatigue development and the recovery process by analyzing the hemodynamic responses in the time–frequency domain. The combination of wavelet transform (WT) and inverse WT provides a novel method to extract valuable information from muscle oxygenation signals and exclude irrelevant interferences, especially during exercise. We observed an opposite trend in the magnitude of exercise-induced oscillations obtained from the TOI and ΔtHb signals in exercise phase. In addition, we found enhanced cardiac, respiratory, myogenic and neurogenic activities in the local microvascular system, as well as reduced endothelial response during the recovery process. These findings can help to comprehensively understand peripheral muscle fatigue and post-exercise recovery, especially from a metabolic point of view.
2. Materials and Methods
2.1. Subjects
30 random healthy subjects (13 male and 17 female, athlete exclusive) between 22 and 32 years old (26.2 ± 2.6 years) were recruited from the Hong Kong Polytechnic University to participate in this study. All subjects were right-handed, and none of them suffered from cardiovascular disease, muscle pain or musculoskeletal injuries. Individual information including age, gender, height and weight was recorded before the experiment. According to body mass index (BMI) (20.8 ± 2.2), no subject was obese according to the definition of World Health Organization (BMI ≥ 30) and only 2 subjects were overweight (BMI ≥ 25). Heart rate and blood pressure of each subject were measured using an electronic manometer (OMRON Automatic Blood Pressure Monitor JPN5) before the experiment, and no subject was hypertensive (systolic blood pressure ≥ 140 mm Hg and/or diastolic blood pressure ≥ 90 mm Hg) or hypotensive (systolic blood pressure ≤ 90 mm Hg and/or diastolic blood pressure ≤ 60 mm Hg). The subjects were required to abstain from sports and exercise for at least two days prior to the test to avoid pre-experiment muscle fatigue. Informed consent was obtained from each subject after having the experimental procedure explained. The experimental procedures were approved by the Hong Kong Polytechnic University Human Subjects Ethics Sub-committee (reference number: HSEARS20170327001) and conducted in accordance with ethical standards from the Declaration of Helsinki of 1964 and its later amendments.
2.2. Experimental Protocol
The whole experiment consisted of 3 phases: pre-exercise rest phase, heel-lift exercise phase and post-exercise recovery phase. For the pre- and post-exercise phase, subjects were instructed to sit in a comfortable position and keep still for 30 min. For the exercise phase, subjects were required to: (1) stand on his/her left leg, (2) raise the heel gradually to the maximum height and hold the position for 1 s and then lower the heel until the whole foot touched the ground. To maintain balance, subjects were suggested to hold a supporter using their right hand. Subjects were instructed to perform 40 cycles of the heel rise exercise. Before the exercise, each subject was asked to perform the heel lift three times with the heel raised as high as possible. The average of the three trials was set as the maximum height. Then a vertical line with the length the same as the above-mentioned maximum height was drawn on a white board close to the left foot of the subject which served as a reference to the maximum heel height during the exercise. A verbal reminder would be given to the subject if he or she did not reach the pre-set height level. This protocol is generally accepted in research to simulate lower-limb muscle fatigue during walking [2].
2.3. NIRS Measurement
The tissue oxygenation index (TOI) and the concentration change in total hemoglobin (ΔtHb) in the left gastrocnemius lateralis (GL) muscle were recorded with a tissue saturation monitor (TSAH-200, developed by Tsinghua University, China). Detailed description of the NIRS device could be found elsewhere [27,28]. Before the experiment, the sensor was carefully placed on the belly of gastrocnemius lateralis, perpendicular to the direction of the muscle fibers and fixed with a flexible pad and medical adhesive tape. The location of NIRS sensor was determined by referring to the placement of EMG electrode recommended in the SENIAM project [29]. A light, tight elastic band was used to cover the sensor and surrounding area to avoid influence from ambient light. The sampling rate of the NIRS device was set at 10 Hz.
2.4. Wavelet Transform
Resting-state hemodynamic oscillations contain valuable information related to physiological activities, especially in the time–frequency domain [25,30,31,32]. Generally, the frequency characteristics of hemodynamic signal could be assessed by the Fourier Transform. However, it is difficult for the Fourier Transform to achieve acceptable time and frequency resolutions simultaneously. Therefore, in this study wavelet transform was introduced to conduct signal decomposition and reconstruction.
Continuous wavelet transform (CWT) is an approach that can perform the complex transformation of a signal from the time to the time–frequency domain with adjustable window lengths. By scaling (stretching/compressing) the length of the mother wavelet with scale factor s and translating the scaled wavelet window along the signal with time factor t, CWT could provide acceptable time and frequency resolution for the corresponding frequency component. In this study the Morlet wavelet was selected as the mother wavelet due to its excellent localization in both the time and frequency domain [33]. The definition of wavelet transform is shown as follows:
where Ψ(t) is the wavelet, g(u) is the original time series, and W(s, t) is the complex wavelet coefficient. The absolute value of W represents the amplitude of the time series while the argument reflects phase information [22,23]. Detailed description of wavelet transform used in this study could be found in previous studies [25,27].
The wavelet transform W(s, t) could be seen as a mapping of the original signal onto the time-scale plane. The signal g(u) can be reconstructed from W(s, t) by
where the constant C is determined by the shape of the mother wavelet. The reconstruction is only possible when 0 < C < ∞ which is admissible in this case [25]. This reconstruction of signal from time–scale domain to time domain is called inverse wavelet transform. Thus, the function
can be seen as the energy density of the signal in the time-scale plane, which is often called a scalogram [34].
2.5. Data Analysis
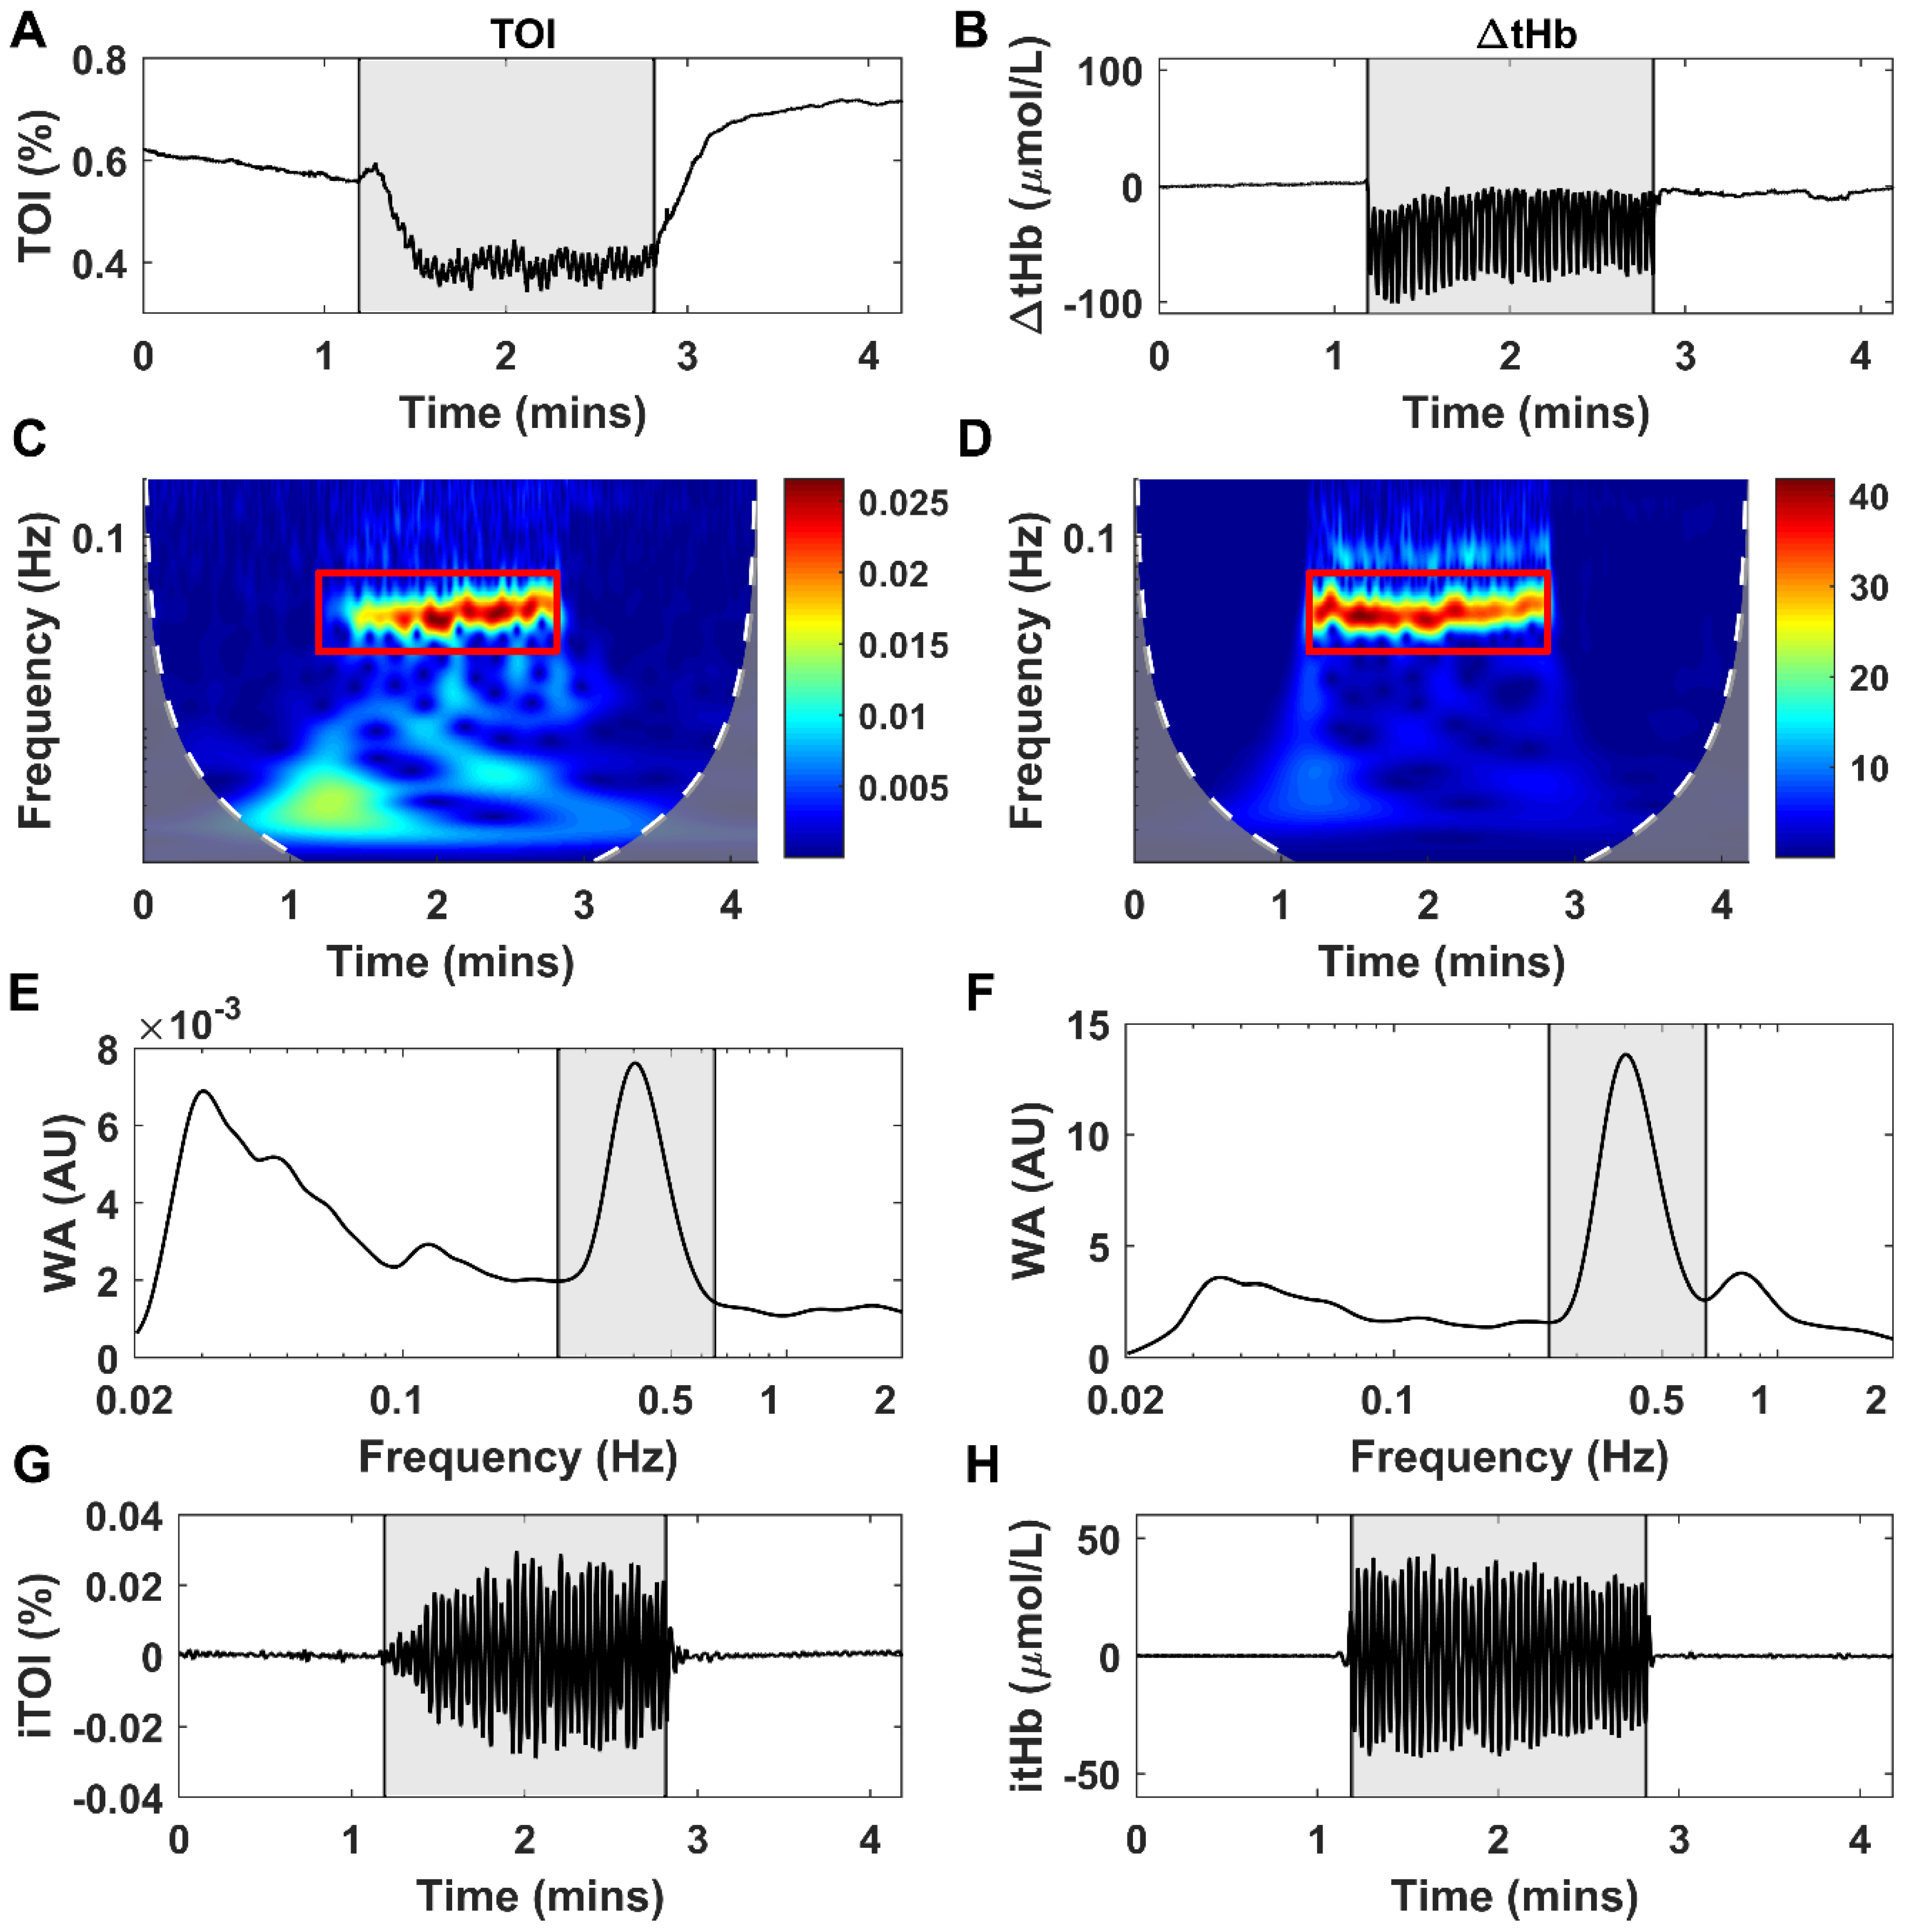
For exercise phase, an 11th-order high-pass Butterworth filter was firstly performed to remove long-period shift in the TOI (Figure 1A) and ΔtHb (Figure 1B) signal. The cutoff frequency was set to be 0.015 Hz. The gray areas in Figure 1A,B show the heel lift period. Secondly, the wavelet transform was applied to acquire the 3-dimensional (3D) wavelet amplitude (WA) in the time–frequency domain (Figure 1C,D), with the red boxes highlighting the oscillations related to muscle contractions. Thirdly, the 3D WA was averaged over the time domain to show the spectral distribution and to extract the hemodynamic components related to muscle contraction (Figure 1E,F). Lastly, iTOI and itHb, the exercise-induced fluctuations in the TOI and ΔtHb signal, were reconstructed through the inverse wavelet transform (Figure 1G,H). The frequency band assigned in the inverse wavelet transform was determined by a 2-step iteration method. Step 1, an approximate frequency was calculated by , where 40 means the total number of heel lifts and Tc means the duration of the exercise. Then, around the frequency F, the adjacent WA peak and the whole peak area were identified as the main frequency components related to the heel lift exercise, as shown by the gray areas in Figure 1E,F. In this study, the inverse wavelet transform was conducted by the icwt function provided by MATLAB Release R2019a version 9.6 (The MathWorks Inc., Natick, MA, USA).
For both rest phases, the TOI signals were averaged over the 30-min measurement to acquire the mean tissue blood oxygenation level before and after the exercise. The ΔtHb signals were preprocessed by an adjusted moving-average method to remove abrupt spikes induced by sudden movement and/or background light. Then a sixth-order Butterworth band-pass filter (0.005–2 Hz) was used to remove irrelevant frequency components and long-term shift (Figure 2A) [27]. Wavelet transform was applied to decompose the ΔtHb time series from the time domain into the time–frequency domain in distinct scales with the frequency band ranging from 0.005 to 2 Hz (Figure 2B). To quantify the oscillation magnitude of different frequency components (Figure 2C), we calculate the mean wavelet amplitude (WA) of each frequency interval defined above by the following equation:
The wavelet amplitude can represent the magnitude of hemodynamic oscillations caused by different physiological activities. To further evaluate the contribution of each physiological origin, the average energy within a given frequency interval was introduced as
and normalized by the total average energy of the whole frequency band of interest (0.005–2 Hz)
2.6. Statistical Analysis
The parameters used in this study were firstly tested for the normality (Shapiro–Wilk test) at the group level to ensure that they fulfilled the assumption required by the statistical analysis. If the parameter followed a normal distribution, the paired t-test would be applied. Otherwise, the Wilcoxon signed-rank test would be used. Paired t-test was used to compare the mean values of TOI and the normalized energy of ΔtHb signals between the pre- and post-exercise phases. The iTOI and itHb signals were divided into two equal parts. The root-mean-square (RMS) values of each half-segment were calculated and compared by the Wilcoxon signed-rank test (Figure 3). Statistical analysis was conducted by the software IBM SPSS Statistics for Windows version 25 (IBM Corp., Armonk, NY, USA). Significant differences are defined as * p < 0.05, ** p < 0.01, and *** p < 0.001.
3. Results
Figure 1G,H show the time series of iTOI and itHb reconstructed from the wavelet coefficients related to the frequency component induced by muscle contraction. The gray areas display the exercise phase. The reconstructed iTOI and itHb time series show different trends during the exercise: the oscillations in iTOI increases as the exercise continues while the magnitude of itHb decreases. We divided the whole exercise phase into two segments with the same length and compared the RMS values of the first and the second segment (Figure 3). Result shows that the median RMS value of the second half of iTOI is significantly larger than that of the first half (p < 0.01), while itHb has an opposite trend—the median RMS of the second half is significantly smaller than the first half (p < 0.05). The decreased itHb value demonstrates a lower contraction level of the GL muscle. Considering the decreasing trend of itHb, the increase of iTOI indicates an increased oxygen consumption which may be related to the development of muscle fatigue.
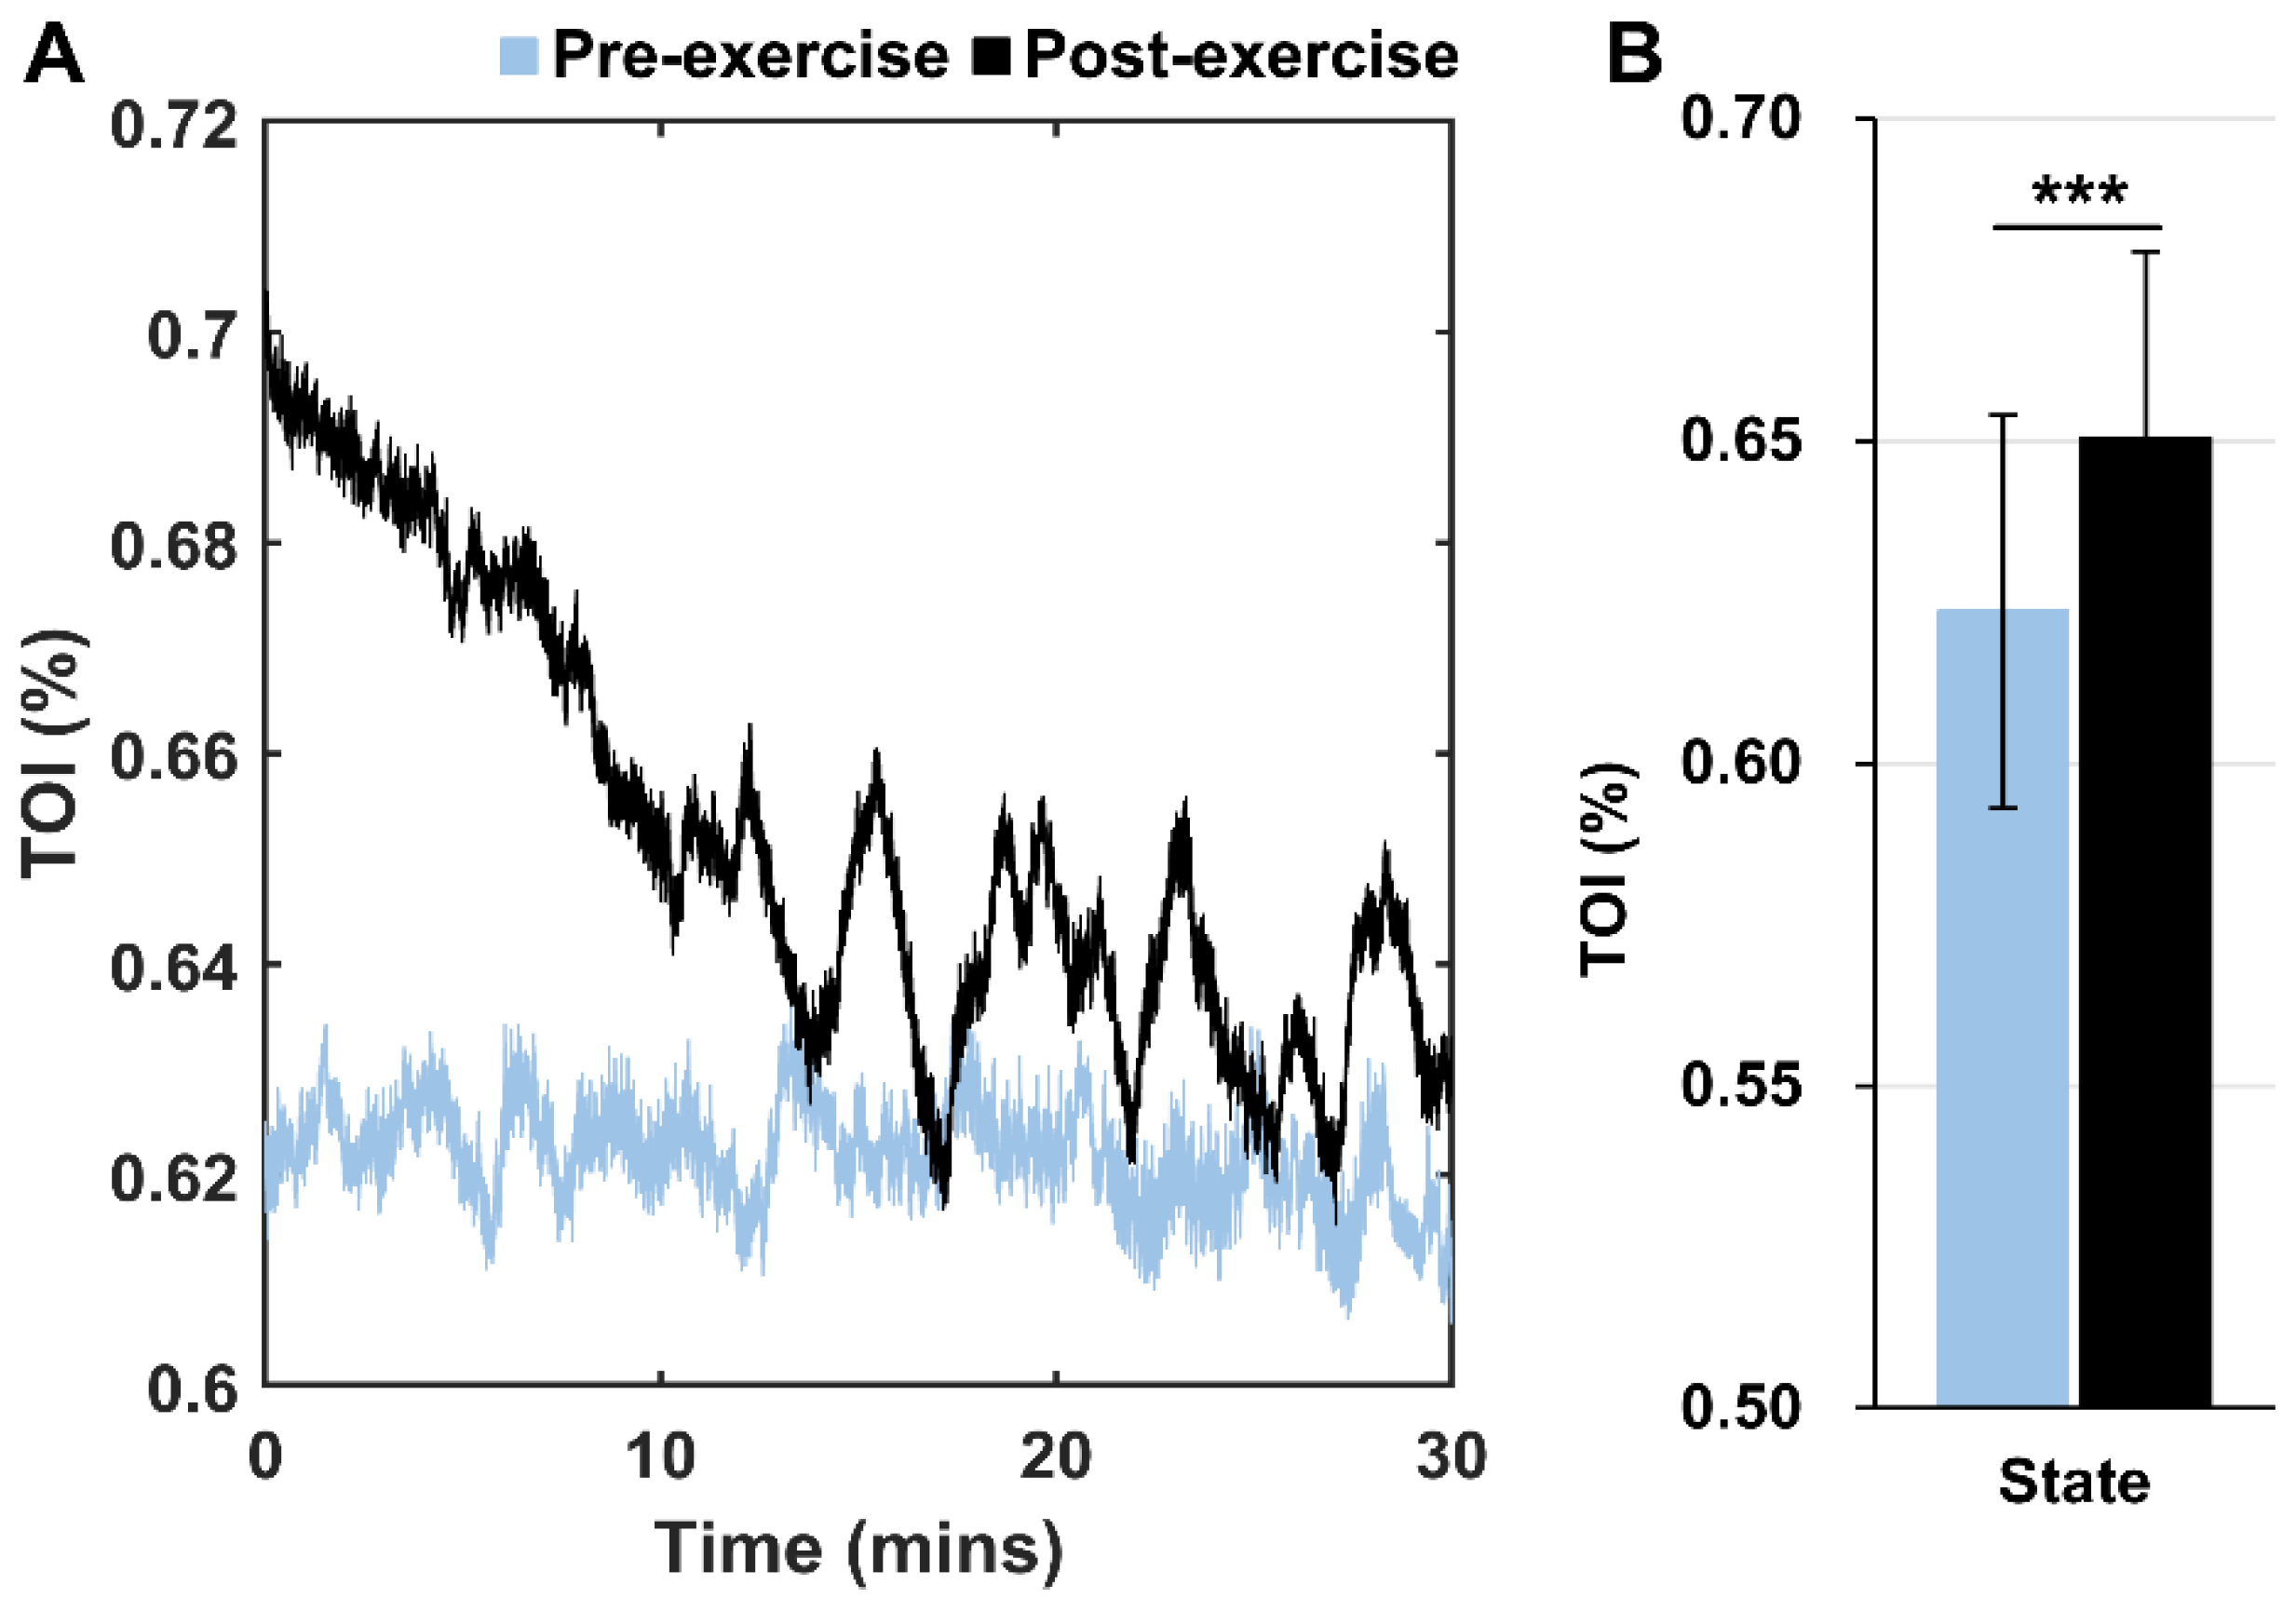
Figure 4 shows an example of TOI signals recorded during the pre- and post-exercise phase, as well as the comparison of their mean values. During the pre-exercise phase, TOI remains relatively stable for the whole measurement period, while for the post-exercise phase TOI shows a decreasing trend. The mean TOI value is significantly higher (p < 0.001) in the post-exercise recovery phase (65.04% ± 2.90%) than that in the pre-exercise rest phase (62.35% ± 3.05%). This result indicates that oxygen supply plays an important role in the recovery process of muscle after exercise.
The comparison of normalized wavelet energy between the pre- and post-exercise rest phases in six frequency intervals are presented in Figure 5 and Table 1. During the post-exercise phase, the normalized wavelet energy values in frequency intervals I (p < 0.001), II (p < 0.05), III (p < 0.05) and IV (p < 0.01) significantly increase by 43.4%, 23.6%, 18.4% and 21.6%, while the value in frequency interval VI (p < 0.05) significantly decrease by 16.6%, compared to that during the pre-exercise phase. The normalized wavelet energy reflects the relative energy contribution of each corresponding physiological activity in the local tissue blood fluctuations. These changes demonstrate modulation of the circulation system in the muscle recovery after exercise.
4. Discussion
In this study, we recorded the NIRS-based hemodynamic responses of left gastrocnemius lateralis muscle in a heel-lift task, including the pre-exercise rest phase, exercise phase and post-exercise recovery phase. Time–frequency analysis with wavelet transform and inverse wavelet transform was applied to the TOI and ΔtHb signals to identify the frequency-specific characteristics associated with the development of muscle fatigue and recovery process under exercise and rest conditions. The contraction-related components in the TOI and ΔtHb variables were extracted as iTOI and itHb by a two-step iteration process. Our results showed that as the exercise continued there was a decreasing trend in the contraction-induced itHb oscillations and an increasing trend in the iTOI fluctuations. For the resting-state signals, we found that the TOI sustained a relatively high level for at least 30 min during the recovery period. Meanwhile, the relative energy contribution obtained from the ΔtHb signal lifted significantly in frequency intervals I, II, III and IV after the exercise, but declined significantly in frequency VI.
The ΔtHb signal, which reflects blood volume changes in local tissue, is highly sensitive to muscle contraction during exercise [13]. The decrease in itHb oscillations may indicate a decline in muscle contraction force, due to the development of muscle fatigue. Hence, the increasing trend of iTOI fluctuations shows an imbalance between oxygen consumption and delivery. This higher oxygen demand may come from the shift from anaerobic type II fibers to aerobic type I muscle fibers. The imbalance between oxygen consumption and supply may contribute to the accumulation of metabolites such as lactate, hydrogen ions and phosphates in local muscle tissue and accelerate the process of peripheral muscle fatigue [3,9]. Results of a previous study showed that the oscillation magnitude in the ΔtHb signal caused by repeated contractions decreased as the exercise continued [13]. However, no study has extracted the specific fluctuations related to muscle contraction from the original hemodynamic signal. The present study reconstructed the iTOI and itHb signals, which presented components mainly induced by muscle contractions, by assigning an exercise-specific frequency range to the inverse wavelet transform. This novel method could exclude irrelevant interferences from the hemodynamic signals and provide a clearer understanding between muscle fatigue development and hemodynamic responses. It has been widely reported that the tissue oxygen saturation will sustain a relative higher level after exercise [11]. Our study also demonstrated that the higher oxygen supply might last for at least 30 min after exercise and may advance the recovery of muscle fibers.
Spontaneous oscillations in blood flow reflect the effects of both vasomotion and flow motion and play a key role in the automatic regulation of the circulatory system, especially in the peripheral tissues [35]. Numerous studies have demonstrated that spontaneous fluctuations in hemodynamic signal can be separated into six frequency components, with each component corresponding to one physiological origin: I: 0.6–2 Hz, cardiac activity; II: 0.145–0.6 Hz, respiration; III: 0.052–0.145 Hz, myogenic activity; IV: 0.021–0.052 Hz, neurogenic activity; V: 0.0095–0.021 Hz, NO-related endothelial metabolic activity and VI: 0.005–0.0095 Hz, endothelial activity [25,26]. This method has been used to investigate lumbar muscle fatigue under whole-body vibration with different vibration frequencies. Results showed that vibration at 4.5 Hz could induce a significant decrease in the wavelet amplitude in frequency intervals I, II and III, which might indicate a reduced efficiency of oxygen supply and contribute to muscle fatigue [21].
The periodic oscillation in frequency intervals I and II reflect the effects of heart beat and respiration on blood flow, which are global influences [25,30]. The pressure difference generated by cardiac activity and respiration between arteries and veins is the fundamental source of the blood flow in the circulatory system [35]. It has been reported that the heart rate and respiration would increase significantly during exercise and recovery periods, which contribute to blood flow and oxygen supply to muscle tissues [36,37]. Increased energy contribution in frequency intervals I and II in post-exercise recovery indicates higher activity intensities in the heart and lungs as a natural reaction to exercise. Enhanced cardiac and respiratory activities have also been reported in a previous study which analyzed cutaneous blood flow after exercise in the frequency domain [30]. Since the cardiac and respiratory responses have global influence on blood flow oscillations, it is reasonable that this phenomenon is found in both skin and muscle tissues. Increases in heart rate and cardiac contractility, as well as rate and depth of respiration, are also responsible for the higher tissue oxygen saturation, which can accelerate the recovery of muscle from fatigue [35].
The fluctuation in frequency interval III (0.052–0.145 Hz) originates from intrinsic myogenic activity of vascular smooth muscles (VSM) [26,38]. Myogenic activity refers to automatic contraction or relaxation of VSM in response to the increased or decreased transmural pressure (the difference between intravascular and extravascular pressure) [39,40]. This mechanism provides a background vasomotor tone against which vasodilators and vasoconstrictors can work to change vessel caliber in response to the increased oxygen consumption associated with exercise [39]. The increase in the normalized spectral amplitude in this interval suggests greater contribution of myogenic activity to the local blood circulation after exercise. The oscillation in frequency band IV (0.052–0.145 Hz) is associated with the neurogenic activity on the vessel wall controlled by sympathetic nerves [26]. It has been confirmed that if the sympathetic nerves in vessels were pharmacologically blocked or denervated (sympathectomy), the waves with frequencies of around one to three events per minute disappeared in blood flow signal [41,42]. Neurogenic activity also plays an important role in the automatic regulation of terminal vascular networks. Sympathetic tone in arteries and arterioles, coupled with myogenic activity, provides a partial constriction state in vasculature, which contributes to maintaining the arterial blood pressure and the steady state of the microvascular system [40]. In this study, the higher relative energy contribution of frequency interval IV might indicate a greater controlling effect from the autonomous nervous system in the recovery period. This enhanced neurogenic regulation may be caused by the accumulation of metabolites in local muscle tissues. Additionally, the oscillation in frequency interval VI (0.005–0.0095 Hz) is considered to reflect the effect of NO-independent endothelial activity. The declined relative energy contribution might be due to the increased activity level of frequency intervals I to IV.
Studies have indicated that low tissue oxygen saturation and the restriction or occlusion of blood flow in local muscle tissues could significantly reduce power output of the selected muscle and accelerate the process of peripheral muscle fatigue [8,9,20,43]. Cyclic muscle contraction consumes a great deal of oxygen and leads to increased concentrations of metabolites including lactate, hydrogen ions and phosphates in local muscle tissue [3,5]. These metabolic factors are generally considered to exaggerate the development of peripheral muscle fatigue by influencing the excitation–contraction process coupling or reducing the excitation of muscle fibers [44]. Reperfusion of blood flow and tissue oxygenation play a key role in the fast recovery of voluntary force over the first few minutes after fatigue [5]. Our study demonstrated that in addition to global adjustment, such as cardiac activity and respiration, local regulation of the microvascular network by enhanced myogenic and neurogenic activities could also promote the blood reperfusion in the microcirculatory system and contribute to the recovery process.
5. Conclusions
The decreased exercise-induced oscillations in the itHb signal and the increased fluctuations in the iTOI signal during continuous heel-lift exercises may be related to the development of peripheral muscle fatigue, indicating declining muscle contraction force and an imbalance between oxygen consumption and delivery. The two opposite trends can be explained by the shift in active GL muscle fibers from the anaerobic type II fibers, which fatigue quickly, to the aerobic type I fibers, which are fatigue resistant. In the recovery phase, higher relative energy contribution from cardiac, respiratory, myogenic and neurogenic activities in the blood volume oscillations reflect the global and regional regulation of the circulatory system in response to the exercise. Enhanced myogenic and neurogenic activities could advance the post-exercise recovery by promoting blood circulation in the microvascular network. In the future the above-mentioned method can be applied to assess muscle fatigue and recovery under physical activities with different intensity levels.
Author Contributions
Conceptualization, Q.T., Y.W. and M.Z.; Methodology, Q.T., F.Y. and Z.L.; Software, Q.T.; Investigation, Q.T., T.L.-W.C. and D.W.-C.W.; Writing-Original Draft Preparation, Q.T. and Y.W.; Writing-Review and Editing, Q.T., Z.L. and M.Z.; Funding Acquisition, Y.W. and M.Z. All authors have read and agreed to the published version of the manuscript.
Funding
This research was funded by the National Natural Science Foundation of China, grant number 11732015, 11972315.
Conflicts of Interest
The authors declare no conflict of interest.
References
- Basmajian, J.; De Luca, C. Muscle Alive: Their Functions Revealed by Electromyography, 5th ed.; Butler, J., Ed.; Williams & Wilkins: Baltimore, MD, USA, 1985. [Google Scholar]
- Gefen, A.; Megido-Ravid, M.; Itzchak, Y.; Arcan, M. Analysis of muscular fatigue and foot stability during high-heeled gait. Gait Posture 2002, 15, 56–63. [Google Scholar] [CrossRef]
- Allen, D.G.; Lamb, G.D.; Westerblad, H. Skeletal muscle fatigue: Cellular mechanisms. Physiol. Rev. 2008, 88, 287–332. [Google Scholar] [CrossRef] [PubMed] [Green Version]
- Gandevia, S.C. Spinal and supraspinal factors in human muscle fatigue. Physiol. Rev. 2001, 81, 1725–1789. [Google Scholar] [CrossRef] [PubMed]
- Carroll, T.J.; Taylor, J.L.; Gandevia, S.C. Recovery of central and peripheral neuromuscular fatigue after exercise. J. Appl. Physiol. 2017, 122, 1068–1076. [Google Scholar] [CrossRef] [PubMed] [Green Version]
- Lindstrom, L.; Kadefors, R.; Petersen, I. An electromyographic index for localized muscle fatigue. J. Appl. Physiol. 1977, 43, 750–754. [Google Scholar] [CrossRef] [PubMed]
- Yoshitake, Y.; Ue, H.; Miyazaki, M.; Moritani, T. Assessment of lower-back muscle fatigue using electromyography, mechanomyography, and near-infrared spectroscopy. Eur. J. Appl. Physiol. 2001, 84, 174–179. [Google Scholar] [CrossRef]
- Romer, L.M.; Haverkamp, H.C.; Amann, M.; Lovering, A.T.; Pegelow, D.F.; Dempsey, J.A. Effect of acute severe hypoxia on peripheral fatigue and endurance capacity in healthy humans. Am. J. Physiol. Regul. Integr. Comp. Physiol. 2007, 292, R598–R606. [Google Scholar] [CrossRef] [Green Version]
- Murthy, G.; Hargens, A.R.; Lehman, S.; Rempel, D.M. Ischemia causes muscle fatigue. J. Orthop. Res. 2001, 19, 436–440. [Google Scholar] [CrossRef]
- Jobsis, F.F. Noninvasive, infrared monitoring of cerebral and myocardial oxygen sufficiency and circulatory parameters. Science 1977, 198, 1264–1267. [Google Scholar] [CrossRef] [PubMed]
- Ferrari, M.; Muthalib, M.; Quaresima, V. The use of near-infrared spectroscopy in understanding skeletal muscle physiology: Recent developments. Philos. Trans. R. Soc. A 2011, 369, 4577–4590. [Google Scholar] [CrossRef]
- Hamaoka, T.; McCully, K.K.; Niwayama, M.; Chance, B. The use of muscle near-infrared spectroscopy in sport, health and medical sciences: Recent developments. Philos. Trans. R. Soc. A 2011, 369, 4591–4604. [Google Scholar] [CrossRef] [PubMed] [Green Version]
- Felici, F.; Quaresima, V.; Fattorini, L.; Sbriccoli, P.; Filligoi, G.C.; Ferrari, M. Biceps brachii myoelectric and oxygenation changes during static and sinusoidal isometric exercises. J. Electromyogr. Kinesiol. 2009, 19, E1–E11. [Google Scholar] [CrossRef]
- Katayama, K.; Yoshitake, Y.; Watanabe, K.; Akima, H.; Ishida, K. Muscle Deoxygenation during Sustained and Intermittent Isometric Exercise in Hypoxia. Med. Sci. Sports Exerc. 2010, 42, 1269–1278. [Google Scholar] [CrossRef] [PubMed]
- Smith, K.J.; Billaut, F. Influence of cerebral and muscle oxygenation on repeated-sprint ability. Eur. J. Appl. Physiol. 2010, 109, 989–999. [Google Scholar] [CrossRef] [PubMed]
- Ferguson, S.A.; Allread, W.G.; Le, P.; Rose, J.; Marras, W.S. Shoulder Muscle Fatigue During Repetitive Tasks as Measured by Electromyography and Near-Infrared Spectroscopy. Hum. Factors 2013, 55, 1077–1087. [Google Scholar] [CrossRef] [Green Version]
- Paternoster, F.; Hahn, D.; Stöcker, F.; Schwirtz, A.; Seiberl, W. Oxygen consumption of gastrocnemius medialis muscle during submaximal voluntary isometric contractions with and without preceding stretch. Sci. Rep. 2017, 7, 1–10. [Google Scholar] [CrossRef] [PubMed]
- Hettinga, F.J.; Konings, M.J.; Cooper, C.E. Differences in muscle oxygenation, perceived fatigue and recovery between long-track and short-track speed skating. Front. Physiol. 2016, 7, 619. [Google Scholar] [CrossRef] [PubMed] [Green Version]
- Jones, S.; Chiesa, S.T.; Chaturvedi, N.; Hughes, A.D. Recent developments in near-infrared spectroscopy (NIRS) for the assessment of local skeletal muscle microvascular function and capacity to utilise oxygen. Artery Res. 2016, 16, 25–33. [Google Scholar] [CrossRef] [PubMed] [Green Version]
- Broxterman, R.M.; Ade, C.J.; Craig, J.C.; Wilcox, S.L.; Schlup, S.J.; Barstow, T.J. Influence of blood flow occlusion on muscle oxygenation characteristics and the parameters of the power-duration relationship. J. Appl. Physiol. 2015, 118, 880–889. [Google Scholar] [CrossRef] [PubMed] [Green Version]
- Li, Z.Y.; Zhang, M.; Chen, G.Q.; Luo, S.T.; Liu, F.F.; Li, J.P. Wavelet analysis of lumbar muscle oxygenation signals during whole-body vibration: Implications for the development of localized muscle fatigue. Eur. J. Appl. Physiol. 2012, 112, 3109–3117. [Google Scholar] [CrossRef] [PubMed]
- Bernjak, A.; Stefanovska, A.; McClintock, P.V.E.; Owen-Lynch, P.J.; Clarkson, P.B.M. Coherence between fluctuations in blood flow and oxygen saturation. Fluct. Noise Lett. 2012, 11. [Google Scholar] [CrossRef] [Green Version]
- Sheppard, L.; Stefanovska, A.; McClintock, P. Testing for time-localized coherence in bivariate data. Phys. Rev. E 2012, 85, 046205. [Google Scholar] [CrossRef] [PubMed] [Green Version]
- Stefanovska, A.; Krošelj, P. Correlation integral and frequency analysis of cardiovascular functions. Open Syst. Inf. Dyn. 1997, 4, 457–478. [Google Scholar] [CrossRef]
- Stefanovska, A.; Bracic, M.; Kvernmo, H.D. Wavelet analysis of oscillations in the peripheral blood circulation measured by laser Doppler technique. IEEE Trans. Biomed. Eng. 1999, 46, 1230–1239. [Google Scholar] [CrossRef]
- Shiogai, Y.; Stefanovska, A.; McClintock, P.V.E. Nonlinear dynamics of cardiovascular ageing. Phys. Rep. Rev. Sect. Phys. Lett. 2010, 488, 51–110. [Google Scholar] [CrossRef] [PubMed] [Green Version]
- Tan, Q.; Zhang, M.; Wang, Y.; Zhang, M.; Wang, Y.; Xin, Q.; Wang, B.; Li, Z. Frequency-specific functional connectivity revealed by wavelet-based coherence analysis in elderly subjects with cerebral infarction using NIRS method. Med. Phys. 2015, 42, 5391–5403. [Google Scholar] [CrossRef]
- Bu, L.G.; Zhang, M.; Li, J.F.; Li, F.Y.; Liu, H.S.; Li, Z.Y. Effects of Sleep Deprivation on Phase Synchronization as Assessed by Wavelet Phase Coherence Analysis of Prefrontal Tissue Oxyhemoglobin Signals. PLoS ONE 2017, 12, 20. [Google Scholar] [CrossRef] [Green Version]
- Park, J.H.; Chun, M.H.; Ahn, J.S.; Yu, J.Y.; Kang, S.H. Comparison of gait analysis between anterior and posterior ankle foot orthosis in hemiplegic patients. Am. J. Phys. Med. Rehabil. 2009, 88, 630–634. [Google Scholar] [CrossRef]
- Kvernmo, H.D.; Stefanovska, A.; Bracic, M.; Kirkebøen, K.A.; Kvernebo, K. Spectral analysis of the laser Doppler perfusion signal in human skin before and after exercise. Microvasc. Res. 1998, 56, 173–182. [Google Scholar] [CrossRef]
- Clemson, P.T.; Stefanovska, A. Discerning non-autonomous dynamics. Phys. Rep. 2014, 542, 297–368. [Google Scholar] [CrossRef] [Green Version]
- Tan, Q.; Zhang, M.; Wang, Y.; Zhang, M.; Wang, B.; Xin, Q.; Li, Z. Age-related alterations in phase synchronization of oxyhemoglobin concentration changes in prefrontal tissues as measured by near-infrared spectroscopy signals. Microvasc. Res. 2016, 103, 19–25. [Google Scholar] [CrossRef] [PubMed]
- Kvandal, P.; Landsverk, S.A.; Bernjak, A.; Stefanovska, A.; Kvernmo, H.D.; Kirkebøen, K.A. Low-frequency oscillations of the laser Doppler perfusion signal in human skin. Microvasc. Res. 2006, 72, 120–127. [Google Scholar] [CrossRef] [PubMed]
- Kaiser, G. A Friendly Guide to Wavelets; Springer Science & Business Media: Berlin, Germany, 2010. [Google Scholar]
- Soderstrom, T.; Stefanovska, A.; Veber, M.; Svensson, H. Involvement of sympathetic nerve activity in skin blood flow oscillations in humans. Am. J. Physiol. Heart Circ. Physiol. 2003, 284, H1638–H1646. [Google Scholar] [CrossRef] [PubMed]
- Innes, J.A.; Solarte, I.; Huszczuk, A.; Yeh, E.; Whipp, B.J.; Wasserman, K. Respiration during recovery from exercise—Effects of trapping and release of femoral blood-flow. J. Appl. Physiol. 1989, 67, 2608–2613. [Google Scholar] [CrossRef] [PubMed]
- Seiler, S.; Haugen, O.; Kuffel, E. Autonomic recovery after exercise in trained athletes: Intensity and duration effects. Med. Sci. Sports Exerc. 2007, 39, 1366–1373. [Google Scholar] [CrossRef] [PubMed] [Green Version]
- Rowley, A.B.; Payne, S.J.; Tachtsidis, I.; Ebden, M.J.; Whiteley, J.P.; Gavaghan, D.J.; Tarassenko, L.; Smith, M.; Elwell, C.E.; Delpy, D.T. Synchronization between arterial blood pressure and cerebral oxyhaemoglobin concentration investigated by wavelet cross-correlation. Physiol. Meas. 2007, 28, 161–173. [Google Scholar] [CrossRef] [Green Version]
- Zhang, C.; Rogers, P.A.; Merkus, D.; Muller-Delp, J.M.; Tiefenbacher, C.P.; Potter, B.; Knudson, J.D.; Rocic, P.; Chilian, W.M. Regulation of coronary microvascular resistance in health and disease. In Microcirculation; Elsevier: Amsterdam, The Netherlands, 2008; pp. 521–549. [Google Scholar]
- Korthuis, R.J. Skeletal muscle circulation. In Colloquium Series on Integrated Systems Physiology: From Molecule to Function; Morgan & Claypool Life Sciences: San Rafael, CA, USA, 2011; pp. 1–144. Available online: https://www.ncbi.nlm.nih.gov/books/NBK57141/#_ncbi_dlg_cpyrght_NBK57141 (accessed on 22 April 2020).
- Kastrup, J.; Bulow, J.; Lassen, N.A. Vasomotion in human-skin before and after local heating recorded with laser Doppler flowmetry—A method for induction of vasomotion. Int. J. Microcirc. Clin. Exp. 1989, 8, 205–215. [Google Scholar]
- Schmidt, J.A.; Intaglietta, M.; Borgstrom, P. Periodic hemodynamics in skeletal-muscle during local arterial-pressure reduction. J. Appl. Physiol. 1992, 73, 1077–1083. [Google Scholar] [CrossRef]
- Broxterman, R.; Craig, J.; Smith, J.; Wilcox, S.; Jia, C.; Warren, S.; Barstow, T. Influence of blood flow occlusion on the development of peripheral and central fatigue during small muscle mass handgrip exercise. J. Physiol. 2015, 593, 4043–4054. [Google Scholar] [CrossRef] [Green Version]
- Fitts, R.H. Cellular Mechanisms of Muscle Fatigue. Physiol. Rev. 1994, 74, 49–94. [Google Scholar] [CrossRef]
Figure 1.
Hemodynamic oscillations induced by muscle contraction in tissue oxygenation index (TOI) (A) and total hemoglobin signal (ΔtHb) (B) signal with the gray box showing the exercise phase. Scalograms of TOI (C) and ΔtHb (D) signal after wavelet transform, with the red box showing the contraction-induced component in the corresponding signal. Time-averaged wavelet amplitudes of TOI (E) and ΔtHb (F) signal, with the gray box showing the frequency component related to contraction. Inverse wavelet transform of contraction-related frequency component in TOI (G) and ΔtHb (H) signal, with the gray box showing the exercise phase.

Figure 2.
(A) One ΔtHb signal recorded during a 30-min rest phase and filtered by 6th-order Butterworth filter. (B) The wavelet amplitude of the same ΔtHb signal in time-frequency domain. (C) The time-averaged wavelet amplitude of the same signal with the frequency band divided into 6 frequency intervals: I: 0.6–2 Hz, cardiac activity; II: 0.145–0.6 Hz, respiration; III: 0.052–0.145 Hz, myogenic activity; IV: 0.021–0.052 Hz, neurogenic activity; V: 0.0095–0.021 Hz, endothelial-related metabolic activity and VI: 0.005–0.0095 Hz, endothelial activity.

Figure 3.
Comparison of the root-mean-square (RMS) values between the first half and the second half of the exercise phase of the TOI (A) and ΔtHb (B) signal. Statistical significance: * p < 0.05, ** p < 0.01.
Figure 3.
Comparison of the root-mean-square (RMS) values between the first half and the second half of the exercise phase of the TOI (A) and ΔtHb (B) signal. Statistical significance: * p < 0.05, ** p < 0.01.

Figure 4.
(A) Original TOI signals measured during the 30-min pre-exercise (gray line) and post-exercise (black line) rest phase. (B) Comparison of mean TOI values between pre-exercise (gray bar) and post-exercise (black bar) rest phase. Statistical significance: *** p < 0.001.
Figure 4.
(A) Original TOI signals measured during the 30-min pre-exercise (gray line) and post-exercise (black line) rest phase. (B) Comparison of mean TOI values between pre-exercise (gray bar) and post-exercise (black bar) rest phase. Statistical significance: *** p < 0.001.

Figure 5.
Comparison of normalized energy in 6 frequency intervals between the pre-exercise (gray bar) and post-exercise (black bar) rest phase. Statistical significance: * p < 0.05, ** p < 0.01, *** p < 0.001.
Figure 5.
Comparison of normalized energy in 6 frequency intervals between the pre-exercise (gray bar) and post-exercise (black bar) rest phase. Statistical significance: * p < 0.05, ** p < 0.01, *** p < 0.001.


Table 1.
Normalized wavelet energy in the 6 frequency intervals.
| Frequency Intervals | Pre-Exercise | Post-Exercise | Increment |
|---|---|---|---|
| I | 0.018 ± 0.011 | 0.026 ± 0.011 | 43.5% *** |
| II | 0.052 ± 0.032 | 0.064 ± 0.036 | 23.6% * |
| III | 0.098 ± 0.052 | 0.116 ± 0.053 | 18.4% * |
| IV | 0.204 ± 0.107 | 0.248 ± 0.122 | 21.6% ** |
| V | 0.277 ± 0.080 | 0.253 ± 0.071 | −8.5% |
| VI | 0.352 ± 0.124 | 0.294 ± 0.127 | −16.6% * |
Data are shown in a form of mean ± standard deviation (SD). Statistical significance: * p < 0.05, ** p < 0.01, *** p < 0.001.
© 2020 by the authors. Licensee MDPI, Basel, Switzerland. This article is an open access article distributed under the terms and conditions of the Creative Commons Attribution (CC BY) license (http://creativecommons.org/licenses/by/4.0/).
Share and Cite
MDPI and ACS Style
Tan, Q.; Wang, Y.; Chen, T.L.-W.; Wong, D.W.-C.; Yan, F.; Li, Z.; Zhang, M. Exercise-Induced Hemodynamic Changes in Muscle Tissue: Implication of Muscle Fatigue. Appl. Sci. 2020, 10, 3512. https://doi.org/10.3390/app10103512
AMA Style
Tan Q, Wang Y, Chen TL-W, Wong DW-C, Yan F, Li Z, Zhang M. Exercise-Induced Hemodynamic Changes in Muscle Tissue: Implication of Muscle Fatigue. Applied Sciences. 2020; 10(10):3512. https://doi.org/10.3390/app10103512
Chicago/Turabian StyleTan, Qitao, Yan Wang, Tony Lin-Wei Chen, Duo Wai-Chi Wong, Fei Yan, Zengyong Li, and Ming Zhang. 2020. "Exercise-Induced Hemodynamic Changes in Muscle Tissue: Implication of Muscle Fatigue" Applied Sciences 10, no. 10: 3512. https://doi.org/10.3390/app10103512
Note that from the first issue of 2016, this journal uses article numbers instead of page numbers. See further details here.