Article

Optogenetic Stimulation of Human Neural Networks Using Fast Ferroelectric Spatial Light Modulator—Based Holographic Illumination

by
Felix Schmieder
1,*,
Simon D. Klapper
2,
Nektarios Koukourakis
1,
Volker Busskamp
2 and
Jürgen W. Czarske
1
1
Faculty of Electrical and Computer Engineering, Laboratory of Measurement and Sensor System Technique, Technische Universität Dresden, Helmholtzstr. 18, 01069 Dresden, Germany
2
Center for Regenerative Therapies Dresden (CRTD), Cluster of Excellence at TU Dresden, Fetscherstraße 105, 01307 Dresden, Germany
*
Author to whom correspondence should be addressed.
Appl. Sci. 2018, 8(7), 1180; https://doi.org/10.3390/app8071180
Submission received: 22 June 2018 / Revised: 16 July 2018 / Accepted: 17 July 2018 / Published: 19 July 2018
(This article belongs to the Special Issue Applications of Digital Holographic Microscopy)

Abstract

:
The generation and application of human stem-cell-derived functional neural circuits promises novel insights into neurodegenerative diseases. These networks are often studied using stem-cell derived random neural networks in vitro, with electrical stimulation and recording using multielectrode arrays. However, the impulse response function of networks is best obtained with spatiotemporally well-defined stimuli, which electrical stimulation does not provide. Optogenetics allows for the functional control of genetically altered cells with light stimuli at high spatiotemporal resolution. Current optogenetic investigations of neural networks are often conducted using full field illumination, potentially masking important functional information. This can be avoided using holographically shaped illumination. In this article, we present a digital holographic illumination setup with a spatial resolution of about 8 µm, which suffices for the stimulation of single neurons, and offers a temporal resolution of less than 0.6 ms. With this setup, we present preliminary single-cell stimulation recording of stem-cell derived induced human neurons in a random neural network. This will offer the opportunity for further studies on connectivity in such networks.

1. Introduction

Based on powerful imaging techniques, such as functional magnetic resonance imaging, brain research has made great progress in recent years [1,2,3,4,5,6,7]. The analysis of combined neural networks, however, is still a major challenge due to their complexity and interconnectivity. Since insights that are gained in animal models cannot fully be transferred to humans [8], it is of great interest to perform studies directly in human neural networks. As of today, such networks can either be obtained in the form of slices as operation byproducts [9] or be cultured from human stem cells [10,11]. The aim of our work presented in this paper is to provide a stimulation setup for the investigation of neural networks derived from human induced pluripotent stem cells that are tagged with optogenetic tools [12]. A common way for observing neural network activity with high temporal resolution is by recording the electrical activity by either whole-cell patch-clamp [13,14] or extracellular electrical recording [15] techniques using multi-electrode arrays. Data on, e.g., signal transport in neural networks, can be more easily obtained by exciting neurons directly. Both patch-clamp and extracellular electrodes can provide electrical stimulation and consecutive recording. However, stimulation-wise they either are limited to small cell samples or stimulate an unknown number of neurons simultaneously. Both patch-clamp and extracellular recording can partially overcome their limitations with the help of optogenetics.
Optogenetics is a set of methods enabling control of the electrical activity of cells using light. The light sensitivity is provided by light-gated ion channels in the cell membrane, for example Channelrhodopsin-2 (ChR2) [16], which originate from green algae. These optogenetic tools are DNA-encoded and can be transduced to well-defined sets of target cells, which then express the ion channels and thus become light-sensitive. This allows for the temporally and spatially highly specific excitation of neurons and other cells either by genetically modifying specific cell types or by using focal light sources for targeted activation. Thus, optogenetic interventions not only resulted in novel medical applications like retina [17] or cochlea [18] resensitization, but also for the investigation of basic neural network functions, like signal processing and memory formation.
Insights into neural network functions can mainly be gained by analyzing the kind of connections present and their meaning for certain tasks of the network as well as their temporal evolution. The most meaningful network analyses are obtained by providing a spatially and temporally well-defined input to the network and observing the network response. In the case of neural networks, the most well-defined input is the independent activation of single cells.
For optimal single-cell optogenetic activation, several traits of neurons have to be taken into account. First the neuronal cell size. From general cell-size measurements, the average cell body size can be estimated to about 10 µm [19]. Therefore, since the cell density in a cultured random neural network can be very high, the minimal focus of an optical system for activating these cells should at most be of this size. Second is the nature of neurons as all-or-nothing switches. This means that a single neuron fires an electrical signal if the sum of all of its inputs rises over an individual threshold. Since one neuron can have connections to many others, the ability to simultaneously stimulate several neurons can be key in investigating their connections. Since neurons fire electrical signals with lengths that are in the millisecond range, temporal control over the stimulation process has to be ensured in the millisecond range as well.
As a conclusion, there are several illumination parameters the ideal setup should have for probing neuronal connections: First, achieving single cell resolution. Second, simultaneously illuminating multiple locations in an area or volume. Third, it should be possible to set time delays between illuminating single locations millisecond temporal resolution.
The first requirement can be easily achieved by an illumination setup with steering mirror galvanometers or acousto-optic deflectors. These have been used for activating cardiomyocytes [20] or for two-photon excitation and imaging of neural networks [21,22,23]. Although these systems are capable of line scan velocities in the kilohertz range, they cannot truly generate multiple spots simultaneously. Some cells may be stimulated quasi-simultaneously by quickly switching between cells, however, the number is limited to a few by the opening time of the used ion channel [24].
Truly simultaneous stimulation is possible by actively shaping the illumination beam using spatial light modulators (SLM). Spatial light modulators are actively controllable pixelated devices that allow for the manipulation of light phase and/or intensity. Common spatial light modulators are e.g., digital micromirror devices (DMD), which are capable of binary amplitude modulation using millions of switchable mirrors or liquid crystal on silicon (LCoS) devices, which allow for a manipulation of the light phase using millions of liquid crystal cells. One SLM-based technique, which fulfills all points to an extent is generalized phase contrast (GPC). It is an extension of Zernike’s phase contrast microscopy and utilizes a phase-only SLM as well as a stationary phase mask to display speckle-free two-dimensional intensity distributions [25,26]. Extending this with holographic beam shaping will also enable cell stimulation in a volume [27]. When investigating a larger field of view, the instrumental effort of GPC is not necessary and the popular approach of holographic illumination can be applied. Here, an SLM displays computer-generated phase holograms. Optical reconstruction of this hologram with a coherent light source will then lead to the desired illumination pattern. Using this approach, all of the abovementioned requirements can be addressed in a volume and theoretically even through scattering media [28,29]. In optogenetics, holographic illumination has mainly been used in conjunction with two-photon stimulation for the excitation of neurons in deep tissue, like mouse brains, but mostly using SLMs with only tens of frames per second [30,31]. Also, fast ferroelectric SLMs were used in the past for the stimulation of blinded mouse retinas [32], albeit using the inherent modulation speed only for speckle reduction with shift-averaged holograms. A review of optical techniques for optogenetics can be found in [24].
In this paper, we present a setup that integrates the possibilities of extracellular electrical recording and fast holographic optogenetic cell stimulation for neural network analyses using a ferroelectric liquid crystal on silicon spatial light modulator. Optically, we obtain a minimal focus width of 8.4 µm and a minimal temporal resolution of less than 0.6 ms based on the frame rate of our SLM in a field of view of 1.5 × 1.5 mm2.
We show optogenetic single-cell excitation of action potentials in a neural network comprising neurons that are derived from human induced pluripotent stem cells, using this setup as a pathway to a deeper understanding of such neural networks.

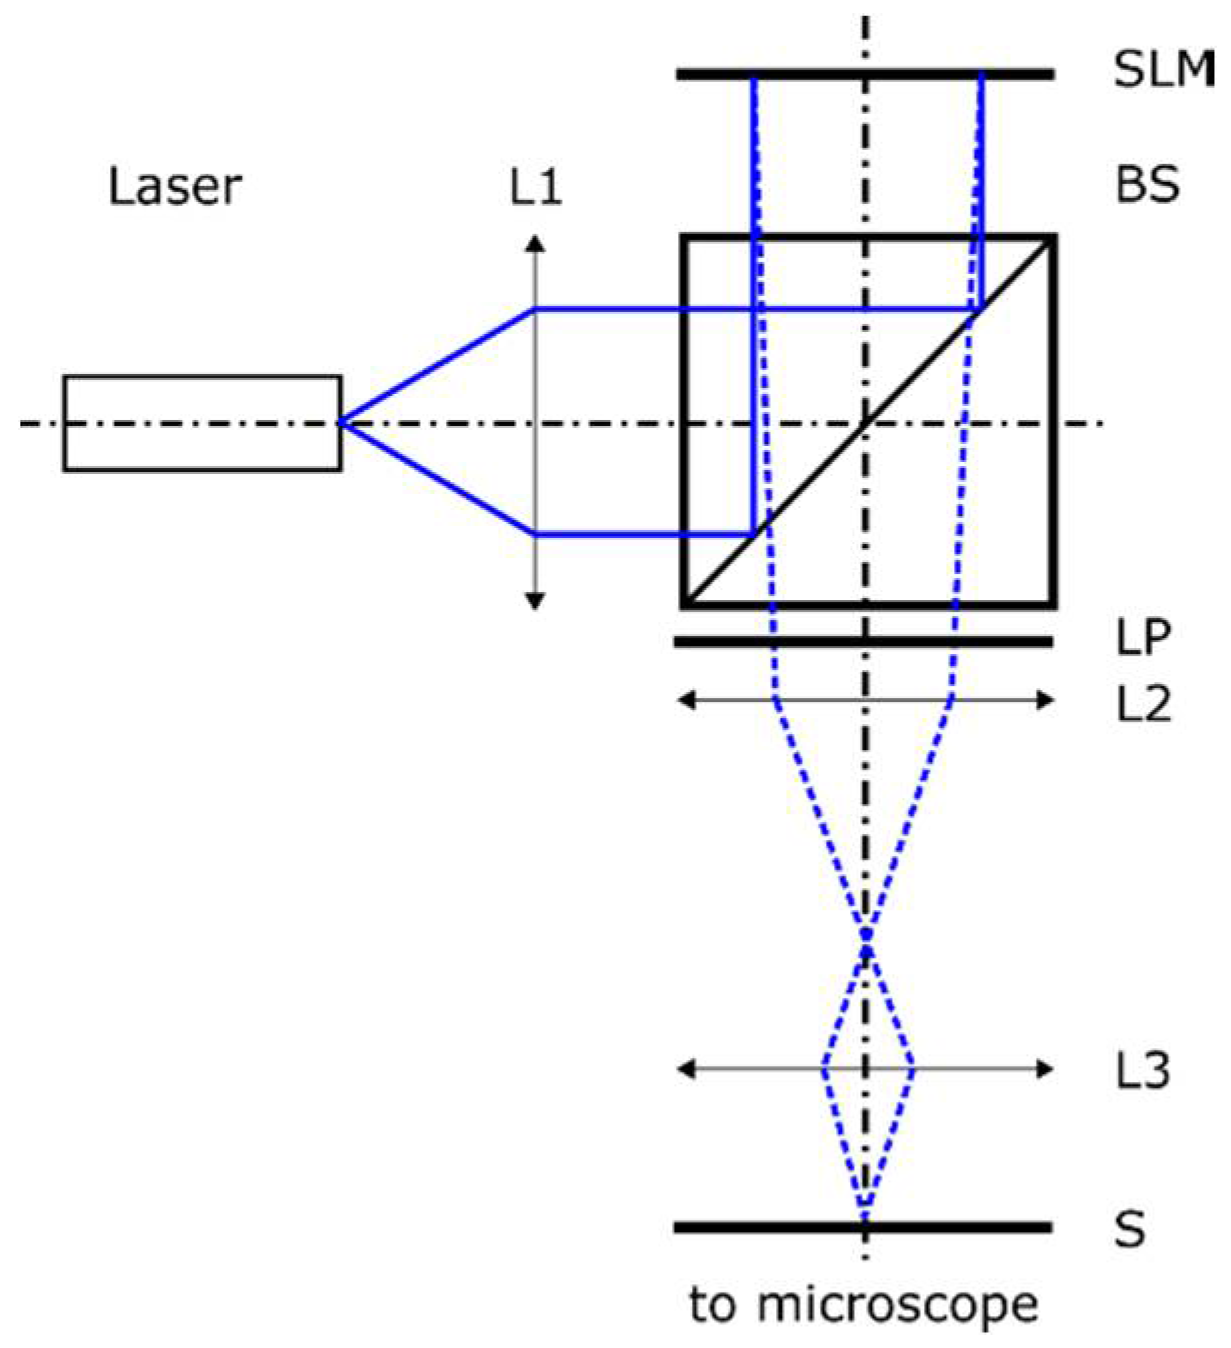
2. Holographic Single-Cell Illumination Setup
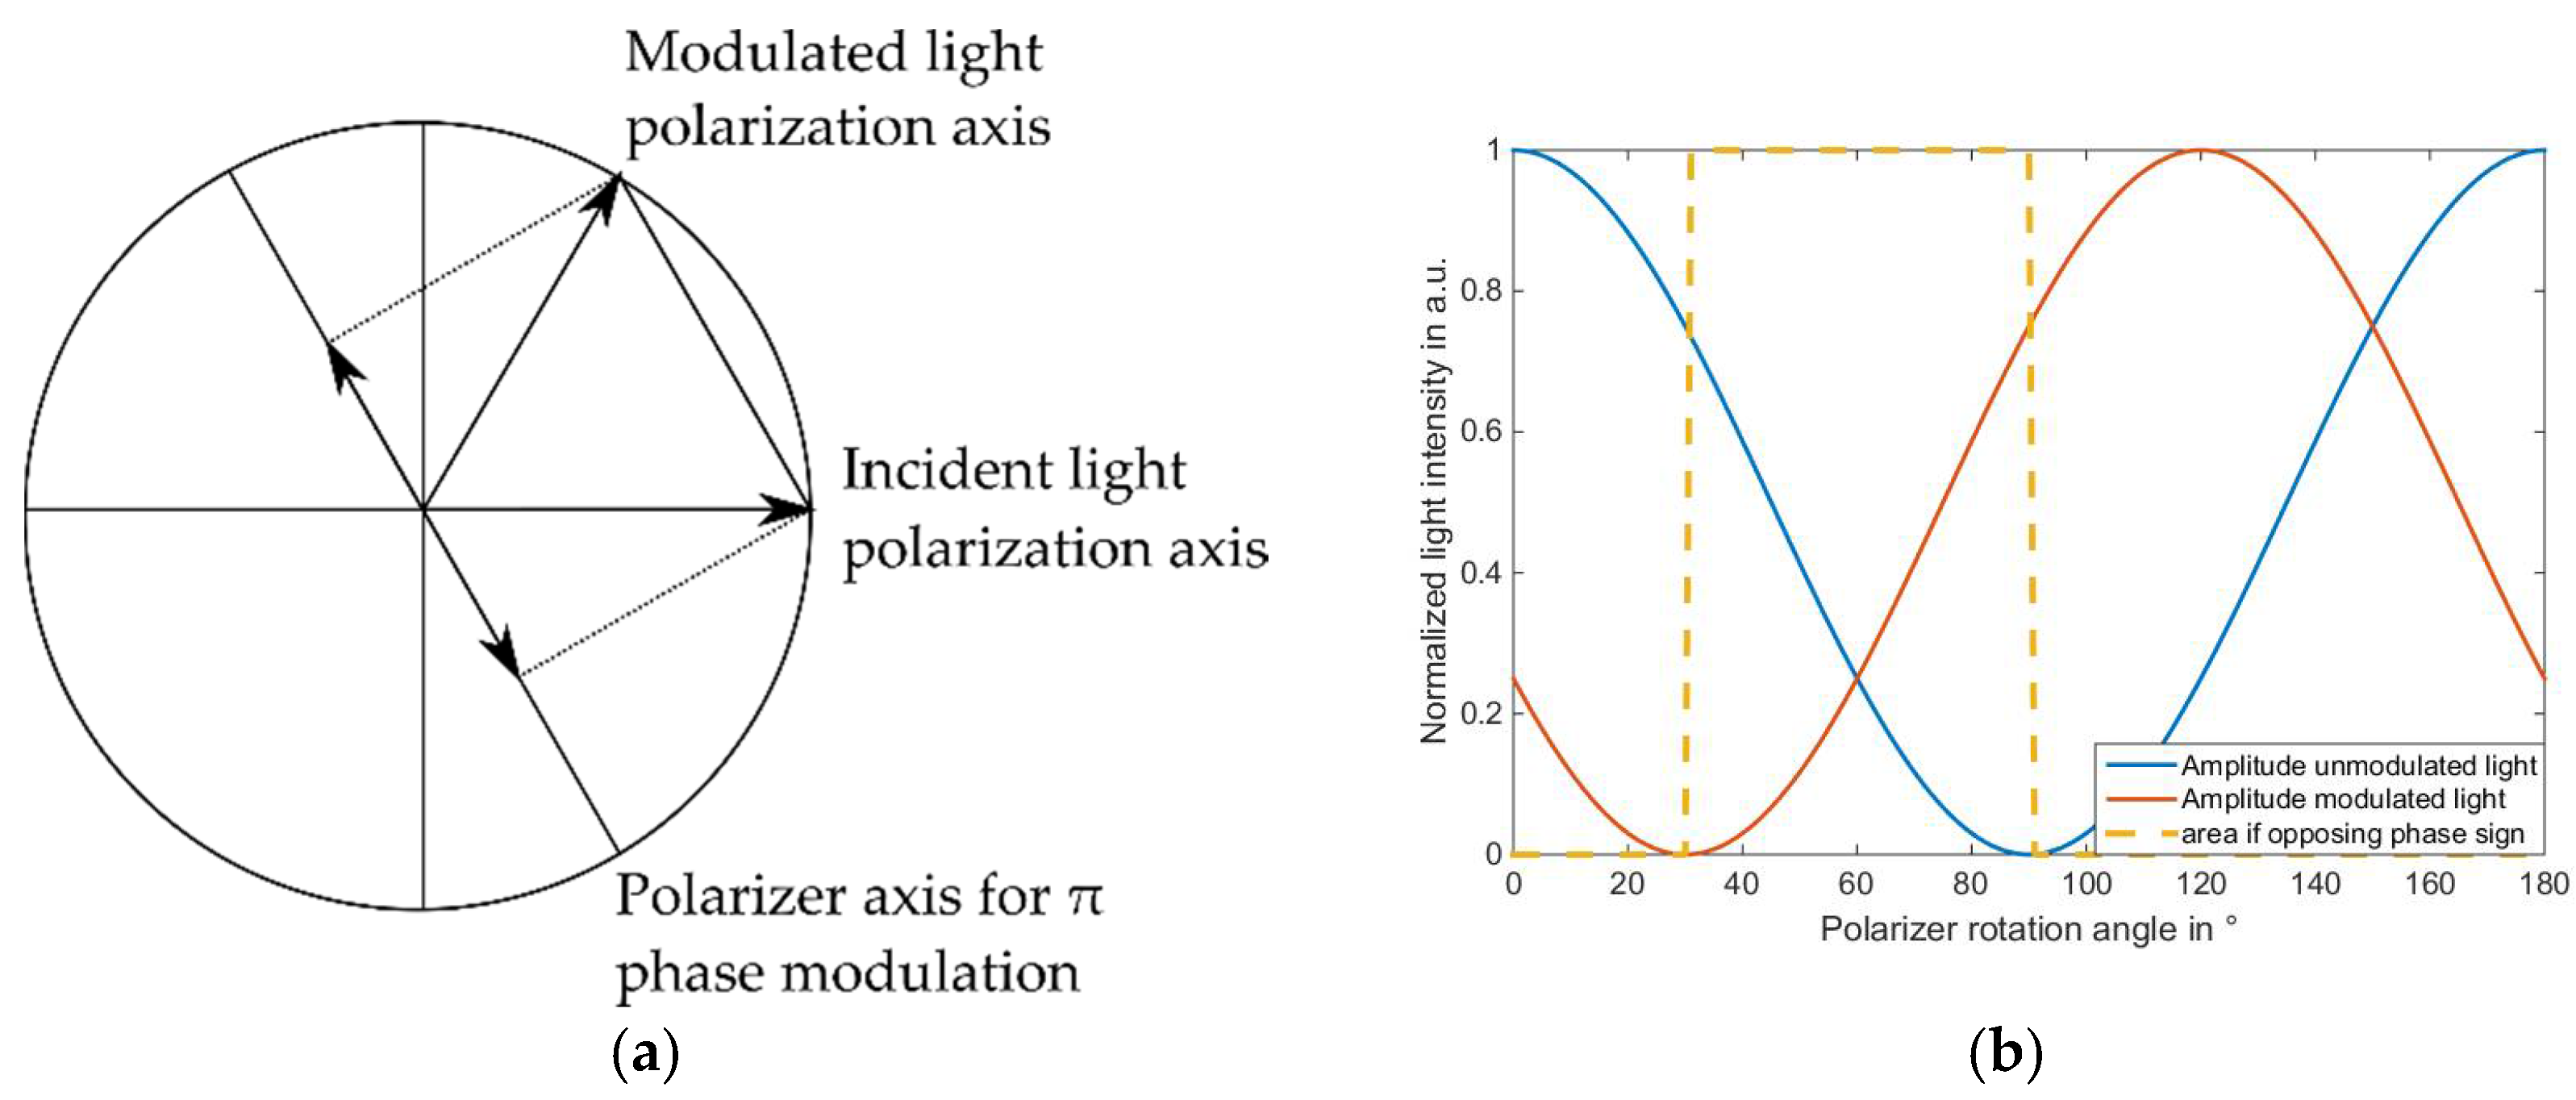
The schematic setup of our holographic single cell illumination unit is depicted in Figure 1. Light from a single mode laser diode (Thorlabs PL450B) is collimated by lens L1 (Thorlabs AC254-100-A) to a diameter that is larger than 20 mm. The light is then reflected by a non-polarizing 50:50 beam splitter (BS: Thorlabs BSN10R) and is then modulated by the SLM (Forth Dimension Displays, QXGA-3DM/QXGA-R9). The polarization-modulated light is then converted to binary phase-modulated light by a linear polarizer (Thorlabs LPVISE200-A). This process is explained in detail in Section 2.1. The final step before illuminating the sample consists of a demagnification by a Keplerian telescope (L2: Thorlabs AC254-100-A, L3: Thorlabs AC127-25-A-ML). The modulated light is then used to adaptively illuminate the sample, which can be observed by a camera that is mounted onto a commercial inverted microscope. In the case of the experiments that we are presenting, the sample is a two-dimensional random network of human iPSC-derived neurons, which is adherent to a multielectrode array (MEA, 60MEA200/30iR-Ti by Multichannel Systems). The protocol for culturing these neurons, especially the stable expression of ChR2 in stem-cell-derived human neurons, was published recently [33]. In the following, we will focus on different aspects of the setup and the experiments.

2.1. Modulator

The key component for achieving our goal of simultaneous steering of several foci are ferroelectric liquid crystal on silicon spatial light modulators (FSLM). They offer binary polarization modulation up to 2 kHz, depending on the model, and a high pixel count of about three megapixels at 8.2 µm pixel pitch. While being slower than modern binary intensity-modulating digital light processors (DLP) which use MEMS technology, the maximum diffraction efficiency available with binary phase modulation is twice as high [34], which is key when trying to stimulate many cells simultaneously.
The FSLM pixels in the “on” state rotate the polarization of incident light ( λ = 450 nm) by an angle of 62°, while the “off” pixels do not affect the polarization. To achieve a phase modulation of π , a linear polarizer can be used, as indicated in Figure 2 to the left. Since the electrical field transmitted by a linear polarizer is the vector projection of the incident electrical field vector onto the transmitted polarization direction, both the modulated (pixel state: “on”) and the unmodulated (pixel state: “off”) light can be forced to the same polarization axis but with opposing signs. The respective intensities that are transmitted by the polarizer in dependence on the polarizer rotation angle are depicted to the right, assuming a polarization modulation angle of 60°. The area inside the yellow dotted line indicates the range of polarizer rotation angles that will result in an effective phase shift of π . Same intensities will yield the highest interference contrast. Therefore, a maximum of 25% of the light impinging on the modulator can be expected to be transmitted to the sample after passing the polarizer.

2.2. Computer-Generated Holograms

Usage of the FSLM was reported previously [32]. There, a Fourier hologram scheme was employed to steer a focus over mouse retinas. Fourier holograms are utilized when SLM and sample are positioned in the respective focal planes of an objective. They use only one, usually the first, diffraction order. Since binary Fourier holograms result in symmetrical reconstructions, this approach will result in two drawbacks. First, since the 0 th diffraction order and all higher diffraction orders have to be filtered out, it handles light quite inefficiently and it will restrict the number of cells that can be illuminated simultaneously. As a second consequence, the field of view is halved, which necessitates an objective with a smaller magnification to achieve the same field of view, which in turn limits the minimum spot size.
We are therefore using free-space computer-generated holograms (CGH) to focus the laser to the desired positions using 0 th diffraction order binary Fresnel zone plates. This way, the modulator itself is acting as the focusing optics. The finite pixel pitch of any SLM, however, leads to a severely limited numerical aperture and therefore to a limited minimal applicable focal length. This limits the minimum focus size that is available for optically activating cells. A Fresnel Zone plate can be represented by the parabolic phase function
φ = 2 π x 2 + y 2 2 f λ ,
where x and y are the SLM coordinates, f is the focal length of the zone plate, and λ is the wavelength of the light that is used for the illumination of the CGHs. For a parabolic phase function representing a Fresnel zone plate, the minimum focal length can be expressed as [35]
f m i n = N Δ 2 λ .
Here, N is the number of pixels along the shorter side of the SLM and Δ is the pixel pitch of the SLM. The focal length f m i n can be decreased using a telescope comprising the two lenses L 3 and L 2 (see Figure 1). With the magnification m = L 3 / L 2 , the numerical aperture of the overall optical system then becomes
N A N Δ 2 m f m i n = λ 2 m Δ ,
resulting in a minimum focus diameter d of
d = 0.61 2 λ N A = 2.44 m Δ .
according to the Rayleigh criterion. To achieve subcellular resolution, the magnification m can be adjusted to tune d .

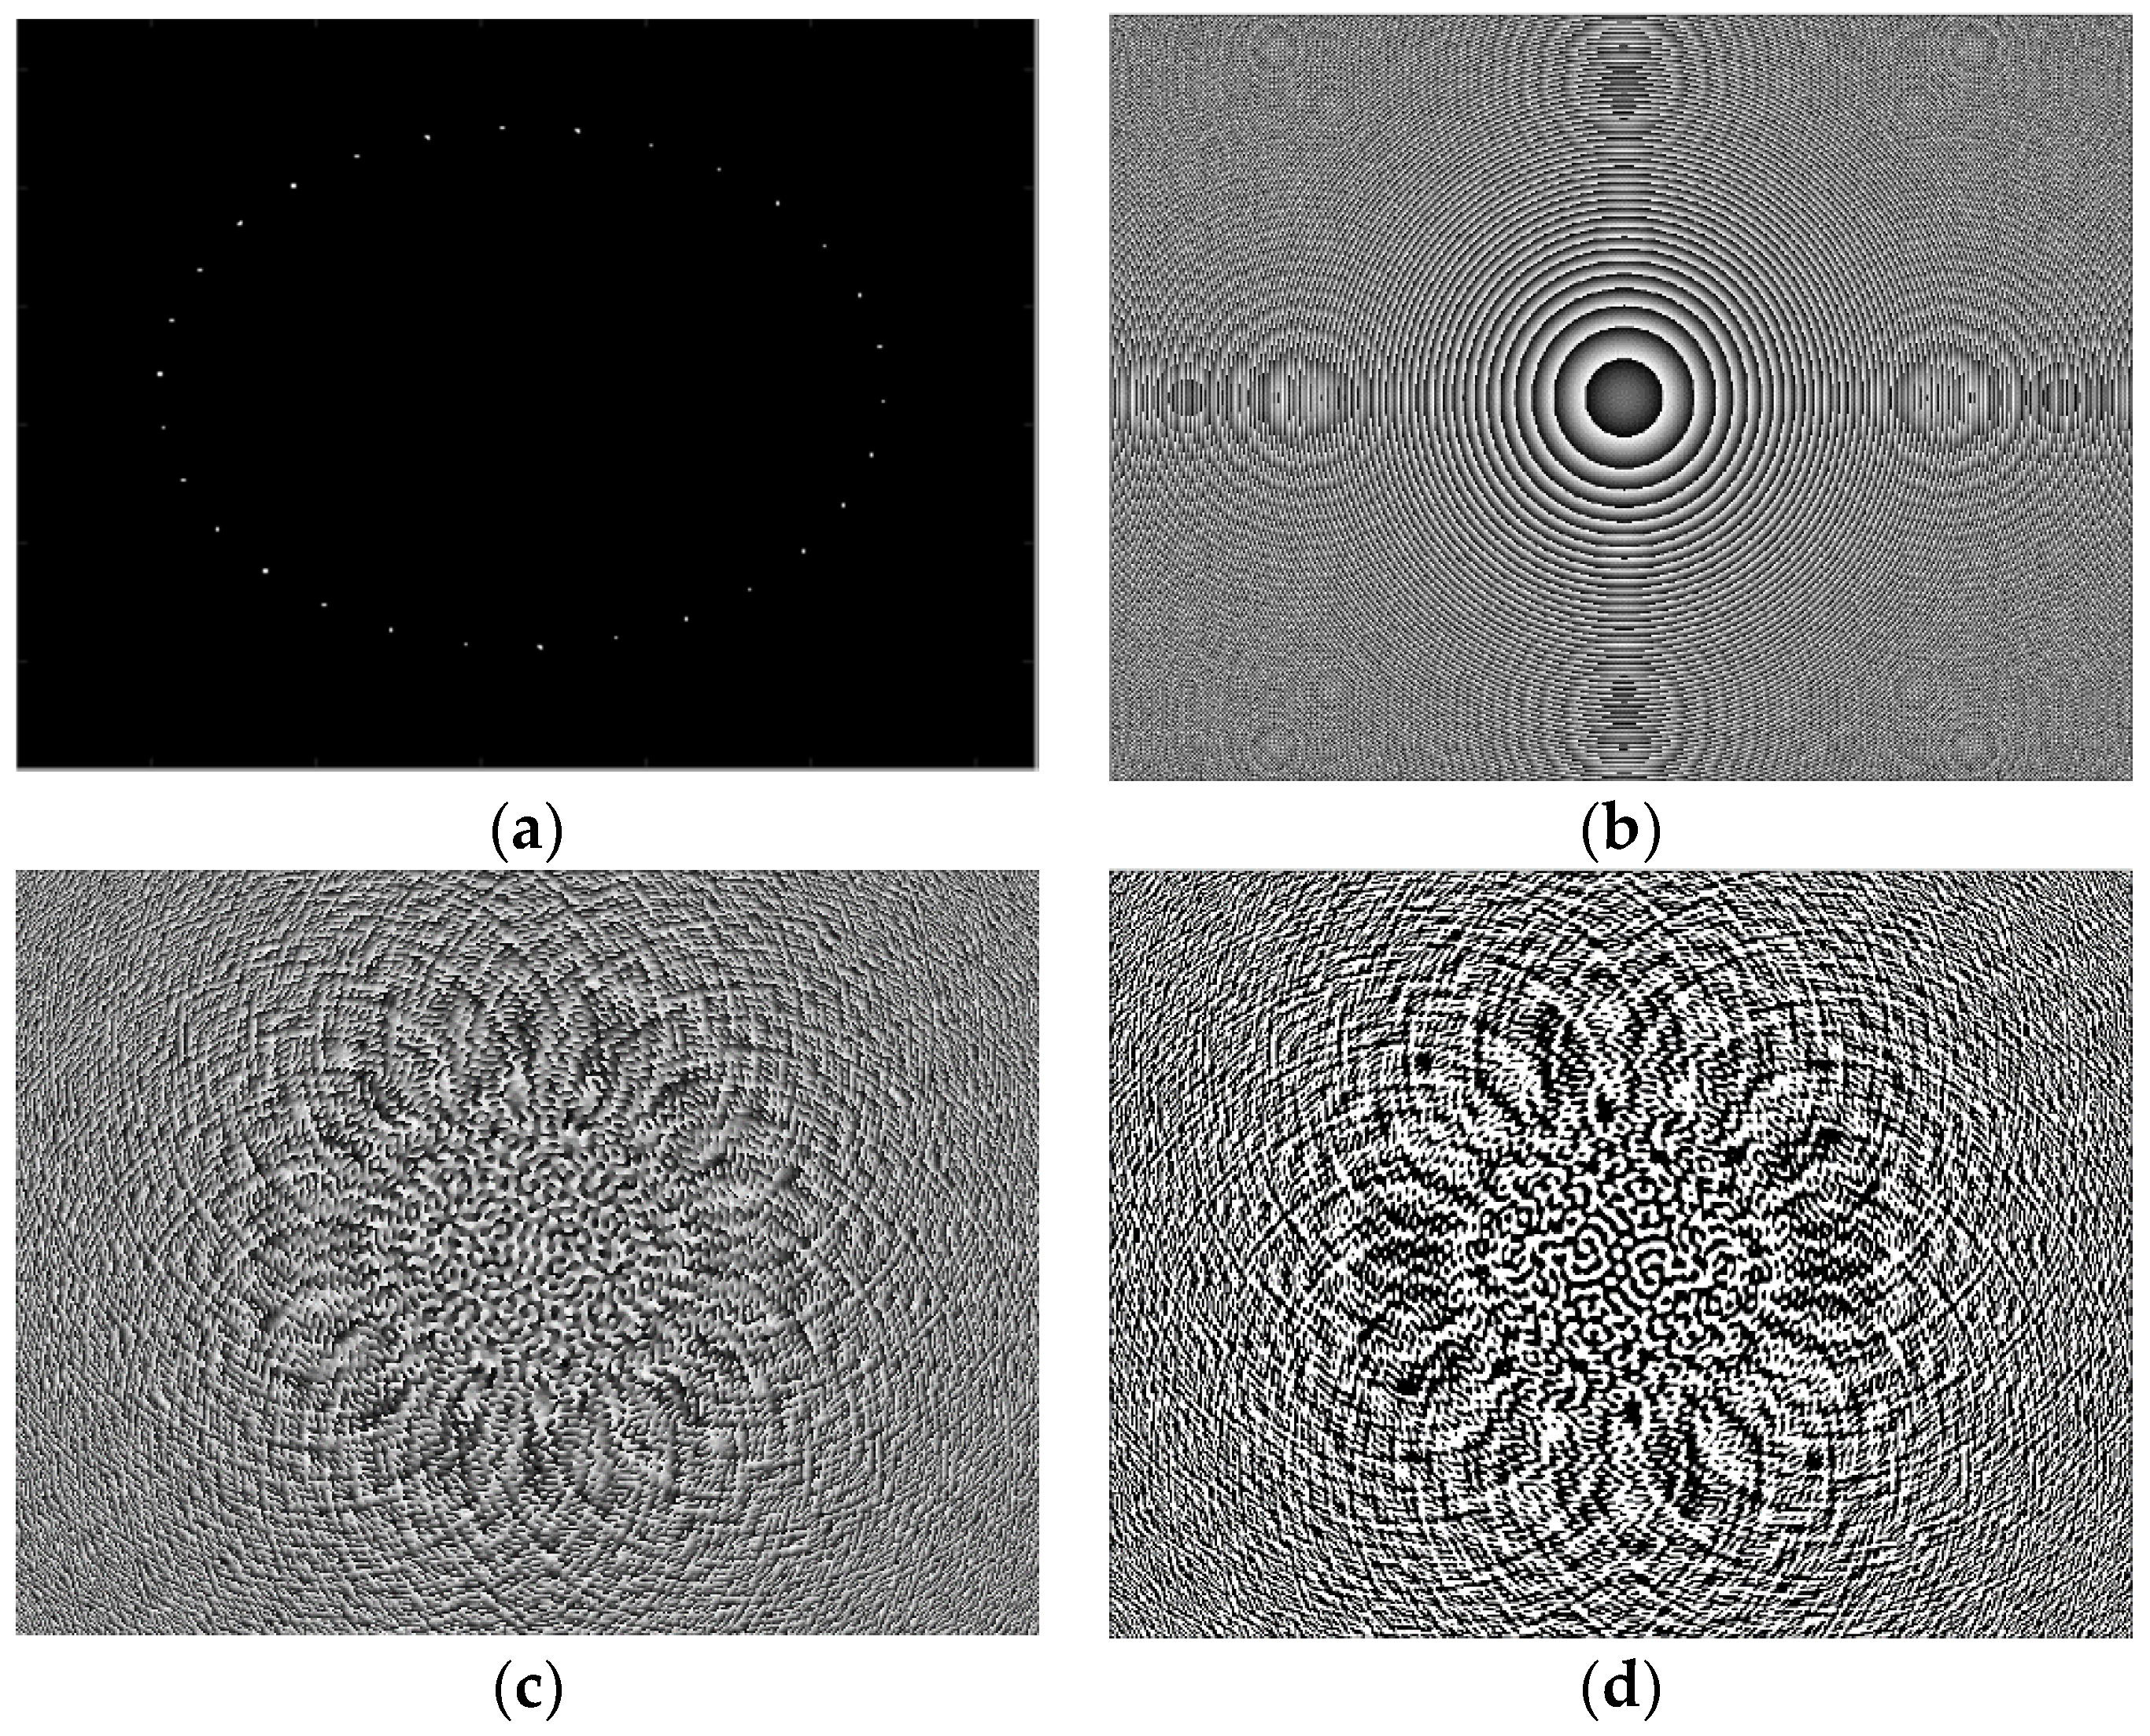
2.3. Computer-Generated Hologram Calculation and Binarization
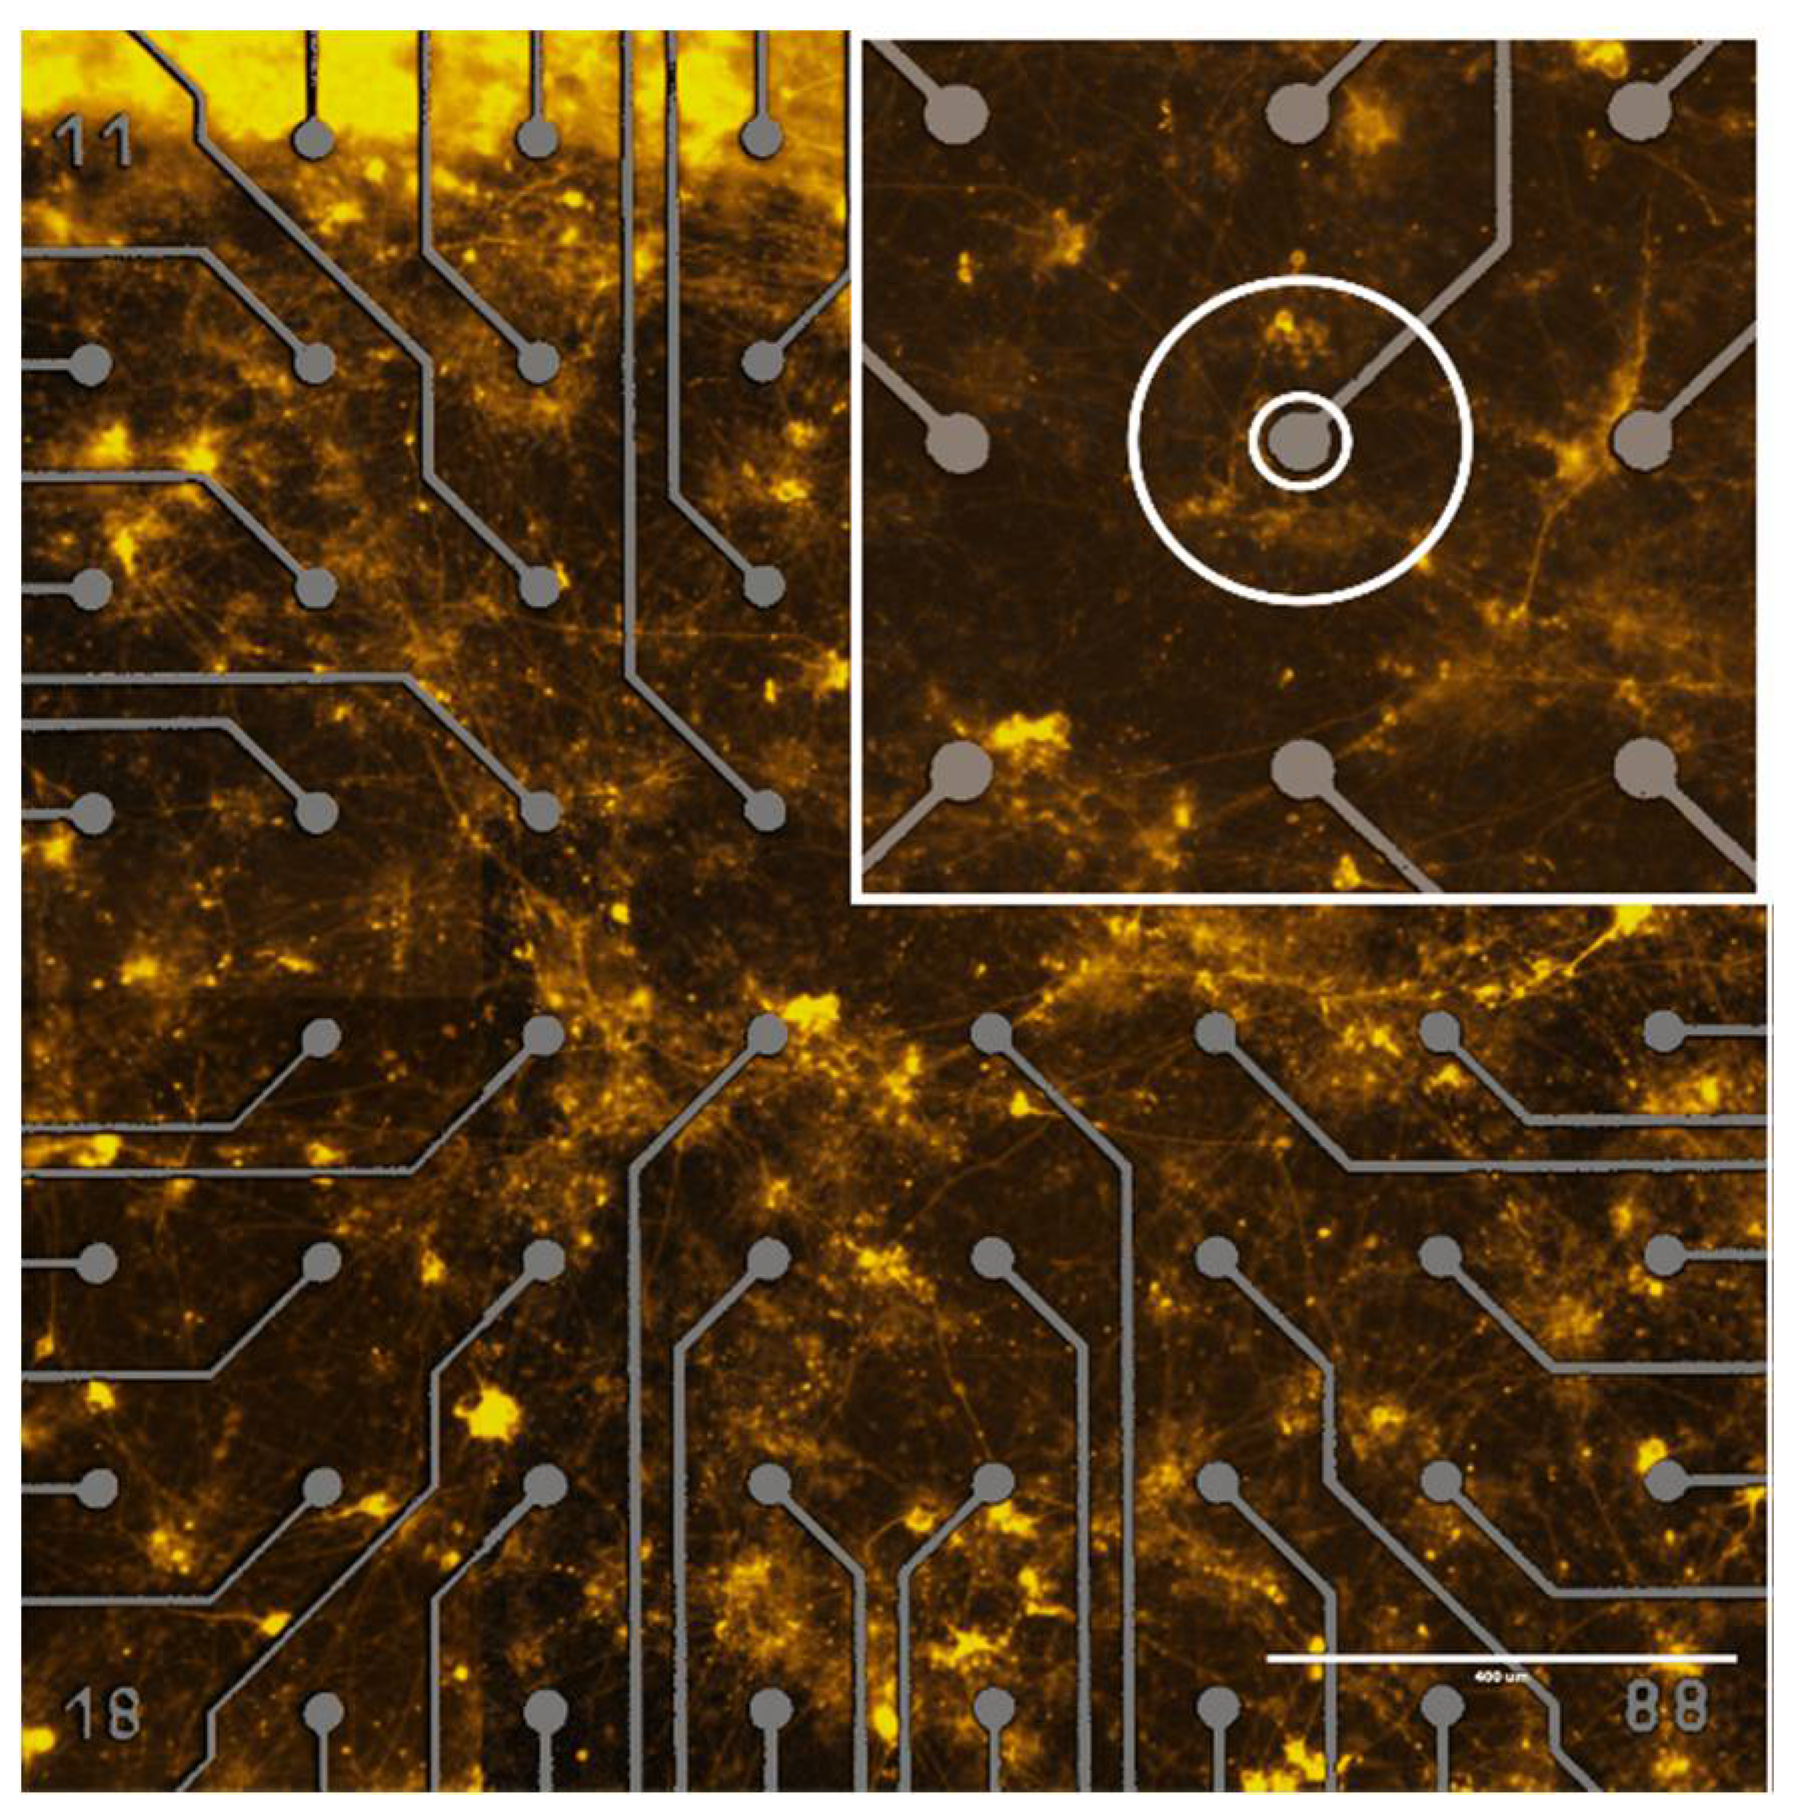
Since the SLM is used as the focusing optics, the calculation of the focusing hologram H is straightforward. Each of the SLM pixels represents one spot on the sample that can be illuminated. Therefore, first a matrix M representing all of the neurons that should be activated has to be created. A complex-valued computer-generated hologram for focusing to these neurons is then calculated by convolving this matrix with a single Fresnel zone plate, which has been pre-calculated for the focal length f m i n :
H ( x , y ) = M ( x τ , y υ ) e i φ ( τ , υ ) d τ d υ
Because the FSLM is a binary modulator, the complex-valued holograms have to be converted to binary phase holograms. For the case of sparse holograms using well-separated foci, the binary phase φ can be easily obtained using a thresholding algorithm on the continuous phase φ of the complex-valued hologram:
φ = { π , π / 2 φ < 3 π / 2 0 , e l s e .
For illuminating patterns that do not consist of well-separated minimal foci but of larger illuminated areas, a more complicated CGH calculation scheme is applied. Again, all of the areas that have to be illuminated are registered in a matrix, which is then again convoluted with a single complex Fresnel zone plate. This, however, results in a complex-valued hologram, in which the amplitude is sparsely distributed. Reconstructing such a hologram, which was binarized according to Equation (6) with plane-wave illumination, results in deteriorated illumination patterns due to the suppression of high spatial frequencies [36]. We are therefore using bidirectional error diffusion [37] to binarize these complex holograms. This method iterates through all pixels of the hologram in a meandering pattern. Each pixel is binarized separately and the resulting error as compared with the complex hologram is distributed among unprocessed neighboring pixels. The whole process of hologram generation is illustrated in Figure 3.

2.4. Sample

As mentioned above, our samples are random networks consisting of neurons that were derived from induced human pluripotent stem cells (iPSC) by forced induction of Neurogenin-1 and Neurogenin-2 transcription factors [10]. The neurons are genetically modified to express wild type ChR2 as well as the coupled fluorescent dye Enhanced Yellow Fluorescent Protein (EYFP) and form a two-dimensional (2D) layer which is adherent to a multielectrode array (MEA) [33]. These devices are used to noninvasively record the extracellular electrical signals of neurons. The MEAs used in our experiments are made from 60 TiN electrodes with Ti wiring on an 8 × 8 grid (excluding the corners). The electrodes are spaced 200 µm apart and they have a diameter of 30 µm. Figure 4 shows human neurons fluorescently labeled with ChR2-EYFP on an exemplary MEA. We took the fluorescent labeling as an indicator for the position of optogenetically excitable cells. The electrodes and their wiring are overlaid in gray for enhanced visibility. The inset in the white borders in the top right-hand corner shows a magnification of one electrode. The white circles indicate the typical (inner circle) and maximum (outer circle) recording distance of this electrode. Hence, the activity of more than one neuron can be recorded with a single electrode.

2.5. Calibration of the Illumination System

For conducting spatially resolved cell stimulation experiments, it is important to know exactly which position on the MEA is illuminated in order to enable a correlation between this location and the recorded electrical signals. Also, when the recording electrodes are illuminated, they generate large artifacts through the Becquerel effect [38,39], complicating data evaluation. Therefore, the process of CGH generation needs to be calibrated. This is achieved by consecutively focusing on the MEA in a rectangular grid and recording the respective positions with a camera through the microscope. The illuminated position on the camera is then extracted by fitting a two-dimensional Gaussian function to the brightest spot. The original SLM positions are then fitted to the previously extracted camera positions using a 2D polynomial function of 2nd degree. Thusly calibrated, all following CGH can be calculated with respect to camera positions.

3. Results

3.1. Setup Specifications

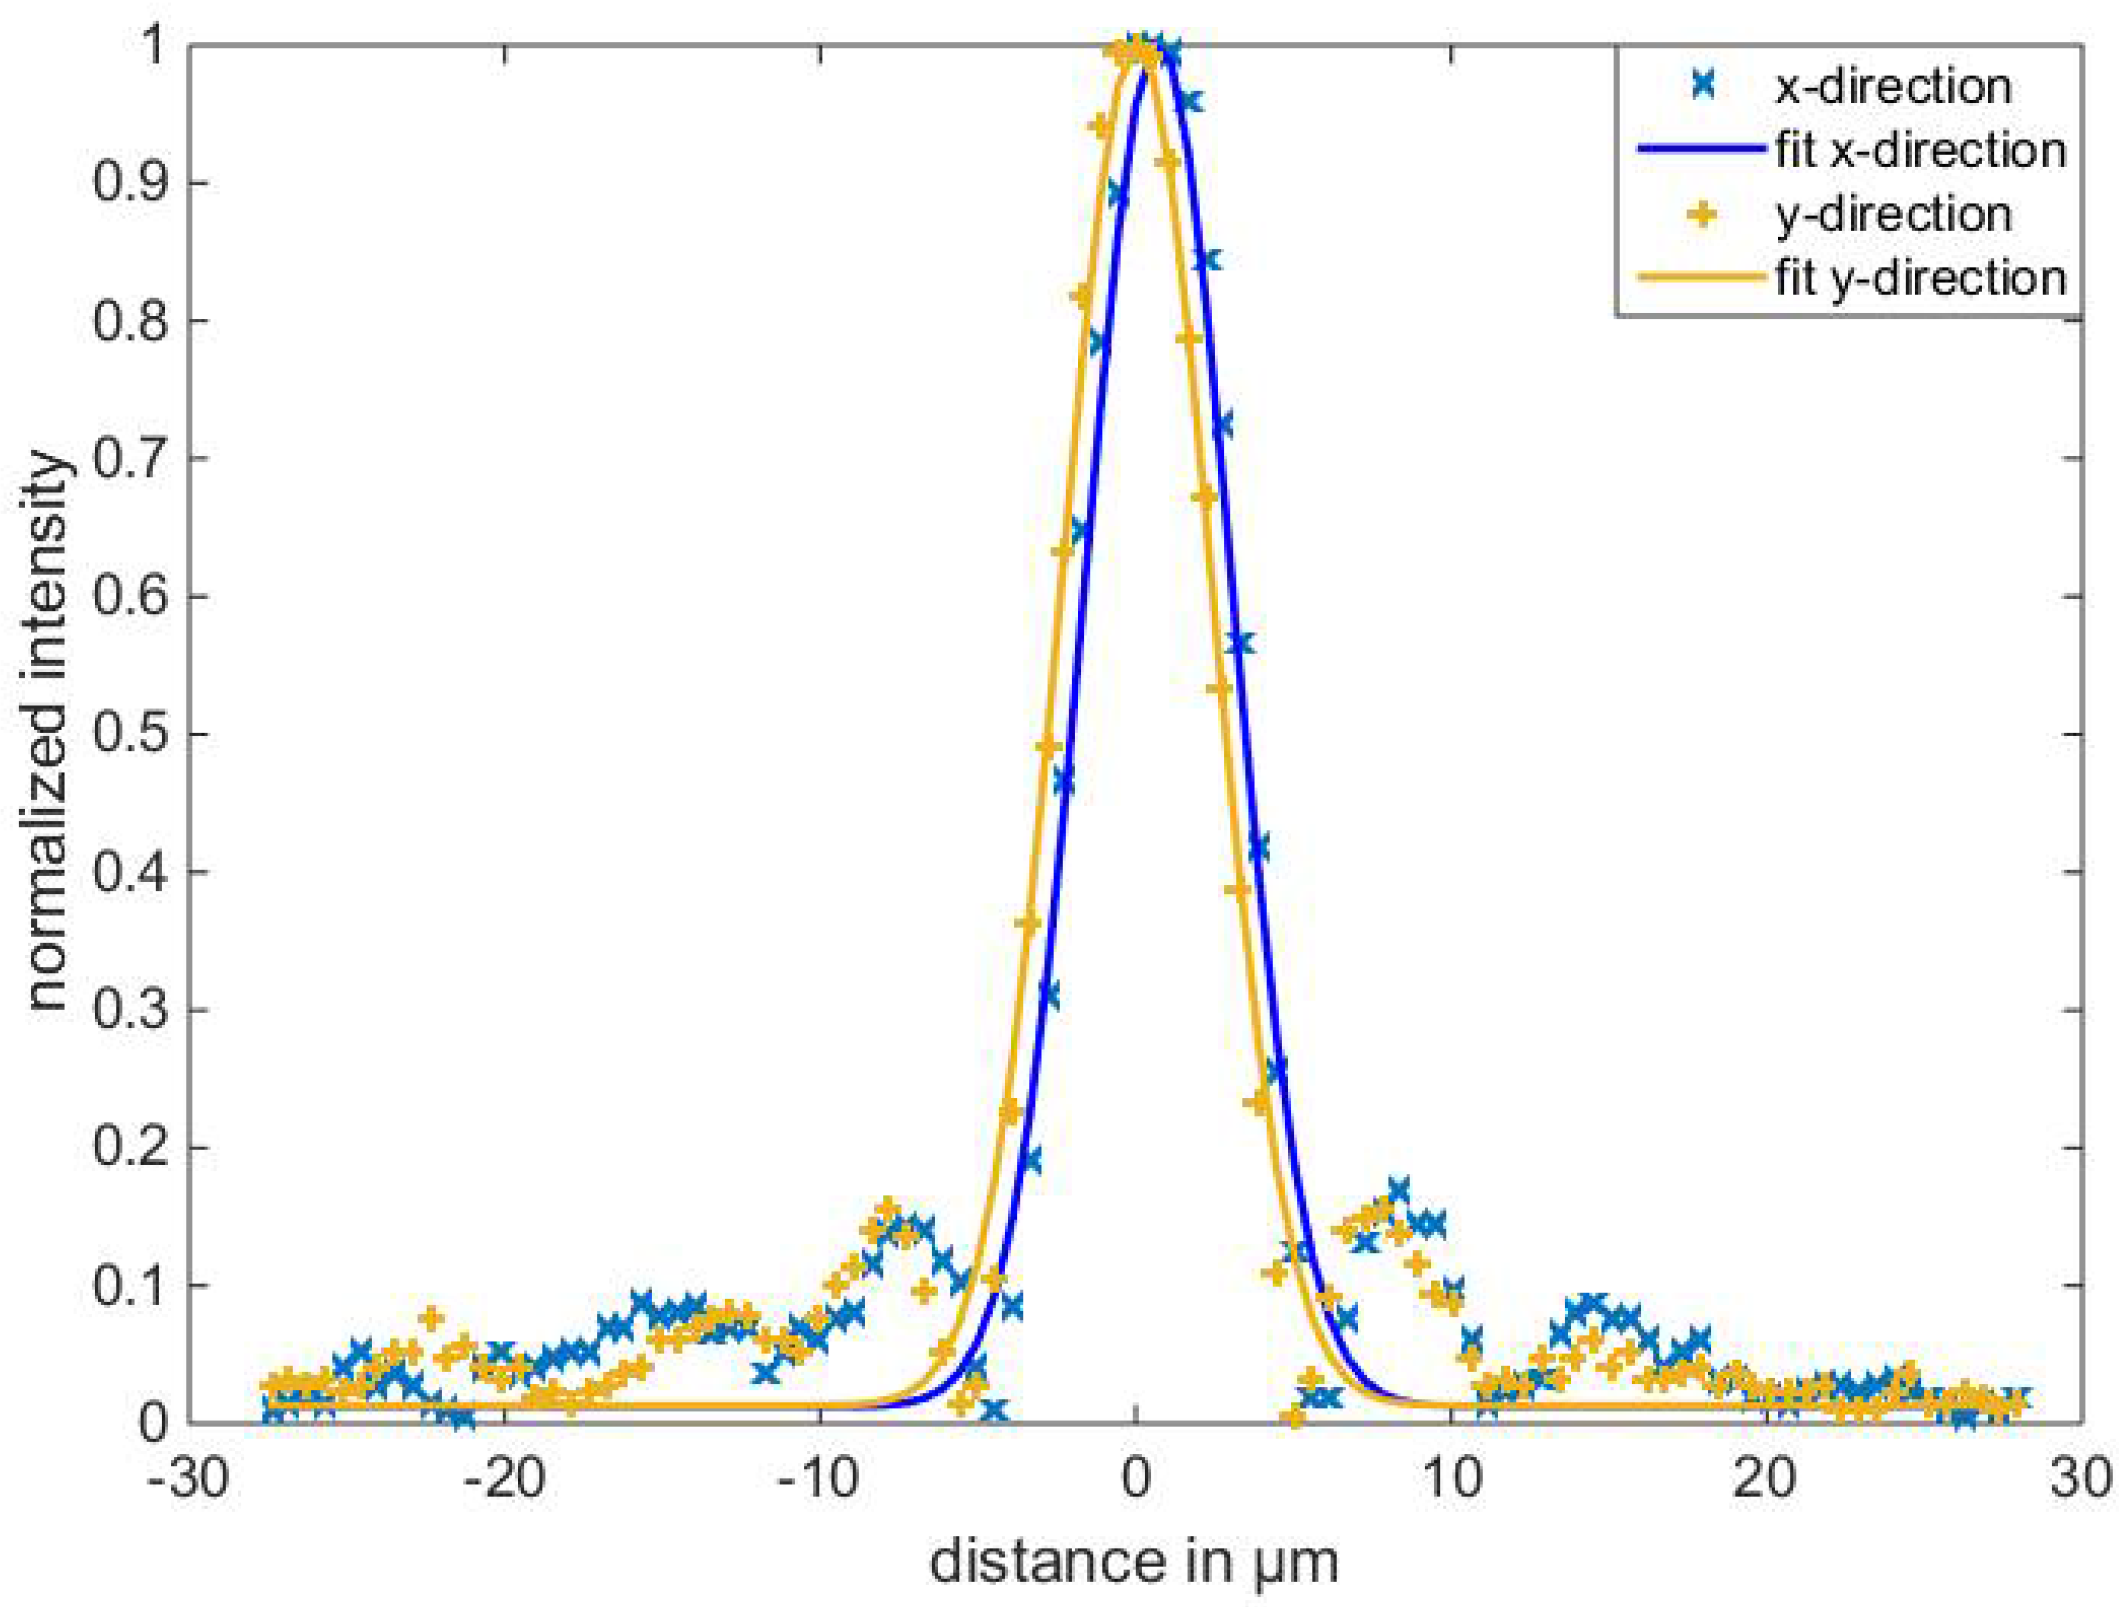
3.1.1. Minimal Focus Diameter

We measured the minimum achievable focus of our system using a single Fresnel zone plate of focal length f m i n , which calculates to 229 mm according to Equation (4). To achieve focus diameters of less then 10 µm, we set the magnification m to 1/6. The resulting focus was observed by a camera through the microscope using a 20× objective. The effective pixel pitch of the camera was calibrated using the MEA structure. A 2D Gaussian function was fitted to the recorded focus. The x and y cross-sections of the fit resulted in a mean focus diameter of about 8 µm. Both of the components are displayed in Figure 5. Sidelobes of the focus are clearly visible and they indicate spherical aberrations that may be corrected in future iterations of out setup, e.g., by using phase conjugation. Over a field of view of (1.5 × 1.5) mm2, the spot diameter varies by a standard deviation of 5%.

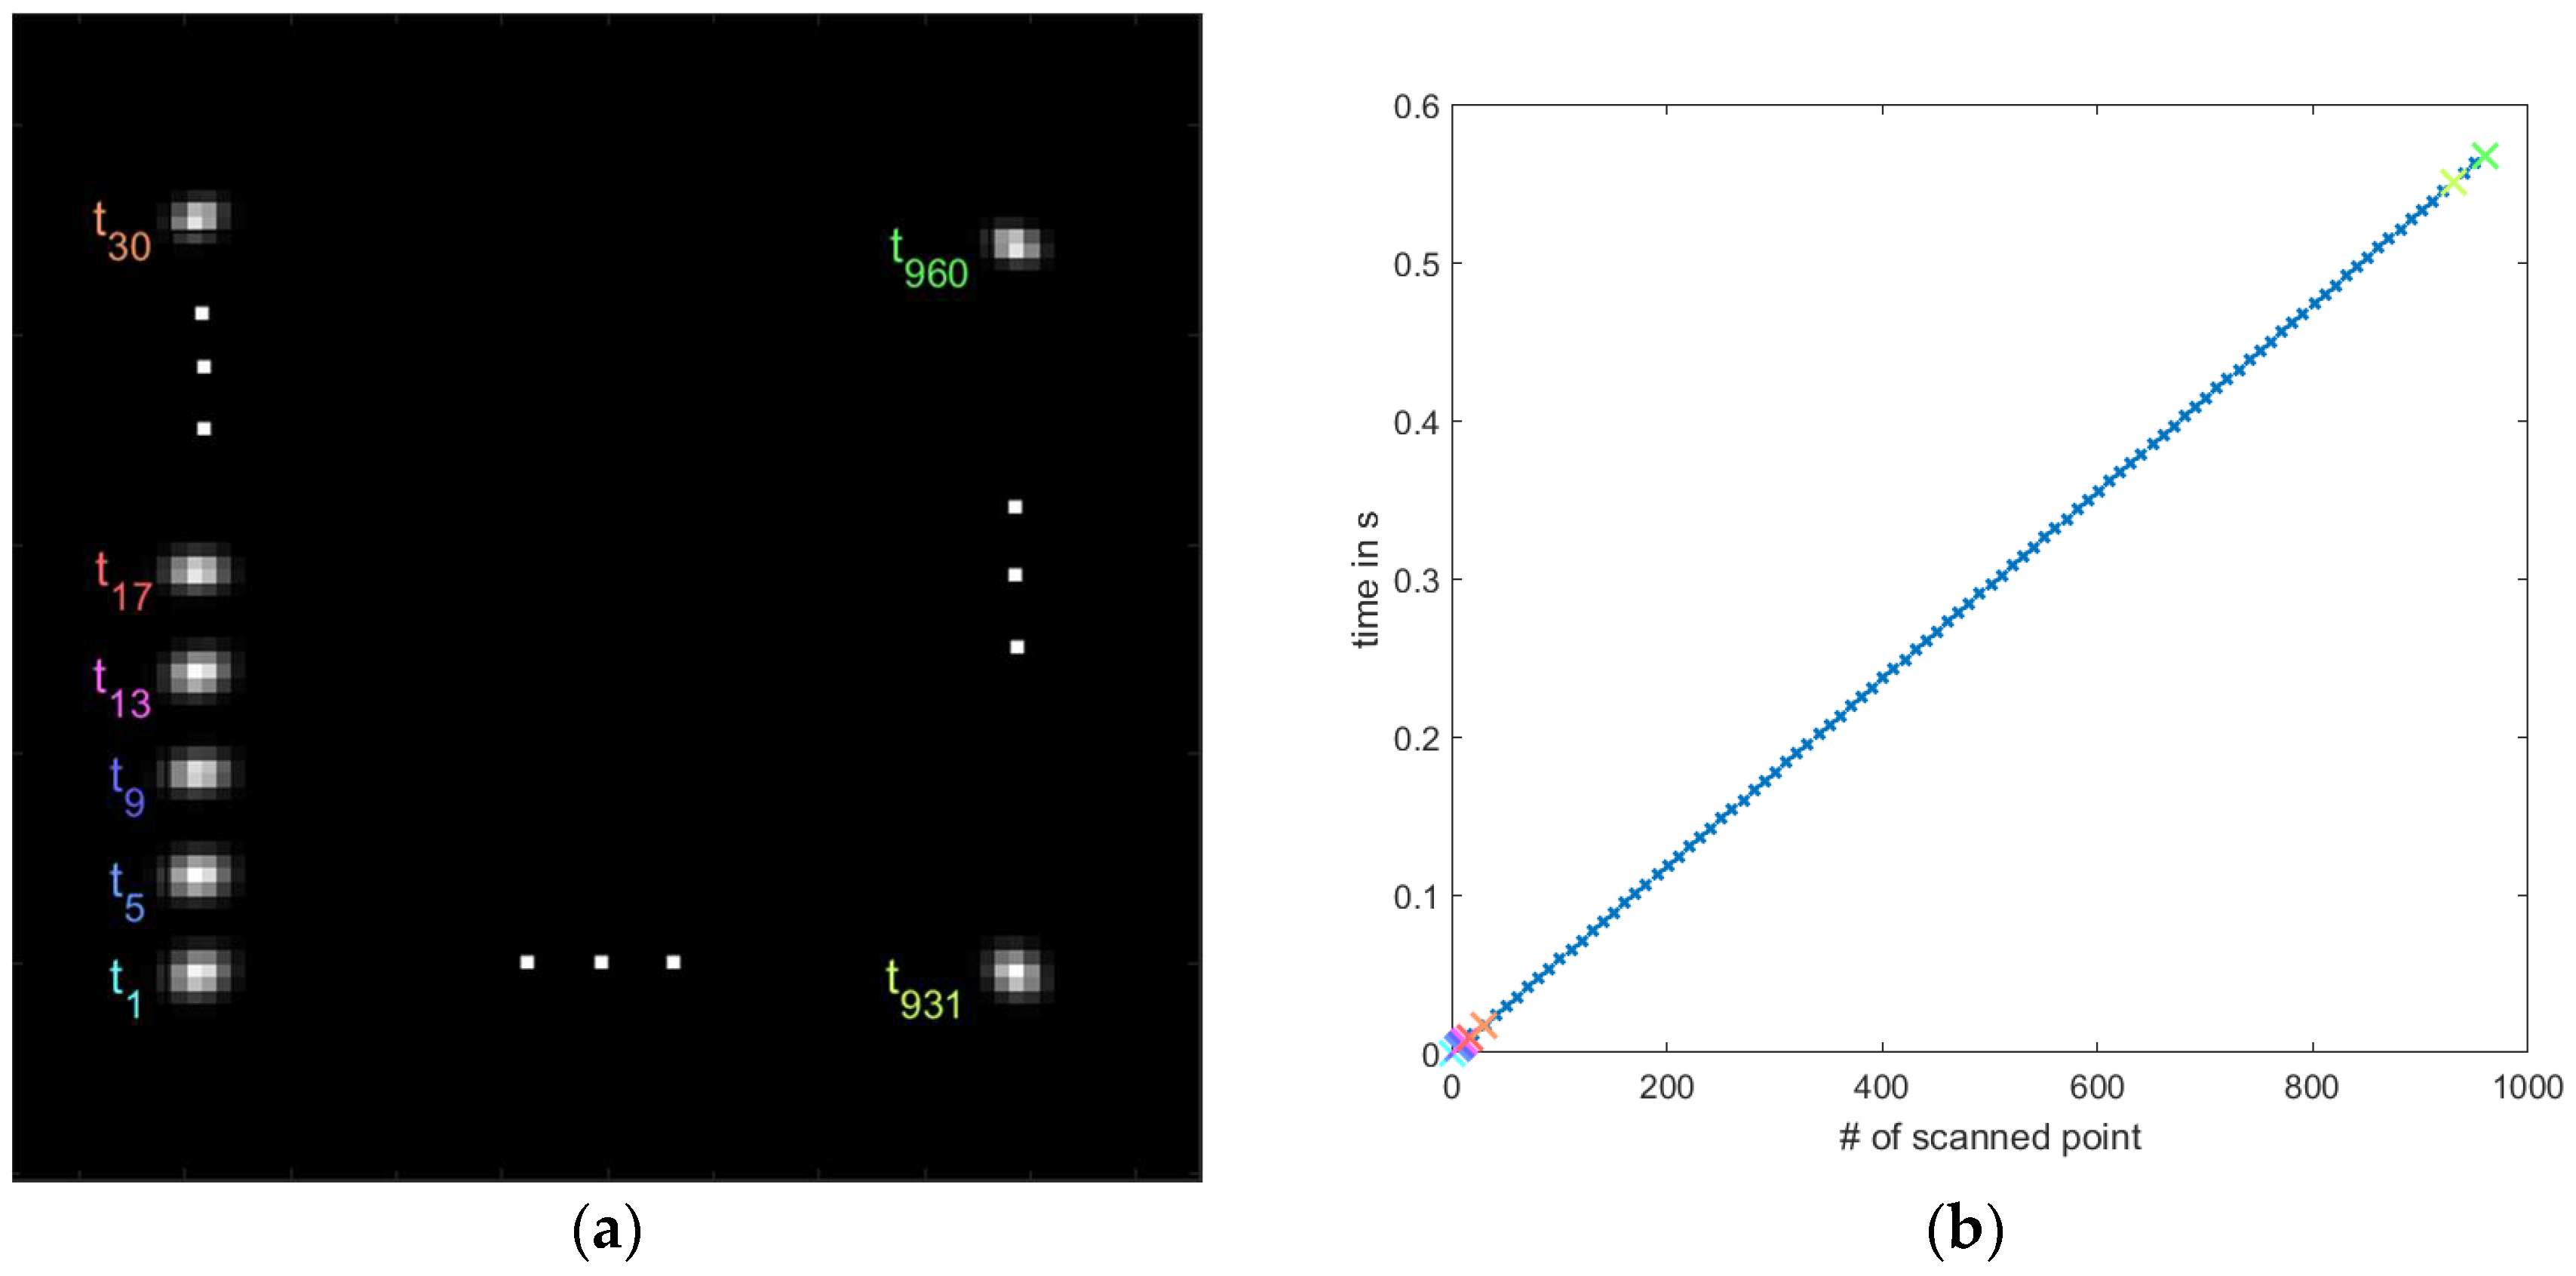
3.1.2. Pattern Update Rate

To demonstrate the pattern update rate, i.e., the frame rate of the modulator, we scanned a single focus over a field of view of (1.5 × 1.5) mm2. We observed the moving focus using a Phantom v1610 high speed camera. The column-wise scan pattern is illustrated in Figure 6a. Figure 6b shows the time required to scan to the respective point on the sample. All of the points from (a) are indicated by color. Scanning all 961 points of the raster took 568 ms, which results a frame rate of the modulator of 1.7 kHz. Therefore, our setup achieves a temporal resolution of 0.59 ms.

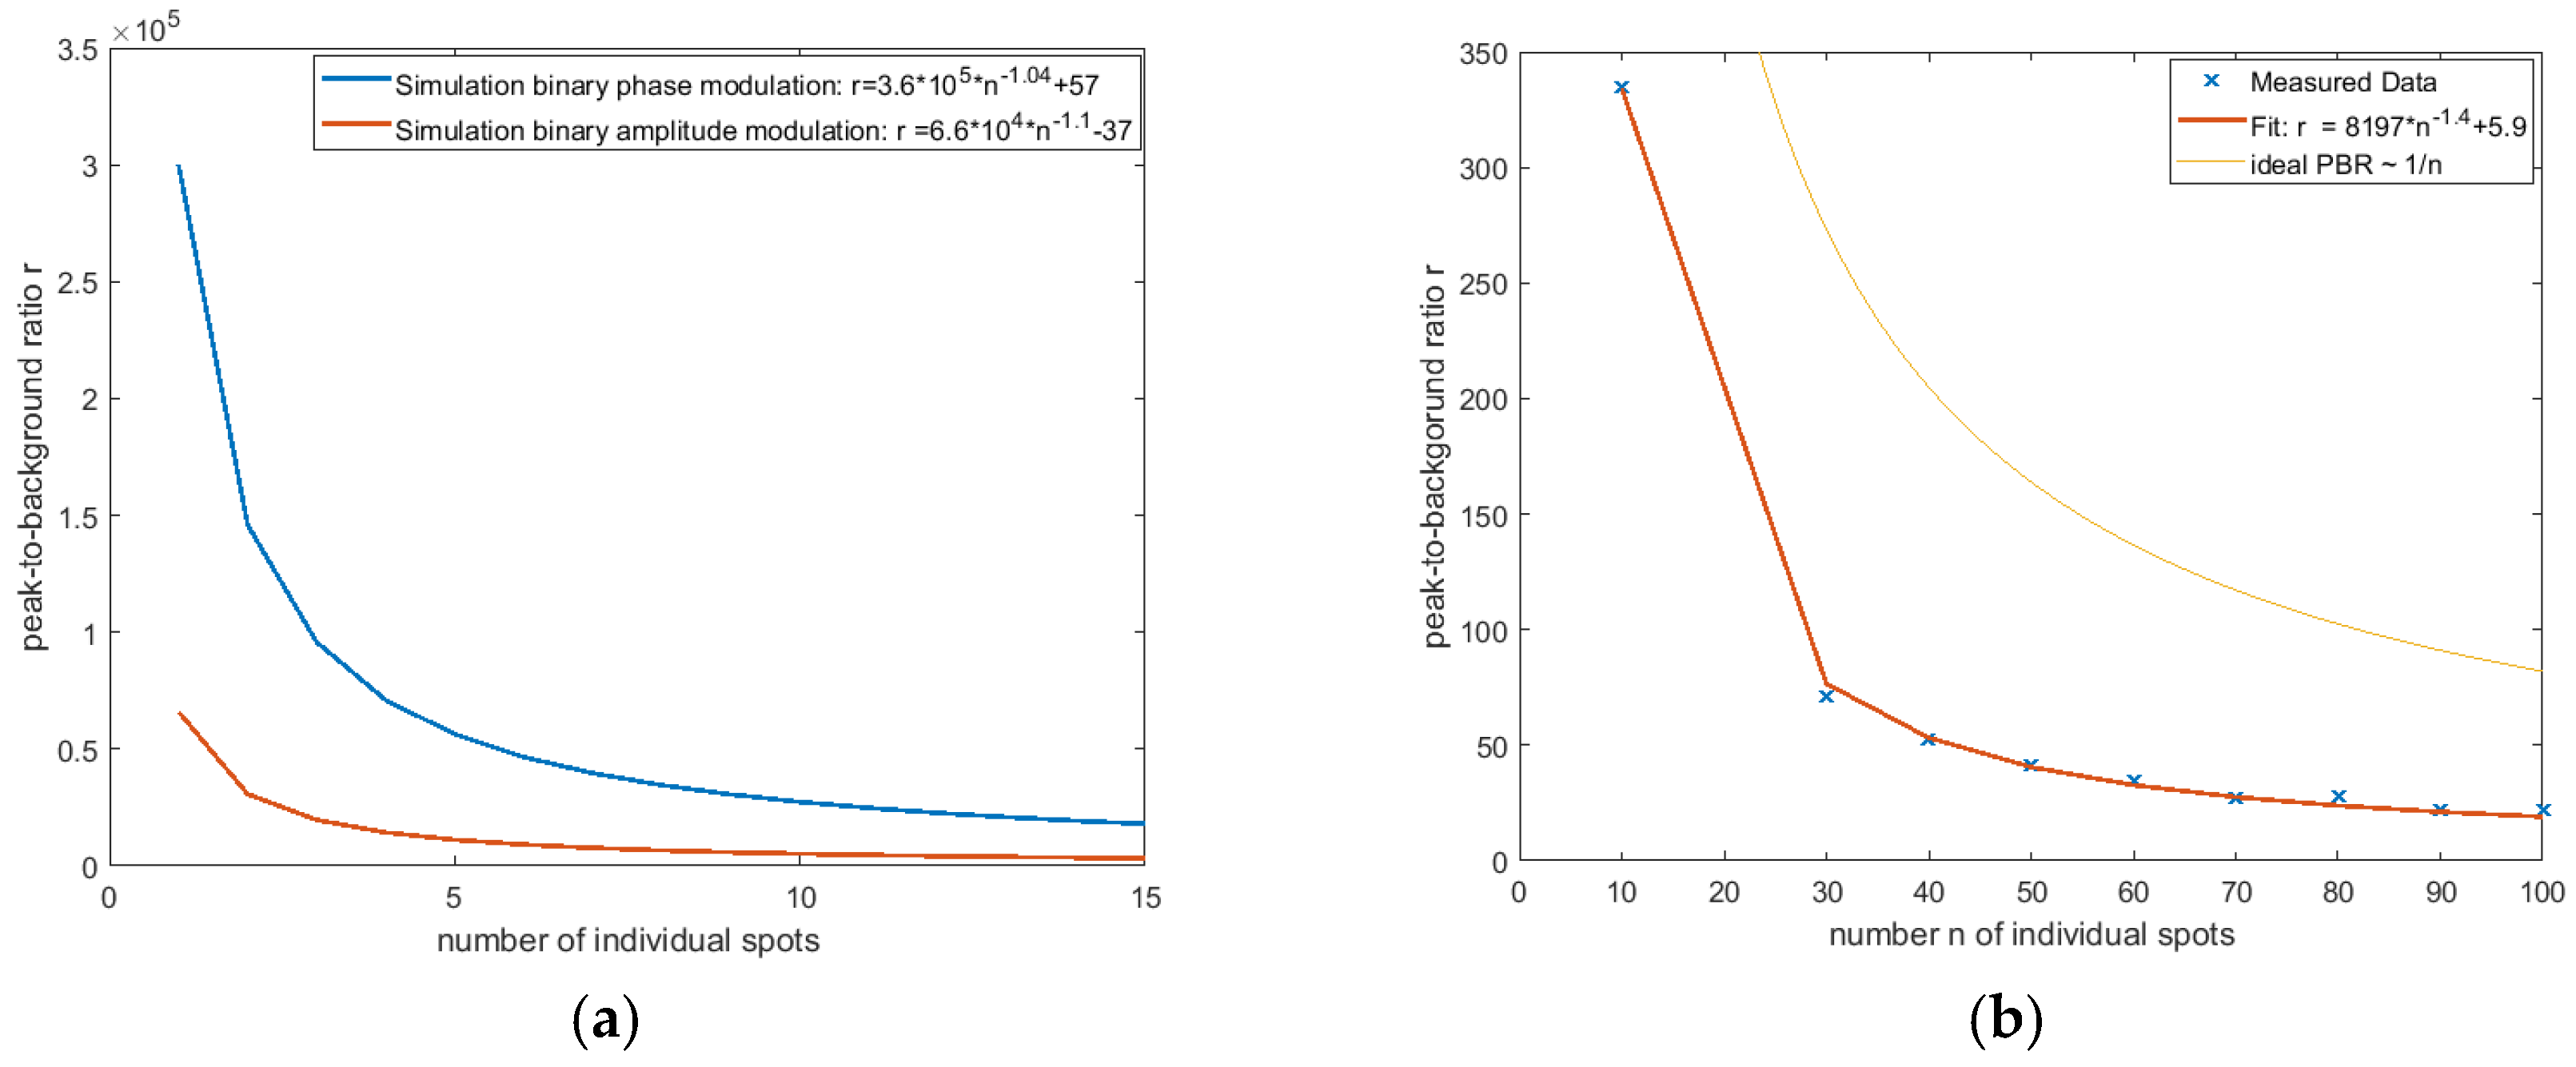
3.1.3. Generation of Multiple Foci

We also conducted experiments to determine the number of individual foci that can be generated using our setup. Since the object of our investigations will be random neural networks, we generated patterns of random equally distributed foci. We then evaluated the mean peak-to-background ratio (PBR) r of the resulting illumination pattern, including the speckled background. The corresponding PBR in dependence on the number of spots is shown in Figure 7b. Ideally, the available light power distributes equally among all of the spots with no increase in background noise, leading to an n 1 -distribution with n being the number of generated spots. We fit an exponential function r = A n b + c to the measured data in Figure 7b, with the maximum PBR A . It shows an exponent b of −1.4, which reveals a proportionality of background noise with a rising number of spots. Furthermore, we executed simulations to compare the approach of binary phase-only modulation that we are using in our setup with binary amplitude modulation, which can be realized e.g., using DMDs. We calculated holograms for an increasing number of simultaneously generated foci as described in Section 2.2 and Section 2.3 using the physical parameters of our setup and binarized them using bidirectional error diffusion. The holograms were computationally propagated to the sample plane to obtain the image of the desired foci. The resulting images were evaluated, as explained above. The resulting PBR curves are depicted in Figure 7a. As can be seen, in our case, the PBR using binary phase-only modulation is on average six times higher than when using binary amplitude modulation, e.g., when using a DMD for holographic illumination. Also, both of the fitted PBR curves show a dependency on n a with a > 1 and a a m p l i t u d e > a p h a s e . This reveals that in both cases there is an increase of background noise with increasing spot number, which is more pronounced in the case of binary amplitude modulation. Therefore, the intensity decrease per spot with an increasing number of simultaneously illuminated spots cannot simply be circumvented by increasing the power of the light source. Since the peak-to-background ratio should not fall below a certain threshold in order to avoid the unwanted stimulation of neurons with random background noise, the useful number of stimulation spots should be restricted. Since a higher pixel count will enable the representation of higher spatial frequencies in the holograms, an increase in PBR for multiple foci can be expected for SLMs with a higher pixel number.
Due to the design of the modulator and the overall setup, only 11.1% of the light arriving on the modulator is available on the sample surface. The maximum available power density in one spot, however, can be estimated to 1.5 W/mm2. This is three orders of magnitude above the EC50 for activating ChR2, which is 1 mW/mm2 [40]. For stimulating one or only a few neurons, the maximum power density can be easily adjusted using neutral density filters.

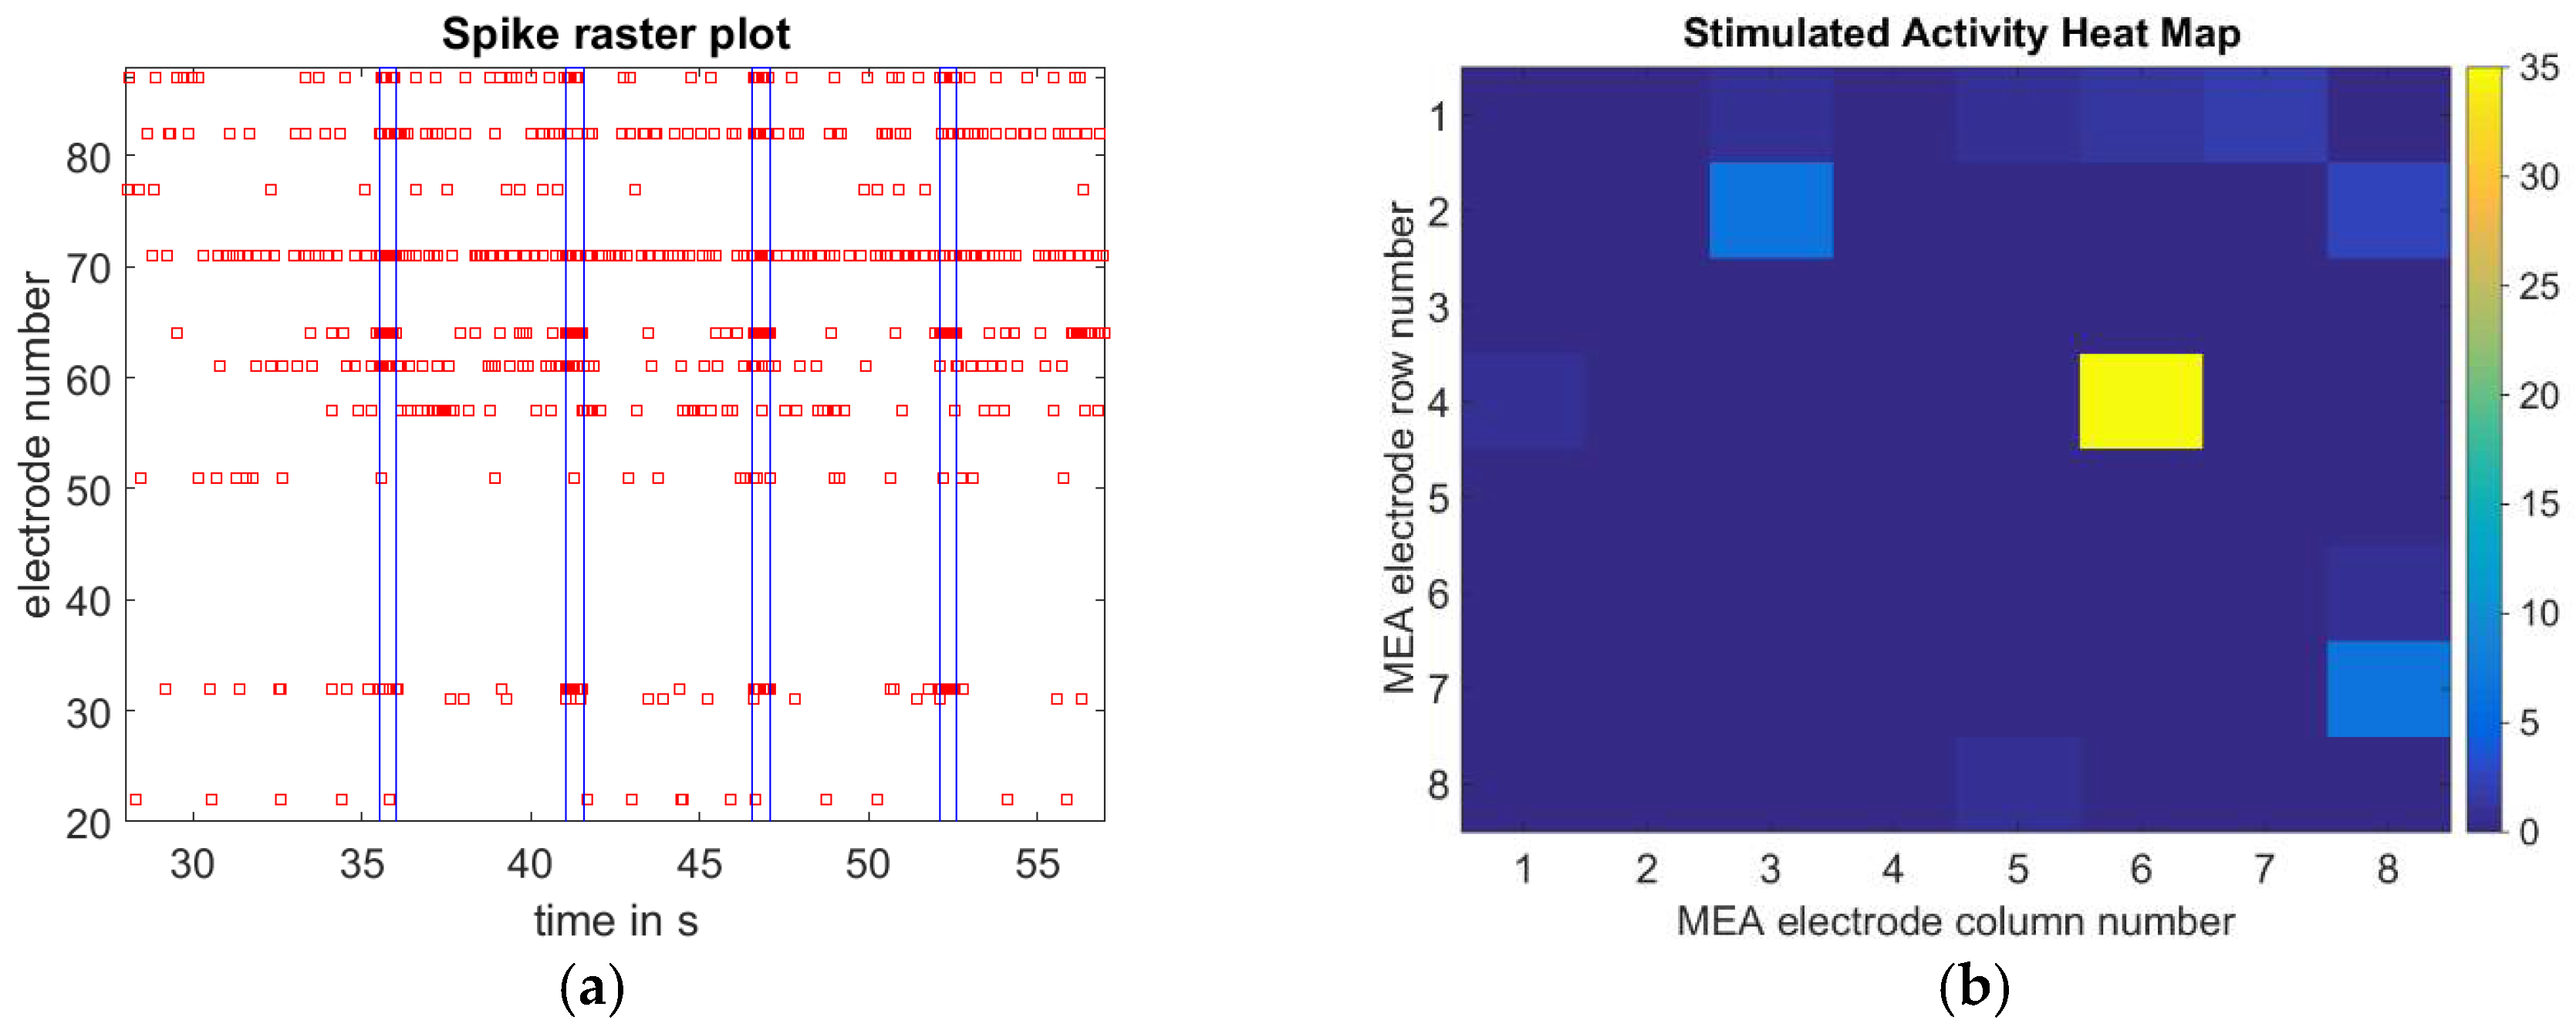
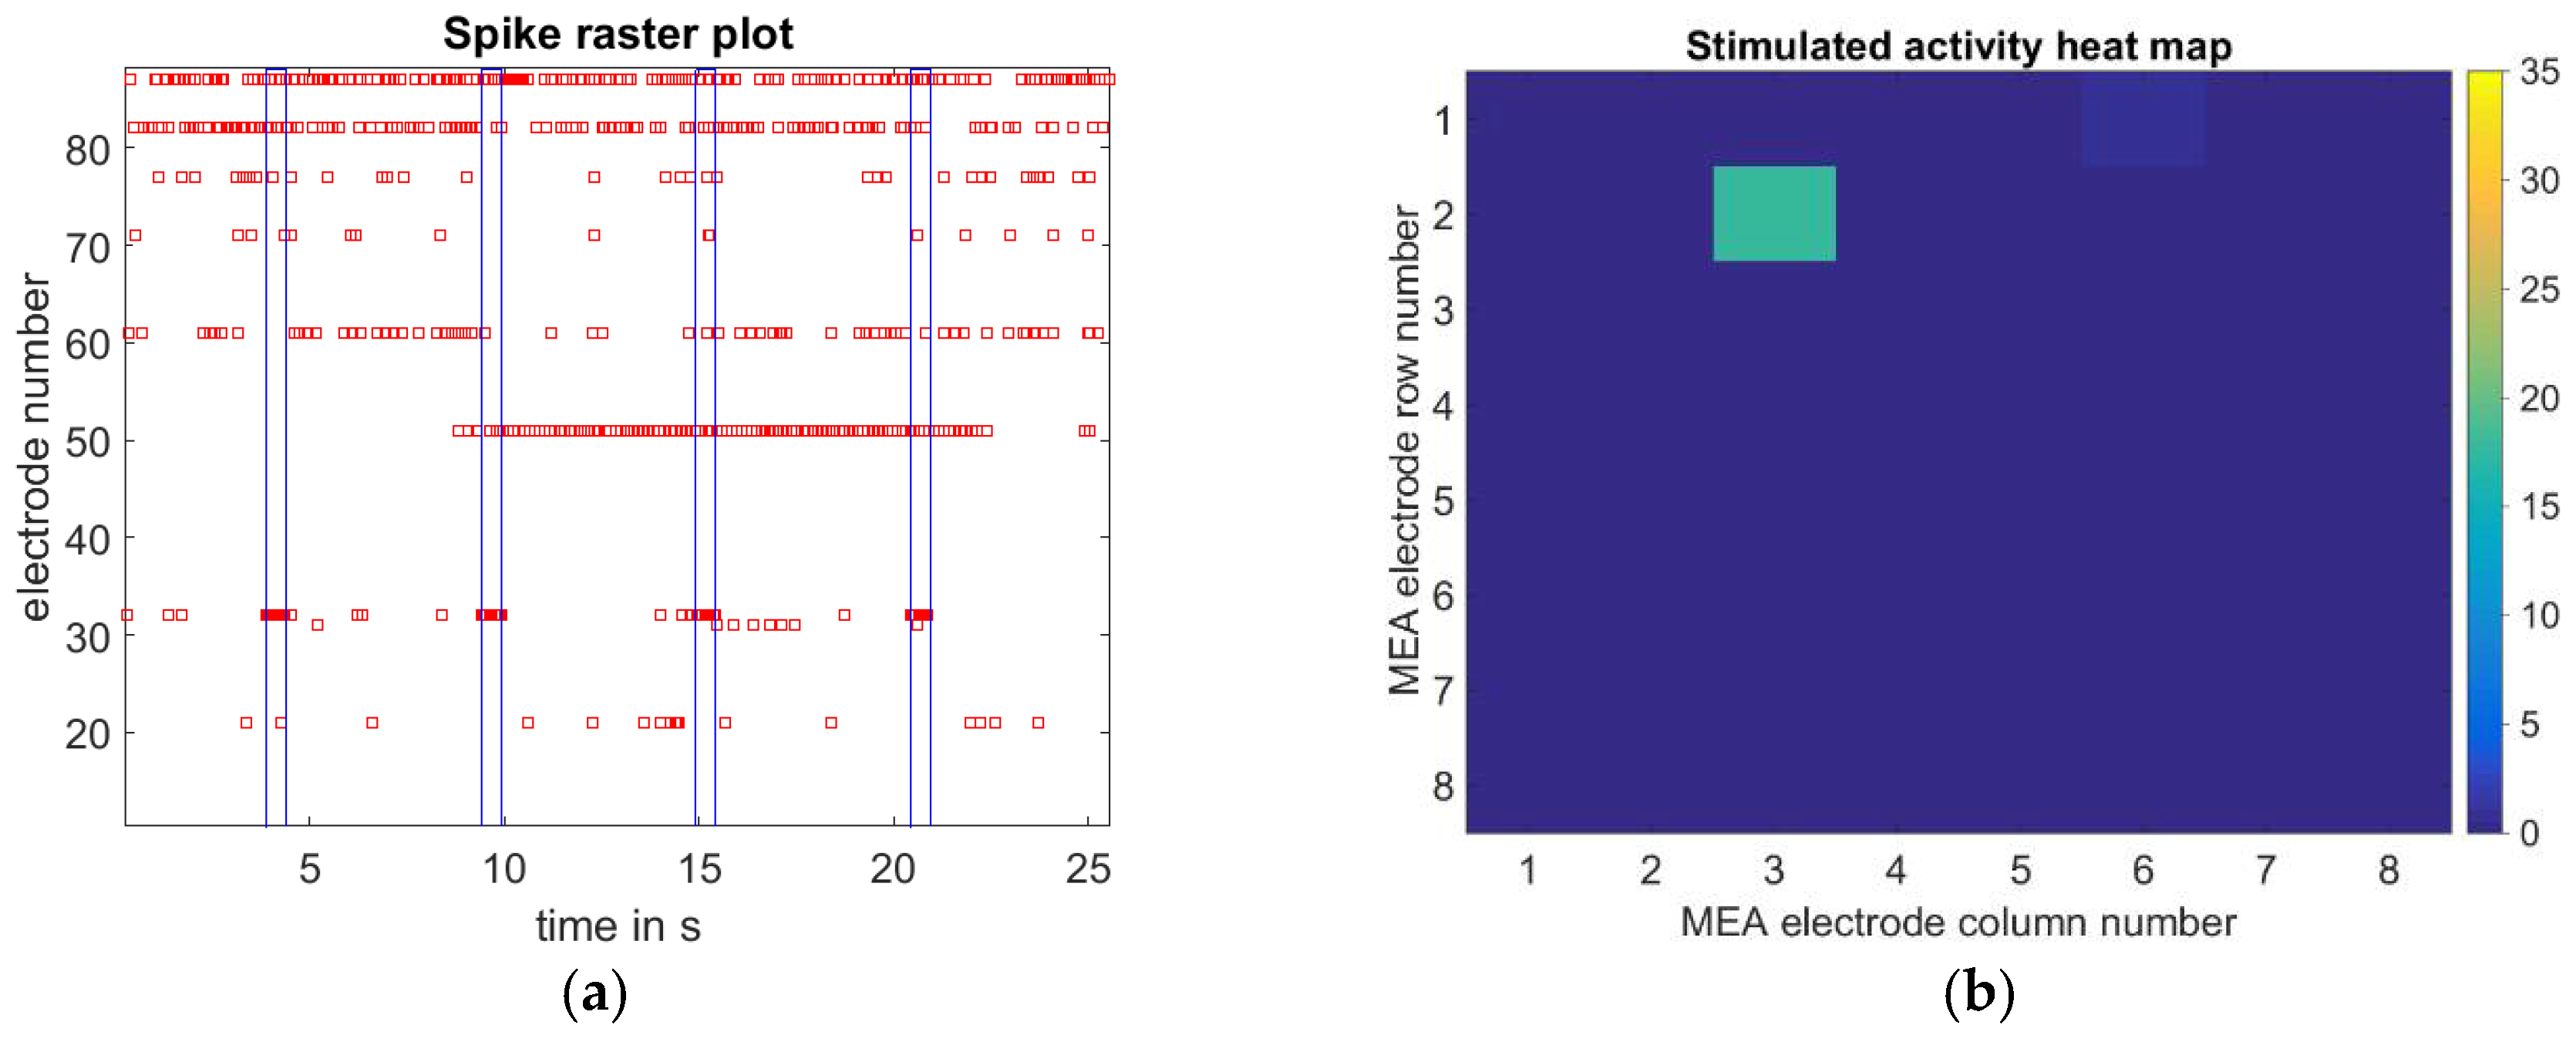
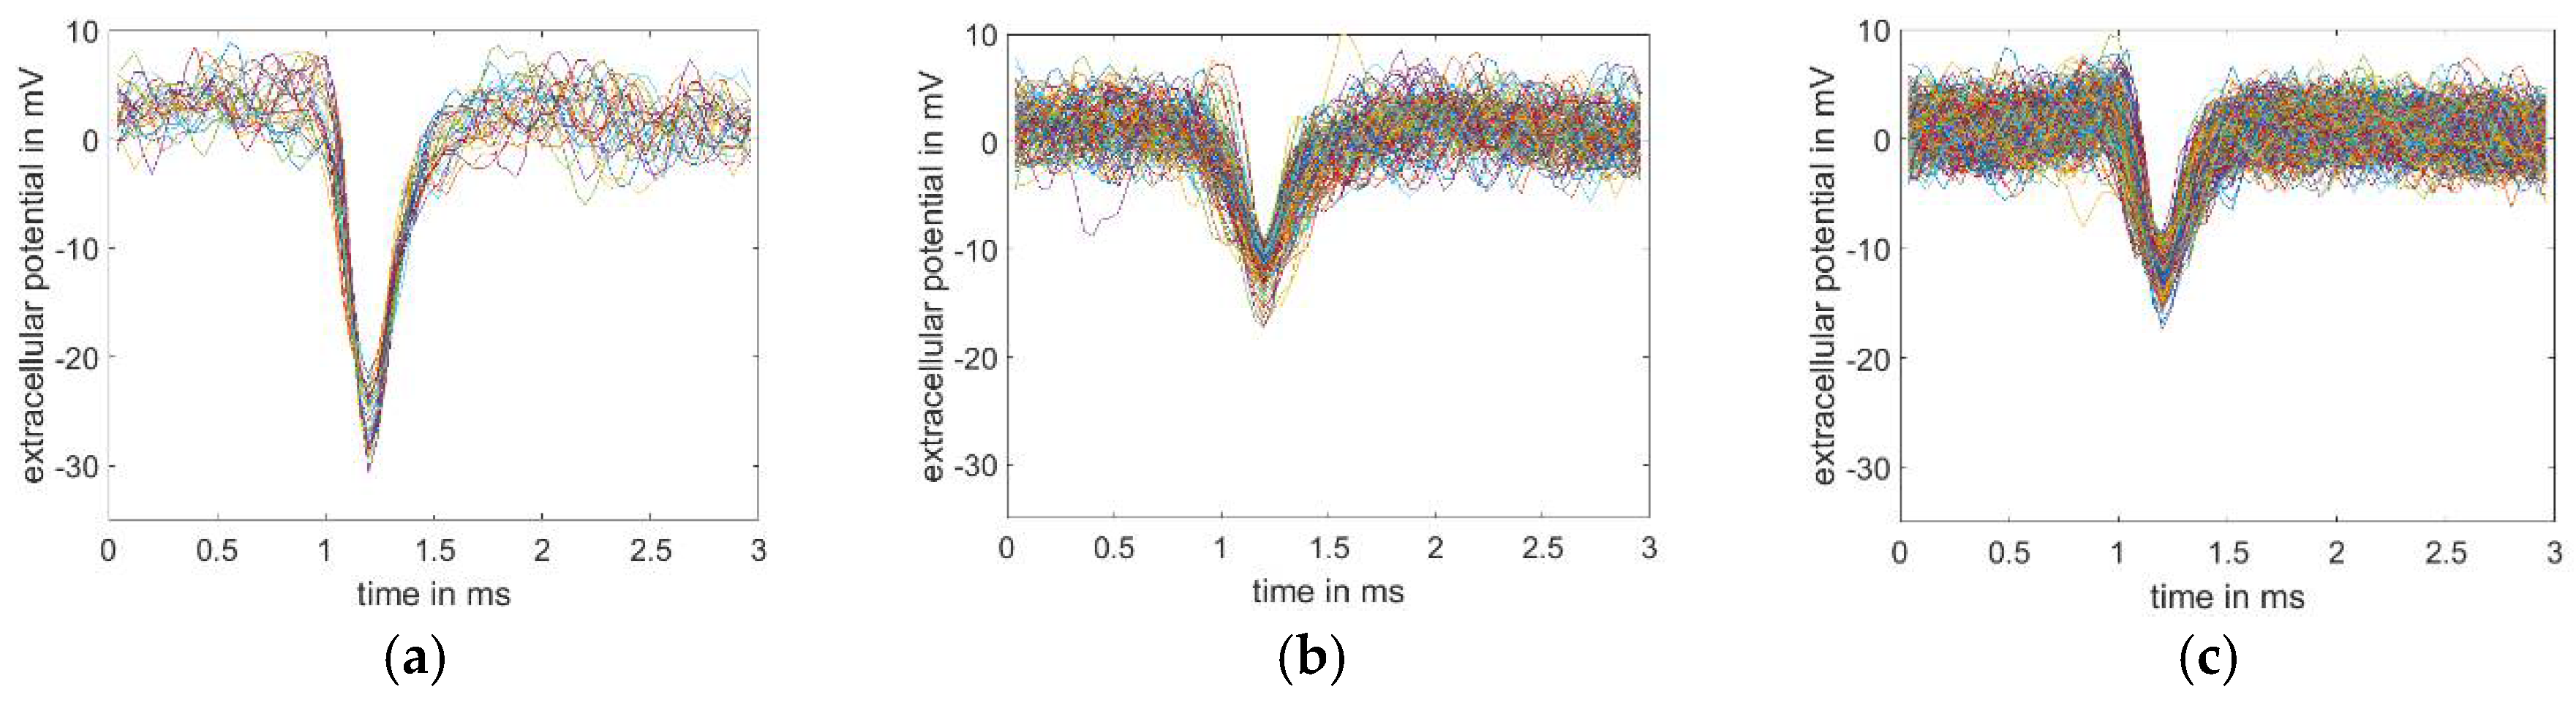
3.2. Single Cell Stimulation

Finally, to show that we are able to stimulate a single neuron with our setup, we conducted a preliminary stimulation experiment. For comparison, we first stimulated cells using wide-field stimulation with 488 nm LED light. We recorded the electrical response of all the electrodes with a temporal resolution of 25 kHz. Stimulation consisted of 10 pulses of 500 ms length, followed by a pause of 5 s, during which no illumination was present. Figure 8a shows a crop of the raster plot of this experiment, i.e., the recorded action potentials of all electrodes as a function of time. The 500 ms stimulation intervals are marked by the 4 blue vertical line pairs. The network under investigation exhibited a strong spontaneous, i.e., unstimulated, activity. The average activity that was recorded by the electrodes during stimulation is shown in Figure 8b as a heat map. Electrode 64 recorded the highest activity with 34 action potentials/s, other electrodes registering high activity are electrode 82 and 32. We then manually set our setup to stimulate a neuron close to electrode 32. The temporal parameters of the experiment were the same as with full-field stimulation. The corresponding raster plot and activity heat map are shown in Figure 9a,b, respectively. Electrode 32 recorded activity that was highly correlated with the stimulation pulses. The mean activity amounted to 17 spikes/s, which is a marked increase in activity as compared to 6.8 spikes/s during full-field stimulation. Apparently, no other electrode recorded activity correlated to the stimulation pulses.
To ascertain that only a single neuron was stimulated in the single-cell stimulation experiment, we performed spike sorting using Wave_Clus [41,42]. This revealed two spike clusters for electrode 32 during full field stimulation, which are depicted in Figure 10a,b. As expected, spike sorting of the signal of electrode 32 for the single cell stimulation revealed only one cluster in Figure 10c, demonstrating the ability to stimulate a single neuron using our holographic illumination.

4. Discussion

Our setup can provide multiple foci with a diameter down to about 8 µm. This does not meet the diffraction limit, a fact that we mainly attribute to spherical aberrations, and, in the case of multiple spots, to not meeting the sampling theorem of the superposed binary Fresnel zone plates. Using the same focal length, this problem can partly be solved either by using a smaller pixel pitch or by using more pixels and a higher magnification. Nevertheless, the focus size is well below the size of neuron soma and therefore suited for single cell stimulation. Employing two-photon excitation using femtosecond lasers is quite common as of today and provides higher lateral and axial resolution. The object of our future investigations, however, will be nearly two-dimensional neural networks that do not require ultrafast lasers. The power density in a single focus can be as high as 1.5 W/mm2. Regarding single cell stimulation, it can be estimated from the data presented in [40] that a minimum PBR r m i n of about 20 should be observed to ensure minimal unwanted optical stimulation. Using the fit function to our measured data of multiple focus generation, the maximum number of simultaneously stimulatable cells in future experiments can be estimated as n = 8200 r m i n 5.9 1.4 ~ 100 , at the full laser diode power of 60 mW.
We showed that the ferroelectric modulator is able to switch modulation patterns at a rate of up to 1.7 kHz, which allows for single cell stimulation times down to less than 600 µs. More importantly, multiple foci can be generated with delays that are down to this timescale. It has to be noted that temporal modulation can be done using the modulator only without the need for modulated light sources, which stresses the need for a fast modulator. Furthermore, a fast switching between wavelengths for the alternating stimulation and inhibition of neural ability becomes feasible. Regarding speed alone, DMD/MEMS-based modulators could be faster. However, using amplitude modulation such systems offer poor light efficiency, as discussed in [32] as well as a lower diffraction efficiency when compared to binary phase modulation, as demonstrated here in accordance with [34]. Our simulations indicate that for the generation of randomly positioned foci, an about six times higher PBR can be achieved using our system as compared to the amplitude modulation of DMD-based approaches. This is of higher importance for our future experiments employing simultaneous cell stimulation than multi-kHz stimulation speed. In our first experiments, we compared common full field optogenetic stimulation with single-cell optical stimulation and could observe a localized highly correlated and even increased response to the single-cell stimulation. Spike sorting of the respective electrode’s spike train shows we are able to stimulate a single neuron.
Future iterations of the setup could be used e.g., for subcellular stimulation by several means: According to Equation (4), either the magnification m or the pixel pitch Δ of the modulator could be decreased. Since the latter mainly depends on technological development, the former is the immediate option. However, the resulting reduction of the working distance has to be taken into account.
So far, experiments showing the effects of stimulating several individual input channels, i.e., dendrites, of neurons have only been done using patch-clamp techniques, which opened a new view on neurons as multi-threshold signal switches. Investigations along the same lines with more individually controlled inputs might offer new views on neural network connections and signal pathways, as well as into the forming of memory. This is especially true for human neural networks, whose investigation at the cellular level is lacking e.g., due to the hindrances in obtaining suitable samples. Here, stem cell derived human neural networks combined with optogenetics and our holographic stimulation setup offer a great opportunity for functional human brain disease modeling, which up to now was commonly modeled in animal networks, and is therefore of limited value for the understanding of the precise mechanisms in human brains. Our setup enables new research in this direction.

Author Contributions

J.W.C. and N.K. contributed to the initial idea of digital holographic display illumination in optogenetics. F.S. designed, built, programmed and characterized the setup and wrote the article. S.D.K. did the cell culturing and MEA recordings evaluation. F.S. and S.D.K. conducted the optogenetics experiments. V.B. provided the neural networks and the electrophysiology devices. J.W.C. supervised the whole research work. N.K., J.W.C. and V.B. revised the article.

Funding

The systems engineering of this research work was partially funded by DFG (Cz55-30).

Acknowledgments

J.W.C. is supported by a Reinhart Koselleck Project of the German Research Foundation (DFG). V.B. was supported by a Volkswagen Foundation Freigeist fellowship (A110720) and an ERC starting grant (678071—ProNeurons). The authors thank Lars Büttner and Kerstin Lenk for fruitful discussions.

Conflicts of Interest

The authors declare no conflict of interest.

References

  1. Betzel, R.F.; Byrge, L.; He, Y.; Goñi, J.; Zuo, X.-N.; Sporns, O. Changes in structural and functional connectivity among resting-state networks across the human lifespan. NeuroImage 2014, 102 Pt 2, 345–357. [Google Scholar] [CrossRef] [PubMed]
  2. Van den Heuvel, M.P.; Sporns, O. Rich-Club Organization of the Human Connectome. J. Neurosci. 2011, 31, 15775–15786. [Google Scholar] [CrossRef] [PubMed] [Green Version]
  3. Schröter, M.; Paulsen, O.; Bullmore, E.T. Micro-connectomics: Probing the organization of neuronal networks at the cellular scale. Nat. Rev. Neurosci. 2017, 18, 131–146. [Google Scholar] [CrossRef] [PubMed]
  4. Tijms, B.M.; Wink, A.M.; de Haan, W.; van der Flier, W.M.; Stam, C.J.; Scheltens, P.; Barkhof, F. Alzheimer’s disease: Connecting findings from graph theoretical studies of brain networks. Neurobiol. Aging 2013, 34, 2023–2036. [Google Scholar] [CrossRef] [PubMed]
  5. Sporns, O.; Chialvo, D.R.; Kaiser, M.; Hilgetag, C.C. Organization, development and function of complex brain networks. Trends Cogn. Sci. 2004, 8, 418–425. [Google Scholar] [CrossRef] [PubMed] [Green Version]
  6. Marom, S.; Shahaf, G. Development, learning and memory in large random networks of cortical neurons: Lessons beyond anatomy. Q. Rev. Biophys. 2002, 35, 63–87. [Google Scholar] [CrossRef] [PubMed]
  7. Nabavi, S.; Fox, R.; Proulx, C.D.; Lin, J.Y.; Tsien, R.Y.; Malinow, R. Engineering a memory with LTD and LTP. Nature 2014, 511, 348–352. [Google Scholar] [CrossRef] [PubMed] [Green Version]
  8. Attarwala, H. TGN1412: From Discovery to Disaster. J. Young Pharm. JYP 2010, 2, 332–336. [Google Scholar] [CrossRef] [PubMed] [Green Version]
  9. Jones, R.S.G.; da Silva, A.B.; Whittaker, R.G.; Woodhall, G.L.; Cunningham, M.O. Human brain slices for epilepsy research: Pitfalls, solutions and future challenges. J. Neurosci. Methods 2016, 260, 221–232. [Google Scholar] [CrossRef] [PubMed] [Green Version]
  10. Busskamp, V.; Lewis, N.E.; Guye, P.; Ng, A.H.M.; Shipman, S.L.; Byrne, S.M.; Sanjana, N.E.; Murn, J.; Li, Y.; Li, S.; et al. Rapid neurogenesis through transcriptional activation in human stem cells. Mol. Syst. Biol. 2014, 10, 760. [Google Scholar] [CrossRef] [PubMed]
  11. Lam, R.S.; Töpfer, F.M.; Wood, P.G.; Busskamp, V.; Bamberg, E. Functional Maturation of Human Stem Cell-Derived Neurons in Long-Term Cultures. PLoS ONE 2017, 12, e0169506. [Google Scholar] [CrossRef] [PubMed]
  12. Boyden, E.S.; Zhang, F.; Bamberg, E.; Nagel, G.; Deisseroth, K. Millisecond-timescale, genetically targeted optical control of neural activity. Nat. Neurosci. 2005, 8, 1263–1268. [Google Scholar] [CrossRef] [PubMed]
  13. Sakmann, B.; Neher, E. Patch Clamp Techniques for Studying Ionic Channels in Excitable Membranes. Annu. Rev. Physiol. 1984, 46, 455–472. [Google Scholar] [CrossRef] [PubMed]
  14. Staley, K.J.; Otis, T.S.; Mody, I. Membrane properties of dentate gyrus granule cells: Comparison of sharp microelectrode and whole-cell recordings. J. Neurophysiol. 1992, 67, 1346–1358. [Google Scholar] [CrossRef] [PubMed]
  15. Shahaf, G.; Marom, S. Learning in Networks of Cortical Neurons. J. Neurosci. 2001, 21, 8782–8788. [Google Scholar] [CrossRef] [PubMed]
  16. Zhang, F.; Wang, L.-P.; Boyden, E.S.; Deisseroth, K. Channelrhodopsin-2 and optical control of excitable cells. Nat. Methods 2006, 3, 785–792. [Google Scholar] [CrossRef] [PubMed]
  17. Busskamp, V.; Duebel, J.; Balya, D.; Fradot, M.; Viney, T.J.; Siegert, S.; Groner, A.C.; Cabuy, E.; Forster, V.; Seeliger, M.; et al. Genetic Reactivation of Cone Photoreceptors Restores Visual Responses in Retinitis Pigmentosa. Science 2010, 329, 413–417. [Google Scholar] [CrossRef] [PubMed]
  18. Hernandez, V.H.; Gehrt, A.; Reuter, K.; Jing, Z.; Jeschke, M.; Mendoza Schulz, A.; Hoch, G.; Bartels, M.; Vogt, G.; Garnham, C.W.; et al. Optogenetic stimulation of the auditory pathway. J. Clin. Investig. 2014, 124, 1114–1129. [Google Scholar] [CrossRef] [PubMed]
  19. Tzur, A.; Kafri, R.; LeBleu, V.S.; Lahav, G.; Kirschner, M.W. Cell Growth and Size Homeostasis in Proliferating Animal Cells. Science 2009, 325, 167–171. [Google Scholar] [CrossRef] [PubMed] [Green Version]
  20. Wang, Y.T.; Gu, S.; Ma, P.; Watanabe, M.; Rollins, A.M.; Jenkins, M.W. Optical stimulation enables paced electrophysiological studies in embryonic hearts. Biomed. Opt. Express 2014, 5, 1000–1013. [Google Scholar] [CrossRef] [PubMed]
  21. Packer, A.M.; Russell, L.E.; Dalgleish, H.W.P.; Häusser, M. Simultaneous all-optical manipulation and recording of neural circuit activity with cellular resolution in vivo. Nat. Methods 2015, 12, 140–146. [Google Scholar] [CrossRef] [PubMed]
  22. Packer, A.M.; Peterka, D.S.; Hirtz, J.J.; Prakash, R.; Deisseroth, K.; Yuste, R. Two-photon optogenetics of dendritic spines and neural circuits. Nat. Methods 2012, 9, 1202–1205. [Google Scholar] [CrossRef] [PubMed] [Green Version]
  23. Prakash, R.; Yizhar, O.; Grewe, B.; Ramakrishnan, C.; Wang, N.; Goshen, I.; Packer, A.M.; Peterka, D.S.; Yuste, R.; Schnitzer, M.J.; et al. Two-photon optogenetic toolbox for fast inhibition, excitation and bistable modulation. Nat. Methods 2012, 9, 1171–1179. [Google Scholar] [CrossRef] [PubMed] [Green Version]
  24. Papagiakoumou, E. Optical developments for optogenetics. Biol. Cell 2013, 105, 443–464. [Google Scholar] [CrossRef] [PubMed]
  25. Bañas, A.; Palima, D.; Villangca, M.; Aabo, T.; Glückstad, J. GPC Light Shaper for speckle-free one- and two-photon contiguous pattern excitation. Opt. Express 2014, 22, 5299–5311. [Google Scholar] [CrossRef] [PubMed]
  26. Papagiakoumou, E.; Anselmi, F.; Bègue, A.; de Sars, V.; Glückstad, J.; Isacoff, E.Y.; Emiliani, V. Scanless two-photon excitation of channelrhodopsin-2. Nat. Methods 2010, 7, 848. [Google Scholar] [CrossRef] [PubMed]
  27. Rodrigo, P.J.; Daria, V.R.; Glückstad, J. Four-dimensional optical manipulation of colloidal particles. Appl. Phys. Lett. 2005, 86, 074103. [Google Scholar] [CrossRef]
  28. Czarske, J.W.; Haufe, D.; Koukourakis, N.; Büttner, L. Transmission of independent signals through a multimode fiber using digital optical phase conjugation. Opt. Express 2016, 24, 15128–15136. [Google Scholar] [CrossRef] [PubMed]
  29. Koukourakis, N.; Fregin, B.; König, J.; Büttner, L.; Czarske, J.W. Wavefront shaping for imaging-based flow velocity measurements through distortions using a Fresnel guide star. Opt. Express 2016, 24, 22074–22087. [Google Scholar] [CrossRef] [PubMed]
  30. Papagiakoumou, E.; de Sars, V.; Oron, D.; Emiliani, V. Patterned two-photon illumination by spatiotemporal shaping of ultrashort pulses. Opt. Express 2008, 16, 22039–22047. [Google Scholar] [CrossRef] [PubMed]
  31. Sun, B.; Salter, P.S.; Roider, C.; Jesacher, A.; Strauss, J.; Heberle, J.; Schmidt, M.; Booth, M.J. Four-dimensional light shaping: Manipulating ultrafast spatiotemporal foci in space and time. Light Sci. Appl. 2018, 7, 17117. [Google Scholar] [CrossRef]
  32. Reutsky-Gefen, I.; Golan, L.; Farah, N.; Schejter, A.; Tsur, L.; Brosh, I.; Shoham, S. Holographic optogenetic stimulation of patterned neuronal activity for vision restoration. Nat. Commun. 2013, 4, 1509. [Google Scholar] [CrossRef] [PubMed] [Green Version]
  33. Klapper, S.D.; Sauter, E.J.; Swiersy, A.; Hyman, M.A.E.; Bamann, C.; Bamberg, E.; Busskamp, V. On-demand optogenetic activation of human stem-cell-derived neurons. Sci. Rep. 2017, 7, 14450. [Google Scholar] [CrossRef] [PubMed] [Green Version]
  34. Vellekoop, I.M. Feedback-based wavefront shaping. Opt. Express 2015, 23, 12189–12206. [Google Scholar] [CrossRef] [PubMed]
  35. Cottrell, D.M.; Davis, J.A.; Hedman, T.R.; Lilly, R.A. Multiple imaging phase-encoded optical elements written as programmable spatial light modulators. Appl. Opt. 1990, 29, 2505–2509. [Google Scholar] [CrossRef] [PubMed]
  36. Cao, W.-B.; Ma, J.-S.; Su, P.; Liang, X.-T. Binary hologram generation based on discrete wavelet transform. Opt. Int. J. Light Electron Opt. 2016, 127, 558–561. [Google Scholar] [CrossRef]
  37. Tsang, P.W.M.; Poon, T.-C. Novel method for converting digital Fresnel hologram to phase-only hologram based on bidirectional error diffusion. Opt. Express 2013, 21, 23680–23686. [Google Scholar] [CrossRef] [PubMed]
  38. Han, X. In Vivo Application of Optogenetics for Neural Circuit Analysis. ACS Chem. Neurosci. 2012, 3, 577–584. [Google Scholar] [CrossRef] [PubMed] [Green Version]
  39. Ayling, O.G.S.; Harrison, T.C.; Boyd, J.D.; Goroshkov, A.; Murphy, T.H. Automated light-based mapping of motor cortex by photoactivation of channelrhodopsin-2 transgenic mice. Nat. Methods 2009, 6, 219–224. [Google Scholar] [CrossRef] [PubMed]
  40. Lin, J.Y.; Lin, M.Z.; Steinbach, P.; Tsien, R.Y. Characterization of Engineered Channelrhodopsin Variants with Improved Properties and Kinetics. Biophys. J. 2009, 96, 1803–1814. [Google Scholar] [CrossRef] [PubMed] [Green Version]
  41. Quiroga, R.Q.; Nadasdy, Z.; Ben-Shaul, Y. Unsupervised Spike Detection and Sorting with Wavelets and Superparamagnetic Clustering. Neural Comput. 2004, 16, 1661–1687. [Google Scholar] [CrossRef] [PubMed] [Green Version]
  42. jm303 Spike Sorting—University of Leicester. Available online: https://www2.le.ac.uk/departments/engineering/research/bioengineering/neuroengineering-lab/spike-sorting (accessed on 22 June 2018).
Figure 1. Schematic drawing of the setup. Laser: 450 nm laser diode. L1–L3: Lenses. BS: Non-polarizing beam splitter. Spatial light modulator (SLM): Ferroelectric liquid-crystal on silicon spatial light modulator. LP: Linear polarizer. S: Sample. Only the SLM is used for focusing on the sample.
Applsci 08 01180 g001
Figure 2. (a) Turning polarization modulation into phase modulation. The incident polarization is rotated by the ferroelectric liquid crystal on silicon spatial light modulator (FSLM). An appropriately aligned polarizer then projects both the modulated and the unmodulated light onto the same polarization axis but with opposite sign, resulting in a phase modulation of π . This also ensures that interference between modulated and unmodulated light is possible. (b) Simulated intensity of modulated and unmodulated light transmitted through the polarizer in dependence of the polarizer angle with respect to the incident light, following a c o s 2 -distribution. The area indicated by the dotted yellow line shows all polarizer rotation angles allowing for opposing polarizations and therefore for an effective phase polarization of π . A maximum interference contrast can be expected for equal intensities, here at 25% of the original.
Applsci 08 01180 g002
Figure 3. Scheme of binary hologram generation. (a) Centers of desired focus positions mapped to the SLM (Simulation). (b) Fresnel zone plate for focusing light to a single point at the desired distance. (c) Phase of the convolution of the complex-valued functions depicted in (a,b), i.e., of the desired complex-valued hologram. (d) Binary phase hologram as a result of binarizing the complex hologram in (c).
Applsci 08 01180 g003
Figure 4. Fluorescence image of the electrode area of a multielectrode array with an adherent random network of human stem-cell-derived neurons. The inset in the top right-hand corner exemplarily shows a magnified electrode as well as the maximum and typical signal recording distance of a single electrode as indicated by the concentric white circles. A single electrode can therefore record extracellular electrical signals from more than one neuron. The bright area at the top of the picture is a folding region of detached neurons. Scale bar, 400 µm.
Applsci 08 01180 g004
Figure 5. Cross-sections of a single focus observed using a 20× objective. The fits reveal an average focus diameter of about 8 µm.
Applsci 08 01180 g005
Figure 6. Raster scan of an area of (1.5 × 1.5) µm at 961 positions. The raster positions are indicated in (a). The time taken to scan the positions is depicted in (b). The overall scan takes 0.568 s, which results in a framerate of 1.7 kHz or a temporal resolution of 0.59 ms.
Applsci 08 01180 g006
Figure 7. Mean peak-to-background ratio in dependence of the number of foci created on the sample. (a) Comparison of simulated binary phase-only modulation as with our FSLM and simulated binary amplitude modulation as with a digital micromirror devices (DMD). On average, binary phase-only modulation yields an about 6 times higher PBR as well as a lower increase in background noise with higher spot number as indicated by the lower exponent of n . (b) Measured Data using the fast FSLM.
Applsci 08 01180 g007
Figure 8. (a) Section of the raster plot for full-field stimulation. Red dots show the action potentials recorded by all electrodes. The blue vertical lines indicate the time windows of 500 ms full field optical stimulation. A high spontaneous, i.e., unstimulated activity is present in the network, stimulation leads to increased activity on some electrodes. (b) Full field stimulation activity heat map showing the mean per-electrode activity in spikes per second during optical stimulation.
Applsci 08 01180 g008
Figure 9. (a) Raster plot single-cell stimulation. (b) Single-cell stimulation activity heat map.
Applsci 08 01180 g009
Figure 10. Spike sorting of the spike train of electrode 32 during full field stimulation resulted in two clusters (a,b). Holographic single-cell stimulation revealed only a single cluster (c).
Applsci 08 01180 g010

