Article

Effect of the Surface Chemical Composition and of Added Metal Cation Concentration on the Stability of Metal Nanoparticles Synthesized by Pulsed Laser Ablation in Water

by
Helena Mateos
1,*,
Rosaria A. Picca
1,
Antonia Mallardi
2,
Marcella Dell’Aglio
3,
Alessandro De Giacomo
1,3,
Nicola Cioffi
1 and
Gerardo Palazzo
1,3,*
1
Department of Chemistry and CSGI (Center for Colloid and Surface Science), University of Bari, via Orabona 4, 70125 Bari, Italy
2
CNR-IPCF (National Research Council of Italy—Istituto per i Processi Chimico Fisici), c/o Chemistry Department, Via Orabona 4, 70125 Bari, Italy
3
CNR-NANOTEC (National Research Council of Italy—Institute of Nanotecnology), c/o Chemistry Department, Istituto di Nanotecnologia, Via Orabona 4, 70125 Bari, Italy
*
Authors to whom correspondence should be addressed.
Appl. Sci. 2020, 10(12), 4169; https://doi.org/10.3390/app10124169
Submission received: 19 April 2020 / Revised: 13 June 2020 / Accepted: 14 June 2020 / Published: 17 June 2020
(This article belongs to the Section Nanotechnology and Applied Nanosciences)

Abstract

:
Metal nanoparticles (NPs) made of gold, silver, and platinum have been synthesized by means of pulsed laser ablation in liquid aqueous solution. Independently from the metal nature, all NPs have an average diameter of 10 ± 5 nm. The ζ-potential values are: −62 ± 7 mV for gold, −44 ± 2 mV for silver and −58 ± 3 for platinum. XPS analysis demonstrates the absence of metal oxides in the case of gold and silver NPs. In the case of platinum NPs, 22% of the particle surface is ascribed to platinum oxidized species. This points to a marginal role of the metal oxides in building the negative charge that stabilizes these colloidal suspensions. The investigation of the colloidal stability of gold NPs in the presence of metal cations shows these NPs can be destabilized by trace amounts of selected metal ions. The case of Ag+ is paradigmatic since it is able to reduce the NP ζ-potential and to induce coagulation at concentrations as low as 3 μM, while in the case of K+ the critical coagulation concentration is around 8 mM. It is proposed that such a huge difference in destabilization power between monovalent cations can be accounted for by the difference in the reduction potential.

Graphical Abstract

1. Introduction

It is difficult to overestimate the importance of nanoparticles (NP) in the scientific research scene of the latest 20 years. They have been the focus of much research and have found applications in many fields, such as sensing and biosensing, nanomedicine, and chemical catalysis, just to cite a few [1,2,3,4,5,6,7]. Chemical synthetic strategies to produce metal nanoparticles of controlled sizes require the use of capping agents to prevent uncontrolled growth [8], but also to avoid their coagulation [9]. There are, however, applications where the presence of chemicals adsorbed on the surface of the NP is detrimental, which can also be true from an environmental point of view. In this respect, pulsed laser ablation in liquid (PLAL) represents a promising approach to the synthesis of nanostructured materials. In recent times, PLAL has been employed for the preparation of several metals and semiconductor materials in different liquid media [10]. During PLAL, a small amount of material is removed from a solid target submerged in a liquid by irradiating it with a laser beam. The interaction of the radiation with matter induces the breakdown of the submerged target that is characterized by visible plasma emission and the production of shock waves and cavitation bubbles. The atomized metal nucleates and grows in the plasma environment during the first few hundreds of nanoseconds. In the following microseconds, the NPs will rearrange in the cavitation bubble and eventually, be released in the surrounding liquid medium [11]. The advantages of PLAL as an alternative method of preparation of NPs generation has prompted a large body of fundamental studies on the nanoparticle growth within the laser-induced plasma.
At variance, several aspects of physics from the resulting NPs solution are often overlooked in the literature. In particular, the origin of the high colloidal stability of NPs prepared by PLAL is puzzling. Noble metal colloids (Au, Ag, Pt), especially, have high Hamaker constant values and, as a consequence, are subject of strong attractive inter-particle forces. Being free from capping agents or surfactants, NPs synthesized by PLAL cannot rely on repulsive steric interactions to prevent coagulation. Experimentally, noble metal NPs ablated in water are characterized by a large negative ζ-potential and, therefore, their stability should be electrostatic in nature. Indeed, they can easily be made unstable and coagulated by increasing the solution’s ionic strength. However, the origin of the negative ζ-potential is less obvious. The case of the gold NPs is archetypal. Metallic gold (Au0) is a noble metal and, therefore, inert under most conditions. Nonetheless, gold NPs (AuNPs) ablated in water have a large negative ζ-potential. Several authors attribute the negative ζ-potential observed in water to partially oxidized gold species (AuO and AuCO3) onto the surface of the “naked” particles [10,12]. On the other hand, there are many examples where the presence of gold surface oxides is not detected (a comprehensive survey of the results in the literature is discussed in the recent paper by Lévy and co-workers [13]). Currently, the origin of those negative charges is yet a matter of debate [14,15,16]. Recently, based on several experimental pieces of evidence, our group has proposed that a significant portion of the negative charge sitting on the gold nanoparticle should be due to the presence of excess electrons formed within the plasma phase and “trapped” by the nanoparticle [16]. As a matter of fact, the nature of particles electron charging in the plasma phase, as well as the role of the excess electrons on the NPs surface in the cavitation bubble have been recently investigated both with experiments and models [17,18]. In order to understand the impressive stability of the NPs produced by nanosecond PLAL, it is important to investigate if the excess electrons that characterize the main stage of the PLAL process, can also have a role in the stability after their release in solution. Since then, there have been conflicting developments. One of the most convincing experimental pieces of evidence (the destabilization of the NP upon grounding the solution with a metallic wire) was invalidated by the effect of trace amounts of copper ions. On the other hand, theoretical modeling indicates a crucial role of “trapped” electrons on the NPs growth during the PLAL and predicts the eventual presence of ~10–20 excess electrons on the NPs released in the aqueous medium, depending on the particle size [19]. It is worth considering this number accounts for the experimental ζ-potential measured in water ~−70 mV. Thus, there is a more solid theoretical background in support of the “extra electrons” hypothesis, but a smaller set of proofs in favor of it.
Intending to investigate the stability of PLAL-produced NPs, and of discussing the potential role of the excess of electrons on NPs surface after the nsPLAL process, a systematic study on the physical characteristics and chemical stability of the different metal NPs is presented. NPs made of gold, silver, and platinum have been synthesized by PLAL using conditions that allow the formation of different surface amounts of metal oxides. The surface composition was assessed by XPS and compared with the experimentally determined NP size and ζ-potential. The data analysis reveals that the presence of oxidized metal is uncorrelated with the charge density of the particles. This finding is in agreement with a previous study [16], where the stability of gold NPs was investigated as a function of pH. In that work, the main effect of the solution pH was attributed to the measured ζ-potential, which becomes more negative by roughly −30 mV when passing from pH = 3 to pH = 10. In the case of AuNPs, this result excludes that the NPs are stabilized by gold oxides that, having pKas close to 4, should have a positive ζ-potential at pH < 4. To further investigate the stability of the NPs produced by PLAL, and to support the systematic observation of the NPs characteristics, in this contribution, the effect of metal ions as oxidants in the colloidal solution is explored. The analysis of the results is consistent with the presence of electrons that can reduce metal ions.

2. Materials and Methods

2.1. NP Synthesis and Preliminary Characterization

Colloidal particles in aqueous solution unavoidably acquire electrical charge. On materials that are not intrinsically charged, these charges can be generated by (i) adsorption of charged species in solution; (ii) titratable groups that are present on the surface, making their charge pH-dependent.
The experiments here described have been designed to test the existence of titratable oxidized metal species (mechanism ii above). In order to keep the ion adsorption constant of mechanism (i), the ionic strength was fixed to a low and constant value. For this reason, the metal NPs in this work were synthesized by laser ablation in aqueous solutions of KCl at a fixed concentration of 10−4 M.
To produce metal NPs by LAL, an ns NdYAG (Quanta System PILS-GIANT) laser was focused on the metal target located on the bottom of a cuvette filled with 3 mL of 10−4 M KCl aqueous solution for all the metal targets. In the case of the experiments described in Section 3.3, to prevent the precipitation of silver ions, the gold target was ablated in a solution of 10−4 M KNO3 aqueous solution. The laser, with a nominal pulse duration of 8 ns, operates with a 1064 nm laser wavelength, with a fluence of 64 J/cm2 and a laser frequency of 10 Hz. The laser beam was focused by using a 5 cm focal lens and the focal plane of the laser beam was put inside the target, in order to obtain a laser crater on the target surface with a diameter of 1 ± 0.2 mm. The laser ablation time was 1 min for each solution. Immediately after the production, the NPs solutions were spun for 1 min on a benchtop centrifuge to eliminate some debris of the ablation. The concentrations of NP solutions (of the order of 3–8 nM) are listed in Table 1.
The concentration of AuNPs and AgNPs has been evaluated from the visible spectrum of the surface plasmon resonance (SPR) as described in [20]. The concentration of PtNP has been calculated from the total amount of Pt (determined by Flame Atomic Absorption) and the average size determined by TEM.
The metal targets were purchased from Kurt J. Lesker Company. Gold and platinum targets were cleaned using aluminium oxide 150 mesh. The cleaning was repeated three times, diluting the alumina each time with increasing amounts of water. After each cleaning step (5 min) with alumina, the target was washed 15 min in an ultrasound bath in Milli-Q water. Finally, the target was exposed to the flame of a Bunsen until it reached a white color.
After each cleaning step, 5 min with alumina, the silver target was repeatedly cleaned three times with sodium bicarbonate, followed by a 15-min ultrasound bath in Mili-Q water. This target was not exposed to any flame.
The visible spectrum of the SPR of AuNPs and AgNPs was registered using an Agilent 8453 UV–Visible spectrophotometer. Using the absorbance values and the calibration described elsewhere [20] it is possible to estimate the NP diameter and the NP concentration. Eventually, the solutions of ablated NPs were diluted to a NP concentration of 1.5 nM with KCl 10−4 M for characterization by dynamic light scattering (DLS) and by Laser Doppler Electrophoresis (LDE) measurements using a Zetasizer-Nano ZS from Malvern Instruments. Instrumental conditions are as in [21] (DLS) and [22] (LDE); the ζ-potential was subsequently evaluated from the electrophoretic mobility measured by LDE according to the Hückel approximation.

2.2. Electron Microscopy

Colloidal samples for TEM characterization were directly deposited onto carbon-coated Cu grids (300 mesh, Agar Scientific). All samples were observed at 120 kV, with an FEI TecnaiT12 TEM.
The size distribution of the NPs was obtained by measuring the diameter of at least 400 NPs using ImageJ software. The pictures were processed to obtain binary images, to which the threshold was adjusted to visualize the NPs.

2.3. XPS

The colloids were analyzed by XPS within 24 h from their synthesis.
The samples were prepared by depositing 40 μL of colloids on a clean Si substrate and dried under vacuum. Loading in the spectrometer was rapidly carried out, thus avoiding contact with the ambient atmosphere. XPS analysis was performed using a PHI Versaprobe II spectrometer. The spectrometer is equipped with a monochromatic Al Kα source (1486.6 eV), and charge neutralization was constantly applied during the analysis. A large XPS analysis area of 200 × 1400 μm2 was performed. XPS characterization was performed according to [23]. C1s, O1s, Si2p, Cl2p, Au4f, Ag3d, AgM4,5N45N45, Pt4f regions were acquired. The elemental composition analysis was performed with the software MultiPak™ (v. 9.5.0, PHI-ULVAC). Peak fitting procedures were performed using the software CasaXPS™ (v. 2.3.18). The binding energy (BE) scale was corrected taking as reference the aliphatic component of C1s at 284.8 eV. Shirley background was used for the fitting. As a general rule, oxide species were fitted with symmetric and elemental signals with asymmetric peaks.

3. Results and Discussion

The resulting NPs have been first characterized in solution by means of DLS and LDE. Gold and silver NPs have a surface plasmon in the visible region, so they were also characterized using optical absorbance spectroscopy. Subsequently, they were deposited on solid silicon and electron microscopy grid for the XPS and TEM investigations, respectively. The data are summarized in Table 2. The nanoparticle solutions appear to be stable with respect to changes in size (probed by DLS) and charge (probed by LDE) and, in the case of gold and silver, with respect to the absorbance spectrum up to three months.
The typical surface compositions of NPs, as determined by XPS, are reported in Table 3. C, O, Si, K, Cl, and the specific metal of NPs are found. Limited amounts of salt were detected. Carbon in the order of 20–30%, as well as organic oxygen, can be ascribed to contamination in the XPS analysis chamber. Oxygen is also attributed to a native oxide layer on silicon (substrate for NPs deposition). According to the experimental protocol adopted for sample preparation and XPS analysis, oxidation due to air can be excluded.

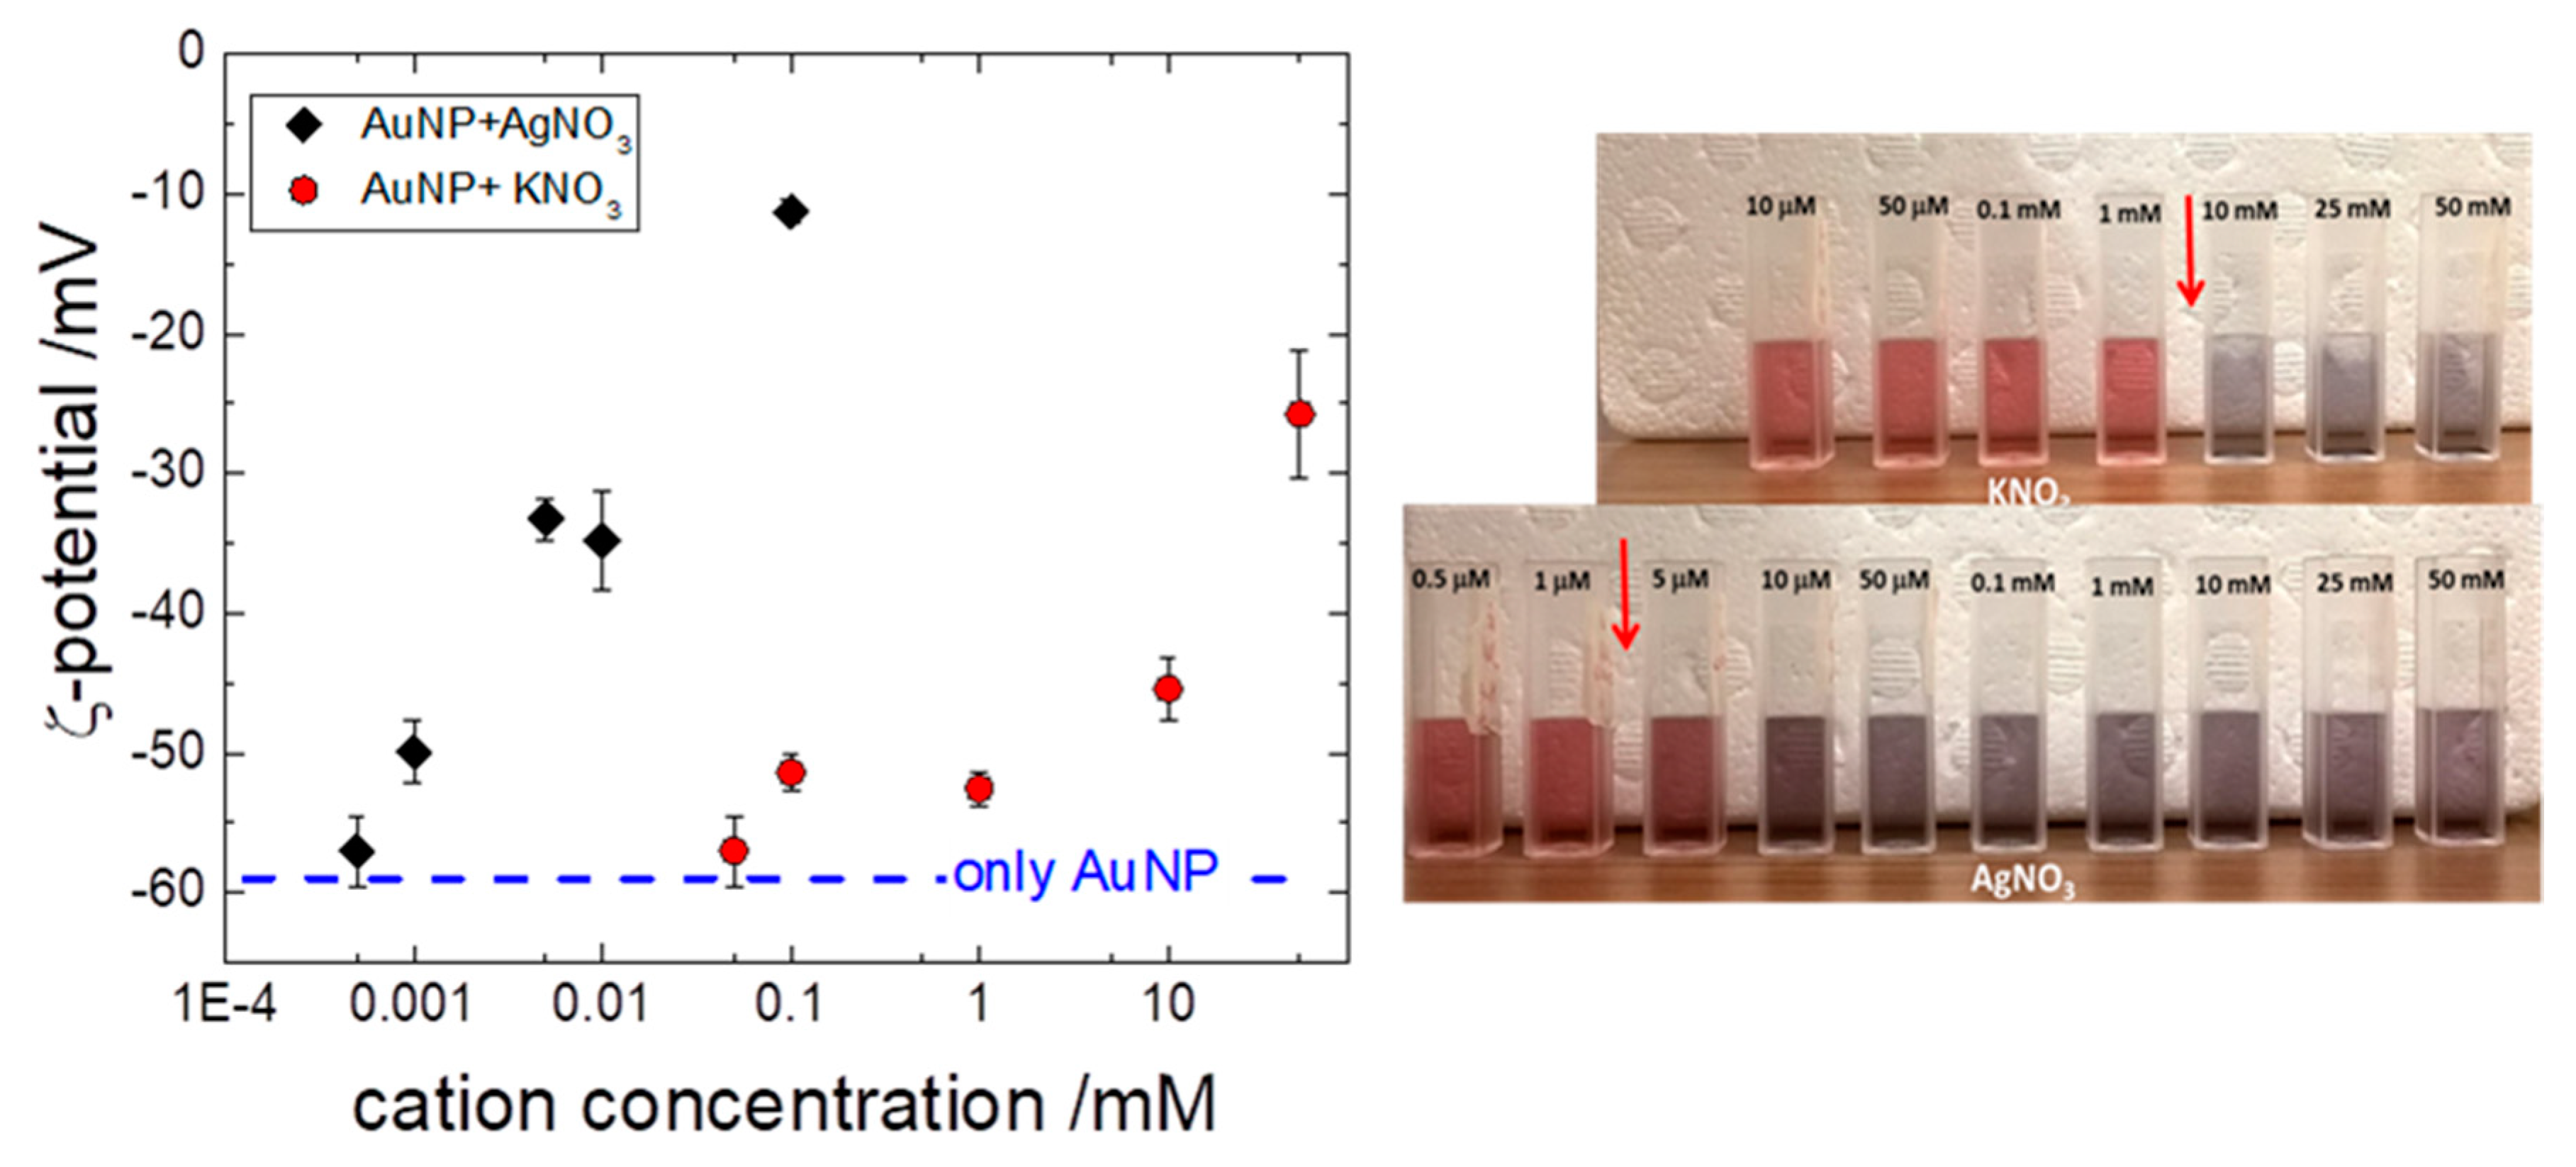
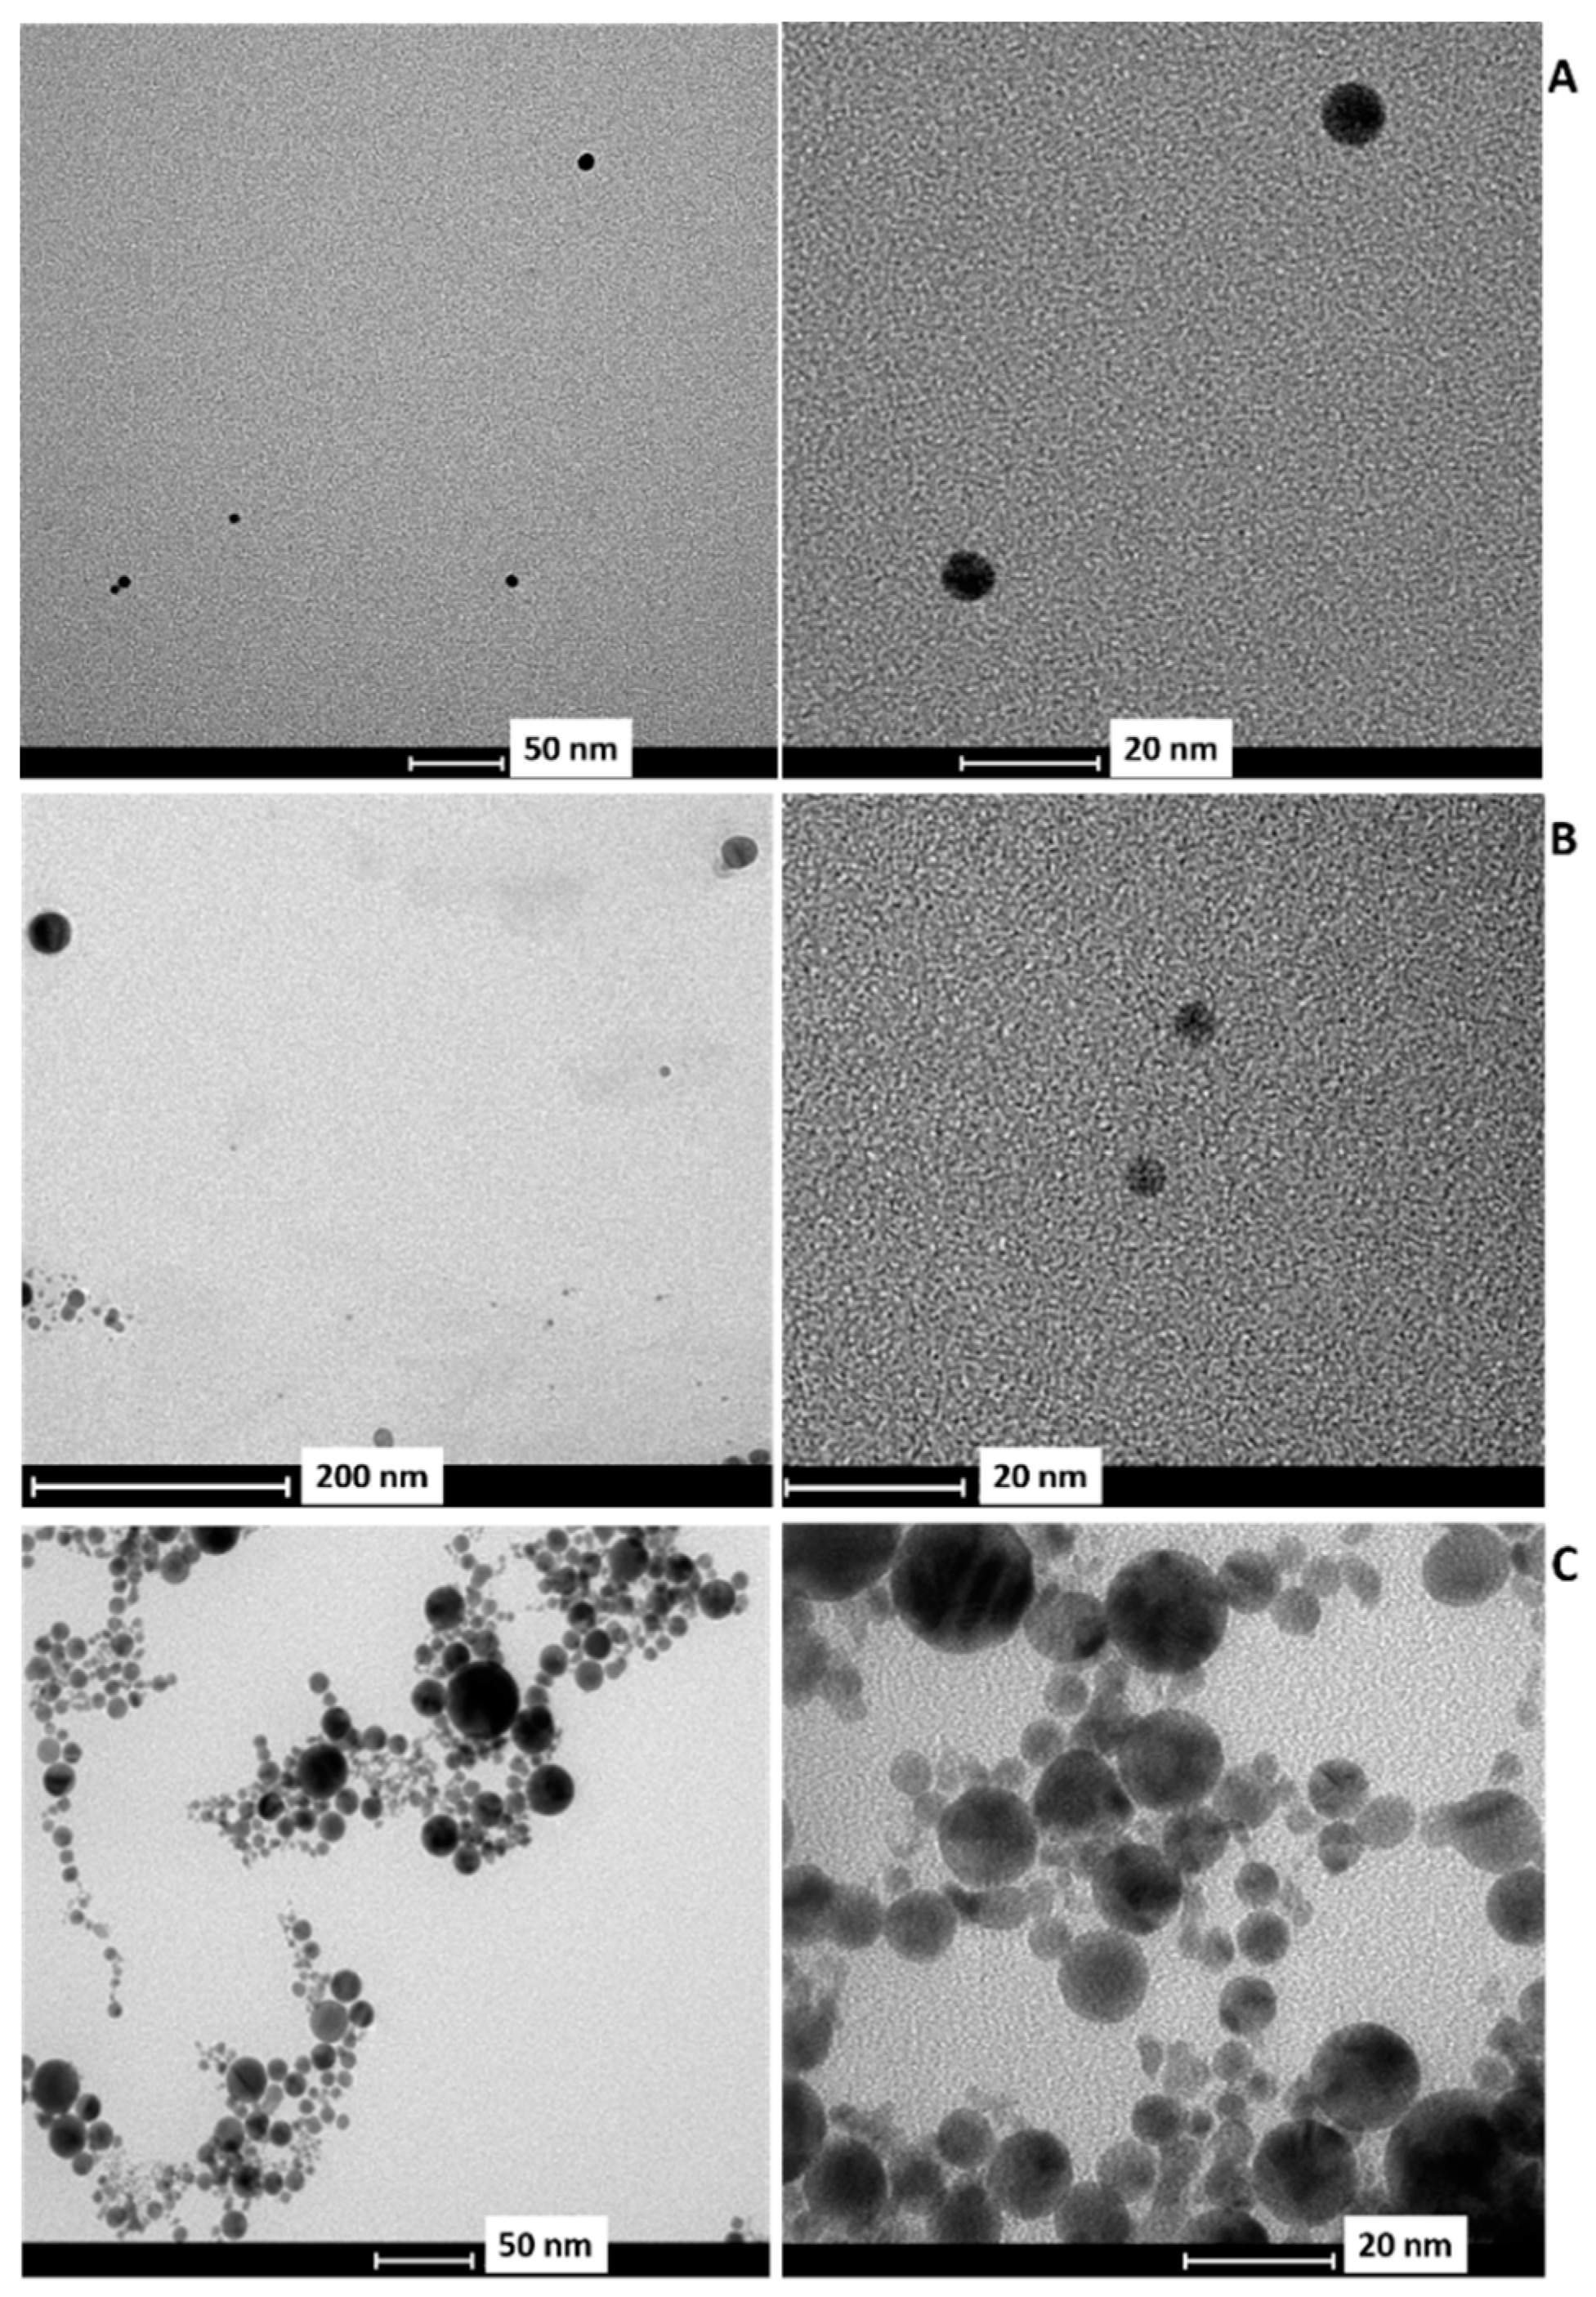
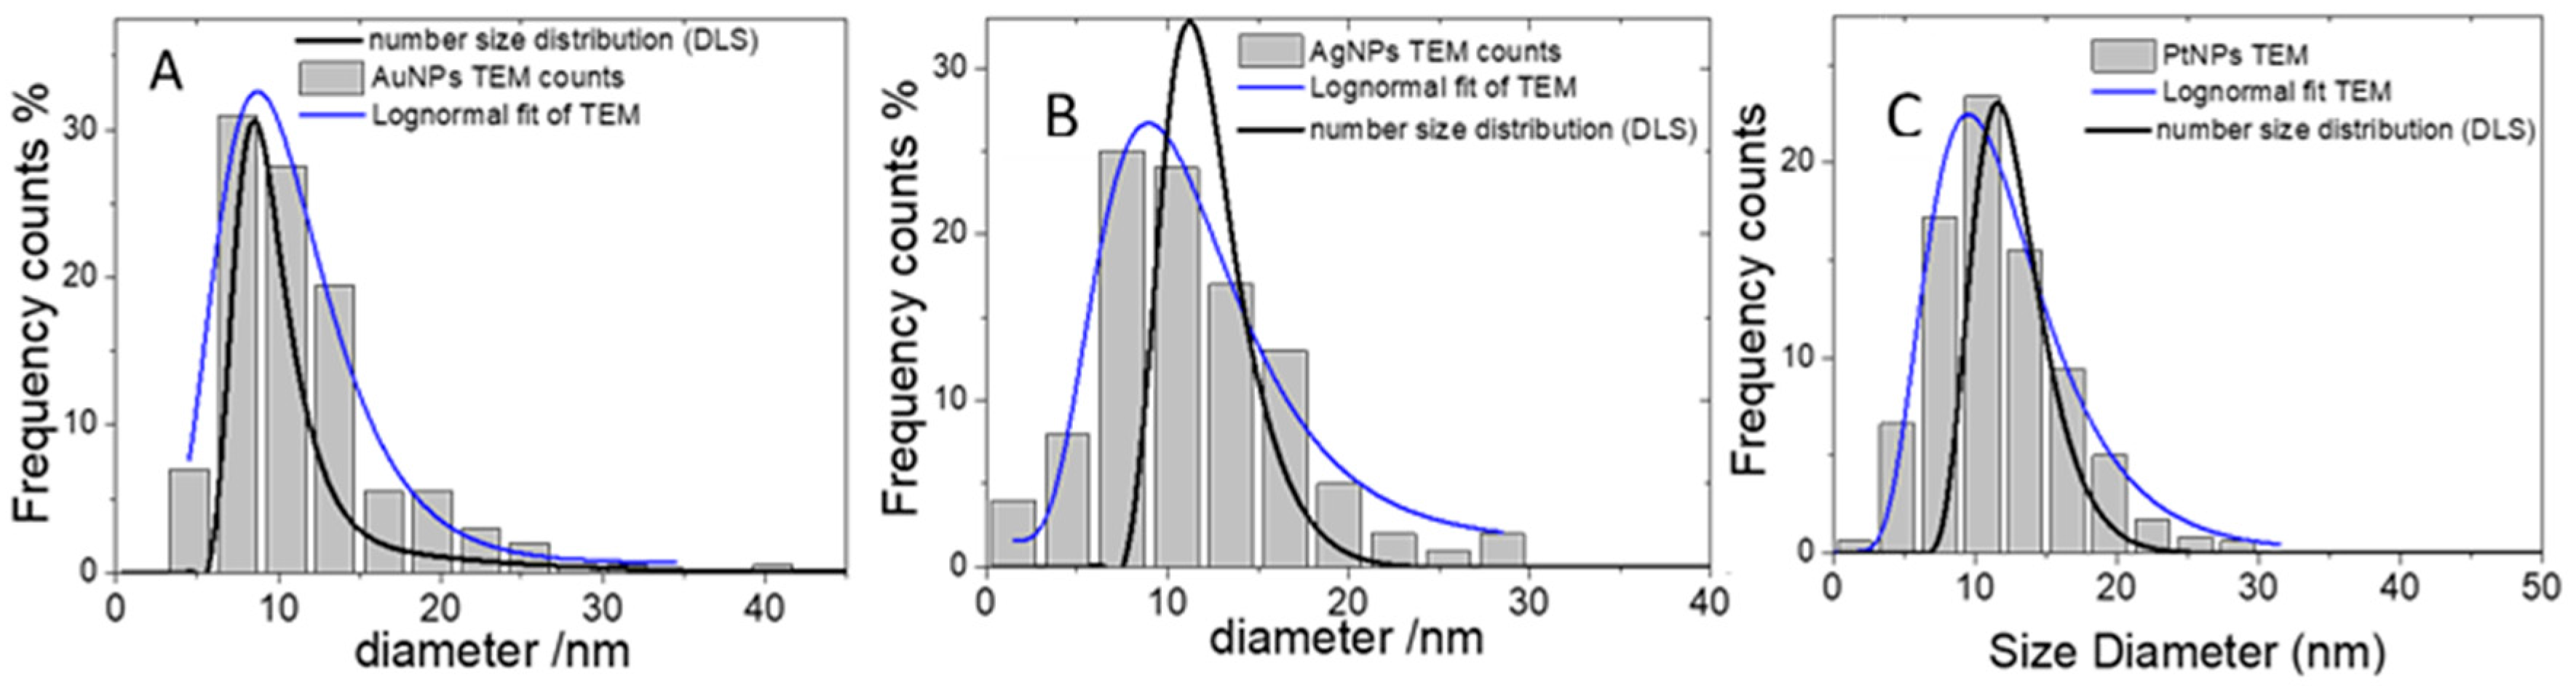
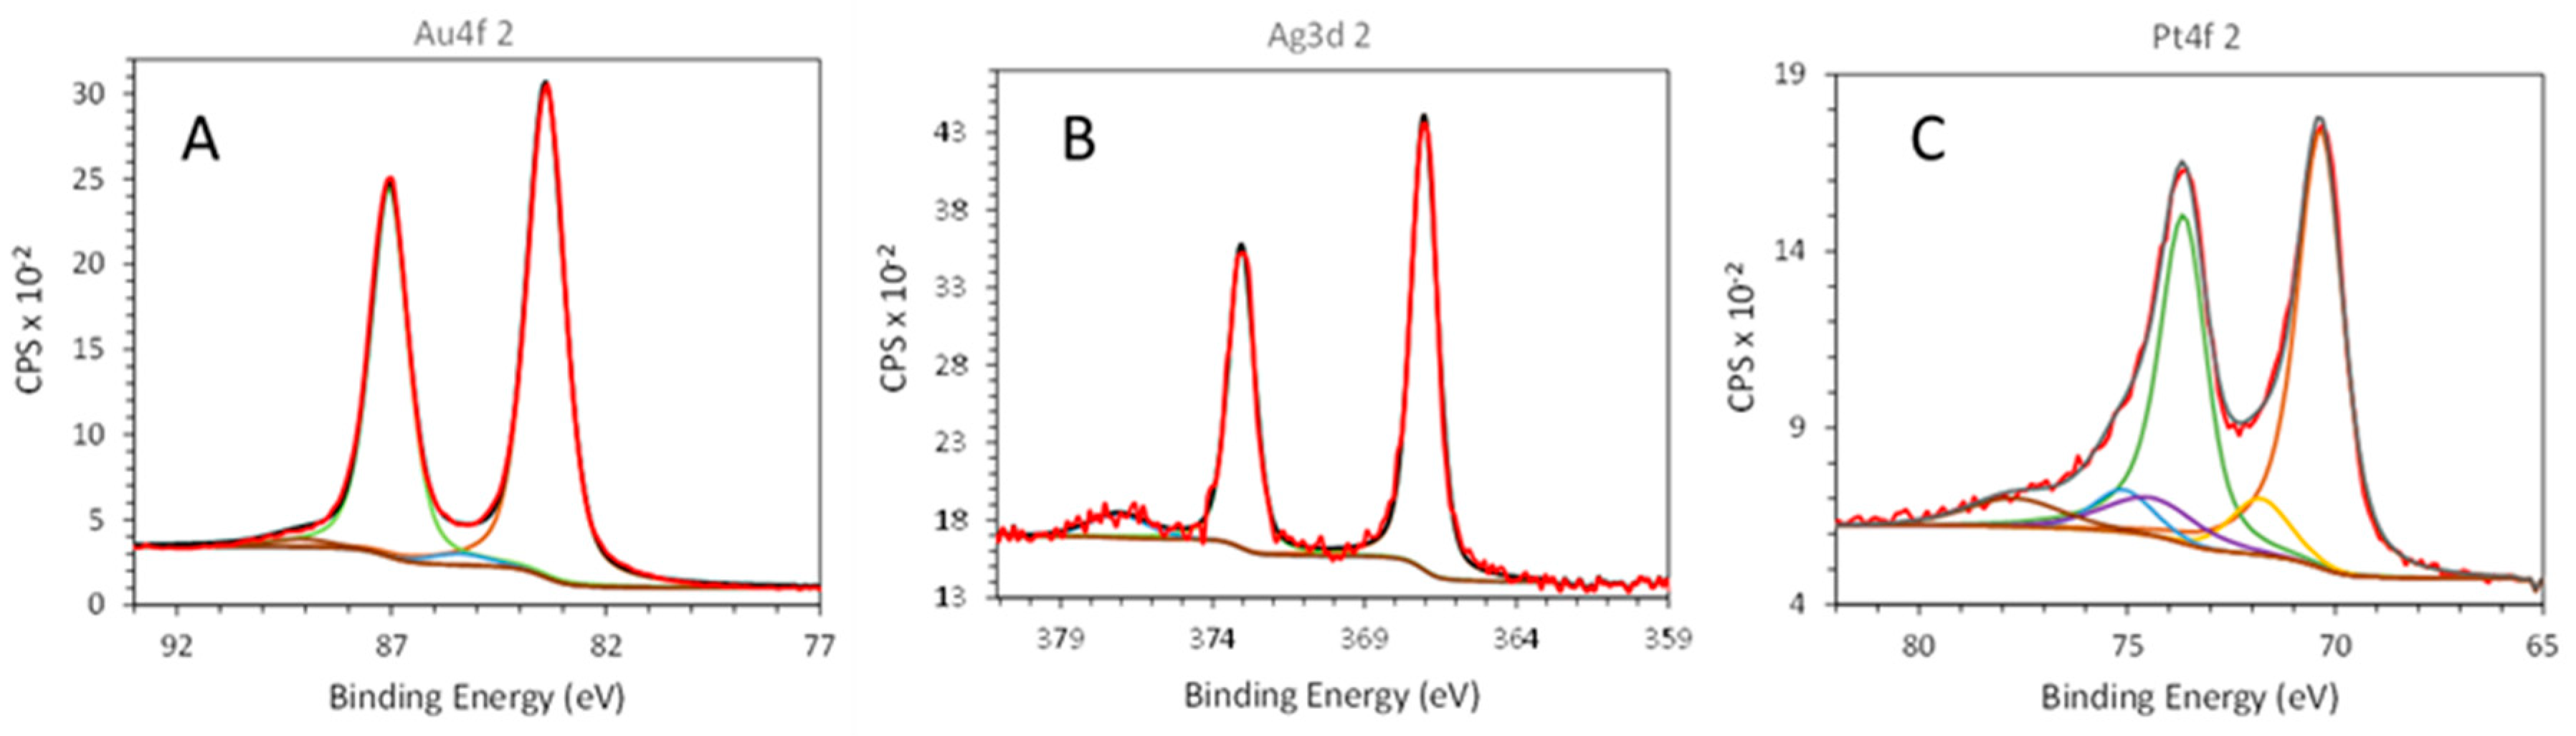
3.1. Size and Surface Chemical Composition

The size distribution obtained from TEM (see Figure 1 for a representative micrograph) shows all three types of NPs have particle sizes of few tens of nm with an average diameter of 11 nm and a standard deviation of 5 nm. These values are in very good agreement with the sizing obtained from the analysis of the absorbance at the wavelength of the surface plasmon (9 ± 2) and (8 ± 2) nm for gold and silver, respectively. In the platinum case, the surface plasmon resonance falls in the far UV region with a position that does not depend on the particle size. In that case, the only possible cross-validation is checking the size distribution obtained from the autocorrelation function (ACF) of the DLS, taking into account the strong dependence of the light scattering power on the particle size. This (also shown in Figure 2C) is centered at a slightly larger diameter, 14 nm. The discrepancy between TEM, DLS, and SPR is negligible if one takes into account that all such techniques, in the present polydisperse system, have an associated error of at least 2 nm. This is an important achievement because, in the case of platinum, as discussed above, the position of the SPR peak cannot be relied upon for the sizing. The size distributions obtained from the ACF of the DLS for silver and gold are centered to a slightly lower diameter (13 and 10 nm, respectively) and thus are in very good agreement with the TEM results. The surface chemical composition was investigated by XPS. A representative XP spectrum of the Au4f region is shown in Figure 3A. The doublet shows one main contribution associated with Au(0), in which the Au4f7/2 component falls at BE = 83.4 ± 0.2 eV. The low BE value found in this work as compared to 84 eV typical of bulk gold is not unexpected [24]. This trend is ascribed to both negative charge density given by chloride on the NP’s surface and the effect of the substrate [24]. An additional couple of peaks were included to fit this signal: Au4f7/2 associated with the minor doublet which falls at 85.4 ± 0.2 eV, being then compatible with Au(I). However, it should be pointed out that its relative abundance is below 3%, hence within the fitting error.
The Ag3d XP region relevant to silver nano-colloids is presented in Figure 3B. Three peaks are clearly visible: the Ag3d doublet with components at BE = 367.0 ± 0.2 eV (Ag3d5/2) and 373.0 ± 0.2 eV (Ag3d3/2), and the K2s peak at about 377 eV (from the KCl). Interestingly, Ag3d5/2 falls at very low BE as compared to the typical value for Ag(0) (about 368 eV). Such findings may be explained in terms of chloride adsorption on the surface of silver nanoparticles, which generates a high negative charge density on the surface thus shifting downwards Ag3d position. Nevertheless, the chemical speciation of AgNPs returns only Ag(0), as estimated by the calculation of the modified Auger parameter (α’ = BE(Ag3d5/2) and KE(Auger)). In fact, the AgM4N45N45 Auger signal falls at a kinetic energy (KE) of 358.8 ± 0.2 eV for such samples, thus resulting in α’ = 725.8 ± 0.3 eV, which is in agreement with Ag(0) state [23,25]. Additional components ascribed to Ag(I) were not detected, thus suggesting that surface oxidation did not occur. XPS analysis of platinum nanoparticles (Figure 3C) identifies three chemical states, namely Pt(0), Pt(II), and Pt(IV). The corresponding positions of the main photoelectronic peak (Pt4f7/2) fall at BE = 70.3 ± 0.2 eV, 71.8 ± 0.2 eV, and 74.4 ± 0.2 eV, respectively [23,26]. As expected, the main component, with a relative abundance of about 78%, is associated with Pt(0), whereas Pt(II) (in the form of hydroxide) and Pt(IV) (like PtO2) account each for about 11%. Such results are quite similar to the ones obtained by laser-generated PtNPs, which were prepared in water using sodium citrate up to 0.1 mM, as reported in [26].

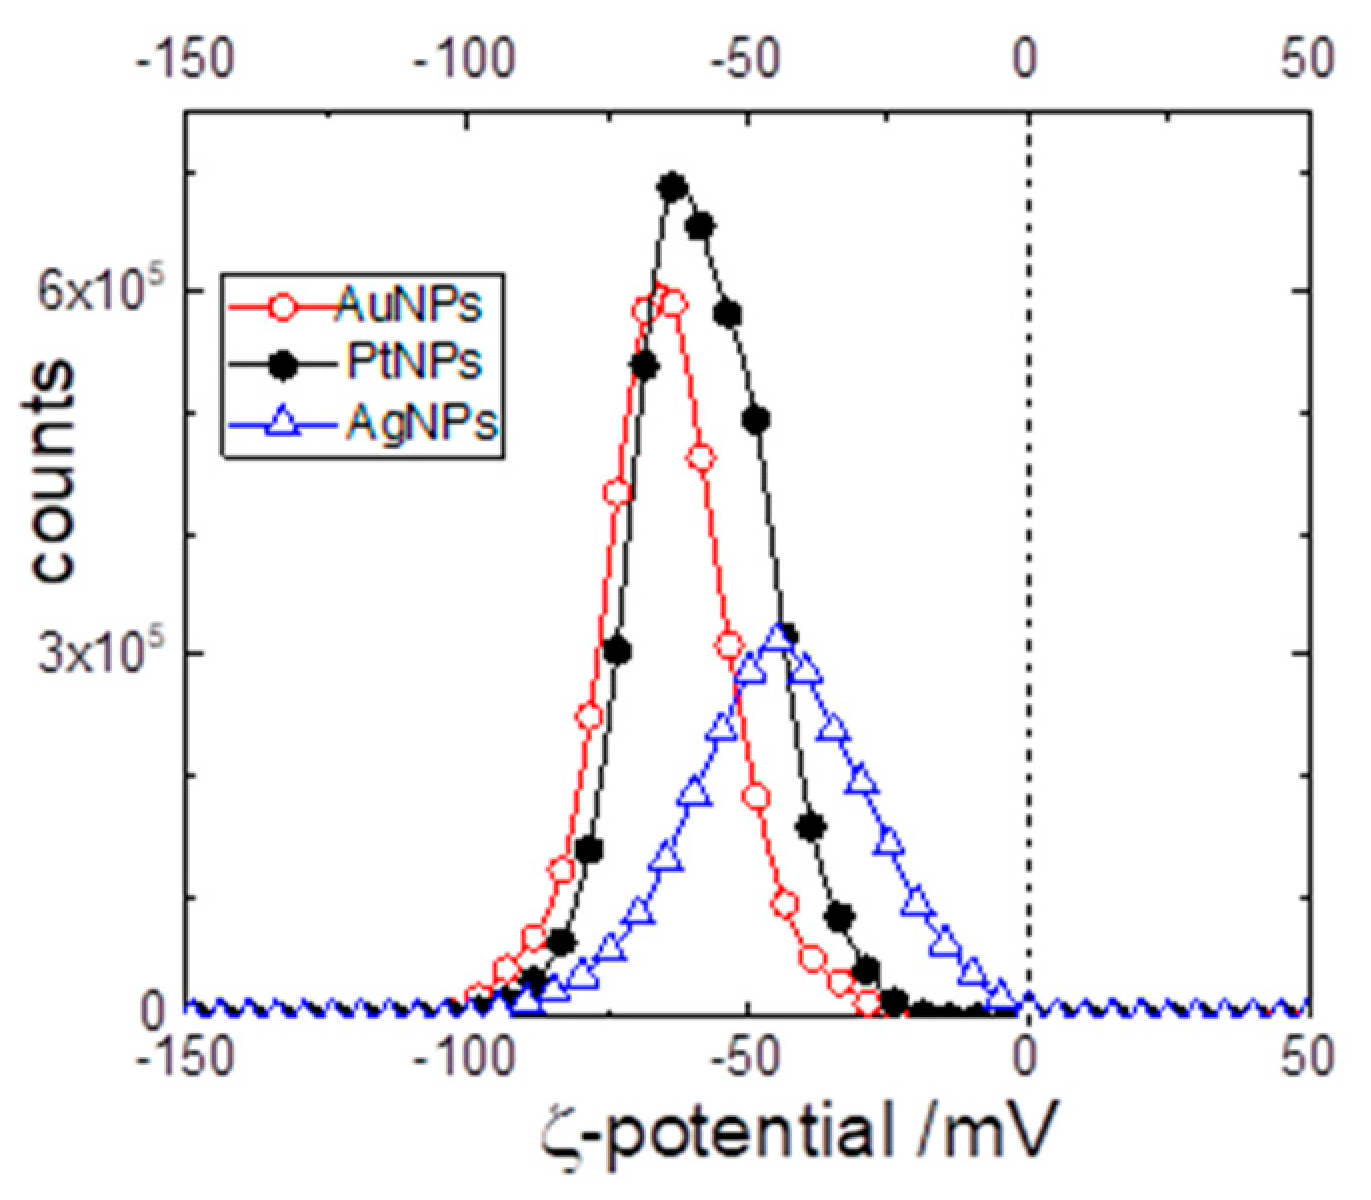
3.2. Particle ζ-Potential

According to the results of the previous section, the NPs made of silver, gold, and platinum have essentially the same size and size distribution but differ considerably in the fraction of oxidized metal present on the particle’s surface. It becomes, therefore, decisive to determine their electrophoretic mobility because, all else being equal, it depends only on the charges on the particles. The electrophoretic mobility was determined by means of LDE in the PALS mode. The average electrophoretic mobilities were: −2.33 ± 0.05 μm·cm/V·s for AgNP; −3.37 ± 0.02 μm·cm/V·s for AuNP and −3.02 ± 0.02 μm·cm/V·s for PtNP. Since the TEM has demonstrated the nanoparticles are spherical and very small (with respect to the Debye’s length of 30 nm at 10−4 M KCl) it is possible to evaluate the average ζ-potential according to Hückel’s equation [27] and obtain the data listed in Table 4. However, an LDE-PALS experiment performed at low ionic strength also allows the evaluation not only of the average ζ-potential, but also the ζ-potential distribution values among different particles. Such distributions are shown in Figure 4 for all three systems. The electrokinetic behavior of all types of NPs is mutually close. In particular, the AuNP and the PtNP are essentially the same although they have very different percentages of oxidized metals on the particle’s surface (less than 3% for AuNP and ~22% for PtNP). The knowledge of the ζ-potential value allows the estimation of the electrokinetic charge of the particle (i.e., the excess charge that is moving with the particle). The ionic atmosphere around the charged spherical particles forms the Gouy-Chapman diffuse double layer that extends over distances of the order of the so-called Debye’s length, λD, defined as:
λ D = ε ε 0 k b T e 2 j z j 2 c j
where kb is the Boltzmann’s constant, e the elementary charge, ε is the relative dielectric constant of the medium, T, the temperature, ε0, the vacuum permittivity, zj, and cj are the valence and the concentration of the j-th ion, respectively. The sum in Equation (1) is twice the solution ionic strength.
Imposing that the charge on the particle (Zc) balances the one on the solution, one obtains [27]:
ζ   = z c l B R k b T e 1 1 + R λ D
where lB is the Bjerrum length that in water is 0.7 nm and R denotes the particle radius. Note that electrokinetic charges (Zc) have the same sign of the ζ-potential.
According to Equation (2) a ζ-potential value of −60 mV implies Zc = −19; i.e., on each nanoparticle, there are 19 unbalanced negative charges. Such a value is almost coincident with the 21 excess electrons calculated on the basis of a detailed numerical model, at an atomistic level, of NP growth in the PLAL plasma [19]. With such a large amount of platinum oxides on the surface, the fact that PtNPs have the very same number of charges per particle than gold nanoparticles, made of essentially pure Au0, points to a minor (if any) role of the metal oxide in the building of negative charge sitting on the particles. On the other hand, the fact that the number of electrokinetic charges obtained is closely matched to the number of trapped electrons predicted by a theoretical model corroborates the hypothesis of an active role of excess electrons on the stability of NPs prepared by PLAL.

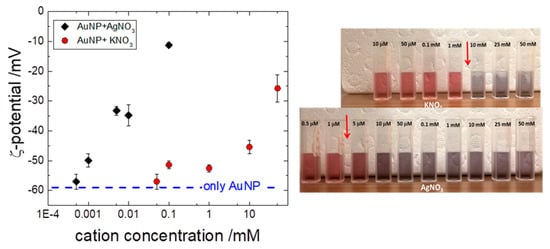
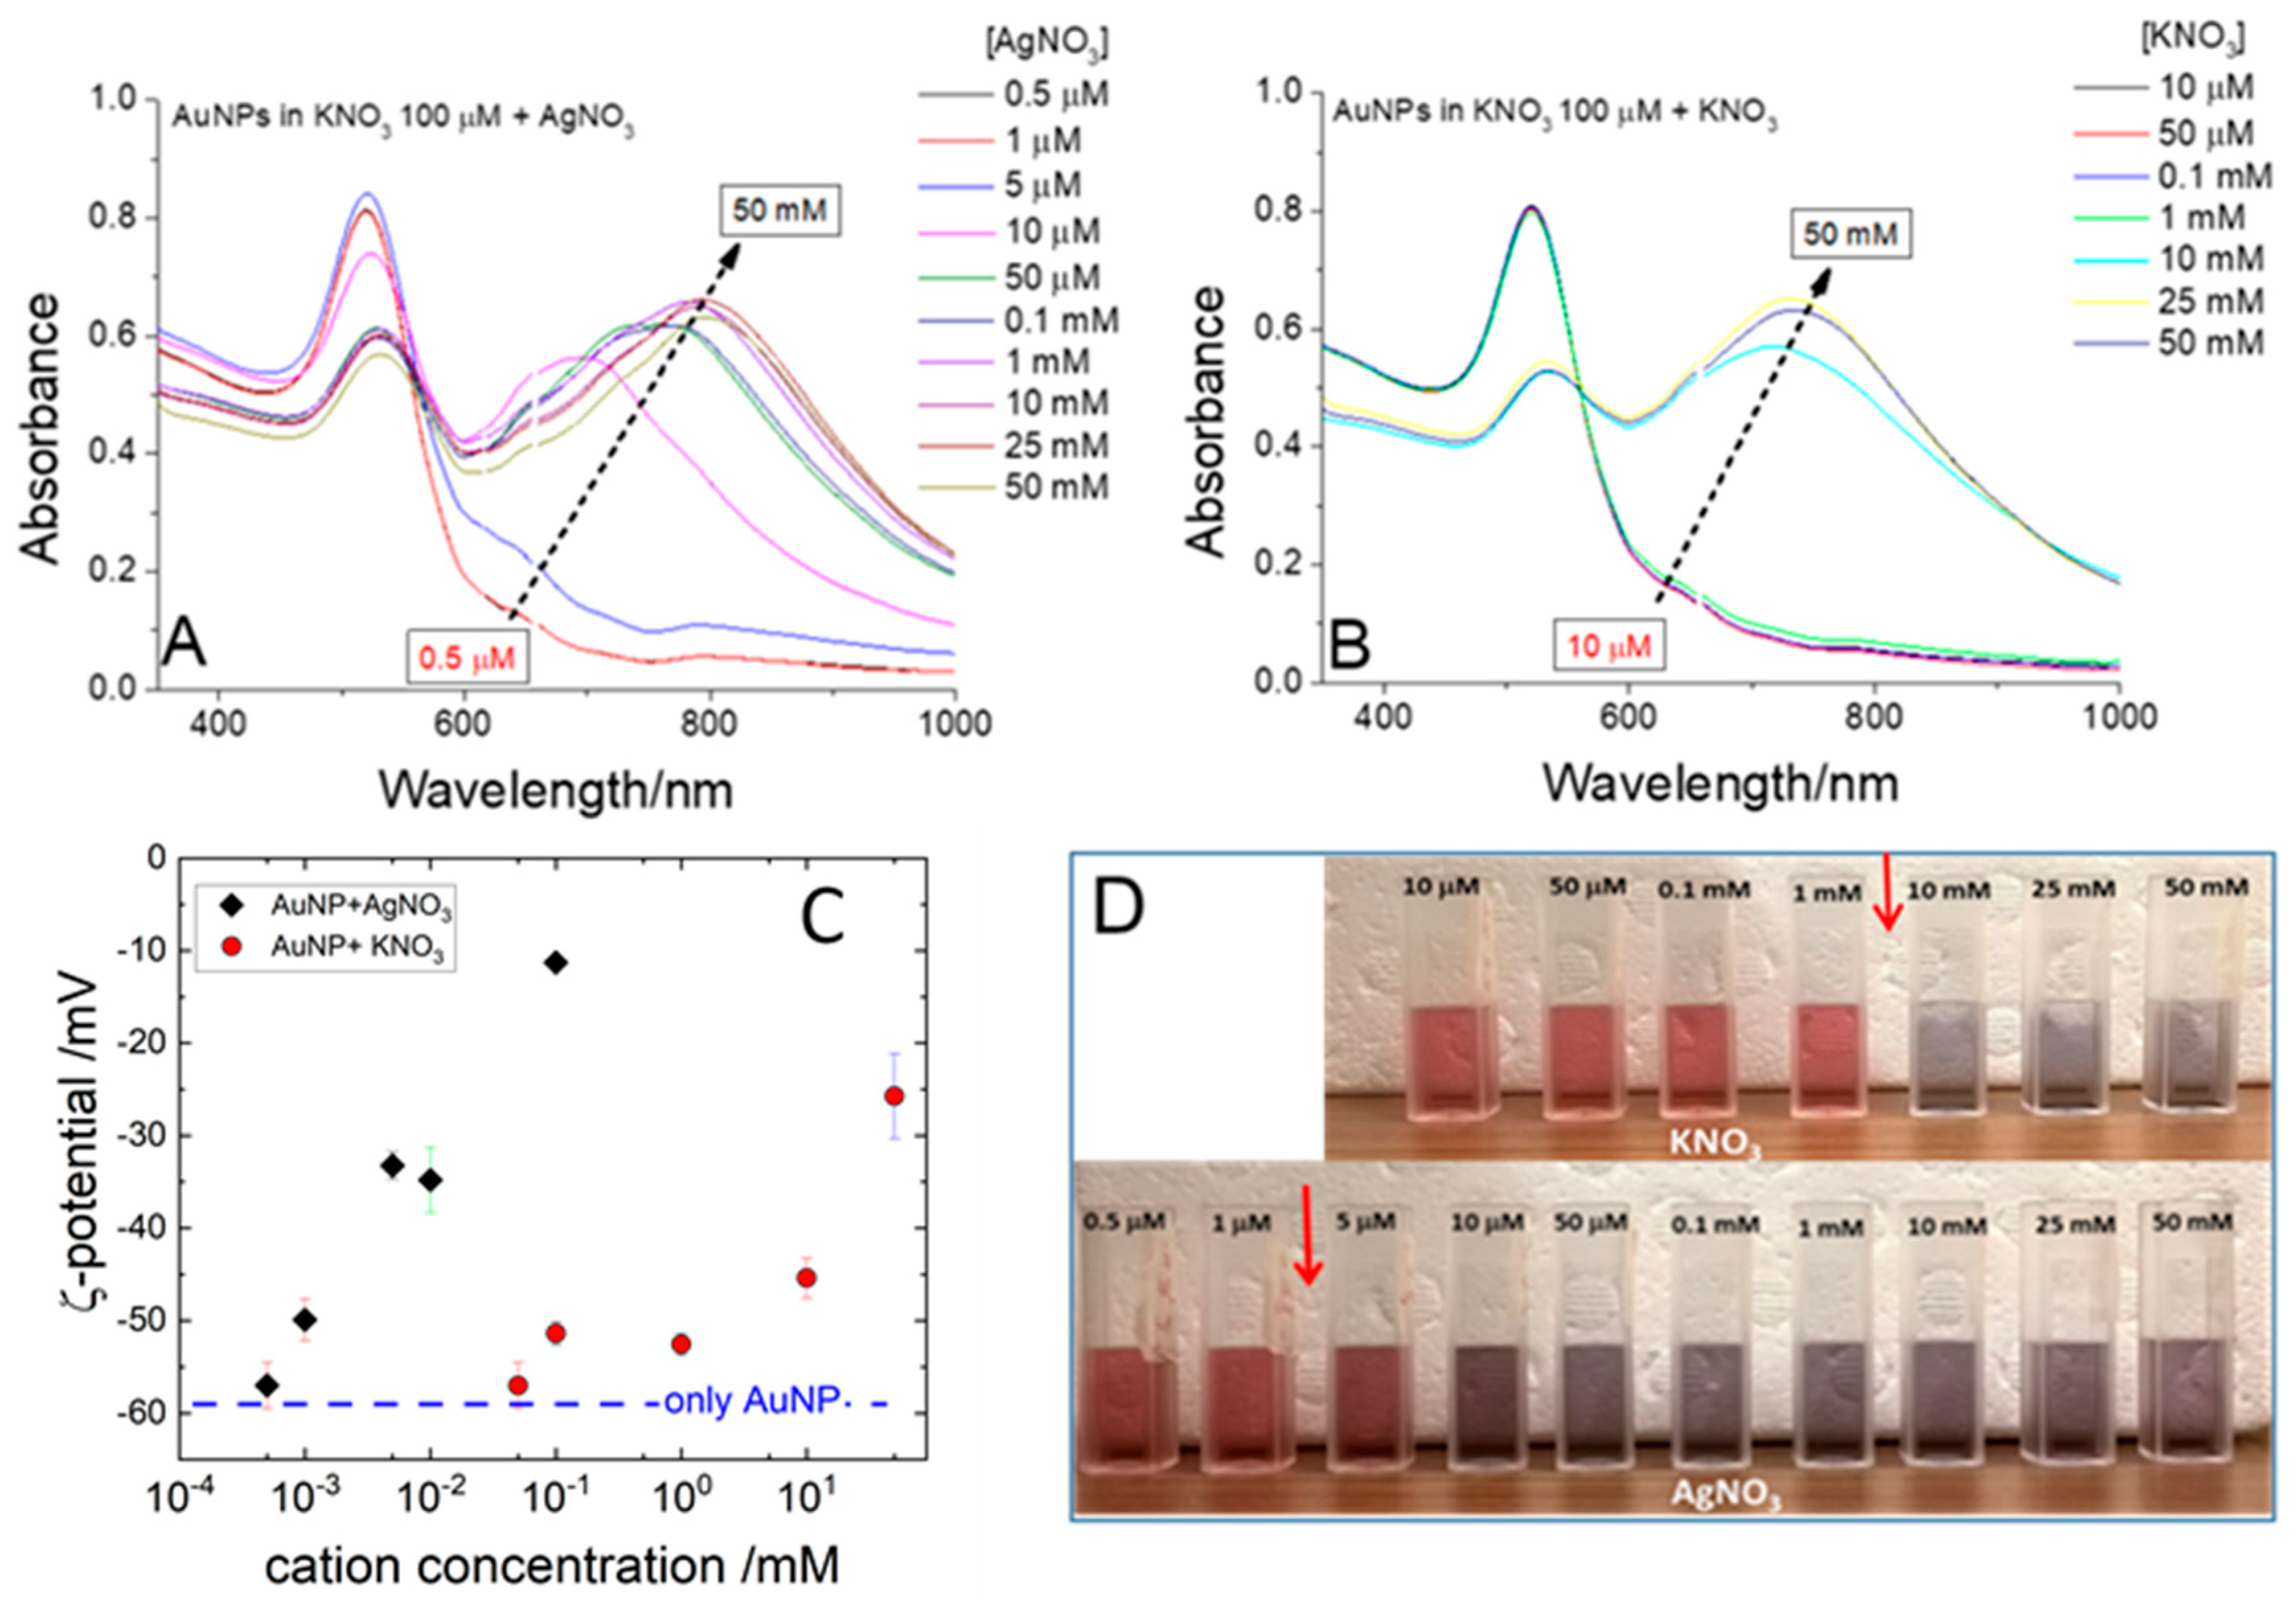
3.3. Effect of Added Metal Cations

In a previous work [16], our group observed that grounding with copper wire solutions of AuNPs synthesized by PLAL induces a rapid discharge of the ζ-potential and eventually the coagulation of the NPs. However, this effect is not seen in AuNPs of the same size and concentration synthesized by citrate reduction of HAuCl4 [16]. The interpretation of such behavior was associated with an electric discharging of the NPs and, therefore, as a proof of the presence of trapped electrons. However, the present investigation has shown that the very same behavior can be reproduced by dipping a small piece of metal copper, or by doping the solution with traces amount of copper salt.
The unresponsivity of chemically synthesized AuNPs is likely to be ascribed to the presence of citrate that can complex the Cu2+ ions.
In the case of AuNPs, nanoparticle aggregation is easily probed by naked eye because it is preceded by a color change from pink to blue or grey (depending on the extent of the aggregation).
Such color change reflects the shift of the gold surface plasmon resonance due to the formation of clusters [28]. Such an effect is less marked in the case AgNPs for which the well-known reactivity of silver cation towards halides complicates the understanding of the metal halides induced destabilization. In the case of PtNPs, the absence of a visible surface plasmon makes them unsuitable for studying the impact of oxidant cations. For these reasons, the study of the effect of oxidant cations has been performed on AuNPs. Exploiting the change of the surface plasmon, the minimum amount of Cu2+ that results in an immediate shift of the plasmon maximum from ~520 nm to ~800 nm, (i.e., the critical coagulation concentration or ccc) has been determined. In the case of Cu2+, the value is ccc = 6 ± 2 μM. Of course, an increase in the ionic strength of a colloidal dispersion screens the charges on the particles (whatever the origin), and, for large enough ionic strengths, it eventually destabilizes the dispersion. The observed ccc for CuCl2 is, however, quite low. Lower than one would expect for customary electrostatic stabilized colloids. On the other hand, the world of colloids is rich with ion-specific effects that scatter the response of the systems to ionic strength around the theoretical value. For this reason, the ccc values of AuNP synthesized by PLAL have been determined, for other bivalent (PbCl2, MgCl2, CaCl2) and monovalent (NaCl) chloride salts. The ccc values are listed in Table 4. The experimental values can be profitably compared with the expectation of the DLVO theory for mono- and divalent electrolytes. According to the DLVO, an estimate of the ccc is given by the approximate expression below [27]:
ccc   ( M ) = 87.4 · 10 40 z 6 H 2 = 55 · 10 3 z 6
where z is the valency of the counterion, in the present case the cation, and the Hamaker constant H, is in joules. The very strong dependence of the critical coagulation concentration on the valency was at the basis of the empirical Schultze–Hardy rule. The last equality is obtained considering the Hamaker constant of gold H ~100 kbT [29]. According to Equation (3) the expected ccc for NaCl is ~55 mM which order of magnitude is in agreement with the experimental value of 35 mM, as reported in Table 4. Passing to divalent cations, the ccc is reduced by a factor of 64, corresponding to 800 μM. In the case of divalent cations, the experimental values have an order of magnitude that are in agreement only in the cases of Mg2+ and Ca2+ (ccc = 150 μM for both). On the other hand, the experimental ccc values for Cu2+ (ccc = 6 μM) and Pb2+ (ccc = 13 μM) are smaller than the DLVO prediction by two orders of magnitude, which is too much to be justified by ion-specific effects (that holds at high ion concentration).
The inspection of these results suggests that in the case of Cu2+ and Pb2+, the mechanism of destabilization is different from the simple charge screening. Interestingly, these are the two cations having a high standard reduction potential. This suggests that the cation-induced decrease in the absolute value of NP ζ-potential, which leads to the coagulation, is associated with the NP oxidation by the cations. However, a mismatch of a factor of a hundred between theory and experiments is not enough to be proof. For this reason, the attention was focused on the silver cation, which has a reduction potential of 0.8 V. Besides, it is a monovalent ion for which one can exclude the role of bidentate ligand bridging two NPs. To test the impact of Ag+ on the colloidal stability any trace of halides must be avoided. Therefore, the AuNPs were ablated in 0.1 mM KNO3 (in order to leave the ionic strength steady at the level of the previous experiments). The resulting AuNPs have the same size (R = 5 nm) and ζ-potential (−59 mV) of those ablated in KCl 0.1 mM.
The AuNP response at increasing concentrations of the two monovalent nitrates was observed: AgNO3 and KNO3. Pictures of such ionic strength scans are shown in Figure 5. Immediately after the salt addition, the AuNP solutions exposed at concentrations of KNO3 larger than 5 mM turn blue (upper picture in Figure 5D) and completely precipitate in few hours (lower picture in Figure S1). In Figure 5B the absorbance spectra of the AuNPs solution produced in KNO3 have been acquired immediately after the loading of different amount of KNO3 in order to evidence the size variation of AuNPs as a function of salt concentration. This allows the estimation of the K+ ccc at 8 mM, in agreement with the order of magnitude of the DLVO prediction. The situation in the case of the addition of AgNO3 is completely different. The solutions with an Ag+ concentration larger than 1 μM change color after the salt addition (lower picture in Figure 5D). In the case of [AgNO3] = 5 μM, the kinetics of color change are slightly slower, but the observation of the samples after few hours (Figure S2) also confirms that such a sample is well above the ccc. In Figure 5A, the absorbance spectra of the AuNPs solution produced in KNO3 have been acquired immediately after the loading of different amounts of AgNO3 in order to put in evidence the size variation of AuNPs as a function of salt concentration. The LDE-PALS measurements, taken immediately after the salt addition (before macroscopic precipitation), are shown in the main panel of Figure 5C and confirm the ζ-potential of the particles becomes less negative upon loading with AgNO3 and vanishes at a concentration (0.1 mM) at which the KCl does not affect it. The above-described experiments demonstrate that keeping the cation valency constant, there is a decrease in the ccc of four orders of magnitude passing from the low reduction potential metal potassium to the high reduction potential metal silver. This is very difficult to explain without assuming that the mechanism by which the cations decrease the nanoparticle’s negative charge is the oxidation of the NPs surface. However, the XPS analysis described in Section 3.1 has assessed that on the surface of the gold nanoparticles, there is only elemental gold, that can be hardly oxidized by silver ions. A case that could reconcile these two pieces of evidence is the presence of an excess of electrons on the metal particle that can reduce the Ag+ ions without oxidizing the elemental Au0.

4. Conclusions

Metal nanoparticles made of gold, silver, and platinum have been synthesized by means of pulsed laser ablation in liquid. The particles share the same size and have the same ζ-potential corresponding to 19 negative charges per nanoparticle. With respect to the chemical composition of gold and silver nanoparticles, XPS analysis has demonstrated the absence of a measurable surface concentration of metal oxides. On the contrary, in the case of nanoparticles made by platinum, only 77.6% of the particle’s surface is made of elemental platinum. The remaining composition is attributed to platinum hydroxide (Pt(II) 10.8%) and oxide (Pt(IV) 11.6%). Despite such a large difference in chemical composition, the fact that the nanoparticles have the very same ζ-potential points to a marginal role of the metal oxides in building the negative charge that stabilizes these colloidal suspensions. These metal colloids can be destabilized by trace amounts of selected metal ions (Ag+, Cu2+, and Pb2+). The case of Ag+ is paradigmatic, since it is able to reduce the NP ζ-potential and to induce the coagulation at concentrations as low as 3 μM, while in the case of K+, the critical coagulation concentration is around 8000 μM. It is proposed that such a huge difference in destabilization power between monovalent cations can be accounted for by the differences in the reduction potential (being Ag+ an oxidant stronger than K+). According to such an interpretation, while K+ acts merely as a counterion, screening the negative charge on the nanoparticle only at a high salt concentration, Ag+ reduces itself by subtracting electrons from (oxidizing) the nanoparticles that lose their negative charge.

Supplementary Materials

The following are available online at https://www.mdpi.com/2076-3417/10/12/4169/s1, Figure S1: Time evolution upon addition of KNO3, Figure S2: Time evolution upon the addition of AgNO3.

Author Contributions

Conceptualization, G.P., N.C. and A.D.G.; methodology, H.M., A.M., M.D.; formal analysis, M.D., H.M. and R.A.P.; investigation, H.M., M.D., R.A.P.; data curation, H.M., A.M. and R.A.P.; writing—original draft preparation, H.M. and G.P.; writing—review and editing, M.D., A.M., H.M. and G.P; supervision, G.P. All authors have read and agreed to the published version of the manuscript.

Funding

Partial financial support by the Center for Colloid and Surface Science (CSGI) is acknowledged.

Conflicts of Interest

The authors declare no conflict of interest. The funders had no role in the design of the study; in the collection, analyses, or interpretation of data; in the writing of the manuscript, or in the decision to publish the results.

References

  1. Ramalingam, V. Multifunctionality of gold nanoparticles: Plausible and convincing properties. Adv. Colloid Interface Sci. 2019, 271, 101989. [Google Scholar] [CrossRef]
  2. Ou, J.; Zhou, Z.; Chen, Z.; Tan, H. Optical Diagnostic Based on Functionalized Gold Nanoparticles. Int. J. Mol. Sci. 2019, 20, 4346. [Google Scholar] [CrossRef] [Green Version]
  3. Gellé, A.; Moores, A. Plasmonic nanoparticles: Photocatalysts with a bright future. Curr. Opin. Green Sustain. Chem. 2019, 15, 60–66. [Google Scholar] [CrossRef]
  4. Maiolo, D.; Paolini, L.; Di Noto, G.; Zendrini, A.; Berti, D.; Bergese, P.; Ricotta, D. Colorimetric nanoplasmonic assay to determine purity and titrate extracellular vesicles. Anal. Chem. 2015, 87, 4168–4176. [Google Scholar] [CrossRef]
  5. Monopoli, A.; Cotugno, P.; Palazzo, G.; Ditaranto, N.; Mariano, B.; Cioffi, N.; Ciminale, F.; Nacci, A. Ullmann Homocoupling Catalysed by Gold Nanoparticles in Water and Ionic Liquid. Adv. Synth. Catal. 2012, 354, 2777–2788. [Google Scholar] [CrossRef]
  6. Dell’Aglio, M.; Salajková, Z.; Mallardi, A.; Mezzenga, R.; van’t Hag, L.; Cioffi, N.; Palazzo, G.; De Giacomo, A. Application of gold nanoparticles embedded in the amyloids fibrils as enhancers in the laser induced breakdown spectroscopy for the metal quantification in microdroplets. Spectrochim. Acta Part B At. Spectrosc. 2019, 155, 115–122. [Google Scholar] [CrossRef]
  7. Dell’Aglio, M.; Alrifai, R.; De Giacomo, A. Nanoparticle Enhanced Laser Induced Breakdown Spectroscopy (NELIBS), a first review. Spectrochim. Acta Part B At. Spectrosc. 2018, 148, 105–112. [Google Scholar] [CrossRef]
  8. Kudera, S.; Manna, L. Nanostructured Fluids. In Colloidal Foundations of Nanoscience; Berti, D., Palazzo, G., Eds.; Elsevier: Amsterdam, The Netherlands, 2014; pp. 47–80. [Google Scholar]
  9. Hamad-Schifferly, K. Stability of Dispersions and Interactions. In Colloidal Foundations of Nanoscience; Berti, D., Palazzo, G., Eds.; Newnes: Amsterdam, The Netherlands, 2014; pp. 33–46. [Google Scholar]
  10. Barcikowski, S.; Compagnini, G. Advanced nanoparticle generation and excitation by lasers in liquids. Phys. Chem. Chem. Phys. 2013, 15, 3022–3026. [Google Scholar] [CrossRef] [PubMed]
  11. Dell’Aglio, M.; Gaudiuso, R.; De Pascale, O.; De Giacomo, A. Mechanisms and processes of pulsed laser ablation in liquids during nanoparticle production. Appl. Surf. Sci. 2015, 348, 4–9. [Google Scholar] [CrossRef]
  12. Sylvestre, J.P.; Poulin, S.; Kabashin, A.V.; Sacher, E.; Meunier, M.; Luong, J.H. Surface Chemistry of Gold Nanoparticles Produced by Laser Ablation in Aqueous Media. J. Phys. Chem. B 2004, 108, 16864–16869. [Google Scholar] [CrossRef]
  13. De Anda Villa, M.; Gaudin, J.; Amans, D.; Boudjada, F.; Bozek, J.; Evaristo Grisenti, R.; Lamour, E.; Laurens, G.; Macé, S.; Nicolas, C.; et al. Assessing the Surface Oxidation State of Free-Standing Gold Nanoparticles Produced by Laser Ablation. Langmuir 2019, 35, 11859–11871. [Google Scholar] [CrossRef] [PubMed]
  14. Muto, H.; Yamada, K.; Miyajima, K.; Mafuné, F. Estimation of surface oxide on surfactant-free gold nanoparticles laser-ablated in water. J. Phys. Chem. C 2007, 111, 17221–17226. [Google Scholar] [CrossRef]
  15. Merk, V.; Rehbock, C.; Becker, F.; Hagemann, U.; Nienhaus, H.; Barcikowski, S. In situ non-DLVO stabilization of surfactant-free, plasmonic gold nanoparticles: Effect of Hofmeister’s anions. Langmuir 2014, 30, 4213–4222. [Google Scholar] [CrossRef]
  16. Palazzo, G.; Valenza, G.; Dell’Aglio, M.; De Giacomo, A. On the stability of gold nanoparticles synthesized by laser ablation in liquids. J. Colloid Interface Sci. 2016, 489, 47–56. [Google Scholar] [CrossRef]
  17. Dell’Aglio, M.; Motto-Ros, V.; Pelascini, F.; Gornushkin, I.B.; Giacomo, A. De Investigation on the material in the plasma phase by high temporally and spectrally resolved emission imaging during pulsed laser ablation in liquid (PLAL) for NPs production and consequent considerations on NPs formation. Plasma Sources Sci. Technol. 2019, 28, 085017. [Google Scholar] [CrossRef]
  18. Dell’Aglio, M.; De Giacomo, A. Plasma charging effect on the nanoparticles releasing from the cavitation bubble to the solution during nanosecond Pulsed Laser Ablation in Liquid. Appl. Surf. Sci. 2020, 515, 146031. [Google Scholar] [CrossRef]
  19. Taccogna, F.; Dell’Aglio, M.; Rutigliano, M.; Valenza, G.; Giacomo, A. De On the growth mechanism of nanoparticles in plasma during pulsed laser ablation in liquids. Plasma Sources Sci. Technol. 2017, 26, 045002. [Google Scholar] [CrossRef]
  20. Dell’Aglio, M.; Mangini, V.; Valenza, G.; De Pascale, O.; De Stradis, A.; Natile, G.; Arnesano, F.; De Giacomo, A. Silver and gold nanoparticles produced by pulsed laser ablation in liquid to investigate their interaction with Ubiquitin. Appl. Surf. Sci. 2016, 374, 297–304. [Google Scholar] [CrossRef]
  21. Mateos, H.; Valentini, A.; Colafemmina, G.; Murgia, S.; Robles, E.; Brooker, A.; Palazzo, G. Binding isotherms of surfactants used in detergent formulations to bovine serum albumin. Colloids Surf. A Physicochem. Eng. Asp. 2020, 598. [Google Scholar] [CrossRef]
  22. Mateos, H.; Valentini, A.; Robles, E.; Brooker, A.; Cioffi, N.; Palazzo, G. Measurement of the zeta-potential of solid surfaces through Laser Doppler Electrophoresis of colloid tracer in a dip-cell: Survey of the effect of ionic strength, pH, tracer chemical nature and size. Colloids Surf. A Physicochem. Eng. Asp. 2019, 576, 82–90. [Google Scholar] [CrossRef]
  23. Casiello, M.; Picca, R.; Fusco, C.; D’Accolti, L.; Leonardi, A.; Lo Faro, M.; Irrera, A.; Trusso, S.; Cotugno, P.; Sportelli, M.; et al. Catalytic Activity of Silicon Nanowires Decorated with Gold and Copper Nanoparticles Deposited by Pulsed Laser Ablation. Nanomaterials 2018, 8, 78. [Google Scholar] [CrossRef] [Green Version]
  24. Radnik, J.; Mohr, C.; Claus, P. On the origin of binding energy shifts of core levels of supported gold nanoparticles and dependence of pretreatment and material synthesis. Phys. Chem. Chem. Phys. 2003, 5, 172–177. [Google Scholar] [CrossRef]
  25. Naumkin, A.V.; Kraut-Vass, A.; Gaarenstroom, S.W.; Powell, C.J. NIST X-ray Photoelectron Spectroscopy Database. Meas. Serv. Div. Natl. Inst. Stand. Technol. 2012, 20899, 20899. [Google Scholar] [CrossRef]
  26. Fischer, M.; Hormes, J.; Marzun, G.; Wagener, P.; Hagemann, U.; Barcikowski, S. In Situ Investigations of Laser-Generated Ligand-Free Platinum Nanoparticles by X-ray Absorption Spectroscopy: How Does the Immediate Environment Influence the Particle Surface? Langmuir 2016, 32, 8793–8802. [Google Scholar] [CrossRef]
  27. Hunter, R.J. Zeta Potential in Colloidal Science; Academic press: Cambridge, MA, USA, 2013. [Google Scholar]
  28. Aldewachi, H.; Chalati, T.; Woodroofe, M.N.; Bricklebank, N.; Sharrack, B.; Gardiner, P. Gold nanoparticle-based colorimetric biosensors. Nanoscale 2018, 10, 18–33. [Google Scholar] [CrossRef] [Green Version]
  29. Israelachvili, J.N. Intermolecular and Surface Forces; Elsevier: Amsterdam, The Netherlands, 2011; ISBN 9780123751829. [Google Scholar]
Figure 1. Representative TEM images of (A) AuNPs ablated in 100 μM KCl, (B) AgNPs ablated in 100 μM KCl and (C) PtNPs ablated in 100 μM KCl, respectively.
Applsci 10 04169 g001
Figure 2. Gold (A), silver (B), and platinum (C) nanoparticles prepared by laser ablation in liquid in presence of 100 μM KCl. Diameter distribution histograms obtained from the analysis of the TEM micrographs and the respective fit to a Lognormal distribution (blue curve). Also shown is the size distribution function retrieved from the DLS measurements (bold black curve).
Applsci 10 04169 g002
Figure 3. Gold (A), silver (B), and platinum (C) nanoparticles prepared by laser ablation in liquid in presence of 100 μM KCl. Au4f, Ag3d, and Pt4fXP XP spectra (black) and the best fit (red). Also shown (in different colors) the different contributions to the fit; XP intensity is in arbitrary units. Note that the K2s signal in B falls in the same binding energy (BE) range.
Applsci 10 04169 g003
Figure 4. ζ-potential distribution of the different metal nanoparticles in 100 μM KCl.
Applsci 10 04169 g004
Figure 5. Effect of AgNO3 and KNO3 on AuNPs ablated in KNO3 100 μM. The NP concentration is 1.5 nM. (A,B) absorbance spectra of the AuNPs solutions as a function of salt concentration, AgNO3, and KNO3, respectively. (C) ζ-potential of the solutions shown in A and B as a function of salt concentration. (D) Visual appearance of the AuNPs solution immediately after the loading with different amount of KNO3 (upper) and AgNO3 (lower).
Applsci 10 04169 g005
Table 1. Sizes (diameter), NPs concentration in KCl 10−4 M, after centrifugation.
Size (Averaged TEM Diameter)NPs Concentration
nmnmol·NPs/L·(nM)n°·NPs/L
AuNPs11 ± 58.85.3 × 1015
AgNPs11 ± 53.52.2 × 1015
PtNPs11 ± 56.64.0 × 1015
Table 2. Sizes (diameter), ζ-potential and chemical composition of the metal nanoparticles.
Size (Diameter)/nm
SPRDLSTEMζ-PotentialXPS Oxidation
Xc (nm)Average(mV)
AuNPs9 ± 210.2 ± 0.610.2 ± 0.211 ± 5−62 ± 7Au(0) 97.1%
Au+ 2.9%
AgNPs8 ± 213 ± 210.6 ± 0.411 ± 5−44 ± 2Ag(0) 100%
PtNPs-14 ± 211.3 ± 0.311 ± 5−58 ± 3Pt(0) 77.6%
Pt(II) 10.8%
Pt(IV) 11.6%
Table 3. XPS surface chemical composition of metal nanoparticles prepared by pulsed laser ablation in 100 µM KCl aqueous solution. Errors are expressed as the larger value between the error associated with a single quantification and one standard deviation; the error on Au, Pt, Ag, and Si percentages is ±0.2%; the error on the abundance of other elements is ±0.5%.
Element%AuNPsAgNPsPtNPs
C%22.230.831.9
O%28.228.329.3
Si%33.025.520.4
K%2.42.24.5
Cl%2.81.64.3
Au%11.4//
Ag%/11.6/
Pt%//9.6
Table 4. Critical coagulation concentration (ccc) for copper, lead, magnesium, calcium, and sodium chlorides and for silver and potassium nitrate. The values are ordered according to the standard reduction potential (E°) of the cation. In the last column are listed the predictions of the DLVO theory (Equation (3)) for mono and divalent ions.
IonE°/Vccc/μMccc/μM from Equation (3)
Ag+0.83 ± 250 × 103
Cu++0.346 ± 2800
Pb++−0.1313 ± 5800
Mg++−2.36150 ± 50800
Na+−2.71(35 ± 10) × 10350 × 103
Ca++−2.87150 ± 50800
K+−2.93(8 ± 2) × 10350 × 103

