1
Division for Neuroscience, Lund University, Lund, Sweden
2
Neuronano Research Center, Lund University, Lund, Sweden
Climbing fiber discharges within the rat cerebellar cortex have been shown to display synchrony, especially for climbing fibers terminating in the same parasagittal bands. In addition, Purkinje cells which have the smallest rostrocaudal separation also seem to have the highest degree of synchrony. But this has so far only been investigated for distances down to 250 μm. In the present study, we wanted to investigate whether Purkinje cells that are located immediately next to each other display a particularly pronounced synchrony in their climbing fiber discharges. To this end, we used a previously undescribed type of electrophysiological recording, a single electrode, loose patch, dual dendritic recording, from pairs of adjacent Purkinje cells in the decerebrated, non-anesthetized cat. From each recorded dendrite, this technique provided well isolated, unitary calcium spikes, which we found to have a spontaneous activity that was essentially identical with the pattern of spontaneous climbing fiber discharges. By calculating the coupling in firing between the adjacent dendrites, we found that most climbing fiber responses occurred independently of each other and that the probability of coupled discharges was less than 8%. These values are comparable to those obtained in previous studies for Purkinje cells located within the same parasagittal band and show that climbing fiber coupling within a microzone exists also in non-rodent mammalian species. However, since the degree of synchrony of climbing fiber discharge was not particularly pronounced in adjacent Purkinje cells, it seems unlikely that climbing fiber synchrony has pronounced systematic regional variations within the same microzone.
Inferior olivary (IO) neurons are connected to each other with gap junctions (Llinas et al., 1974
), which makes them electrotonically coupled (Devor and Yarom, 2002
; Llinas and Yarom, 1981
; Placantonakis et al., 2006
). The coupling provides a mechanism by which IO neurons may become synchronized in their output. This has been shown to occur in numerous studies in which the synchrony of climbing fiber (CF) discharges have been investigated with recordings of CF responses in Purkinje cells (PCs) of the cerebellar cortex (De Zeeuw et al., 1997
; Flusberg et al., 2008
; Lang et al., 1999
; Ozden et al., 2008
; Welsh et al., 1995
). Interestingly, the synchronization has been reported to preferentially occur in narrow sagittal bands (De Zeeuw et al., 1997
; Lang et al., 1999
) suggesting that synchronization may primarily be a property of the IO neurons that project to the same microzone of the cerebellar cortex.
Microzones are extremely narrow sagittal bands of the cerebellar cortex, which can extend over several folia. A microzone is defined as an area in which the PCs receive CF input activated from exactly the same peripheral receptive field (Andersson and Oscarsson, 1978
; Ekerot et al., 1991
). They run primarily in the parasagittal direction, but can be interleaved in patterns that are not purely parasagittal (Ekerot et al., 1991
). The morphological underpinnings of the microzonal organization are that individual IO cells diverge to innervate 5–10 PCs which all are located in a very narrow sagittal band (Sugihara et al., 2001
) and that different IO neurons projecting the same microzone can be found in the same small part of the IO (Garwicz et al., 1996
; Sugihara et al., 2007
).
Importantly, the PCs of a single microzone innervates the same restricted area of the cerebellar nucleus (Apps and Garwicz, 2005
; Garwicz and Ekerot, 1994
; Garwicz et al., 1996
), which has a motor output that is functionally specific to the CF receptive field of the afferent PCs (Ekerot et al., 1995
; Jorntell and Ekerot, 1999
). Therefore, the microzones, together with their corticonuclear target cells and olivocerebellar afferent neurons, may be regarded as the smallest functional units of the cerebellum, which has been termed microcomplexes (see Apps and Garwicz, 2005
).
Interestingly, within a microzone, PCs with the smallest rostrocaudal separation also seem to have the highest degree of synchrony. This is true at least down to distances of 250 μm, which is the resolution defined by the physical constraints of the multi-electrode arrays used to obtain the data (Lang et al., 1999
; Sugihara et al., 2007
). Since anatomical studies suggest that the most closely located IO neurons have the highest chance of providing the most closely spaced olivocortical terminations within the microzone (Garwicz et al., 1996
; Sugihara et al., 2007
), it is thus possible that the highest degree of CF synchronization may be found for adjacent PCs. The correlation between (several) adjacent PCs was also studied in two recent papers describing PC dendritic calcium transients using optical methods (Flusberg et al., 2008
; Ozden et al., 2008
). However, in these studies the temporal resolution was limited to 50–256 ms. Hence, many additional mechanisms in addition to the gap junction couplings may account for the observed synchrony. Here we use the higher temporal resolution that can be achieved in electrophysiological recordings of two adjacent PC dendrites to limit our analysis to the time window during which gap junction coupling may occur. Another purpose of our study was to investigate if the IO neuron synchrony observed in rodents is demonstrable also in the cat.
Preparation
Adult cats were prepared as previously described. Briefly, following an initial anesthesia with propofol (Diprivan® Zeneca Ltd, Macclesfield Cheshire, UK), the animals were decerebrated at the intercollicular level and the anesthesia was discontinued. The animals were artificially ventilated and the end-expiratory CO2, blood pressure and rectal temperature were continuously monitored and maintained within physiological limits. Mounting in a stereotaxic frame, drainage of cerebrospinal fluid, pneumothorax and clamping the spinal processes of a few cervical and lumbar vertebral bodies served to increase the mechanical stability of the preparation. Our EEG recordings were characterized by a background of periodic 1–4 Hz oscillatory activity, periodically interrupted by large-amplitude 7–14 Hz spindle oscillations lasting for 0.5 s or more. These forms of EEG activities are normally associated with deep stages of sleep. The pattern of EEG activity and the blood pressure remained stable, also on noxious stimulation, throughout experiments.
Recordings and Stimulation
The initial delineation of the forelimb area of the C3 zone in the cerebellar anterior lobe and the continuous monitoring of the general condition in the sensitive mossy fiber-to-granule cell-to-parallel fiber pathway were performed as described previously.
In vivo patch clamp recordings, loose patch (Stuhmer et al., 1983
) and whole cell recordings, were made from PC dendrites in the upper 2/3 of the superficial molecular layer accessible from the surface with patch pipettes pulled to 6–14 MOhm (potassium-gluconate based internal solution) on a Sutter micropipette puller (P-97, Sutter Instruments Co., USA). Loose patch dendritic recordings were obtained on a routine basis as a result of failed attempts to obtain giga-Ohm seals on PC dendrites (for more details on our standard methods to obtain in vivo patch clamp recordings, see Jorntell and Ekerot, 2006
). Non-invasive patch recordings in the current clamp mode has previously been demonstrated to provide a reasonable reflection of the major transmembrane potentials (Mason et al., 2005
). The present analysis was confined to rare cases in which two distinct dendritic spikes could be detected in the recordings. The example of the morphologically recovered PC (Figure 1
) was obtained from an intracellular PC dendritic recording in the whole cell mode in which the recording solution contained 1.5% neurobiotin (see Bengtsson and Jorntell, 2009
; Jorntell and Ekerot, 2006
). Extracellular metal electrode recordings (exposed metal tips 3–15 μm) were also made from PCs in the PC layer.
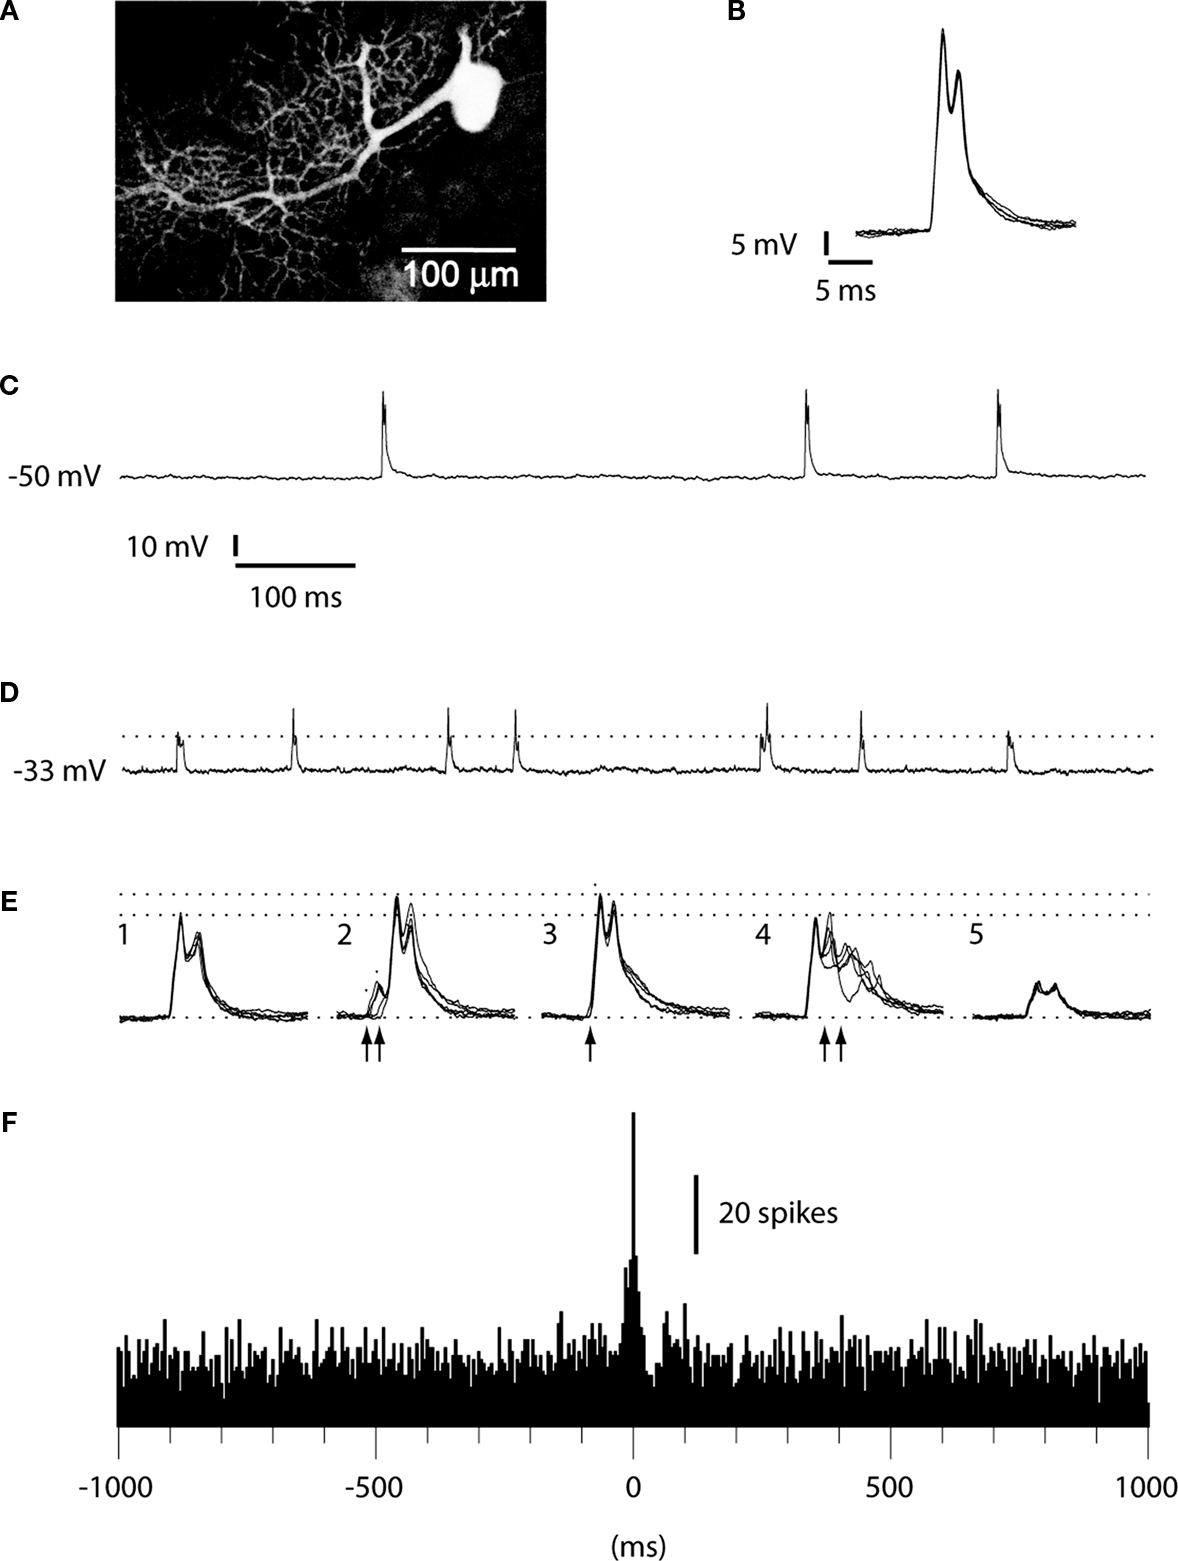
Figure 1. Intradendritic versus loose patch dendritic recordings. (A) PC dendrite and soma, partially reconstructed after recording in the whole cell (intracellular) mode with neurobiotin in the pipette solution. (B) Superimposed dendritic spikes from the intracellular recording. Membrane potential, recorded with 0 pA bias current, as in (C). (C) Long sweep illustrating the constant amplitude of the dendritic spike. (D) Long sweep of a double loose patch dendritic recording. Dashed line indicates the peak amplitude of the smaller of the units. Calibrations as in (C). (E) Superimposed dendritic spikes. The dashed lines indicate the peak amplitudes of the largest unit in isolation and during coincident activation with the smaller unit, respectively. (E1 and E5) Superimposed spikes of the two dendritic spike units in isolation. (E2) Recorded response when the onset of the small unit (arrows) barely preceded the large unit. (E3) Recorded response when the small and large units coincided in time. (E4) Recorded response when the small unit was activated after the larger unit. (F) Histogram of cross-correlated activity with the spike times of the larger unit serving as the ‘trigger’ against which the relative spike times of the smaller unit were plotted. Bin width: 5 ms.
The IO was accessed with a tungsten-in-glass electrode inserted through the vermis at a perpendicular angle relative to the stereotaxic horizontal plane, just caudal to the primary fissure. This electrode was then used to stimulate the IO. The position of the electrode was confirmed to have an appropriate location within the IO as thresholds for evoking CF responses in the C3 zone (measured with surface ball electrodes) always were below 20 μA.
Analysis
Using home-made software and the Data Translation 3010 A/D-board, all recordings were continuously sampled and digitized at 100 kHz. Off-line analysis of dendritic spike times was made in another home-made program.
For calculations of spike-coupling, one of the two spikes recorded were set as the trigger. The software then identified the relative times of the other spike over a 2-s time window that straddled the trigger spike. When the two spikes coincided or nearly coincided, the time was determined by close inspection of the trace. Typically, when spikes partly overlapped in time, the start point of a spike was still easy to identify by a distinct break of the normal time course of the other spike (Figure 1
E). The procedure was repeated for every trigger spike encountered and a frequency distribution histogram of the spike times of non-trigger spike was created. From these histograms, we subtracted the baseline activity. The remaining number of spikes in time bins 0.0–4.9 and 5.0–9.9 ms were summed and divided by the number of trigger spikes and the result was considered the spike coupling.
All data are given as mean ± standard error of the mean (SEM).
All experiments were approved in advance by the local Swedish Animal Ethics Committee.
Properties of Double Loose Patch Dendritic Purkinje Cell Recordings
In the present study, we used single patch clamp electrodes to obtain double loose patch dendritic recordings in the current clamp mode from two different PCs simultaneously. Double loose patch dendritic recordings were only obtained in preparations that were highly mechanically stable. Double loose patch recordings were typically obtained as a side effect of failed attempts to establish a giga-Ohm seal on a single PC dendrite, and seemed to be facilitated by the application of negative pressure in the patch clamp electrode. However, double loose patch dendritic recordings were extremely rare to get and those we report represent a set obtained during a long series of investigations dedicated to obtain whole cell recordings from interneurons (Jorntell and Ekerot, 2003
) and PC dendrites.
The seal resistance of the double loose patch dendritic recordings were 190 ± 44 MOhm (N = 7). Although the membrane resistance of PC dendrites in vivo has not been reported, our preliminary data indicate that it is typically well below 40 MOhm. In other words, the seal resistance in the loose patch dendritic recordings were at least five times higher than the membrane input resistance. Under such conditions it has been shown that steady-state and dynamic changes in transmembrane potential can be recorded, although the potentials are attenuated in amplitude and a minor additional time constant is added to the recorded signal (Mason et al., 2005
). According to the data of (Mason et al., 2005
), the recorded DC potential with a ratio between the seal and membrane resistance of 5 should be in the range of 60–90% of the actual membrane potential. In our double loose patch dendritic recordings the DC potential was −35 ± 7 mV (N = 7), which corresponded to more than half of the membrane potential recorded intracellularly in the dendrites under whole cell mode (−50 to −52 mV).
According to the data of (Mason et al., 2005
, Equation 4 in that paper), the additional time constant obtained in loose patch recordings is also determined by the relationship between the membrane resistance and the seal resistance. In cases like ours, with the seal resistance being five times higher than the membrane resistance, the time constant of the recorded signal would be expected to increase by 20% as compared to the signal that would have been recorded in the whole cell mode. This is a marginal change which is compatible with the observation that for the larger of the two dendritic spikes recorded the time-course was not obviously different from the dendritic spikes recorded in the whole cell mode (Figures 1
, 3 and 4
).
However, for the smaller dendritic spike in the pair, the attenuation was more obvious, with a partial obliteration of the spikelets on top of the dendritic spike (see below). Since the amplitude of the smaller spike was much smaller than the larger spike, we may assume that the seal resistance with the former may actually be much lower than the seal resistance with the latter. According to (Mason et al., 2005
), the time constant of the recording will increase to double that of the cell when the seal resistance and cell resistance decreases to unity. This would then suggest that the seal resistance (and DC potential) we recorded were dominated by the interaction between the electrode and the larger of the two dendritic units whereas the seal resistance with the smaller of the two units was much lower, which can explain the lower amplitude of the spikelets in the latter.
Comparison with Intracellular Dendritic Recordings
To verify that the double loose patch dendritic recordings were from the dendrites of two independent PCs, we compared their activity with that of PC dendrites recorded intracellularly and with that of CF responses in somatic PC recordings. During the course of the collection of the data reported here, we have obtained approximately 100 intracellular PC dendritic recordings, which will be described in detail in a separate paper under preparation. However, since they are an important tool to demonstrate that the dual dendritic loose patch recordings really represented the activity of two independent PC dendrites, we report some of their basic characteristics here. The spontaneous activity of intracellularly recorded PC dendrites was dominated by the spontaneously active and relatively stereotyped slow spikes, often with 1–2 spikelets riding on the top (Figure 1
). Comparison with previous in vitro studies indicates that these spikelets were most likely calcium spikes whereas the underlying ‘spike’ was likely the CF EPSP (Callaway et al., 1995
). Importantly, in all intracellular dendritic recordings we obtained with the whole cell technique, the amplitude of the spontaneous dendritic spikes was similar and there were no partial or intermediate-sized events (Figure 1
C).
The double loose patch dendritic recordings differed from the intracellular recordings by showing spikes of two different amplitudes (Figure 1
D). Importantly, when these spikes coincided in time, the resulting spike simply represented the sum of the two events, which made it possible to separate the two units even when they occurred exactly at the same time (Figure 1
E). This circumstance made it possible to construct cross-correlograms of the activity of the two spikes (Figure 1
F)
All dendritic recordings used in the present study were obtained in the upper 2/3 of the molecular layer and were hence free from somatic sodium spikes, which are known to propagate passively from the soma up to the most proximal parts of the proximal dendrites (Stuart and Hausser, 1994
).
Comparison of the Activity of the Spontaneous Dendritic Spikes with Climbing Fiber Responses
The spontaneous activity of dendritic spikes, recorded in whole cell mode and in dual dendritic-attached mode, was in principle identical to that of the complex spikes recorded extracullarly in the PC layer (Figure 2
). All three types of recordings were characterized by a low spontaneous firing frequency, an extremely broad distribution of interspike intervals and a near complete absence of interspike intervals shorter than 50 ms. The shortest interspike intervals recorded were 52 ± 1.6 ms (N = 14) for loose patch dendritic recordings and 56 ± 2.8 ms (N = 12) for complex spikes recordings, again very similar values (all data based on 400–4000 spike intervals). Mean unitary firing frequency for the loose patch dendritic recordings was 2.8 ± 0.13 Hz and 2.7 ± 0.14 Hz for the complex spikes (P = 0.46 students t-test). We compared these values with those obtained from extracellular recordings of molecular layer interneurons (cf. Ekerot and Jorntell, 2001
, 2003
; Jorntell and Ekerot, 2002
). For this type of unit, the average spontaneous firing frequency was considerably higher (14.2 ± 3.4 Hz, N = 10) and at least 50% of the interspike intervals were shorter than 50 ms in all cases. Hence we conclude that the spikes that can be recorded in loose patch dendritic and intracellular recordings are likely to correspond to the CF response of the PC dendrite.
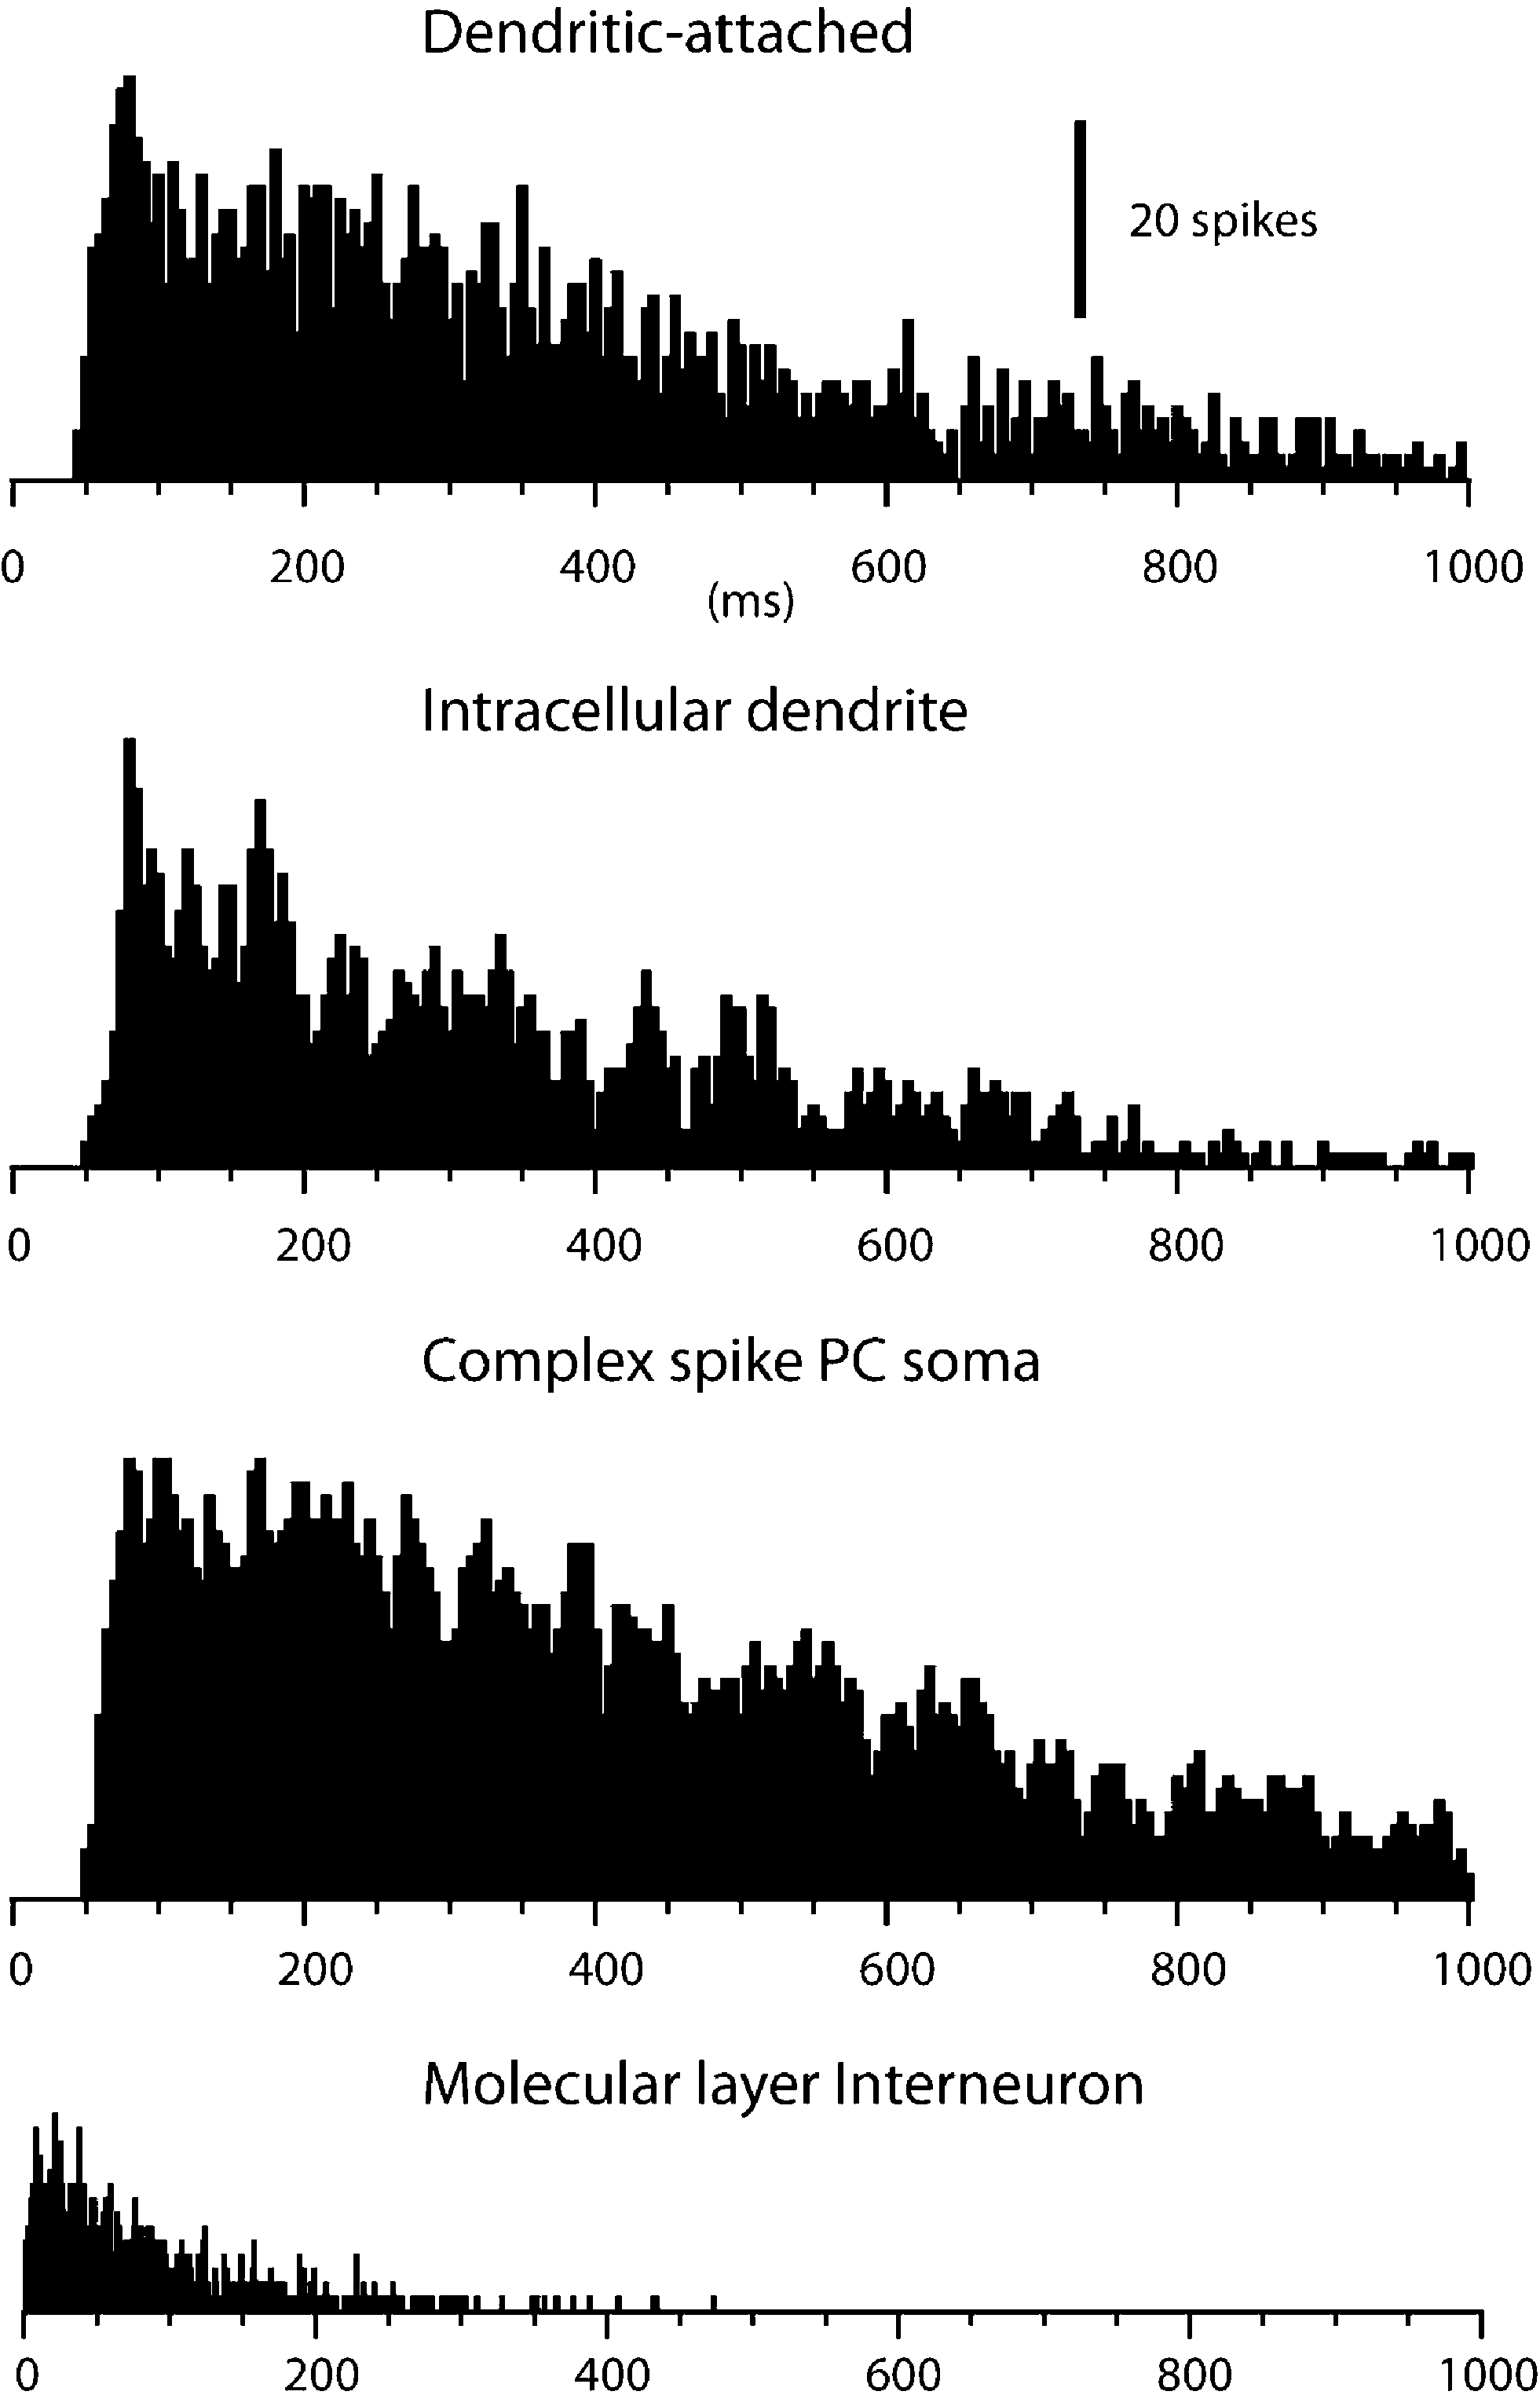
Figure 2. Spike interval-frequency histograms for dendritic and complex spikes. From the top, this figure shows the spike interval-histograms of a single unit dendritic spike, extracted from a double loose patch dendritic recording, of a dendritic spike in an intradendritic recording, and of a complex spike in a PC soma recorded extracellularly with a metal electrode. For comparison, the lowermost histogram plots the spike interval distribution of a molecular layer interneuron. Bin widths, 5 ms, except in lowermost histogram, which has a bin width of 1 ms.
Dendritic Spikes are Evoked by Climbing Fibers in an All-or-None Fashion
In addition, we also investigated the activation of dendritic spikes using electrical stimulation within the IO. In the population of the dendritic recordings, electrical stimulation in the IO evoked spike responses with a single threshold. In addition, IO stimulation always evoked the dendritic spike in an all-or-none fashion (N = 53, Intracellular and loose patch dendritic recordings). This is shown for a double loose patch dendritic recording in Figure 3
. Importantly, in the three cases tested for the double loose patch dendritic recordings, the threshold for the two dendritic spikes were identical (with 5 μA resolution), in line with the suggestion that IO neurons projecting to adjacent parts of the cerebellar cortex is located nearby each other in the IO.
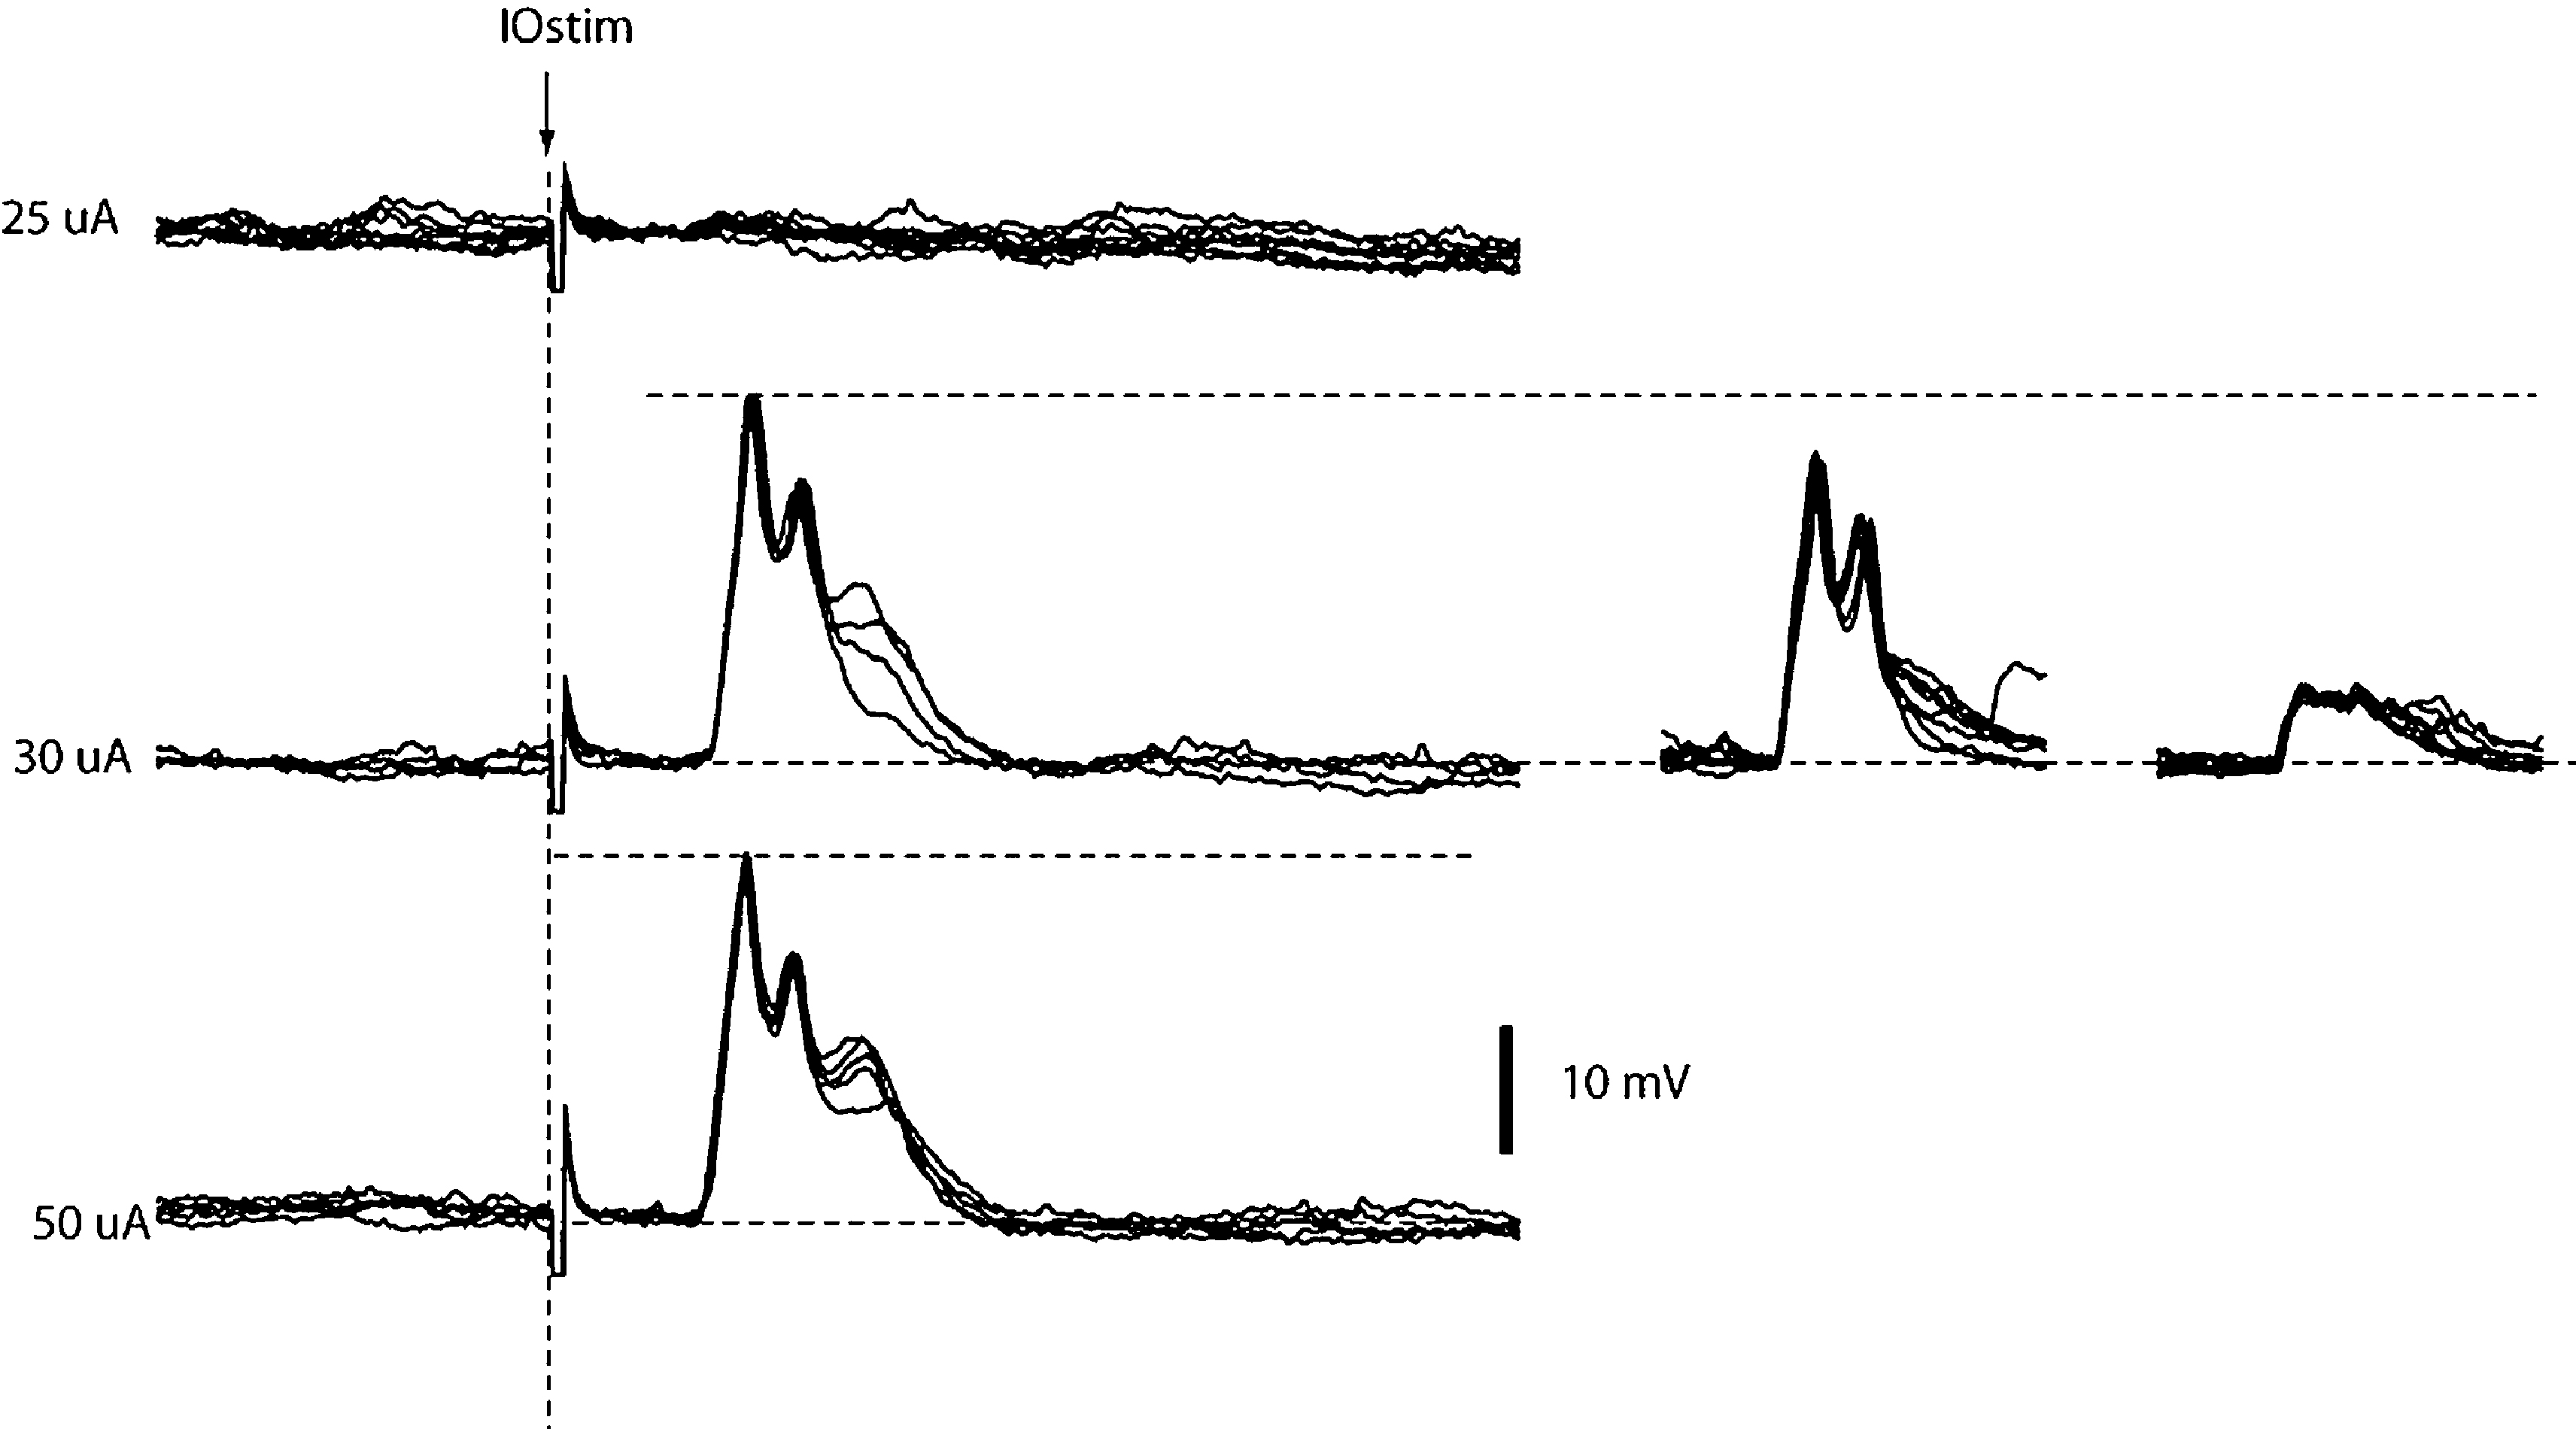
Figure 3. IO stimulation activates the dendritic spikes in an all-or-none fashion. From top to bottom, the responses evoked in a double loose patch dendritic recording by increasing stimulation intensities in the inferior olive (IOstim). Inset to the right, the spontaneous responses of the individual unitary dendritic spikes superimposed. Note that the peak amplitude of the response evoked by IOstim represented the sum of the two unitary dendritic spikes, showing that both dendritic spikes were activated by the stimulation.
Coupling Between Dendritic Spike Pairs
Figure 4
illustrates the cross-correlograms and the calculated coupling between two dendritic units recorded simultaneously in a single-electrode double loose patch dendritic recording. This method differs somewhat from previous investigations, which focused on CF synchrony within ±1 ms of the ‘master’ cell (Lang et al., 1999
; Sugihara et al., 2007
). Instead, in order to provide a more complete measure of coupling, where the discharge of one IO cell leads the discharge of an adjacent IO cell, we measured the probability with which the discharge of one IO cell was followed by a discharge in its putative neighbor within a time window of 0–10 ms (Figure 4
C). This can be motivated by the fact that the time constant of the electrotonic coupling between IO neurons and the long duration of the IO action potential result in that the peak depolarization in an IO neuron is reached in the order of 5–10 ms after the occurrence of the spike in the coupled neuron (Devor and Yarom, 2002
; Llinas and Yarom, 1981
). From our recordings, we found that most of the spike couplings between a pair of dendritic spikes were observed at about 2–7 ms, whereas the number of exact coincidences (i.e. at 0–1 ms) was comparatively much lower (in the order of 10% of the total number of the spikes that were defined as triggered by the other dendrite’s spike). Mean baseline activity was subtracted and the sum of the remains in the two bins (Figure 4
C) were divided by the number of ‘trigger’ spikes. Measured in this way, the coupling between adjacent dendritic spikes was 7.7 ± 0.9% (N = 14).
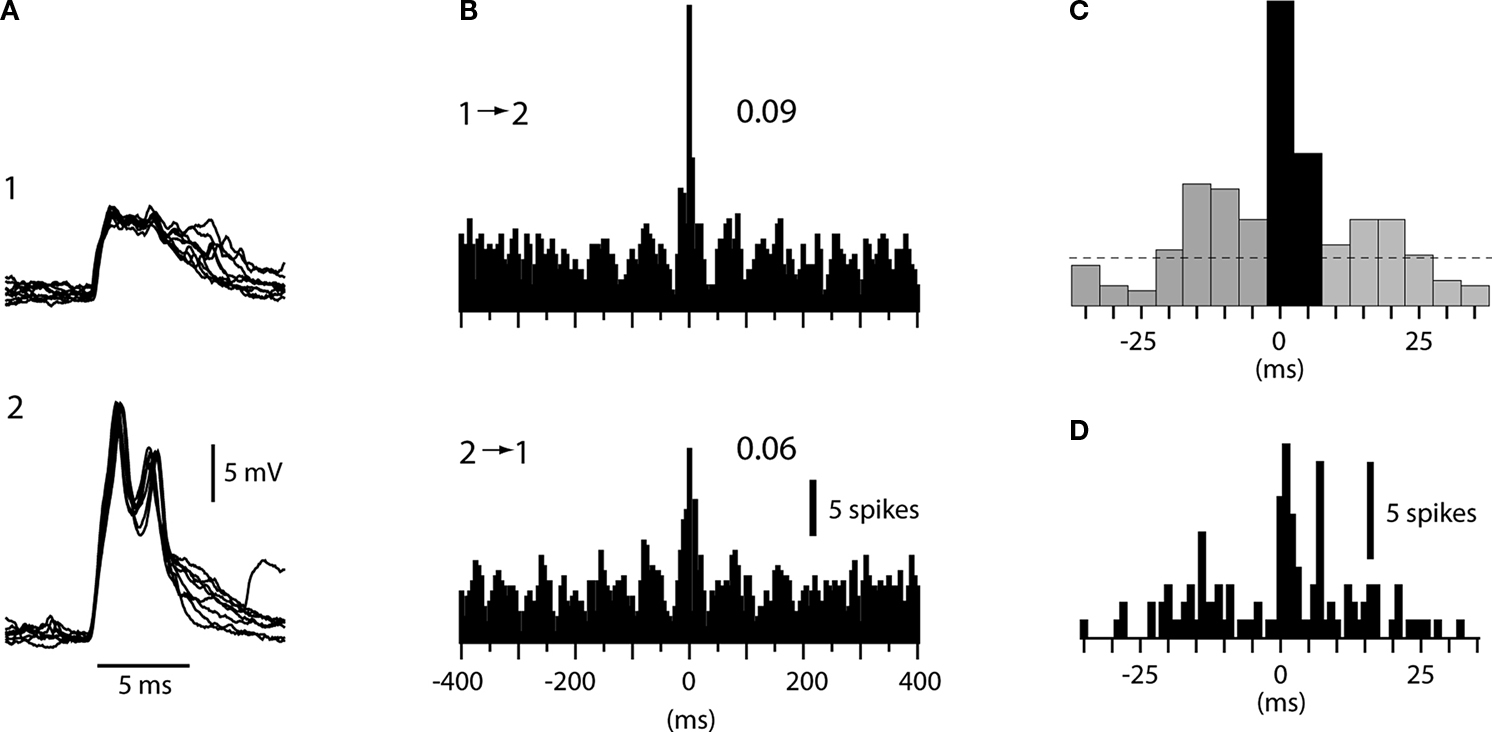
Figure 4. Coupling between dendritic spikes in paired loose patch dendritic recordings. (A) Superimposed dendritic spikes of the two dendritic units. (B) Cross-correlograms of the spontaneous activity of the two dendrites. In the upper histogram, the spike times of dendrite 2 relative to the occurrence of the dendritic spike 1 was plotted. The reverse relationship was plotted in the lower histogram. Numbers indicate degree of coupling. Bar calibration applies to (B) and (C). (C) Close-up of the upper histogram in (B) illustrating the bins that were used for the analysis of the spike coupling (black bars). Dashed line indicates the mean background activity. Note that the first bin includes all spike intervals of 0.0–4.9 ms, the second includes all spike intervals between 5.0–9.9 ms etc. (D) For comparison, the same histogram with 1 ms bin width.
It can be noted that in this case, the spikes tended to be activated in an oscillatory pattern (Figure 4
B). Such patterns were not observed for all dendritic pairs (cf. Figure 1
C) and were not analyzed further.
Using a not previously described type of recording, the single-electrode double loose patch dendritic recording, we investigated the degree of CF coupling in pairs of adjacent PC dendrites. We found that the coupling was not particularly strong, less than 8% of the CF discharges of one dendrite were coupled to the CF discharges of an adjacent dendrite. These values were essentially similar to those found for PC pairs located within 250–500 μm in the same sagittal axis of rodents (Lang et al., 1999
). Hence, the findings indicate that spike coupling between IO neurons exist in the non-anesthetized, decerebrated cat but do not support that adjacent PCs are substantially more coupled than more remotely located PCs within the same microzone.
The double loose patch dendritic recordings we report here are likely to be closely related to loose patch clamp recordings. In the latter type of recording, a tight seal between the electrode and the recorded unit allows measurement of its transmembrane potential, the accuracy of which depends on the ratio between the seal resistance and the resistance of the recorded cell (Mason et al., 2005
). Due to the comparatively small dimensions of distal, spiny dendrites, we believe that patch clamp recordings is most likely to be primarily obtained from the smooth stem dendrites, which ascend nearly all the way up to the upper end of the molecular layer. Since PCs are extremely flat (the transverse dimension being in the order of 10 μm, see Ito, 1984
; Sugihara et al., 1999
) their packing density in the transverse direction also becomes very high. Hence, it is likely that the stem dendrites of two adjacent PCs may at least for a part of their course be located in very close proximity to each other. Our paired loose patch dendritic recordings, which were obtained on rare occasions during failed attempts to establish a giga-Ohm seal on a PC dendrite, presumably reflect situations when the patch electrode happened to be located in a site where two stem dendrites were co-localized. The maintained suction in the patch electrode presumably resulted in the attraction of both of these stem dendrites and a partial access to both membrane surfaces.
The configuration of the spikes recorded was compatible with them being dendritic calcium spikes: for the biggest of the two units, the appearance was very similar to calcium spikes recorded from PC dendrites in the whole cell (intracellular) mode (Figure 1
). For the smaller unit of the pair, the basic time course was also similar, but there was a reduction of the spikelets riding on top of the spike – this can be explained by the fact that in the loose patch mode an additional time constant is added to the recorded signal, and this time constant is increased as the seal resistance on the cell is decreased (Mason et al., 2005
). We believe that the larger unit simply reflected the dendrite which was located closer to the electrode whereas the smaller unit recorded was located at a larger electrical distance.
The other spiking unit of the molecular layer, the interneurons, could essentially be excluded as a source of the recorded signals already on basis of the discrepancy in spike duration/configuration (Jorntell and Ekerot, 2003
), but additional analysis of the patterns of spontaneous activity strengthened this conclusion (Figure 2
). Also the fact that the response latency time and response reliability on IO stimulation was very different from those reported from interneurons (Jorntell and Ekerot, 2002
, 2003
), exclude the possibility that some of our recordings were from interneurons. In addition, since the level of spontaneous activity and the interspike-interval distributions of dendritic spikes and complex spikes recorded from PCs were essentially identical, it is most likely that all of the signals we recorded in the loose patch dendritic mode were due to CF activation of dendritic spikes. Since CF inputs in vivo always transmit to the PC (for example, sensory activation can drive the CF response of a single PC with 100% security at a response latency time coefficiency of variation of 0% (at 1 ms resolution); Jorntell et al., 1996
), the dual dendritic signals must also have reflected input from two different CFs.
The point with the single-electrode double loose patch dendritic recordings was that they described the CF activity of two adjacent PC dendrites, which could correspond to the activity of two adjacent neurons in the IO. Anatomical evidence supports the notion that within a microzone, more closely located PCs tend to be innervated by more closely located IO neurons (Garwicz et al., 1996
; Sugihara et al., 2007
). Such recordings should therefore be well suited to study the coupling of CF activity.
Although we used a similar method but a different time window in comparison to previous studies (De Zeeuw et al., 1997
; Flusberg et al., 2008
; Lang, 2001
, 2002
; Lang et al., 1999
) the values of CF synchrony are at least roughly comparable. In their analysis of CF synchrony De Zeeuw et al. (1997)
used several different time frames and showed that for a time window of ±10 ms, the calculated level of CF synchrony was about two times higher than for a time window of ±1 ms. We measured spikes that followed the trigger spike at up to +10 ms and our values may therefore be considered as being similar to the values obtained from previous studies.
An important difference between this and previous electrophysiological studies was that we focused on spike coupling, i.e. when one CF discharge coincides with or precedes the CF discharge in another PC. Previous works have instead focussed on coincidence within ±1 ms of a ‘master’ cell (i.e. the ‘trigger’-spike of our cross-correlograms) (Lang et al., 1999
), or an even wider time window that straddles the spike onset of the ‘master’ cell (De Zeeuw et al., 1997
). We believe that the distinction could be important, since discharges in one CF that is driven by the electrotonic coupling between IO neurons can only occur after the discharge of the ‘master’ CF. Due to the long duration of the IO neuron action potential (the fast sodium spike is followed by a calcium plateau of substantial amplitude and duration; Llinas and Yarom, 1981
) and the time constant in the electrotonic coupling, the peak depolarisation (approx. 2 mV) in an IO neuron is reached in the order of 5–10 ms after the occurrence of the spike in the coupled neuron (Devor and Yarom, 2002
; Llinas and Yarom, 1981
; Long et al., 2002
). For spike discharges that coincides exactly or slightly precedes the ‘master’ cell, the reason for the synchrony could be a shared drive rather than direct coupling through gap junctions. Among the numerous factors that could contribute to both spike synchrony and spike coupling, there are four main alternatives (Figure 5
).
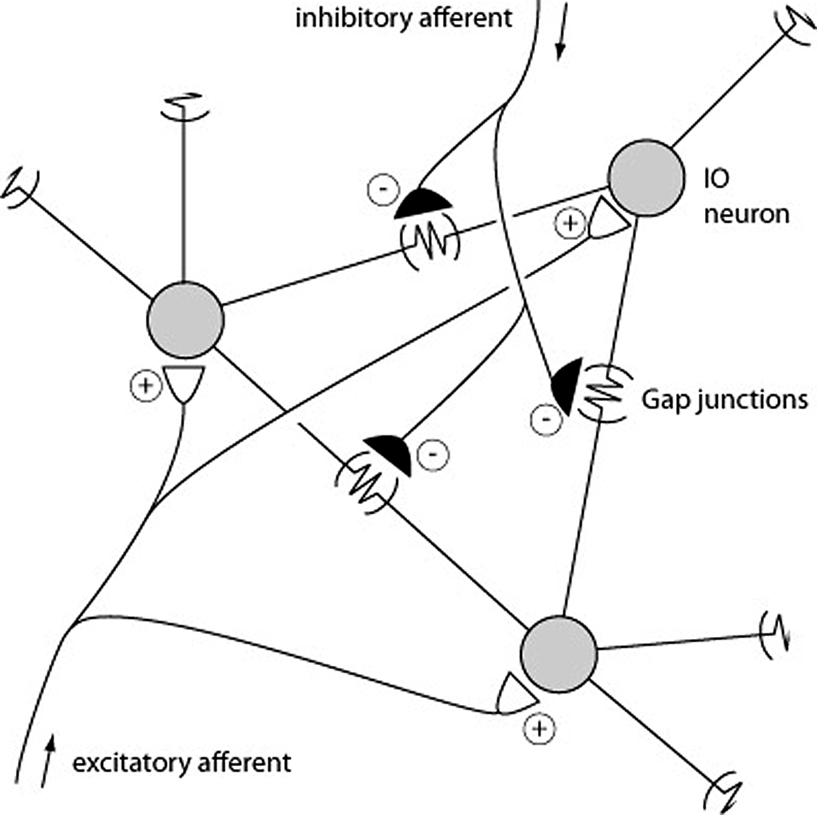
Figure 5. Schematic description of mechanisms that could promote CF synchrony. Three IO neurons and their gap junction couplings are illustrated. ‘Half’ junctions extending towards the outer edges indicate that the gap junction couplings include additional IO neurons that are not depicted. Also illustrated are the excitatory and inhibitory afferents. Some inhibitory afferents terminate specifically on the sites of gap junctions (De Zeeuw et al., 1989
).
1. Gap junctions: provide a means by which the membrane potential of one cell influences the membrane potentials of its coupled neighbors. However, the resistance is high (5 GOhm) and the signal that passes through is low-pass filtered. Hence, a full spike in one IO neuron suffices to give a few mVs of depolarization in its coupled neighbor with a substantially reduction of its rise-time and time-course (Devor and Yarom, 2002
; Llinas and Yarom, 1981
; Long et al., 2002
). Hence, the coupling mediated by gap junctions should be relatively weak and impose a certain delay on the spike coupling. Nevertheless, in mice with a knocked-out gene expression of the gap junction component, spike synchrony (at ±1 ms) has been reported to be substantially reduced (Marshall et al., 2007
).
2. Excitatory afferent input: Evoked excitatory afferent input to the IO can drive CF responses in all of the PCs of a microzone within a few 100’s of a μs with a near 100% fidelity (e.g. Jorntell et al., 1996
). Blocking spontaneously active excitatory synapses in the IO enhances synchrony within the microzone (Lang, 2001
, 2002
).
3. Inhibitory afferent input: the parasagittal specificity of the CF synchrony has been shown to be under the control of inhibitory input (Lang, 2002
), possibly due to the inhibitory projection from the deep cerebellar nuclei (DCN) to the IO (Bengtsson and Hesslow, 2006
). This can be understood as a consequence of the fact that the passive electrotonic spread is normally limited to pairs of neighboring IO neurons (Devor and Yarom, 2002
), but that a release from inhibition may increase the excitability of the IO neurons and thereby the electrotonic spread within the IO. Conversely, this mechanism could under normal levels of inhibition ensure that the highest degree of synchrony is limited to the IO neurons with the shortest electrotonic distances.
4. Subthreshold intrinsic oscillatory activity: This is an intrinsic form of activity that is set up by the membrane conductances of the IO neurons. It appears to drive episodes of subthreshold oscillations in the membrane potential that may coordinate the spike generation in neighboring IO neurons if the oscillations are in phase. Some studies have indicated that these oscillations disappear when gap junctions are blocked or non-existent (Placantonakis et al., 2006
), although contrary evidence exists (De Zeeuw et al., 2003
; Long et al., 2002
). Oscillatory activity in IO neurons has been described also in vivo (Chorev et al., 2007
; Khosrovani et al., 2007
).
CF synchrony has been suggested to be an important way to elicit timed movements (Welsh et al., 1995
). However, in the system studied here, which contributes to the voluntary control of limb, paw and digit movements (Ekerot et al., 1995
; Jorntell and Ekerot, 1999
), CF activation is severely depressed during such movements (Apps et al., 1997
; Gibson et al., 2004
; Horn et al., 2004
). Furthermore, at least in this system, each DCN cell is contacted by 100’s of PCs from the same microzone (Garwicz and Ekerot, 1994
; Palkovits et al., 1977
). If the output of a microzone is summed in the DCN, a substantial cortical influence on the DCN activity may require concerted actions of a higher number of PCs than could be achieved with the relatively low degree of spike coupling found here (even more so if the CF activation is depressed during movement). However, synchronization of CF activity within a microzone may be an important mechanism to achieve coordinated learning. Since both PCs and their afferent inhibitory interneurons are subjected to CF dependent forms of parallel fiber synaptic plasticity, it may be important to have a synchronized CF disharge within the microzone in order for the cells to learn to respond to parallel fiber inputs that are activated under similar circumstances. This in turn, may be a requirement to provide a sufficient coordination of the PC simple spikes so that the output of the microzone may provide a substantial modulation of the DCN output.
The authors declare that the research was conducted in the absence of any commercial or financial relationships that could be construed as a potential conflict of interest.
This work was supported by SENSOPAC (an Integrated Project funded by the EU under FP6, IST-028056-SENSOPAC), the Swedish Medical Research Council (project no. K2005-04X-14780-03A and K2006-04X-08291-19-3), the Segerfalk Foundation, the Swedish Medical Society.
De Zeeuw, C. I., Chorev, E., Devor, A., Manor, Y., Van Der Giessen, R. S., De Jeu, M. T., Hoogenraad, C. C., Bijman, J., Ruigrok, T. J., French, P., Jaarsma, D., Kistler, W. M., Meier, C., Petrasch-Parwez, E., Dermietzel, R., Sohl, G., Gueldenagel, M., Willecke, K., and Yarom, Y. (2003). Deformation of network connectivity in the inferior olive of connexin 36-deficient mice is compensated by morphological and electrophysiological changes at the single neuron level. J. Neurosci. 23, 4700–4711.