Comparative Transcriptomics of the Bovine Apicomplexan Parasite Theileria parva Developmental Stages Reveals Massive Gene Expression Variation and Potential Vaccine Antigens
 Kodzo Atchou1,2
  Juliette Ongus1
  Eunice Machuka1,2
  John Juma2 Christian Tiambo2 Appolinaire Djikeng3 Joana C. Silva4,5
  Roger Pelle2*
- 1Institute for Basic Sciences, Technology and Innovation, Pan African University, Nairobi, Kenya
- 2Biosciences eastern and central Africa—International Livestock Research Institute (BecA-ILRI), Nairobi, Kenya
- 3Centre for Tropical Livestock Genetics and Health, The Roslin Institute and Royal (Dick) School of Veterinary Studies, The University of Edinburgh, Scotland, United Kingdom
- 4Institute for Genome Sciences, University of Maryland School of Medicine, Baltimore, MD, United States
- 5Department of Microbiology and Immunology, University of Maryland School of Medicine, Baltimore, MD, United States
Theileria parva is a protozoan parasite that causes East Coast fever (ECF), an economically important disease of cattle in Africa. It is transmitted mainly by the tick Rhipicephalus appendiculatus. Research efforts to develop a subunit vaccine based on parasite neutralizing antibodies and cytotoxic T-lymphocytes have met with limited success. The molecular mechanisms underlying T. parva life cycle stages in the tick vector and bovine host are poorly understood, thus limiting progress toward an effective and efficient control of ECF. Transcriptomics has been used to identify candidate vaccine antigens or markers associated with virulence and disease pathology. Therefore, characterization of gene expression throughout the parasite's life cycle should shed light on host–pathogen interactions in ECF and identify genes underlying differences in parasite stages as well as potential, novel therapeutic targets. Recently, the first gene expression profiling of T. parva was conducted for the sporoblast, sporozoite, and schizont stages. The sporozoite is infective to cattle, whereas the schizont is the major pathogenic form of the parasite. The schizont can differentiate into piroplasm, which is infective to the tick vector. The present study was designed to extend the T. parva gene expression profiling to the piroplasm stage with reference to the schizont. Pairwise comparison revealed that 3,279 of a possible 4,084 protein coding genes were differentially expressed, with 1,623 (49%) genes upregulated and 1,656 (51%) downregulated in the piroplasm relative to the schizont. In addition, over 200 genes were stage-specific. In general, there were more molecular functions, biological processes, subcellular localizations, and pathways significantly enriched in the piroplasm than in the schizont. Using known antigens as benchmarks, we identified several new potential vaccine antigens, including TP04_0076 and TP04_0640, which were highly immunogenic in naturally T. parva-infected cattle. All the candidate vaccine antigens identified have yet to be investigated for their capacity to induce protective immune response against ECF.
Introduction
Cattle production constitutes a significant component of agriculture, economy, and food security in the world, especially in developing countries (1, 2). East Coast fever (ECF) is a lymphoproliferative and lymphodestructive disease of cattle caused by the hemoprotozoan Theileria parva, mainly transmitted by the tick vector Rhipicephalus appendiculatus. ECF kills one cow every 30 s and has a devastating impact on pastoralists and smallholder farmers because of its rapid effect, since animals often die within 3 to 4 weeks of infection [reviewed by (3)]. This causes significant economic losses in 12 countries in eastern, central, and southern Africa regions (3–6). As the infected tick feeds on cattle, the sporozoites are inoculated in the mammalian host at the feeding site. The sporozoites then invade host lymphocytes and differentiate into multinucleate bodies, called schizonts, in the cytoplasm of infected lymphocytes after a period of 3 days. Schizonts cause the transformation of infected host white blood cells, inducing a phenotype similar to cancer (7, 8). Schizonts undergo merogony, and the released merozoites invade erythrocytes and form piroplasms, which are infective to the feeding tick that ingests parasitized erythrocytes (9). A method of vaccination, whereby infection of cattle with live T. parva sporozoites is done simultaneously with treatment with long-acting oxytetracycline, was developed over 40 years ago (10). This resulted in a live vaccine called the Muguga Cocktail, which was developed based on a combination of three T. parva stocks, the Muguga, Kiambu 5, and Serengeti-transformed stocks. The Muguga Cocktail generates long-lasting immunity in vaccinated cattle against challenge with homologous T. parva stocks. However, ITM-vaccinated animals usually remain carriers of the vaccine parasite strains and a source of infections to ticks. Tremendous progress was made on ECF research. Publication of a reference genome sequence of T. parva has led to a more thorough characterization of the pathogen and of the Muguga Cocktail strains (11–13). But, extensive efforts to develop alternative, more easily manufactured and user-friendly, subunit vaccines have met with limited successes (3). Therefore, it is imperative to identify more candidate vaccine antigens. Gene expression profiling, including high-throughput transcriptomics, has been used to identify potential diagnostic and therapeutic targets as well as to correlate gene expression profiles to pathologic diagnosis, clinical outcomes, or therapeutic response (14, 15). Moreover, transcriptomics enables predictive analysis of the structure, location, role, and functional motifs of genes and its product. Recently, a comparative transcriptome profiling of T. parva was done on two life cycle stages in ticks, the sporoblast and the sporozoite (the latter is transmissible from tick to cow upon tick feeding), and on the pathogenic schizont stage (16). No work has yet been done on the piroplasm stage that is transmissible from cattle to ticks. That first comparative transcriptomic analysis revealed that the development of the parasite from the sporozoite in the tick vector into the schizont in the bovine host cells is accompanied by a drastic increase of upregulated genes, though the 10 most highly expressed genes occurred in the arthropod stages. It also identified several genes with expression similar to known candidate vaccine antigen genes and revealed errors in the structural annotation of the T. parva genome. The present study was then set up to extend the analysis of T. parva gene expression profiles to the piroplasm stage in comparison to the schizont stage, using the Illumina MiSeq next-generation sequencing platform. Furthermore, data from previous (16) and current studies were combined in our analysis for the search of new candidate vaccine antigens.
Materials and Methods
Sample Collection and Purification
Ethics Statements
The study reported here was carried out in strict accordance with the recommendations in the standard operating procedures of the ILRI IACUC and adequate consideration of the 3R's (replacement of animal with non-animal techniques, reduction in the number of animals used, and refinement of techniques and procedures that reduce pain and distress). The ILRI's Experimental Animal Request Form and Protocol for blood collection was approved by the ILRI IACUC (IACUC ref no. 2006.9, IACUC ref no. 2006.10, IACUC ref no. 2007.10, and IACUC-RC2015-23).
T. parva schizonts proliferate in the white blood cells, whereas piroplasms develop in the red blood cells of the host. Schizont-infected bovine lymphocytes are easily cultured in vitro. Thus, the schizont parasites were purified from approximately 2 × 10⁸ cells that were obtained from the in vitro established T. parva (Muguga) schizont-infected bovine peripheral blood mononuclear cell line TpM 3087 at the International Livestock Research Institute, as previously described (16, 17). Four different schizont purification assays were performed. The piroplasm parasites were purified from T. parva (Muguga)–infected calf blood when the parasitemia reached 3–70%, as previously described (18). Three piroplasm purification experiments were conducted. For this study, piroplasms and schizonts were T. parva Muguga stabilate 3087, previously described by Tonui et al. (16).
RNA Extraction and cDNA Library Preparation
Purified schizont and piroplasm parasite samples were processed for total RNA extraction and purification using the RNAzol® RT isolation kit following the manufacturer's instructions (Sigma-Aldrich, USA). T. parva total RNA contains an abundant ribosomal RNA that migrates as a strong band between the 18 and 28S host bovine rRNA on a 1.5% agarose gel electrophoresis (19). We used this approach to verify that RNA samples contained T. parva RNA and were not degraded before we proceeded with subsequent analyses. Then, isolated RNA was quality-checked and quantified using the Nanodrop®-1000 spectrophotometer (Nanodrop Technologies, Delaware, USA). We further checked the integrity of the RNA using 1.2% agarose RNA gel, as described previously (20). The poly(A)+RNA was purified from the total RNA (16). The integrity and quantity of poly(A)+RNA were checked as above; then, 10 ηg of RNA was used for each library. Normalization of the schizont and piroplasm poly(A)+RNA was done using Ambion® ERCC Spike-In Control, as described before (15). The TruSeq stranded total RNA Kit (Illumina Inc., USA) was used for the library preparation according to manufacturer instructions. The library concentration was checked using the Qubit® (Thermo Scientific, USA) broad range and high sensitivity reagents, while the integrity was checked using the Agilent Bioanalyzer 2200 TapeStation system. For the sequencing, each library was diluted before being pooled for sequencing to avoid over-clustering errors on the sequencer.
Sequencing and Differential Expression Analysis
Paired-end RNA sequencing was done at the Biosciences eastern and central Africa-International Livestock Research Institute (BecA-ILRI) Hub using an Illumina MiSeq sequencer following manufacturer guidelines. The reads obtained were transferred to the ILRI High-Performance Computing (HPC) server for bioinformatics data analysis. The nucleotide sequence data reported in this study are available in the NCBI database under the accession number PRJNA604662. The quality control of the raw reads was done using FastQC 0.11.5 (21). The reads were cleaned, and the adapters were trimmed using trimmomatic/0.38 and cutadap 1.16 (22, 23). An index of the T. parva transcriptome was then built, based on the original genome annotation (11). The trimmed reads were used for the mapping against the built transcriptome using Kallisto version 0.43.0 (24). The T. parva reference transcriptome (accession no. GCF_000165365.1_ASM16536v1) was retrieved from NCBI GenBank. An RNA-seq pipeline was developed using a custom Python script 3.7 for the analysis from the quality control to the quantification. The read counts were normalized to transcripts per kilobase million (TPM). The count table (h5 format) was exported to R for the gene expression analysis. In order to confirm the statistically significant changes in gene expression and the complete data set for different stage pairwise comparisons, gene expression analysis was conducted. Bioconductor DEseq2 (25) based on the negative binomial distribution packages was used to identify differentially expressed genes at the different parasite stages. Genes were regarded to be differentially expressed when the q value cutoff (FDR adjusted p-value using Benjamini–Hochberg model) was lower than 0.05. The differentially expressed genes were plotted using the Bioconductor EnhancedVolcano package in R (26).
The quality control was also performed on the unmapped reads. They were de novo assembled to form contigs using Trinity v2.6.6 (27). The transcripts were then blasted against the non-redundant (nr) GenBank database. The hit contigs from Trinity were mapped back to the T. parva reference genome.
Functional Enrichment of the Differentially Expressed Genes and Vaccine Candidate Antigen Prediction
Functional annotation of the significant differentially expressed genes between the infection stages was performed using the Database for Annotation, Visualization and Integrated Discovery (DAVID Bioinformatics Resources 6.8, NIAID/NIH). Gene Ontology (GO) term enrichment was analyzed for functional classification of selected up- and downregulated genes in each of the two parasite stages. In silico search of the N-terminal signal peptide (SP), trans-membrane domain (TMD), nuclear localization signal (NLS), C-terminal glycosylphosphatidylinositol (GPI) anchor signal, prediction of protein function, and non-classical protein secretion were analyzed using bioinformatics tools SignalP 4.0 (28), Protter server (29), PredictProtein (30), PredGP (31), and SecretomeP 2.0 server (32), respectively, as described previously (16, 33).
Genes having similar expression patterns to known T. parva vaccine antigens were also identified using PAM unsupervised clustering algorithm in R with k = 50 (34, 35). Antibody epitope residue scores (B-cell epitopes) were predicted using BepiPred Linear Epitope Prediction 2.0 (http://tools.iedb.org/bcell) for genes encoding proteins predicted to be localized on the surface of the parasite (having a predicted TMD or GPI anchor). The prediction tools are available on the Immune Epitope Database Analysis Resource (IEDB) (http://tools.iedb.org/). The Kyoto Encyclopedia of Genes and Genomes (KEGG) database (https://www.genome.jp/kegg/) (36) was used to predict the metabolic pathway of the proteins, whereas MDLocProtein (37), YLoc (38), and WOLF PSORT II (39) were used to identify the subcellular localization of the proteins having a predicted domain.
Preliminarily Validation of Candidate Vaccine Antigens Using an Enzyme-Linked Immunosorbent Assay
Selected sera from naturally infected and ECF-positive cattle, identified using a polymorphic immunodominant molecule (PIM)–based indirect enzyme-linked immunosorbent assay (ELISA) test (40, 41), were used to assess the antigenicity of potential vaccine antigens and predicted epitopes. The antigen open reading frame was PCR amplified, cloned into a pET-32a+ plasmid vector, then over-expressed in Escherichia coli BL21, and affinity-purified as previously described (42). The BepiPred-predicted peptide epitopes were synthesized and lyophilized (Pepscan, Netherlands). Peptides were dissolved in 1 ml of 50% (v/v) analytical grade acetonitrile/water (Applied Biosystems) to a final concentration of 2 mg/ml (2 μg/μl). The ELISA was performed as previously described (41) with a serum dilution of 1:5. Each serum was tested three times. The plates were read at 405 nm with the Immunoskan ELISA reader using the program EDI. Data analysis was performed using the ELISA program integrated into the ELISA reader and the results were presented as percent positivity (PP). Predetermined bovine positive (PP ≥ 80) and negative control (PP ≤ 10) sera and antigen (lysate from culture of E. coli BL21 containing pET-32a+ plasmid vector expressing thioredoxin fusion tag) were included in each ELISA test plate. Optical density (OD) readings from the reference positive control sera were used to compute the PP for the test sera. PP values of 20 and above were considered positive for T. parva as previously described (41, 43). Selected ECF-positive sera were collected in 2017 at Gitega and Gankuzo, Burundi, and stored at BecA-ILRI Hub (Courtesy of Dr Lionel Nyabongo, ISABU, Burundi).
Results
Kallisto Read Mapping to the Reference Transcriptome
Previously, we showed that Kallisto generates more mapped reads than TopHat2 (16). Therefore, Kallisto was used to map schizont and piroplasm paired-end reads to the T. parva reference transcriptome and to quantify transcript abundance in each sample replicate (Supplementary Data File 1). Out of 3,717,927 schizont trimmed reads, the average percentage of mapped reads for the four technical replicates was 60%, while out of 3,143,345 piroplasm trimmed reads, the average percentage of mapped reads for the three technical replicates was 85% (Table 1). The schizont reads mapped to transcripts of 3,891 genes, whereas reads from the piroplasm mapped to transcripts of 3,887 genes. In total, 4,061 different protein coding genes were identified by the combined schizont and piroplasm reads out of a possible 4,084 protein coding genes predicted by the recent re-annotation of the T. parva genome (44).
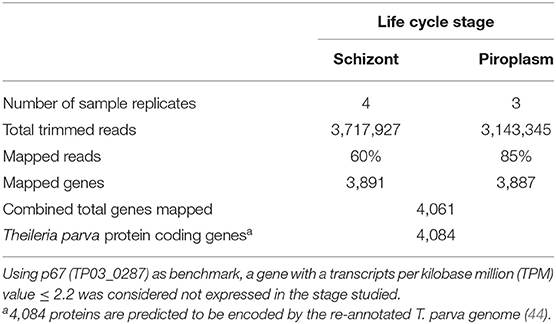
Table 1. Percentage of reads mapped to the reference genome transcriptome using Kallisto and number of mapped genes.
Kallisto was used to normalize the counts in TPM, to avoid biases induced by external factors. The normalization is essential to ensure that the expression distributions of each sample are similar across the entire experiment to account for differences in gene length and in sequencing depth across replicates. The gene expression data were displayed using clustering methods that group genes and sample replicates together based on the expression pattern similarities. Samples' distance matrix of replicates (Figure 1A) and principal component analysis (PCA) analyses (Figure 1B) clustered the replicates according to the life cycle stages and the divergence between each pair of samples (Figure 1). No significant difference was observed among replicates of the same life cycle stage. The four schizont replicates clustered together, while the three piroplasm replicates also clustered together.
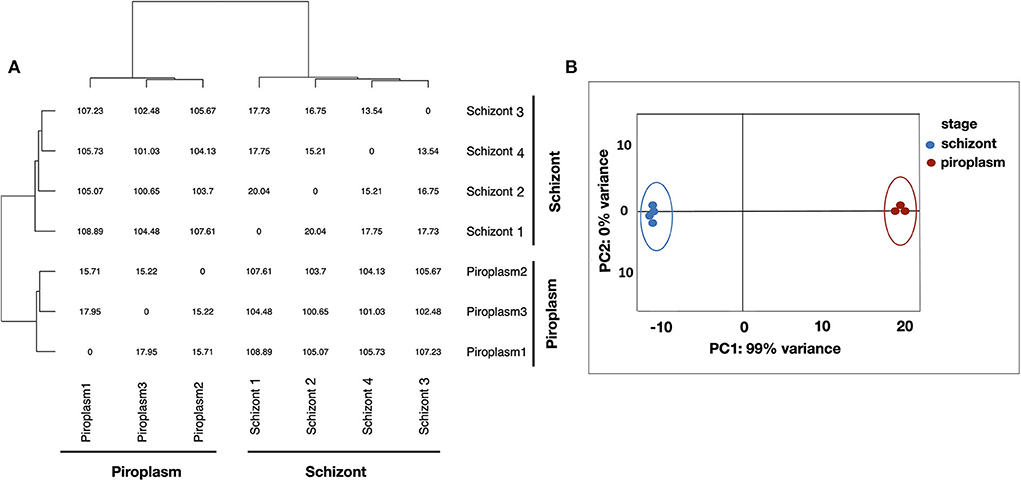
Figure 1. Clustering analysis of samples. (A) Samples' distance matrix of replicates clustering schizont and piroplasm replicates according to the life cycle stages. (B) Principal component analysis (PCA) of the replicates showing a variance of 99% between the schizont (blue) and piroplasm replicates (red).
Gene Expression in the Schizont and Piroplasm Stages of T. parva
We used the sporozoite antigen p67 (TP03_0287), which is not expressed in the schizont stage, as a benchmark to set the minimum TPM expression threshold above 2.2 (TPM > 2.2). Therefore, a gene with a TPM value ≤ 2.2 was considered not expressed in the life cycle stages studied. Pairwise comparison was performed in the piroplasm relative to the schizont stage. Thus, 3,279 genes were differentially expressed between the two stages, with roughly half of them being significantly upregulated in each stage (Figure 2). We found that 1,624 (51%) genes were upregulated, whereas 1,656 (49%) were downregulated in the piroplasm with reference to the schizont (Figure 2).
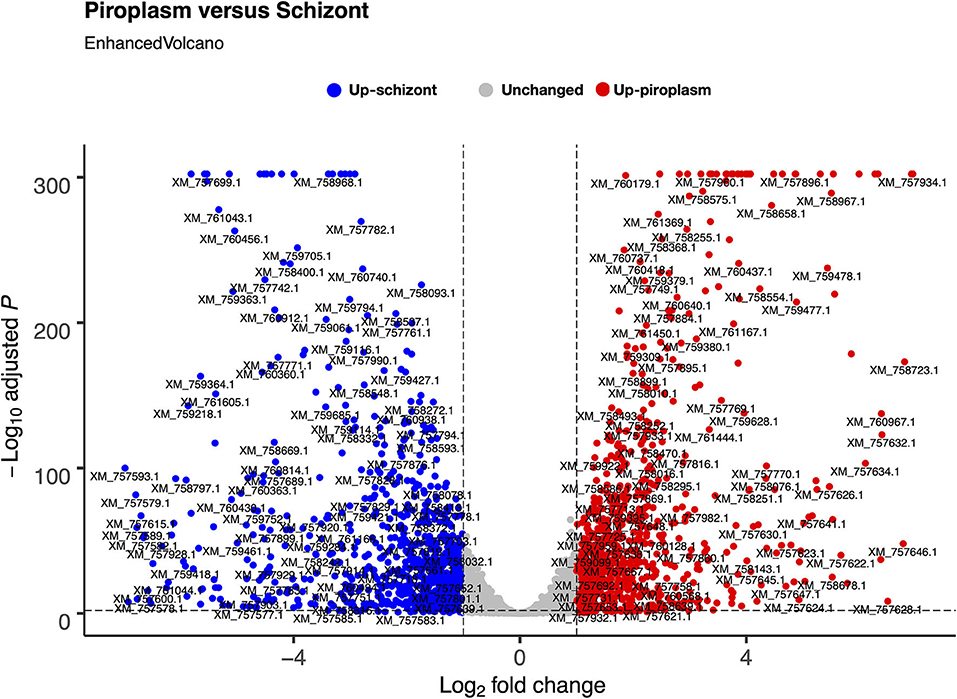
Figure 2. Differential gene expression between schizont and piroplasm stages using Bioconductor EnhancedVolcano package in R. The graph shows the distribution of the upregulated genes between schizont (blue dots) and piroplasm (red dots) stages with the exception of the non-differentially expressed or unchanged genes (gray dots). Each dot in the EnhancedVolcano diagram represents one differentially expressed gene. The x-axis represents the Log2 fold change, and the y-axis shows the –Log10 adjusted P-value.
A heatmap of the differentially expressed genes was also generated with clustering methods that group genes and replicates by gene expression profile, showing once again that replicates from the same life cycle stage are most similar to each other (Figure 3A). A heatmap was also performed to identify the profile of the top 20 most variable genes across the two stages studied, which showed that 8 were upregulated in the schizont stage (Figure 3). These were: XM_757611.1 (TP05_0035), XM_757608.1 (TP05_0032), XM_760371.1 (TP02_0896), XM_757595.1 (TP05_0019), XM_757604.1 (TP05_0028), XM_757605.1 (TP05_0029), XM_757596.1 (TP05_0020), and XM_758863.1 (TP04_0321). Some of them code for hypothetical proteins with SP and/or TMDs such as TP05_0020, TP05_0035, and TP05_0032. The remaining 12 most differentially expressed genes were downregulated in the schizont and highly expressed in piroplasm [XM_760801.1 (TP01_0367), XM_759800.1 (TP02_0327), XM_758327.1 (TP03_0400), XM_758142.1 (TP03_0217), XM_758455.1 (TP03_0520), XM_758206.1 (TP03_0281), XM_760234.1 (TP02_0760), XM_757627.1 (TP03_0905), XM_759970.1 (TP02_0497), XM_758208.1 (TP03_0283), XM_760090.1 (TP02_0617), and XM_758290.1 (TP03_0363)]. Genes TP03_0281 and TP03_0283 encode cysteine proteases containing a TMD. In contrast, genes TP01_0367, TP02_0327, TP02_0617, TP03_0008, TP03_0217, TP03_0363, TP03_0400, TP03_0520, and TP03_0905 all code for hypothetical proteins with a predicted SP, except for TP03_0905, which contains one TMD.
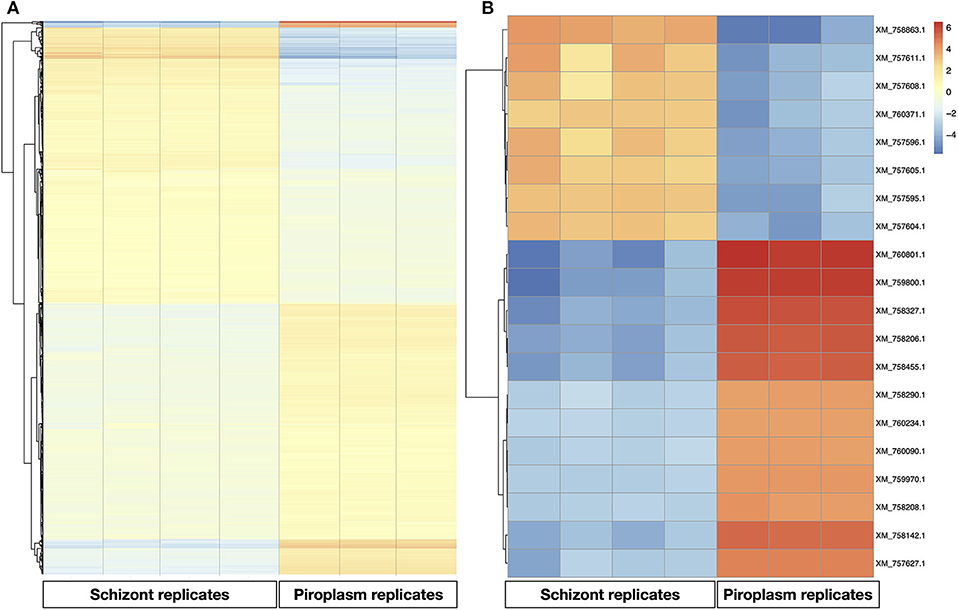
Figure 3. Gene expression profile in the schizont and piroplasm life cycle stages. (A) Heatmap of all the differentially expressed genes. (B) Heatmap of the top 20 most variable genes between schizont replicates and piroplasm replicates. The genes were clustered into two groups: from genes XM_760801.1 to XM_757627.1 where genes were upregulated in piroplasm and downregulated in schizont, and from XM_757604.1 to XM_758863.1 where genes where upregulated in schizont and downregulated in piroplasm. The genes were clustered by hierarchical clustering within each horizontal partition and replicates for the infection stages within each vertical partition by similarity. Color red denotes high expression, yellow denotes stable expression, and blue denotes low expression. The colors are scaled per row.
Stage-specific genes were also identified and are presented in Supplementary Data File 2. The top 20 most highly expressed stage-specific genes are presented in Table 2. These genes will be further investigated by qRT-PCR.
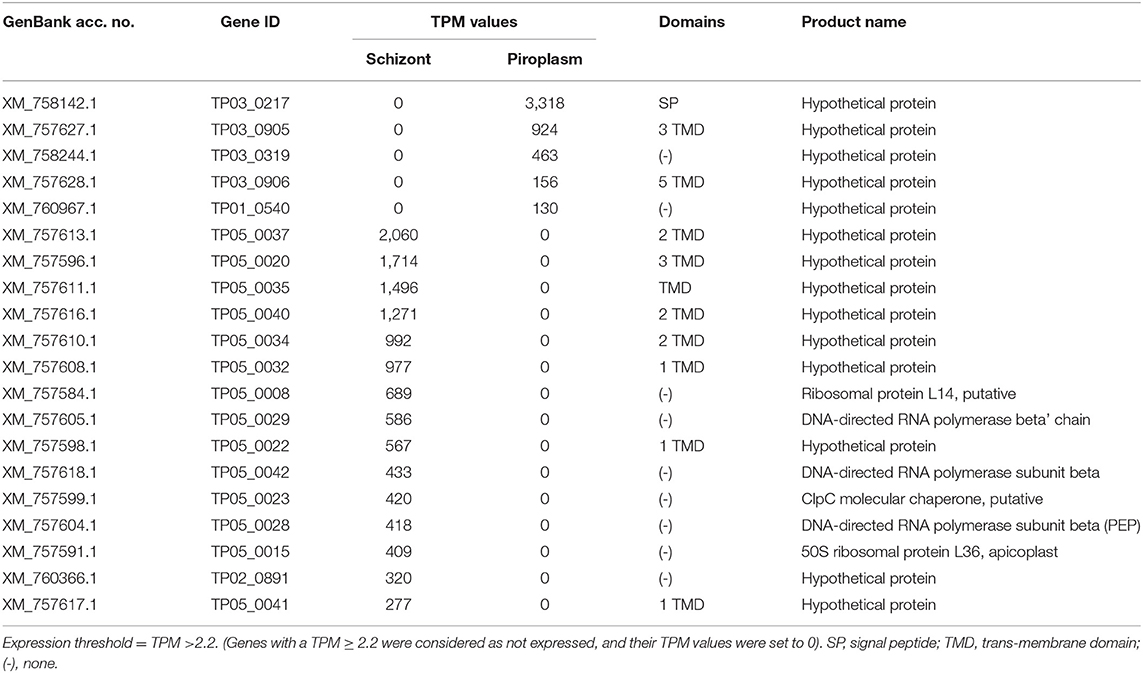
Table 2. Top 20 highest expressed stage-specific genes.
The Top 5 of the 20 Most Highly Expressed Genes Occurred in the Schizont Stage
The level of expression of the 20 most highly expressed genes identified in this study varied from 3,594 TPM for TP03_0050 (in the piroplasm) to 69,380 TPM for TP04_0321 (in the schizont) (Table 3). Only six of them encode for proteins with specific domains, including four (TP01_0367, TP02_0327, TP03_0400, and TP01_1056) containing an N-terminal SP. The five most highly expressed genes occurred in the schizont stage, namely TP04_0321, TP04_0322, TP04_0404, TP04_0675, and TP04_0677, all of which encode histone proteins. However, most of the 20 most highly expressed genes were preferentially expressed in the piroplasm stage rather than in the schizont. TP04_0675 and TP04_0677 had the same TPM counts (Table 3). A BLAST search revealed that the two genes code for the same protein, a 103-amino-acid-long putative histone H4.
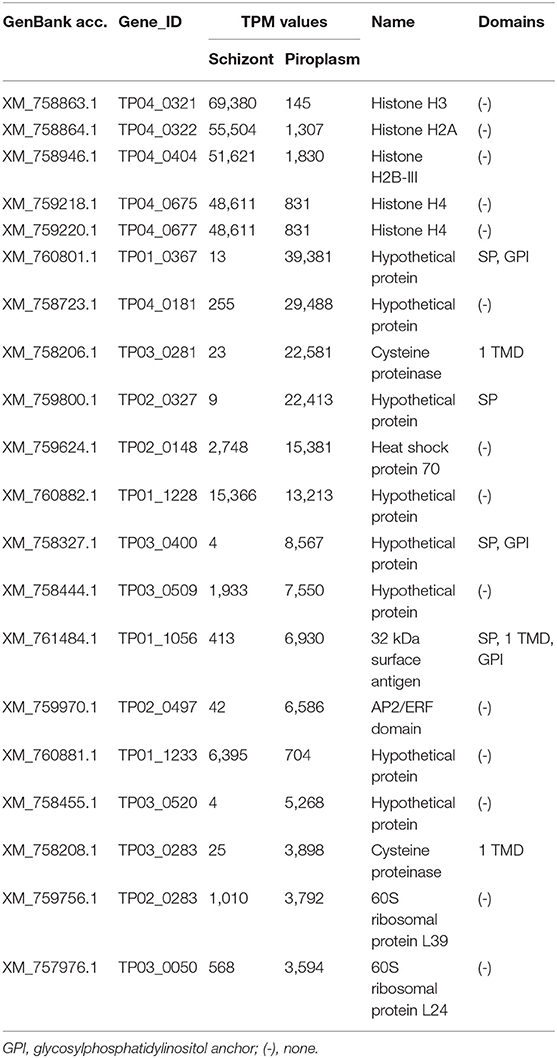
Table 3. Top 20 highest expressed genes.
Functional Annotation of the Upregulated Genes in the Piroplasm Stage
GO of differentially expressed genes for the two stages in the bovine white and red blood cells was classified according to three major categories on DAVID: molecular functions, biological processes, and cellular component. There were 2,116 functional categories assigned to over-expressed genes in the piroplasm relative to the schizont. The GO categories associated with upregulated genes in the piroplasm stage referred to 711 molecular functions, 1,194 biological processes, and 211 subcellular localizations (Figures 4A–C).
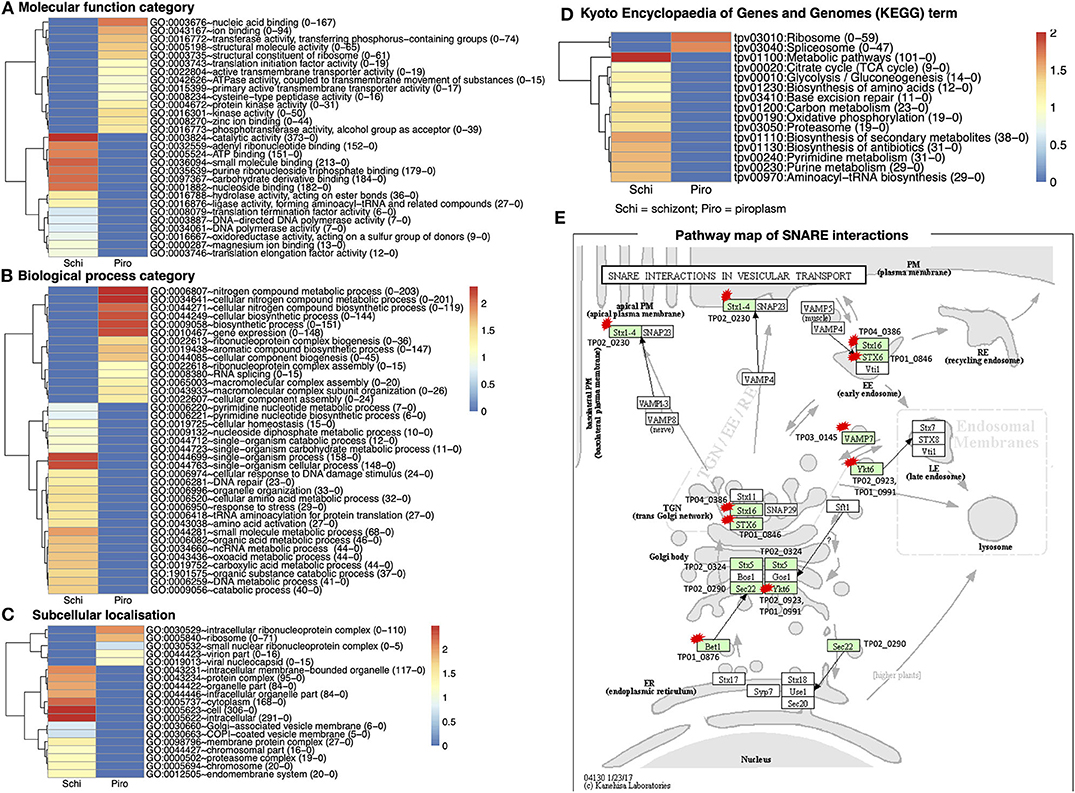
Figure 4. Gene Ontology (GO) functional classification for differentially expressed genes in the two developmental stages studied. (A) Molecular function category. (B) Biological process category. (C) Subcellular localization. (D) Kyoto Encyclopedia of Genes and Genomes (KEGG) database of the categorized genes downregulated in schizont and upregulated piroplasm. Genes without ontology information are not included. The proportion number of each GO and KEGG term of schizont and piroplasm is, respectively, presented in the parentheses in front of the GO and KEGG terms. Red color indicates most enriched (2), and blue, no enrichment (0). The expression level is color coded: red for over-expressed, white for unchanged. (E) Pathway map of SNARE interactions in vesicular transport. This pathway is annotated with most of the hypothetical proteins among all the referred pathways. The arrows in the pathway indicate the molecular interaction or reaction. The green boxes are hyperlinked to identified genes (encoded proteins) involved in the reaction, and the green box with a red star is hyperlinked to the hypothetical proteins involved in the pathway. Schi represents schizont stage, and Piro, piroplasm.
There were 711 molecular functional categories assigned to genes upregulated in the piroplasm relative to the schizont. The molecular function categories that were most broadly enriched included nucleic acid and ion binding, cysteine peptidase, protein kinase, and translation initiation factor activity (Figure 4A), which included ATP binding, catalytic activity, purine ribonucleoside triphosphate binding, and carbohydrate derivative binding.
Biological process categories assigned to genes upregulated in the piroplasm (1,194) included genes involved in the nitrogen metabolic process, cellular biosynthesis process, and gene expression. In contrast, the biological processes such as single organism process, response to stress, and amino acid activation were significantly enriched in the schizont (Figure 4B). Cellular component categories assigned to genes upregulated in the piroplasm (211) were most broadly enriched in the intracellular ribonucleoprotein complex and ribosome (Figure 4C).
To better understand the potential function of the differentially expressed genes, pathway analysis was performed. A difference was observed between up- and downregulated genes, in that 106 upregulated genes and over thrice as many (366) downregulated genes were associated to pathways in the KEGG database. The enriched pathways are shown in Figure 4D. The top signaling pathways annotated, to which genes upregulated in the piroplasm stage belong, included ribosome and spliceosome. To contribute to the knowledge of parasite genes potentially involved in vesicular transport signal pathways, we identified in the differentially expressed genes SNARE (soluble N-ethylmaleimide–sensitive factor attachment protein receptor) protein homologs using KEGG Mapper (Figure 4E); targets identified are primarily genes encoding hypothetical proteins and mostly downregulated in the schizont. The list of genes associated to each GO term and KEGG term is presented in Supplementary Data File 3.
Genes With Functional Domains and Expression Patterns Similar to Known T. parva Antigen Genes
To identify genes that have a similar expression pattern to known vaccine antigen-coding genes, gene expression profiles and functional domains and motifs of these known antigens were first generated (Table 4). The analysis was expanded to include data previously reported for two tick vector stages (sporoblast and sporozoite) as well as the schizont (16). These known antigens are differentially expressed across the infection stages. However, except for the p67, which was not expressed in the piroplasm stage (0 TPM), all the other known antigens were differentially expressed across all the stages studied.
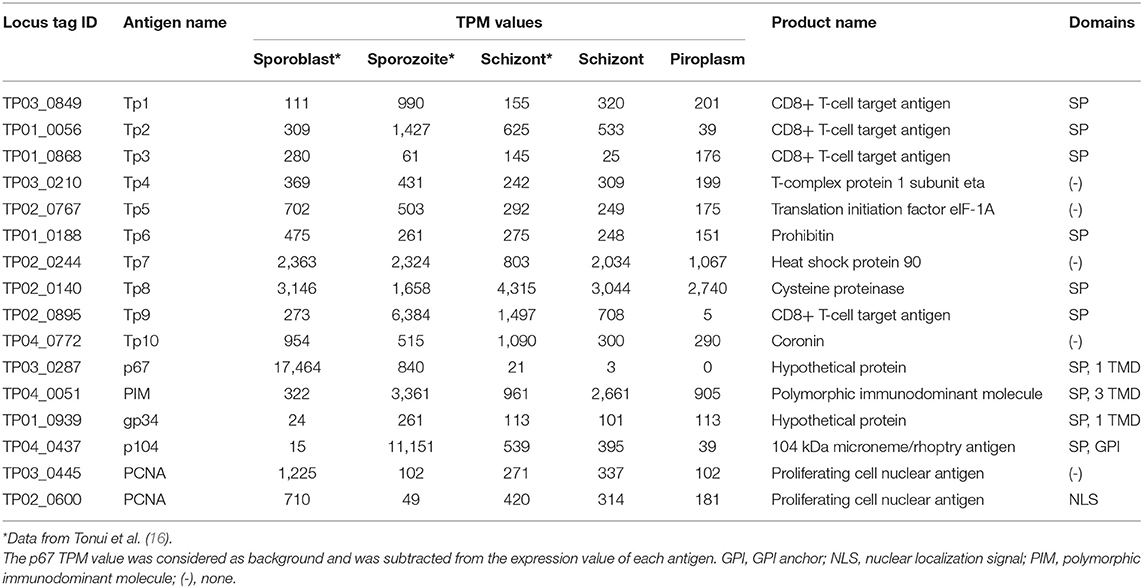
Table 4. Expression profile of known T. parva antigens.
Unsupervised clustering using the PAM clustering algorithm in R was performed to identify genes that cluster with, and thus have a similar expression pattern to, known antigens (Figure 5; Supplementary Data File 4 Sheet 1). Several genes had a similar expression pattern to known antigens, including 10 or more that were similar to Tp1, Tp2 and Tp3, Tp4, Tp5, Tp6, Tp10, gp34, and PCNA 1 (TP02_0600); 6 that were similar to Tp9; 5 similar to both PCNA 2 (TP03_0445) and Tp7; 3 similar to p104; and 1 gene similar to PIM. However, we did not find any gene with similar expression patterns to Tp8 and p67. Those with an SP, TMD, and/or GPI anchor are shown in Supplementary Data File 4 Sheet 2.
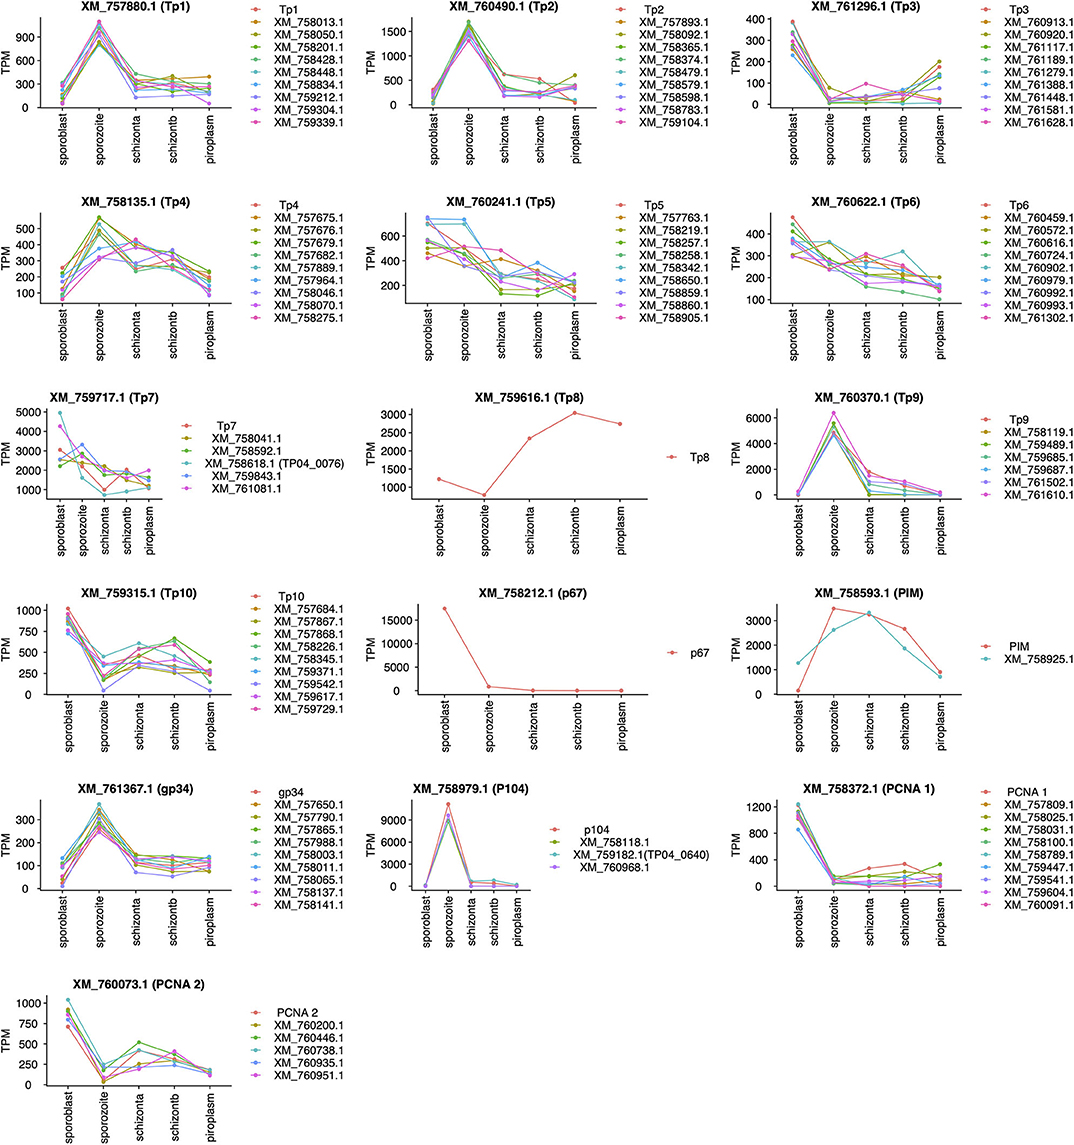
Figure 5. Genes with expression profiles similar to known Theileria parva antigens' genes. Sporoblast, sporozoite, and schizont_a are transcriptome data collected from our previous work (16), whereas schizont_b and piroplasm are transcriptome data generated from this study. Each line in a unique color represents a specific gene with its GenBank accession number. Each plot represents the profiling of genes (GenBank accession number listed) having a similar expression profile to the known antigen (top of the plot).
Vaccination against ECF using the major T. parva sporozoite surface protein p67 can induce antibody-based immune protection in up to 50% of vaccinated animals (3, 45). To support the identification of additional candidate vaccine antigens able to induce protective antibodies like p67, T. parva genes encoding proteins containing TMDs or GPI anchors were analyzed in silico using the epitope prediction algorithm BepiPred Linear Epitope Prediction 2.0 for the presence of epitopes that are targets of antibodies (Supplementary Data File 5). Using p67 antigen as the benchmark, the top 20 proteins among the candidate vaccine proteins predicted to be localized in the parasite plasma membrane (Supplementary Data File 5) were ranked for their antigenic propensity and/or probability to contain antibody epitopes based on the score of the predicted peptide epitopes, which varied between 0.749 (XP_763541.1) and 0.566 (XP_764275.1), compared to the p67 antigen score of 0.658 (Table 5) or PIM antigen of 0.650.
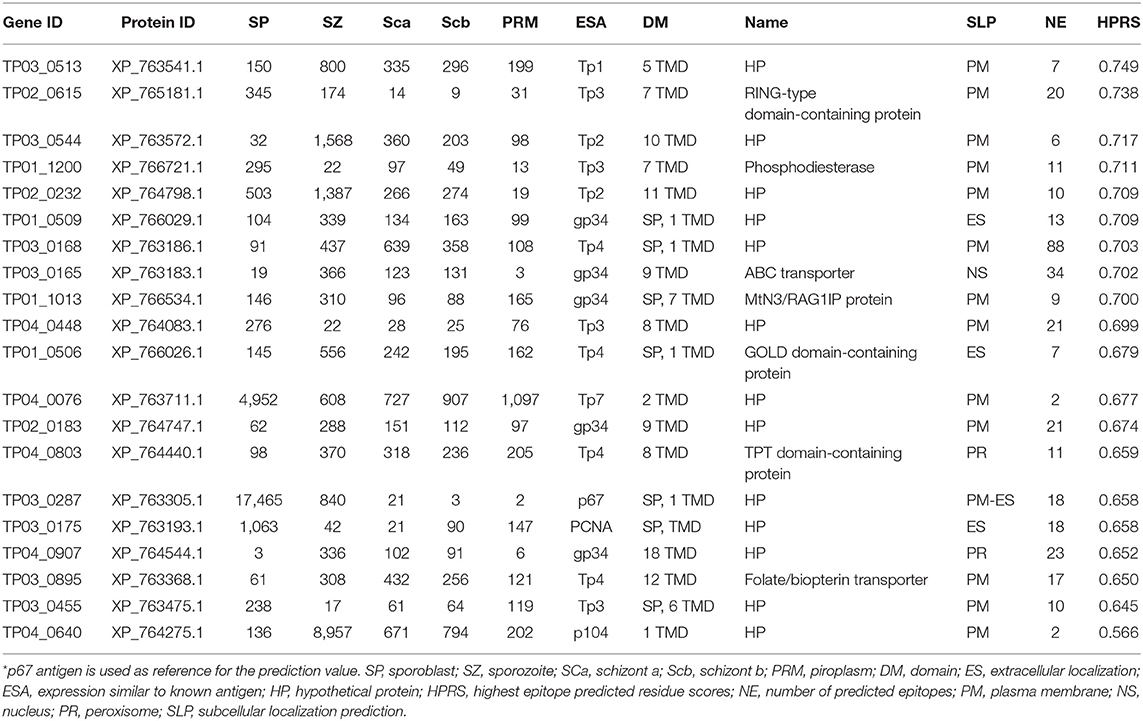
Table 5. Top 20 T. parva surface proteins with high antibody epitope prediction values and with expression similar to known antigen.
Unmapped Reads Mainly Originate From the Bovine Genome
De novo assembly of unmapped reads from schizont samples, i.e., 40% of total trimmed reads (Table 1), using Trinity, generated 10,823 contigs. BLAST searches for sequence similarity were performed using the new contigs. Most of the hits mapped to mammalian genomes in the family Bovidae, including Bos mutus, Bos taurus, Bos indicus, and Bison bison (Figure 6A). By assuming that all these genes are more likely orthologs to the bovine host genes, then in total, 71% of the schizont stage unmapped reads hit the bovine genome. The second large hit was the T. parva genome to which 23% of the total blast hits mapped. Other blast hits included bacteria (E. coli) and synthetic constructs, which may be plasmids from the E. coli above. Trinity de novo assembly of piroplasm unmapped reads produced 2,064 contigs, of which 90% mapped to bovine and about 5% to Theileria genomes. The contigs mapped to the T. parva genome identified 32 genes (Figure 6B). It is likely that the structure of those genes was not correctly identified in the original annotation and thus was incomplete or had gaps in the reference transcriptome used for the mapping, as we demonstrated previously (16). These have now been re-annotated accordingly (44). Most of the 32 genes identified by both schizont and piroplasm contigs of unmapped reads were hypothetical proteins. Known genes coded for ABC transporters, ribosomal proteins, heat shock proteins (including heat shock protein 90, known as Tp7 or TP02_0244), or 23 kDa piroplasm surface protein TP02_0551, among others (Figure 6B).
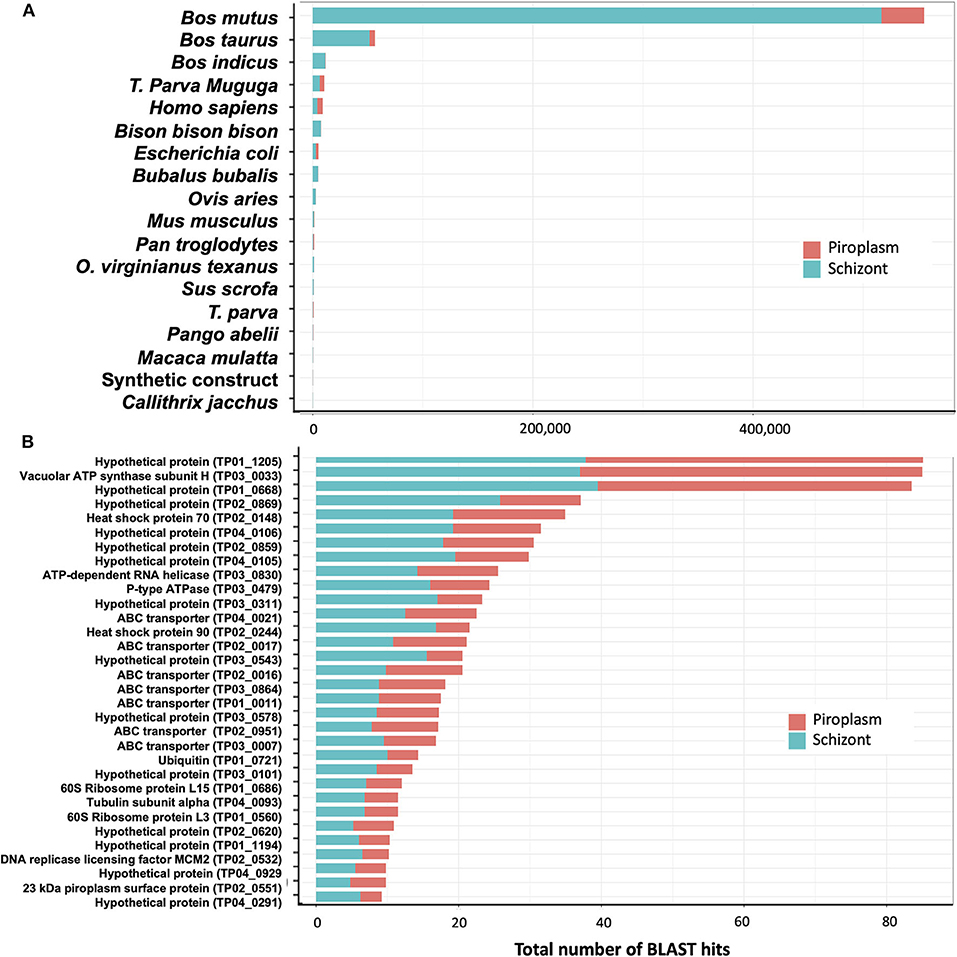
Figure 6. Analysis of unmapped reads. (A) Count of BLAST hits to unmapped reads. (B) Counts of BLAST hits of unmapped reads to T. parva genome.
ELISA Validation of Potential Vaccine Antigens
We chose two candidate vaccine antigens among the predicted parasite plasma membrane proteins (Table 5) to evaluate their immunogenicity potential. TP04_0076 and TP04_0640 genes were selected because they may encode plasma membrane proteins, have strong predicted antibody epitope residue scores [0.677 and 0.566, respectively (Table 5)], and encode very small proteins (only 96 and 114 amino acids, respectively) that may therefore be easy to express in E. coli and purify. Furthermore, TP04_0076 (XM_758618.1) has an expression profile similar to Tp7, and that of TP04_0640 (XM_759182.1) is similar to the p104 antigen gene (Figure 5). TP04_0640 was proposed as a potential target for the development of anti-Theileria drugs (16). Recombinant protein was generated only for TP04_0076. The TP04_0076 ORF was cloned into pET-32a+, over-expressed as a recombinant fusion protein in the E. coli system, and affinity-purified. The fusion protein was termed TP04_0076F (Figure 7). We procured synthetic peptides corresponding to the following predicted antibody-targeted epitopes: TP04_0076ep1 (19-mer: MADLTKRKPHSTSFVDLTR) in TP04_0076, and TP04_0640ep1 (19-mer: PDRFFNKIGIIYYPSKHWS) and TP04_0640ep2 (30-mer: ERTKHPRLDSFDSMIDEYSTVENDGGIMYF), both in TP04_0640. As previously described (16), TpMuguga_04g00640 encodes a protein that is 50 amino acids longer than that of TP04_0640, the corresponding locus predicted in the original 2005 genome annotation, as it now encodes a protein of 114 amino acid residues.
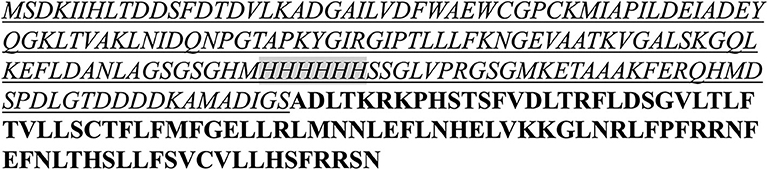
Figure 7. Amino acid sequences of the recombinant fusion protein TP04_0076F. The fusion protein contains 260 aa (single letter peptide) with the vector portion underlined and the 6x His tag used for affinity purification shadowed. The TP04_0076 portion is bolded, and the methionine (M) start codon was not included in the fusion protein.
The antigenicity of both the purified recombinant fusion protein and synthetic peptides was tested using cattle sera that exhibited a strong positive response in a PIM-based ELISA. In total, and since we lacked sufficient volume to test all 34 strong positive sera against all epitopes, TP04_0076F was tested with 34 sera, and TP04_0076ep2, TP04_0640ep1, and TP04_0640ep2, with 20 sera (Figure 8). Three negative control sera were included (Supplementary Data File 6).
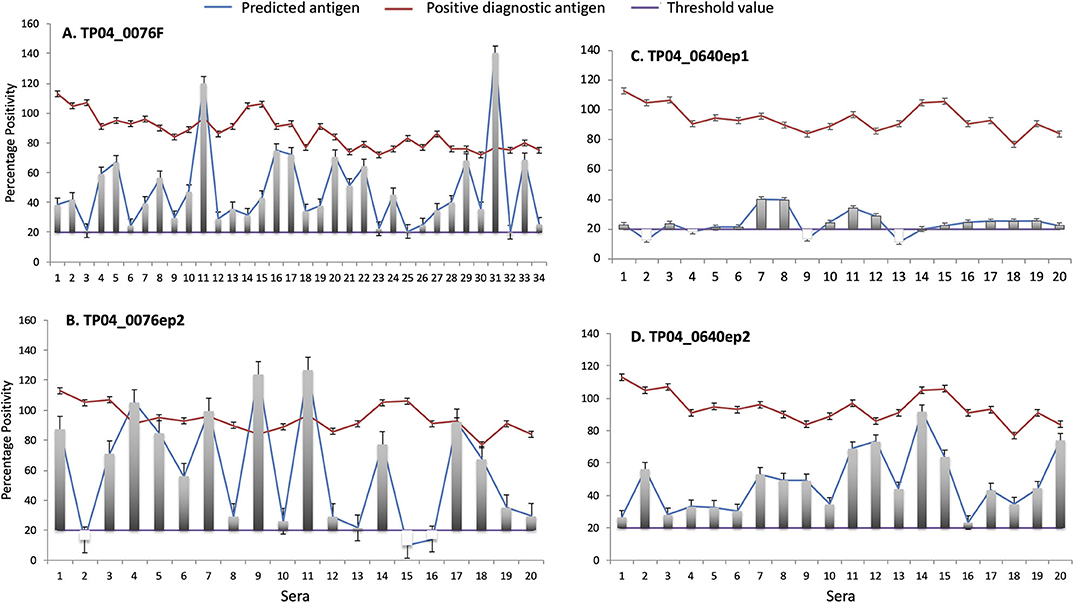
Figure 8. Enzyme-linked immunosorbent assay (ELISA) evaluation of the antigenicity of (A) TP04_0076 gene product (recombinant protein TP04_0076F) and predicted antibody target epitopes of TP04_0640 and TP04_0076 gene products (synthetic peptides (B) TP04_0076ep2, (C) TP04_0640ep1, and (D) TP04_0640ep2). A panel of 34 predetermined bovine positive controls with strong percent positivity (PP ≥ 80) to PIM antigen (red line) were included in the analysis. The PP results of each of the four recombinant proteins and synthetic peptides tested (blue line) are shown in separated panels. The green line represents the cutoff, and an assay with a PP ≥ 20 (PP ≥ 20) is considered positive.
All the 34 infection sera analyzed were positive with the recombinant fusion protein TP04_0076F, with PP ranging from 20 to 140 PP (cutoff value: PP ≥ 20). Equally, all the sera tested with the synthetic peptide epitope TP04_0640ep2 produced a positive antibody reaction. Six sera showed higher levels of antibody reaction to the recombinant protein TP04_0076F and derived epitope TP04_0076ep1 than the positive control PIM which is being used as a diagnostic antigen (Figures 8A,B). In contrast, all the sera tested with the TP04_0640ep2 epitope gave positive antibody reactions but at lower levels than PIM (Figure 8D). Out of 20 sera tested with TP04_0640ep1, 16 (80%) were positive (Figure 8C). The OD reading of each antigen and the positive and negative control sera and antigen are presented in Supplementary Data File 6. All the antigens tested produced a very weak or no reaction to the negative control sera. The presence of antibodies in the sera was a preliminary indication of the antigenicity of these potential antigens.
Discussion
This research was undertaken in order to enhance our knowledge and understanding of gene expression across T. parva life cycle stages, specifically from schizont to piroplasm forms, and in this way improve predictive analysis of their structure, location, role, and function that may lead to the identification of novel therapeutic targets.
A comparison of the transcriptome data from next-generation sequencing of the two stages pointed to 3,279 differentially expressed genes between the schizont and the piroplasm stage, out of 4,061 protein coding genes with our expression data, with roughly half of them being significantly upregulated in each of these two stages that take place, respectively, in the host white blood cells and red blood cells. To capture the whole expression profile of the parasite, we summarize in Table 6 the transcriptome data sets of the different life cycle stages, by combining our current data with a similar study previously conducted on the sporoblast, sporozoite, and schizont stages (16). Shaw et al. (42) have proposed that T. parva uses repeatedly a single set of genes (termed “cassettes”) throughout its life cycle with the replacement of only a few each time to allow for small differences in reproduction (46). These genes are regulated by a limited number of promoter motifs (47). Consistent with this scenario, the results presented here and in our previous work show that almost all genes are expressed in most stages, albeit across a wide range of expression levels, with only about 200 being stage-specific. It worth noting that, as the parasite developed from sporoblast to sporozoite and then schizont stages, the number of differentially expressed genes increased (16) and then slightly decreased from the schizont to the piroplasm stages (this study).
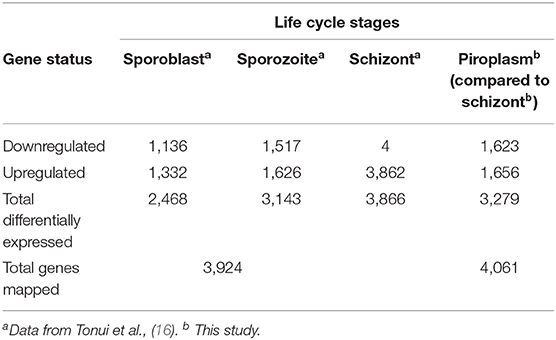
Table 6. Number of T. parva genes differentially expressed in the tick vector and bovine host.
The top five most highly expressed genes are over-expressed in the schizont stage and encode histone protein family members (Table 3). However, Tonui et al. (16) observed that the level of expression of these histone genes was even much higher in stages in the arthropod vector (sporoblast and sporozoite) than in the schizont stage. Our results are also consistent with those obtained in a T. parva proteome characterization study, where histone protein family members were highly expressed (48). It was reported that histone modification operates in synteny with transcription factors and is mostly activated during the replicative schizont stage (49, 50). Experiments using apicidin, a histone deacetylase inhibitor, were shown to alter parasite differentiation status, leading to the conclusion that epigenetic control plays a key role in apicomplexan differentiation steps (51). This observation is consistent with our results, which show histone-encoding genes to be among the most highly differentially expressed genes across the parasite life cycle studied. Genes encoding known proteins such as cysteine proteinase (TP03_0281) and heat shock protein 70 (TP02_0148) were also found very highly expressed in the piroplasm, with, respectively, 22,581 and 15,381 TPM. TP03_0281 protein contains a TMD and secretion activity. This is not unexpected, as these genes encode enzymes that degrade protein and could be required for morphological events or degradation of host cell proteins (52).
All known antigens (45, 53, 54) were expressed at each developmental stage (Table 4), except for p67; this protein is known to be a sporozoite surface protein and only present in the sporozoite infection stage, although the gene was shown recently to be highly expressed by the sporoblast stage (16). We also observed that the expression of known antigens is not conserved across the stages (Figure 5). We included in our analysis the two mammalian stages (schizont and piroplasm) of the parasite and the two vector stages (sporoblast and sporozoite) from our previous work (16), to identify potential new vaccine antigens as well as novel therapeutic targets among those with a similar expression pattern to T. parva known antigens. Unsupervised clustering was used to cluster the expressed genes in the parasite life stages. This method has been used in related studies on gene expression data to identify markers associated with virulence, disease pathology that could be used for reverse vaccinology and therapeutic target identification (14, 15, 55). Many co-expressed genes are often co-regulated and have similar expression profiles. Thus, genes with similar expression to the known antigen genes could aid in identifying novel protein targets to improve control strategies against ECF. Since T. parva is an intracellular parasite, we prioritized identification genes coding for proteins that are secreted by the parasite (containing an SP) or that are located on the surface of the parasite, i.e., containing TMDs or a predicted GPI anchor, and those that contain predicted antibody target epitopes (Table 5) (15, 56). Combining these characteristics and using the p67 and the diagnostic antigen PIM as benchmarks, we identified a number of potential candidate vaccine antigens [some of which were also identified in a previous study (16)] that are likely to be target of protective immune responses during ECF. In that regard, the ELISA results for TP04_0076 and TP04_0640 showed that these proteins induced antibody reactions in naturally T. parva-infected cattle. Particularly, TP04_0076 antigen could induce antibody reactions in some infected cattle at greater levels than the benchmark diagnostic antigen PIM. This is consistent with a previous report that ITM-immunized animals recognized recombinant TP04_0076 (57). A BLASTN revealed a homology to the conserved Theileria annulata gene XM_947675.1 (86.12% sequence identity, E-value of 8e−55), to the immunodominant Plasmodium falciparum UB05 gene (KF875450.1; 100% sequence identity, E-value of 9e−149), and to the conserved Theileria orientalis strain Shintoku gene XM_009694457.1 (80% sequence identity, E-value of 4e−04). It is reported that the TP04_0076 antigen was better at detecting antigen-specific antibodies in the plasma of human subjects with malaria compared to Plasmodium homolog UB05 when tested by ELISA (57). TP04_0640 was also found similar to the meiotic upregulated gene MUG84 of yeast endoplasmic reticulum membrane encoding for phosphatidylinositol N-acetylglucosaminyltransferase subunit P (PIG-P) (16). This protein is an enzyme involved in GPI anchor biosynthesis. However, further investigation is necessary to determine if these antigens can be protective against ECF and to evaluate if they can prevent sporozoite infection of cattle or block piroplasm transmission to ticks.
This study expanded our knowledge of T. parva genes involved in biological pathways, as this information is limited compared to other apicomplexan parasites (58, 59). We identified transcription factors that were upregulated in the piroplasm including genes involved in nucleic acid and ion binding. A number of hypothetical proteins were also identified as potential SNAREs involved in intracellular vesicular transport. Several of these potential SNARE proteins identified have a TMD and at least a 60-amino-acid-long coiled-coil region as described previously (60). The SNARE interactions shown in Figure 4E involved the plasma membrane, the Golgi body, and the endoplasmic reticulum–related transport pathways. These genes could be investigated for their specific interaction and roles in the development of T. parva.
This study shed more light upon gene expression variation as the apicomplexan protozoa T. parva develops through its life cycle stages in the tick vector and bovine host, resulting in the establishment of ECF. In addition, bioinformatic analysis of transcriptomics data identified potential candidate vaccine antigens yet to be evaluated for their immunogenicity and potential to induce either humoral or cellular immunity.
Data Availability Statement
The nucleotide sequence data sets generated in this study can be found in the NCBI database under the accession number: PRJNA604662; https://www.ncbi.nlm.nih.gov/sra/PRJNA604662.
Ethics Statement
The animal study was reviewed and approved by the ILRI's Institutional Animal Care and Use Committee (IACUC). The study reported here was carried out in strict accordance with the recommendations in the standard operating procedures of the ILRI IACUC and adequate consideration of the 3R's (Replacement of animal with non-animal techniques, Reduction in the number of animals used, and Refinement of techniques and procedures that reduce pain and distress). The ILRI's Experimental Animal Request Form and Protocol for blood collection was approved by the ILRI IACUC (IACUC ref no. 2006.9, IACUC ref 2006.10, IACUC ref 2007.10 and IACUC-RC2015-23).
Author Contributions
Sample collection and RNA extraction by RP, KA, and EM. ELISA by KA, EM, and RP. Data analysis by KA, JJ, and RP. Initial draft written by KA. Methods validation by RP, JS, and KA. Supervision by RP and JO. Final manuscript revision by KA, CT, JO, AD, JS, and RP. All authors contributed to the writing and manuscript editing.
Funding
This work, performed at BecA-ILRI Hub, is part of KA Master thesis. This research was supported by the Pan African University Institute of Basic Science, Technology and Innovation of the African Union Commission. Partial funding was also received from the BecA-ILRI Hub program and ILRI through the Africa Biosciences Challenge Fund (ABCF) program. The ABCF program is funded by the Australian Department for Foreign Affairs and Trade (DFAT) through the BecA-CSIRO partnership; the Syngenta Foundation for Sustainable Agriculture (SFSA); the Bill & Melinda Gates Foundation (BMGF); the UK Department for International Development (DFID); and the Swedish International Development Cooperation Agency (Sida). The authors wish to thank Dr Lionel Nyabongo, ISABU-Burundi, for the kind assistance with the bovine sera.
Conflict of Interest
The authors declare that the research was conducted in the absence of any commercial or financial relationships that could be construed as a potential conflict of interest.
The reviewer LMF declared a past co-authorship with one of the authors JS to the handling editor.
Acknowledgments
We are grateful to the African Union (AU) through Pan African University (PAU) for the MSc. scholarship. We also acknowledge the technical assistance provided by the BecA-ILRI staff.
Supplementary Material
The Supplementary Material for this article can be found online at: https://www.frontiersin.org/articles/10.3389/fvets.2020.00287/full#supplementary-material
Supplementary Data File 1. Transcript abundance of each sample replicate.
Supplementary Data File 2. List of the stage-specific genes.
Supplementary Data File 3. List of genes associated to the GO term and KEGG term.
Supplementary Data File 4. Genes with similar expression pattern to the known antigens.
Supplementary Data File 5. Candidate vaccine proteins predicted to be localized in the parasite plasma membrane.
Supplementary Data File 6. ELISA OD reading of each epitope sera and the positive and negative control sera.
References
1. Godfray HCJ, Beddington JR, Crute IR, Haddad L, Lawrence D, Muir JF, et al. Food security: the challenge of feeding 9 billion people. Science. (2010) 327:812–8. doi: 10.1126/science.1185383
2. Reynolds LP, Wulster-Radcliffe MC, Aaron DK, Davis TA. Importance of animals in agricultural sustainability and food security. J Nutr. (2015) 145:1377–9. doi: 10.3945/jn.115.212217
3. Nene V, Kiara H, Lacasta A, Pelle R, Svitek N, Steinaa L. The biology of Theileria parva and control of east coast fever–current status and future trends. Ticks Tick-Borne Dis. (2016) 7:549–64. doi: 10.1016/j.ttbdis.2016.02.001
4. Norval RAI, Perry BD, Young AS. The Epidemiology of Theileriosis in Africa. London: Academic Press (1992) xiii:481.
5. De Deken R, Martin V, Saido A, Madder M, Brandt J, Geysen D. An outbreak of east coast fever on the comoros: a consequence of the import of immunised cattle from Tanzania? Vet Parasitol. (2007) 143:245–53. doi: 10.1016/j.vetpar.2006.08.018
6. Hemmink JD, Weir W, MacHugh ND, Graham SP, Patel E, Paxton E, et al. Limited genetic and antigenic diversity within parasite isolates used in a live vaccine against Theileria parva. Int J Parasitol. (2016) 46:495–506. doi: 10.1016/j.ijpara.2016.02.007
7. Dobbelaere D, Heussler V. Transformation of leukocytes by Theileria parva and T. annulata. Annu Rev Microbiol. (1999) 53:1–42. doi: 10.1146/annurev.micro.53.1.1
8. Tretina K, Gotia HT, Mann DJ, Silva JC. Theileria-transformed bovine leukocytes have cancer hallmarks. Trends Parasitol. (2015) 31:306–14. doi: 10.1016/j.pt.2015.04.001
9. Dolan TT. Theileriosis. A Comprehensive Review. (1989) Available online at: https://cgspace.cgiar.org/handle/10568/33155 (accessed February 24, 2020).
10. Radley DE, Brown CGD, Cunningham MP, Kimber CD, Musisi FL, Payne RC, et al. East coast fever: 3. Chemoprophylactic immunization of cattle using oxytetracycline and a combination of theilerial strains. Vet Parasitol. (1975) 1:51–60. doi: 10.1016/0304-4017(75)90007-2
11. Gardner MJ, Bishop R, Shah T, De Villiers EP, Carlton JM, Hall N, et al. Genome sequence of Theileria parva, a bovine pathogen that transforms lymphocytes. Science. (2005) 309:134–7. doi: 10.1126/science.1110439
12. Henson S, Bishop RP, Morzaria S, Spooner PR, Pelle R, Poveda L, et al. High-resolution genotyping and mapping of recombination and gene conversion in the protozoan Theileria parva using whole genome sequencing. BMC Genomics. (2012) 13:503. doi: 10.1186/1471-2164-13-503
13. Norling M, Bishop RP, Pelle R, Qi W, Henson S, Drábek EF, et al. The genomes of three stocks comprising the most widely utilized live sporozoite Theileria parva vaccine exhibit very different degrees and patterns of sequence divergence. BMC Genomics. (2015) 16:729. doi: 10.1186/s12864-015-1910-9
14. Sundaresh S, Randall A, Unal B, Petersen JM, Belisle JT, Gill Hartley M, et al. From protein microarrays to diagnostic antigen discovery: a study of the pathogen Francisella tularensis. Bioinformatics. (2007) 23:i508–18. doi: 10.1093/bioinformatics/btm207
15. He Y, Rappuoli R, De Groot AS, Chen RT. Emerging vaccine informatics. J Biomed Biotechnol. (2010) 2010:218590. doi: 10.1155/2010/218590
16. Tonui T, Corredor-Moreno P, Kanduma E, Njuguna J, Njahira MN, Nyanjom SG, et al. Transcriptomics reveal potential vaccine antigens and a drastic increase of upregulated genes during Theileria parva development from arthropod to bovine infective stages. PLoS ONE. (2018) 13:e0204047. doi: 10.1371/journal.pone.0204047
17. Sugimoto C, Conrad PA, Ito S, Brown WC, Grab DJ. Isolation of Theileria parva schizonts from infected lymphoblastoid cells. Acta Trop. (1988) 45:203–16.
18. Conrad PA, Iams K, Brown WC, Sohanpal B, ole-MoiYoi OK. DNA probes detect genomic diversity in Theileria parva stocks. Mol Biochem Parasitol. (1987) 25:213–26. doi: 10.1016/0166-6851(87)90085-5
19. Ebel T, Pellé R, Janoo R, Lipp J, Bishop R. A membrane-anchored Theileria parva cyclophilin with a non-cleaved amino-terminal signal peptide for entry into the endoplasmic reticulum. Vet Parasitol. (2004) 121:65–77. doi: 10.1016/j.vetpar.2004.02.007
20. Pelle R, Murphy NB. Northern hybridization: rapid and simple electrophoretic conditions. Nucleic Acids Res. (1993) 21:2783–4. doi: 10.1093/nar/21.11.2783
21. Andrews S. Babraham Bioinformatics-FastQC a Quality Control Tool for High Throughput Sequence Data. (2010). Available online at: https://www.bioinformatics.babraham.ac.uk/projects/fastqc/ (accessed June 12, 2018).
22. Martin M. Cutadapt removes adapter sequences from high-throughput sequencing reads. EMBnet J. (2011) 17:10–12. doi: 10.14806/ej.17.1.200
23. Bolger AM, Lohse M, Usadel B. Trimmomatic: a flexible trimmer for illumina sequence data. Bioinformatics. (2014) 30:2114–20. doi: 10.1093/bioinformatics/btu170
24. Bray NL, Pimentel H, Melsted P, Pachter L. Near-optimal probabilistic RNA-seq quantification. Nat Biotechnol. (2016) 34:525. doi: 10.1038/nbt.3519
25. Love MI, Huber W, Anders S. Moderated estimation of fold change and dispersion for RNA-seq data with DESeq2. Genome Biol. (2014) 15:550. doi: 10.1186/s13059-014-0550-8
26. Blighe K. EnhancedVolcano: Publication-ready Volcano Plots with Enhanced Colouring and Labeling. R Package Version 1.2. 0. (2019). doi: 10.18129/B9.bioc.EnhancedVolcano
27. Grabherr MG, Haas BJ, Yassour M, Levin JZ, Thompson DA, Amit I, et al. Trinity: reconstructing a full-length transcriptome without a genome from RNA-Seq data. Nat Biotechnol. (2011) 29:644. doi: 10.1038/nbt.1883
28. Petersen TN, Brunak S, Von Heijne G, Nielsen H. SignalP 4.0: discriminating signal peptides from transmembrane regions. Nat Methods. (2011) 8:785–6. doi: 10.1038/nmeth.1701
29. Omasits U, Ahrens CH, Müller S, Wollscheid B. Protter: interactive protein feature visualization and integration with experimental proteomic data. Bioinformatics. (2013) 30:884–6. doi: 10.1093/bioinformatics/btt607
30. Yachdav G, Kloppmann E, Kajan L, Hecht M, Goldberg T, Hamp T, et al. PredictProtein—an open resource for online prediction of protein structural and functional features. Nucleic Acids Res. (2014) 42:W337–43. doi: 10.1093/nar/gku366
31. Pierleoni A, Martelli PL, Casadio R. PredGPI: a GPI-anchor predictor. BMC Bioinformatics. (2008) 9:392. doi: 10.1186/1471-2105-9-392
32. Bendtsen JD, Jensen LJ, Blom N, Von Heijne G, Brunak S. Feature-based prediction of non-classical and leaderless protein secretion. Protein Eng Des Sel. (2004) 17:349–56. doi: 10.1093/protein/gzh037
33. Lempereur L, Larcombe SD, Durrani Z, Karagenc T, Bilgic HB, Bakirci S, et al. Identification of candidate transmission-blocking antigen genes in Theileria annulata and related vector-borne apicomplexan parasites. BMC Genomics. (2017) 18:438. doi: 10.1186/s12864-017-3788-1
34. Oyelade J, Isewon I, Oladipupo F, Aromolaran O, Uwoghiren E, Ameh F, et al. Clustering algorithms: their application to gene expression data. Bioinforma Biol Insights. (2016) 10:237–53. doi: 10.4137/BBI.S38316
35. Acharya S, Saha S, Nikhil N. Unsupervised gene selection using biological knowledge : application in sample clustering. BMC Bioinformatics. (2017) 18:513. doi: 10.1186/s12859-017-1933-0
36. Kanehisa M, Sato Y, Kawashima M, Furumichi M, Tanabe M. KEGG as a reference resource for gene and protein annotation. Nucleic Acids Res. (2016) 44:D457–62. doi: 10.1093/nar/gkv1070
37. Simha R, Briesemeister S, Kohlbacher O, Shatkay H. Protein (multi-)location prediction: utilizing interdependencies via a generative model. Bioinformatics. (2015) 31:i365–74. doi: 10.1093/bioinformatics/btv264
38. Briesemeister S, Rahnenführer J, Kohlbacher O. YLoc—an interpretable web server for predicting subcellular localization. Nucleic Acids Res. (2010) 38:W497–502. doi: 10.1093/nar/gkq477
39. Horton P, Park K-J, Obayashi T, Fujita N, Harada H, Adams-Collier CJ, et al. WoLF PSORT: protein localization predictor. Nucleic Acids Res. (2007) 35:W585–7. doi: 10.1093/nar/gkm259
40. Wright PF, Nilsson E, Van Rooij EM, Lelenta M, Jeggo MH. Standardisation and validation of enzyme-linked immunosorbent assay techniques for the detection of antibody in infectious disease diagnosis. Rev Sci Tech Int. (1993) 12:435–50. doi: 10.20506/rst.12.2.691
41. Katende J, Morzaria S, Toye P, Skilton R, Nene V, Nkonge C, et al. An enzyme-linked immunosorbent assay for detection of Theileria parva antibodies in cattle using a recombinant polymorphic immunodominant molecule. Parasitol Res. (1998) 84:408–16. doi: 10.1007/s004360050419
42. Nyagwange J, Nene V, Mwalimu S, Henson S, Steinaa L, Nzau B, et al. Antibodies to in silico selected GPI-anchored Theileria parva proteins neutralize sporozoite infection in vitro. Vet Immunol Immunopathol. (2018) 199:8–14. doi: 10.1016/j.vetimm.2018.03.004
43. Kazungu Y, Mwega E, Kimera S, Gwakisa P. Seroprevalence and carrier state of Theileria parva in cattle under two tick control regimes in small-holder farming systems of Tanzania. Livest Res Rural Dev. (2015) 27. Available online at: http://www.lrrd.org/lrrd27/6/kazu27111.html (accessed May 29, 2020).
44. Tretina K, Pelle R, Orvis J, Gotia HT, Ifeonu OO, Kumari P, et al. Re-annotation of the Theileria parva genome refines 53% of the proteome and uncovers essential components of N-glycosylation, a conserved pathway in many organisms. BMC Genomic. (2019) 21:279. doi: 10.1101/749366
45. Nene V, Musoke A, Gobright E, Morzaria S. Conservation of the sporozoite p67 vaccine antigen in cattle-derived Theileria parva stocks with different cross-immunity profiles. Infect Immun. (1996) 64:2056–61. doi: 10.1128/IAI.64.6.2056-2061.1996
46. Shaw MK, Tilney LG. How individual cells develop from a syncytium: merogony in Theileria parva (apicomplexa). J Cell Sci. (1992) 101:109–23.
47. Tretina K, Pelle R, Silva JC. Cis regulatory motifs and antisense transcriptional control in the apicomplexan Theileria parva. BMC Genomics. (2016) 17:128. doi: 10.1186/s12864-016-2444-5
48. Nyagwange J, Tijhaar E, Ternette N, Mobegi F, Tretina K, Silva JC, et al. Characterization of the Theileria parva sporozoite proteome. Int J Parasitol. (2018) 48:265–73. doi: 10.1016/j.ijpara.2017.09.007
49. Chaal BK, Gupta AP, Wastuwidyaningtyas BD, Luah Y-H, Bozdech Z. Histone deacetylases play a major role in the transcriptional regulation of the Plasmodium falciparum life cycle. PLoS Pathog. (2010) 6:e1000737. doi: 10.1371/journal.ppat.1000737
50. Pieszko M. Molecular Regulation of the Macroschizont to Merozoite Differentiation in Theileria Annulata. (2015). Available online at: https://eleanor.lib.gla.ac.uk/record=b3096526 (accessed February 26, 2020).
51. Darkin-Rattray SJ, Gurnett AM, Myers RW, Dulski PM, Crumley TM, Allocco JJ, et al. Apicidin: a novel antiprotozoal agent that inhibits parasite histone deacetylase. Proc Natl Acad Sci USA. (1996) 93:13143–7. doi: 10.1073/pnas.93.23.13143
52. Rosenthal PJ, McKerrow JH, Aikawa M, Nagasawa H, Leech JH. A malarial cysteine proteinase is necessary for hemoglobin degradation by Plasmodium falciparum. J Clin Invest. (1988) 82:1560–6. doi: 10.1172/JCI113766
53. Skilton RA, Musoke AJ, Wells CW, Yagi Y, Nene V, Spooner PR, et al. A 32 kDa surface antigen of Theileria parva: characterization and immunization studies. Parasitology. (2000) 120:553–64. doi: 10.1017/S0031182099005934
54. Sitt T, Pelle R, Chepkwony M, Morrison WI, Toye P. Theileria parva antigens recognized by CD8+ T cells show varying degrees of diversity in buffalo-derived infected cell lines. Parasitology. (2018) 145:1430–9. doi: 10.1017/S0031182018000264
55. Do JH, Choi D-K. Clustering approaches to identifying gene expression patterns from DNA microarray data. Mol Cells. (2008) 25:279–88.
56. Witschi M, Xia D, Sanderson S, Baumgartner M, Wastling JM, Dobbelaere DAE. Proteomic analysis of the Theileria annulata schizont. Int J Parasitol. (2013) 43:173–80. doi: 10.1016/j.ijpara.2012.10.017
57. Dinga JN, Wamalwa M, Njimoh DL, Njahira MN, Djikeng A, Skilton R, et al. TpUB05, a homologue of the immunodominant Plasmodium falciparum protein UB05, is a marker of protective immune responses in cattle experimentally vaccinated against east coast fever. PLoS ONE. (2015) 10:e0128040. doi: 10.1371/journal.pone.0128040
58. Polonais V, Soldati-Favre D. Versatility in the acquisition of energy and carbon sources by the Apicomplexa. Biol Cell. (2010) 102:435–45. doi: 10.1042/BC20100005
59. Olszewski KL, Llinás M. Central carbon metabolism of Plasmodium parasites. Mol Biochem Parasitol. (2011) 175:95–103. doi: 10.1016/j.molbiopara.2010.09.001
Keywords: Theileria parva, schizont, piroplasm, transcriptome, vaccine antigens
Citation: Atchou K, Ongus J, Machuka E, Juma J, Tiambo C, Djikeng A, Silva JC and Pelle R (2020) Comparative Transcriptomics of the Bovine Apicomplexan Parasite Theileria parva Developmental Stages Reveals Massive Gene Expression Variation and Potential Vaccine Antigens. Front. Vet. Sci. 7:287. doi: 10.3389/fvets.2020.00287
Received: 29 February 2020; Accepted: 28 April 2020;
Published: 09 June 2020.
Edited by:
Dirk Werling, Royal Veterinary College (RVC), United KingdomReviewed by:
Gordon Langsley, INSERM U1016 Institut Cochin, FranceLindsay Michelle Fry, Animal Disease Research Unit, Agricultural Research Service, United States Department of Agriculture, United States
Copyright © 2020 Atchou, Ongus, Machuka, Juma, Tiambo, Djikeng, Silva and Pelle. This is an open-access article distributed under the terms of the Creative Commons Attribution License (CC BY). The use, distribution or reproduction in other forums is permitted, provided the original author(s) and the copyright owner(s) are credited and that the original publication in this journal is cited, in accordance with accepted academic practice. No use, distribution or reproduction is permitted which does not comply with these terms.
*Correspondence: Roger Pelle, r.pelle@cgiar.org