Nomogram Based on Log Odds of Positive Lymph Nodes Predicting Cancer-Specific Survival in Patients With T3 and T4 Gallbladder Cancer After Radical Resection
 Chen Yuan
 Qiaomeng Tao3
  Kai Wang
- 1Department of Hepatobiliary Surgery, The Second Affiliated Hospital of Nanchang University, Nanchang, China
- 2Department of General Surgery, The Second Affiliated Hospital of Nanchang University, Nanchang, China
- 3Department of Oncology, The Second Affiliated Hospital of Nanchang University, Nanchang, China
Background: The aim of this study based on log odds of positive lymph nodes (LODDS) is to develop and validate an effective prognostic nomogram for patients with T3 and T4 gallbladder cancer (GBC) after resection.
Patients and Methods: A total of 728 T3 and T4 gallbladder cancer patients after resection from the Surveillance, Epidemiology, and End Results (SEER) database, randomly divided into training cohort and validation cohort according to 7:3. Another 128 patients from The Second Affiliated Hospital of Nanchang University for external validation. The nomograms were built by the Cox regression model and the Fine and Grey's model. Concordance index (C-index), calibration curve and the area under receiver operating characteristic (ROC) curve (AUC) were used to evaluate the nomogram and internal verification. The decision curve analysis (DCA) was used to measure clinical applicability.
Result: LODDS was independent prognostic predictor for overall survival (OS) and cancer-specific survival (CSS), and established the nomograms on this basis. The nomogram we have established has a good evaluation effect, with a C-index of 0.719 (95%CI, 0.707–0.731) for OS and 0.747 (95%CI, 0.733–0.760) for CSS. The calibration curves of OS and CSS both showed good calibration capability, and the AUC for predicting 1-, 2-, and 3-year 0.858, 0.848 were and 0.811 for OS, and 0.794, 0.793, and 0.750 for CSS. The DCA of nomograms both showed good clinical applicability.
Conclusion: The nomogram can provide effective OS and CSS prediction for patients with advanced gallbladder cancer after surgery.
Introduction
Gallbladder cancer (GBC) is a malignant tumor formed from the mucosa of the gallbladder (1). GBC is relatively common in biliary malignancies, accounting for 80–95% of these patients (2). The prognosis of GBC is extremely poor, with an overall 5-year survival rate of <5% (3, 4), due to the lack of obvious typical clinical symptoms and early diagnostic strategies (5). Surgical resection is still the best treatment strategy for long-term survival, and systemic treatment is very important for advanced stage patients (6). Since GBC is prone to recurrent even after complete surgical resection (7, 8), radical resection supplemented with radiotherapy and chemotherapy is essential (9). Besides, lymph node metastasis is the most common way of metastasis in GBC, the lymph node stage and dissection serve as important roles affecting the prognosis of surgery (10, 11). Therefore, an accurate GBC prognostic model is very important for clinicians, which can provide individualized treatment strategies for high-risk patients.
The AJCC 8th TNM staging system is the most commonly used staging system for GBC, an N staging divides N1 and N2 by the number of metastatic lymph nodes. Recent study showed that positive lymph node ratio (pLNR) is more accurate to predict the prognosis of GBC (12). Besides, some other studies have proved that log odds of positive lymph nodes (LODDS), which was defined as the ratio of the number of positive lymph nodes to the number of negative lymph nodes, may have a better predictive effect (13). Many studies have shown that LODDS has a good predictive effect on cervical cancer (14), ovarian epithelial cancer (15), and gastric cancer (16). With age increased, most patients face comorbidities, and many patients die from non-tumor causes, which also causes competitive mortality (17). Therefore, we need to take these factors into consideration in order to avoid errors (18). On this basis, we developed new predictive nomograms to predict the overall survival (OS) and cancer-specific survival (CSS) of patients. Surveillance, Epidemiology, and End Results (SEER) database is an open database from which we collected data for research.
Patients and Methods
Study Design
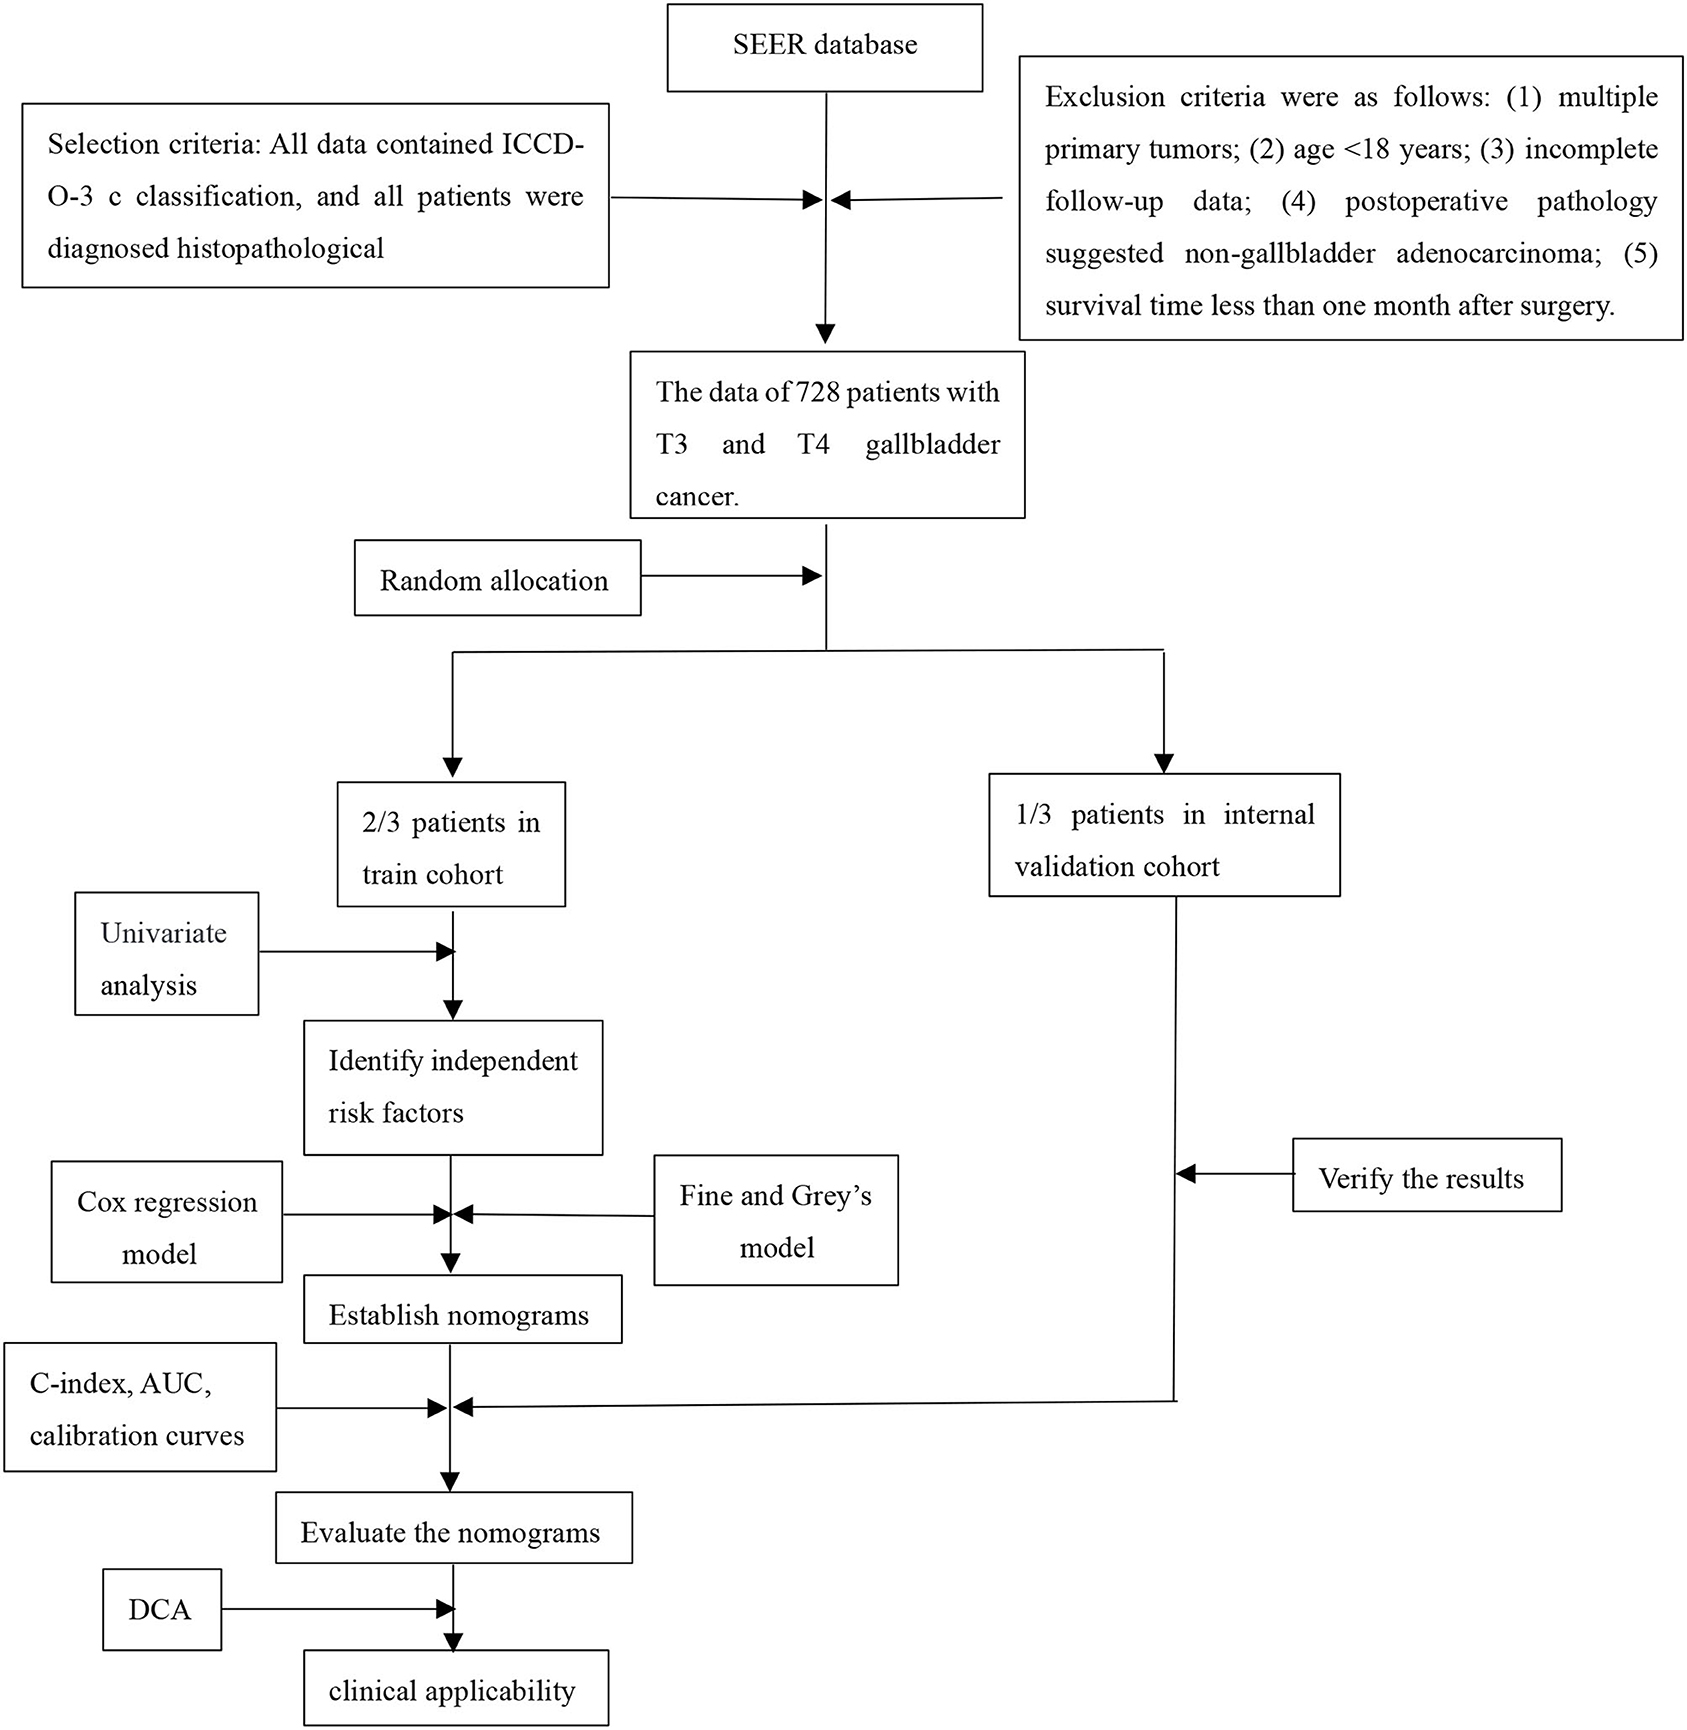
We retrospectively collected T3 and T4 gallbladder cancer patients after resection from the Surveillance, Epidemiology, and End Results (SEER) database, randomly divided into training cohort and validation cohort according to 7:3. Another patients from The Second Affiliated Hospital of Nanchang University for external validation. Through analysis, the independent risk factors that affect the patient's OS and CSS were obtained, and nomograms were constructed based on these. The aim of this study based on log odds of positive lymph nodes (LODDS) is to develop and validate an effective prognostic nomogram for patients with T3 and T4 gallbladder cancer (GBC) after resection.
Patient Enrollment
Patients pathologically diagnosed with advanced gallbladder cancer and underwent radical surgery were retrospectively collected. The training and internal verification cohorts came from the Surveillance, Epidemiology, and End Results (SEER) database for the period of 2010–2015 according to ICD-O-3/WHO 2008 classifications. The external verification cohort came from The Second Affiliated Hospital of Nanchang University for the period of 2010–2018. Radical surgery was defined as follows: (1) Hepatectomy: Gallbladder bed resection (>3 cm) or S4b+5 resection were routinely applied. Specially, hemihepatectomy plus pancreaticoduodenectomy or vessel reconstruction was considered if ligamentum hepatoduodenale was invaded; (2) Lymphadenectomy: N2 resection (No. 12/8/9/13); (3) Bile duct resection: Extrahepatic bile duct resection was considered if cystic duct was invaded. The exclusion criteria were as follows: (1) multiple primary tumors; (2) age <18 years; (3) incomplete follow-up data; (4) post-operative pathology suggested non-gallbladder adenocarcinoma; (5) survival time <1 month after surgery. Patients from SEER database were randomly divided into the training cohort and the internal verification cohort at a ratio of 7:3. This study was reviewed and approved by the ethics committee at our Institute and complied with the standards of the Helsinki Declaration and current ethical guidelines. Informed consent was exempt because it was accomplished retrospectively and anonymously. The flow chart is as follows:
Statistical Analysis
In our study, cancer-specific death, and non-cancer-specific death were two competing events. The comprehensive impact of variables on total mortality and cancer-specific mortality is assessed by proportional hazard analysis with Fine and Grey's model (19). A nomogram was established based on independent risk factors extracted by multivariate analysis. The Kaplan-Meier method was used to analyze OS and CSS, and a long-rank test was used to compare the survival difference. Cox multivariate analysis was used to determine independent risk factors. The C-index and the calibration curve were used to evaluate the accuracy of the nomogram. In addition, we had also drawn the receiver operating characteristic (ROC) curve and the area under the curve (AUC) to evaluate the accuracy of the nomogram. By calculating the net benefit at each risk threshold probability, a decision curve analysis (DCA) is used to identify and compare the clinical value between the nomogram model and other clinical features (20–22). R Studio 1.3.1,056 was used to perform all the statistical analyses. P < 0.05 was considered statistically significant, and all tests were two-sided.
The LODDS System
The logit of the positive lymph nodes, i.e., the LODDS, was defined as the log of the ratio between the probability of being positive lymph nodes and the probability of being negative lymph nodes when one lymph node is harvested. The definition of LODDS is log [(the number of positive lymph nodes +0.05)/(the number of negative lymph nodes +0.05)], where the pond is the number of positive lymph nodes and tnod is the total number of lymph nodes harvested, and 0.05 is added to both numerator and denomination to avoid the singularity. In our study, the LODDS ranged from −2.382 to 2.417. Therefore, we artificially divided the value of LODDS into four levels: LODDS1 (LODDS < -1.3), LODDS2 (−1.3≤ LODDS <0), LODDS3 (0≤ LODDS <1.3), and LODDS4 (LODDS ≥1.3).
Results
Patient Characteristics
In this study, we collected a total of 684 patients diagnosed with advanced gallbladder cancer who underwent radical surgery from 2010 to 2015 from the SEER database and another 128 patients with advanced GBC after surgery from The Second Affiliated Hospital of Nanchang University for the period of 2010–2018. All patients were considered to be diagnosed as gallbladder cancer before surgery, followed by radical resection, and pathologically diagnosed as gallbladder cancer after surgery. Overall, 72.4% (495/684) of the patients were female, and 59.9% (410/684) of patients were older than 65 years. The grade of a little more than half patients (50.9%) was poor. A large scale of patients (76.3%) had not received radiotherapy, while a considerable number of patients (52.2%) received chemotherapy. A total of 43.7% (299/684) patients had lymph node metastasis, and the number of patients in LODDS level 2 was the largest.
A total of 540 patients died in our study, with the follow-up time ranged from 1 to 82 months, and the median time is 10.5 months. Five hundred one patients were cancer-specific death, and 39 died of other causes. With the increase of age, the cumulative death rate of GBC had gradually increased. The 1-, 2-, and 3-year overall survival rates, cancer-specific and non-cancer-specific survival were summarized in Table 1. The cumulative cancer-specific and competing mortality curves are showed in Figure 1. Older patients have significantly higher mortality rates than younger patients. Patients were more likely to die of GBC, but not other causes when the following characteristics were satisfied: older age, poorer grade of tumor differentiation, not performed radiotherapy or chemotherapy, distant metastasis and higher LODDS levels. As for the feature of tumor size, patients with larger tumors have a higher probability of dying from GBC, and there is no significant difference in competition risk.
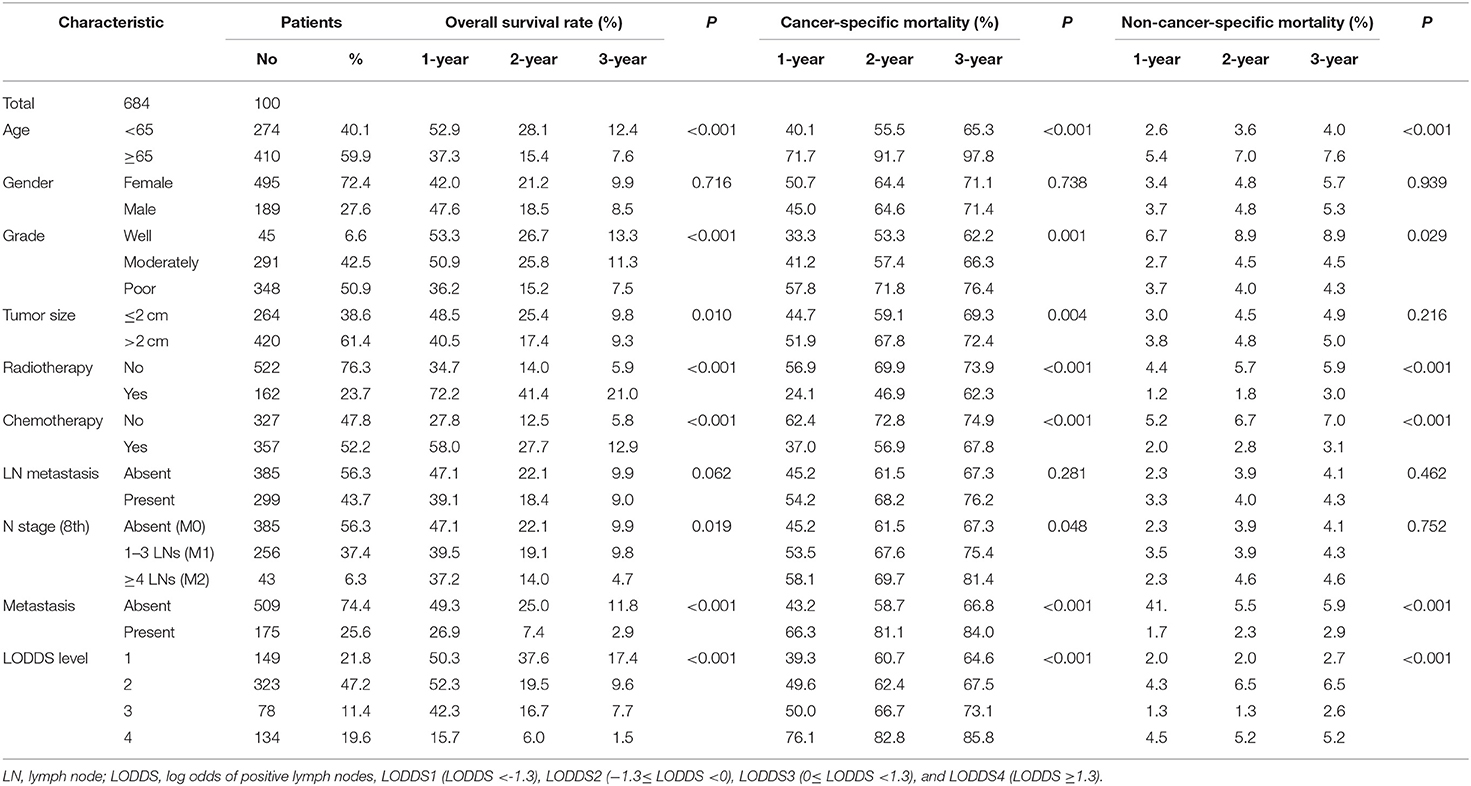
Table 1. Overall survival rates and cumulative incidences of mortality among patients with gallbladder cancer.
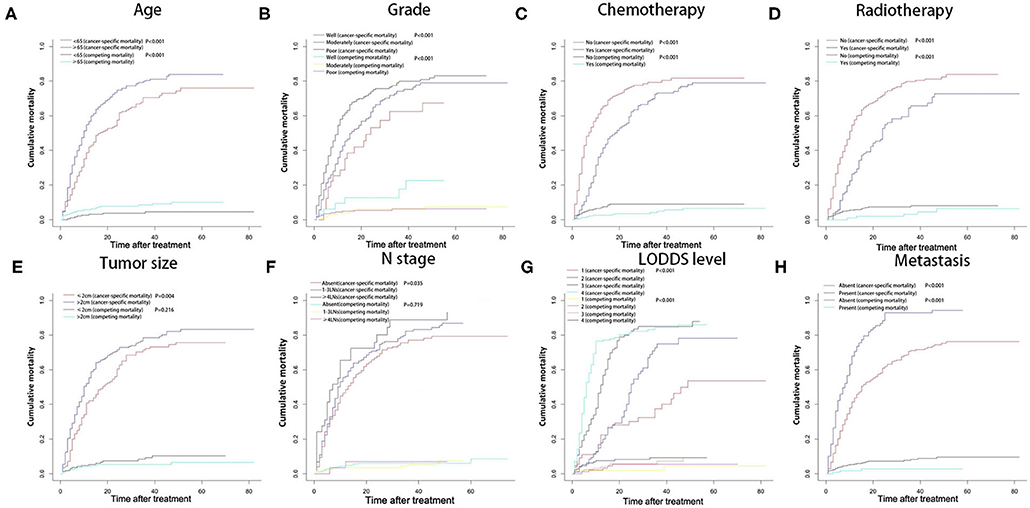
Figure 1. Cumulative cancer-specific and competing mortality according to patient characteristics: (A) age; (B) tumor grade; (C) chemotherapy; (D) radiotherapy; (E) tumor size; (F) N stage; (G) LODDS level; (H) metastasis. LODDS, log odds of positive lymph nodes.
The Kaplan-Meier curves used to compare OS were shown in Figure 2. Patients had significantly worse OS when the following characteristics were satisfied: older age, poorer grade of tumor differentiation, larger tumor size, not performed radiotherapy or chemotherapy, later N stage, distant metastasis, and higher LODDS levels.
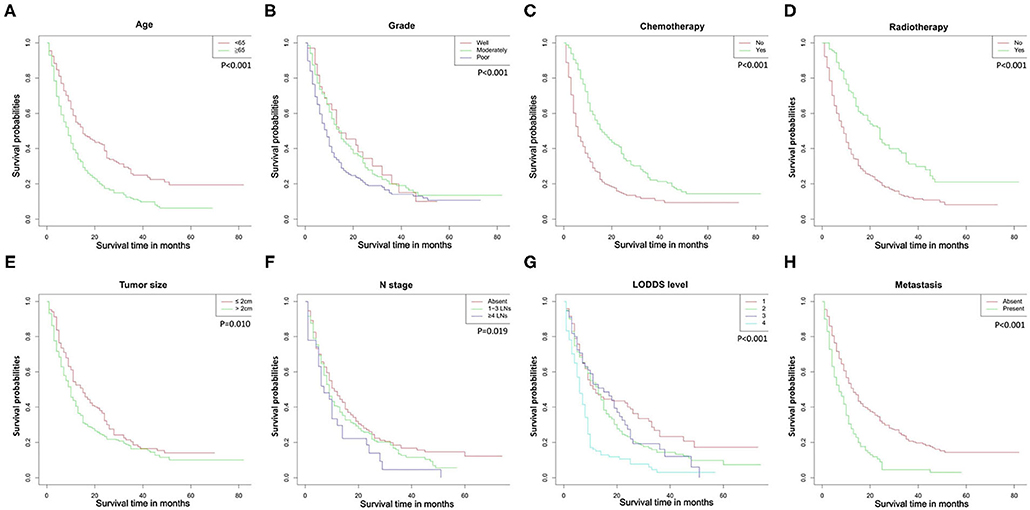
Figure 2. Overall survival rates according to patient characteristics: (A) age; (B) tumor grade; (C) chemotherapy; (D) radiotherapy; (E) tumor size; (F) N stage; (G) LODDS level; (H) metastasis. LODDS, log odds of positive lymph nodes.
Univariate and Multivariate Analyses of Significant Prognostic Factors on OS and CSS
In our study, the median OS of patients was 10 months, and the 1-, 2-, and 3-year OS rates for all patients were 43.6, 20.5, and 9.5%, respectively. The univariate analyses of OS showed that age, LN (lymph node) metastasis, N stage, distant metastasis, tumor grade, tumor size, chemotherapy, and LODDS level had a significant impact on survival. In addition, the multivariate analyses of competing showed that age, LN metastasis, distant metastasis, tumor grade, tumor size, chemotherapy, and LODDS level also had a significant impact on cancer-specific survival. Gender showed no significant correlation with OS and CSS. All the results of univariate and multivariate analyses were shown in Table 2.
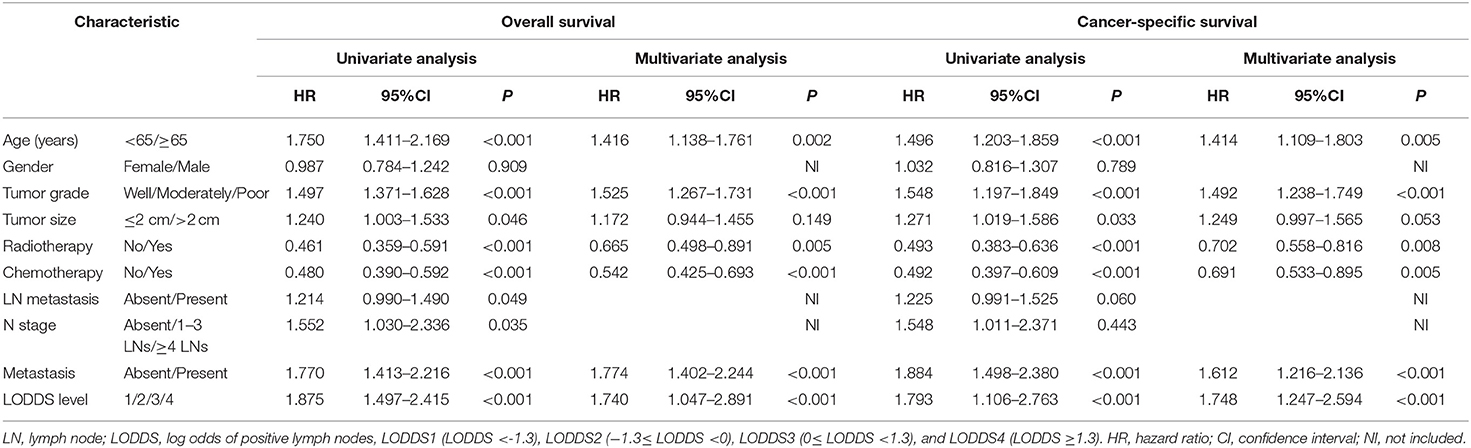
Table 2. Univariate and multivariate analyses of survival in patients with advanced gallbladder cancer.
The multivariate analysis of OS and CSS through the significant variables of univariate analysis showed in Table 2. Through multivariate analysis, the independent risk factors for OS were determined as age, distant metastasis, tumor grade, radiotherapy, chemotherapy, and LODDS level. In addition, the independent risk factors for CSS were determined as age, distant, tumor grade, chemotherapy, and LODDS level.
Construction and Validation of Nomograms for OS and CSS
All independent risk factors for OS and CSS were included in the nomogram. As shown in Figure 3, we used the training cohort to establish the nomograms predicting 1-, 2-, and 3-year OS and CSS rates. By adding up the scores of each selected variable, the probability of individual patient survival can be easily calculated. With a C-index of 0.719 (95%CI, 0.707–0.731), the nomogram showed good accuracy for OS prediction. The calibration curves of 1-, 2-, and 3-year OS probabilities showed that both in the training and validation cohorts, the survival rates predicted by the nomogram were consistent with the actual survival rates (Figure 4). In addition, the nomogram also showed good accuracy for CSS prediction, with a C-index of 0.743 (95%CI, 0.733–0.760). Calibration curves of CSS probabilities for 1-, 2-, and 3-year also showed the good agreement between nomogram predictions and actual observations in the training and validation cohorts (Figure 5).

Figure 3. Nomograms predicting 1-, 2-, and 3-year OS (A) and CSS (B) of patients with advanced gallbladder cancer after resection. OS, overall survival; CSS, cancer-specific survival; LODDS, log odds of positive lymph nodes.
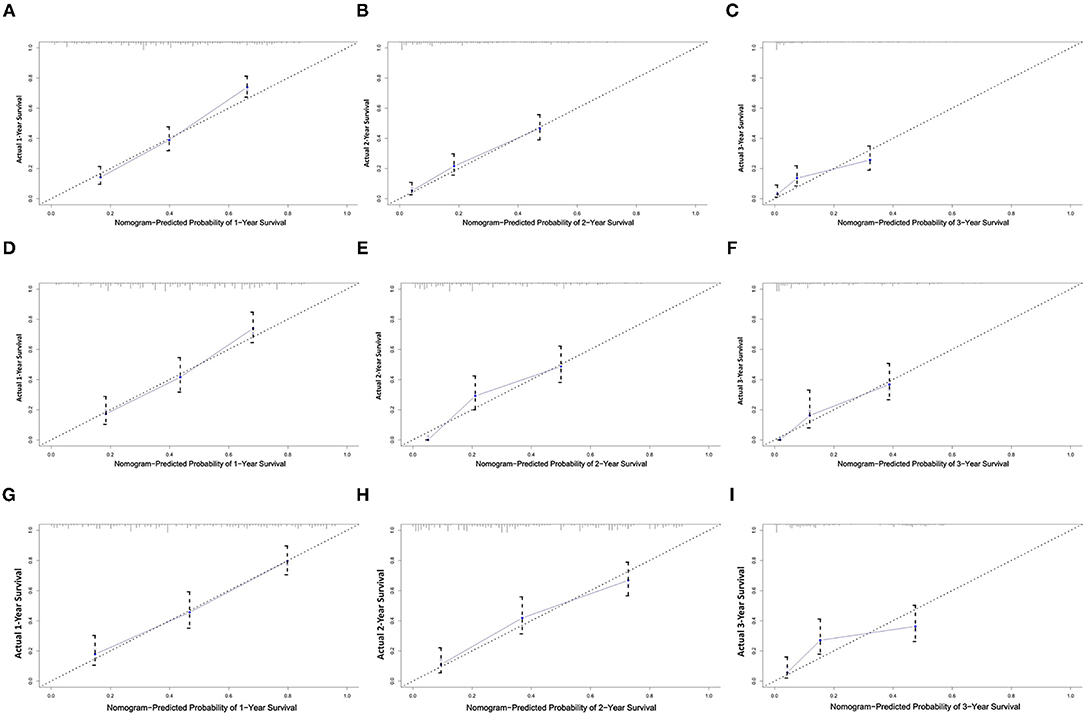
Figure 4. Calibration plots of the nomogram for 1-, 2-, and 3-year OS prediction of the training set (A–C), internal validation set (D–F), and external set (G–I). X-axis represents the nomogram-predicted probability of survival; Y-axis represents the actual OS probability. A perfectly accurate nomogram prediction model would result in a plot that the observed and predicted probabilities for given groups fall along the line. Dots with bars represent nomogram-predicted probabilities along with 95% confidence interval.
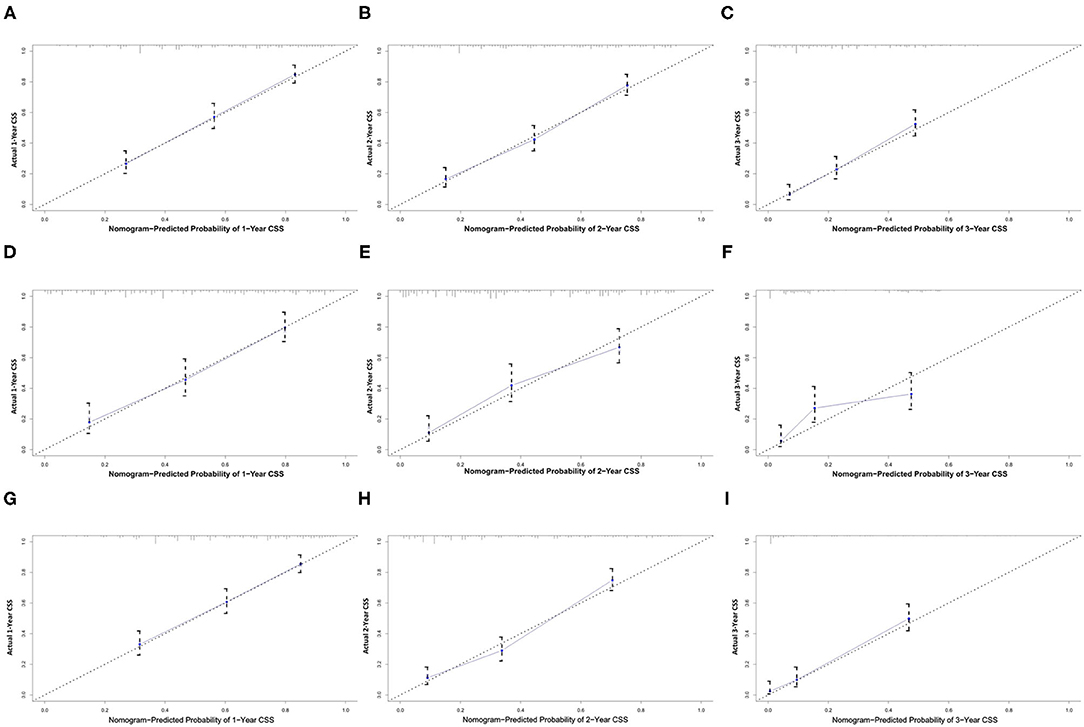
Figure 5. Calibration plots of the nomogram for 1-, 2-, and 3-year CSS prediction of the training set (A–C), internal validation set (D–F), and external set (G–I). X-axis represents the nomogram-predicted probability of survival; Y-axis represents the actual CSS probability. CSS, cancer-specific survival.
The area under ROC curve (AUC) values were used to predict the accuracy of nomogram. For the whole cohort, the AUC values of the nomogram for predicting the 1-, 2-, and 3-year OS rates were 0.858, 0.848, and 0.811, and in CSS were 0.794, 0.793, and 0.750 (Figure 6). AUC values were observed in the training cohort, internal validation cohort and external validation cohort were higher than 0.7 (Table 3). Finally, the decision curve analysis (DCA) was used to evaluate the clinical application value of the nomogram, which were evaluated by the threshold value of each DCA curves (Figure 7).
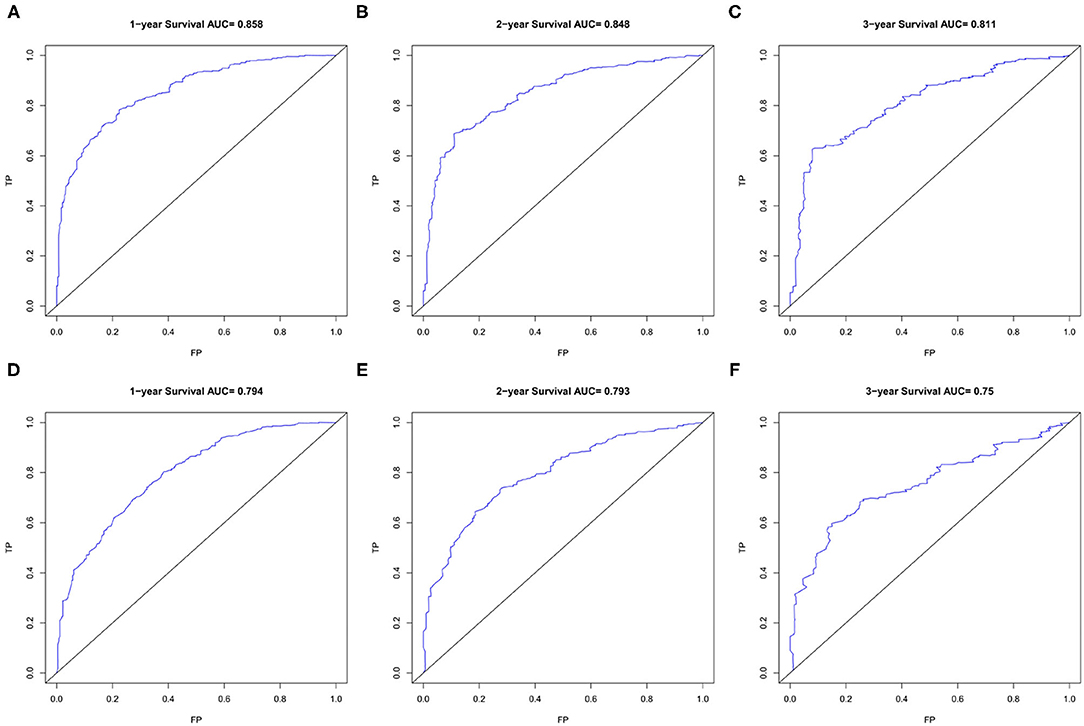
Figure 6. The ROC curves of the nomogram for 1-, 2-, and 3-year OS prediction (A–C) and CSS prediction (D–F). OS, overall survival; CSS, cancer-specific survival.
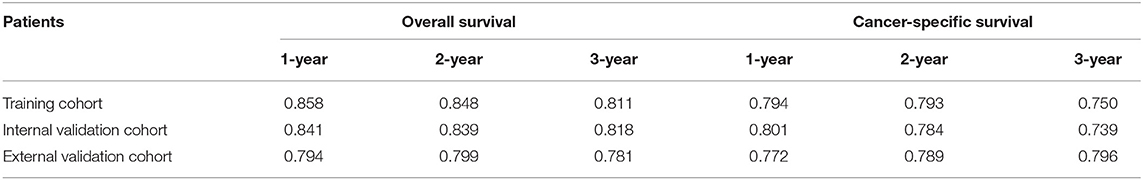
Table 3. The AUC value of nomogram for predicting 1-, 2-, and 3-year OS and CSS.
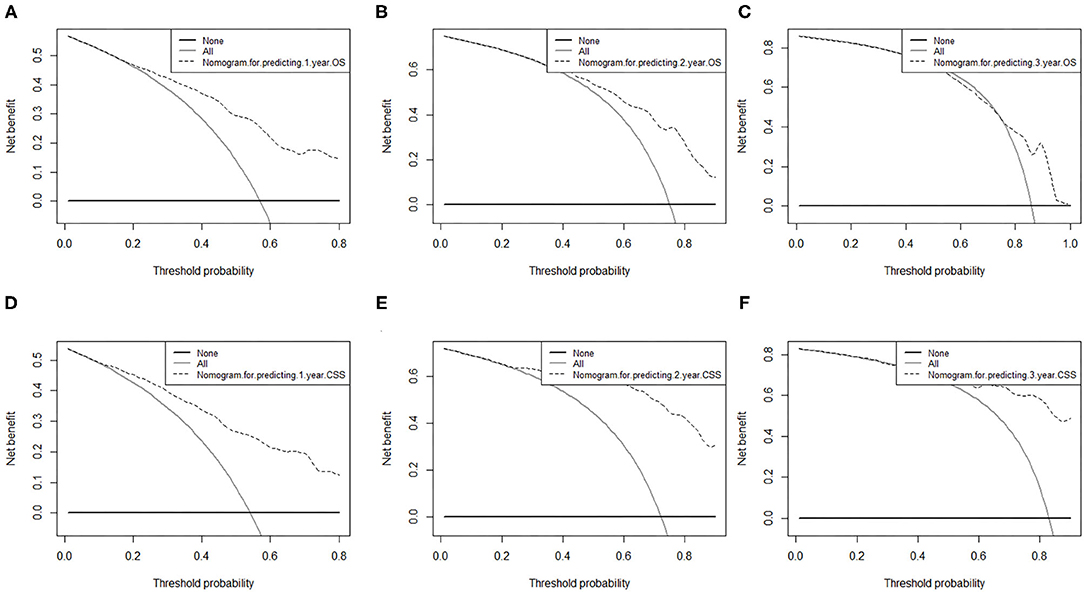
Figure 7. Decision curve analysis of nomograms for predicting (A) 1-year OS; (B) 2-year OS; (C) 3-year OS and (D) 1-year CSS; (E) 2-year CSS; (F) 3-year CSS. OS, overall survival; CSS, cancer-specific survival. The dashed lines indicate the net benefit of the models across a range of threshold probabilities. The horizontal solid black line represents the hypothesis that no patients experienced the endpoint, and the solid gray line represents the hypothesis that all patients met the endpoint. At different threshold probabilities within a given population, the number of high-risk patients and the number of high-risk patients with the outcome were plotted.
Survival Analysis and Competing Risk Analysis Based on the Risk Stratification of the Nomogram
In this study, all patients with probability scores below or above the average score were divided into low-risk and high-risk groups. As shown in the Figure 8, compared with patients in the low-risk group, patients in the high-risk group had significantly lower survival rates and higher cancer-specific death rates.
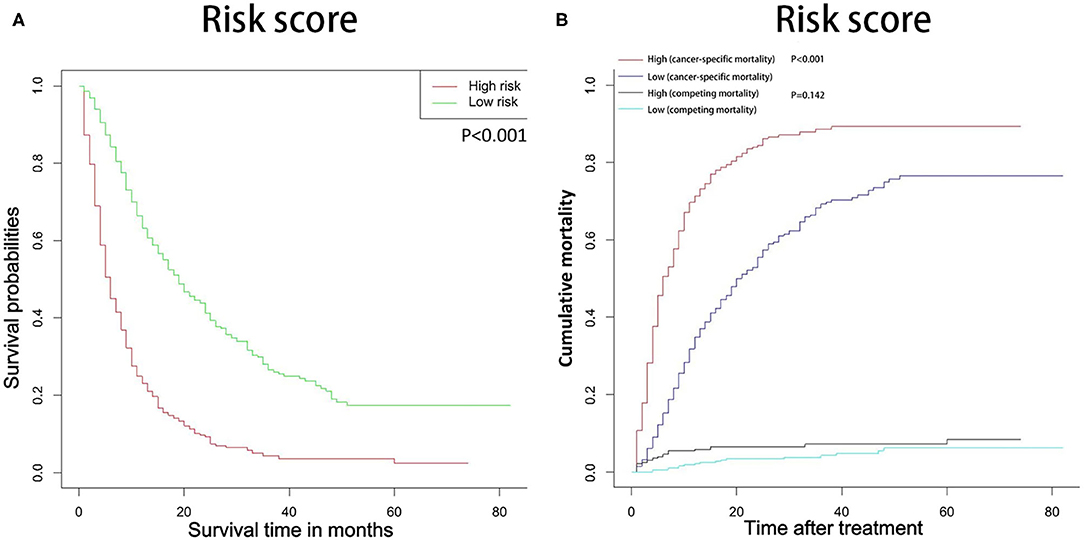
Figure 8. OS (A) and CSS (B) stratified by the risk levels of the nomogram-predicted survival probabilities. OS, overall survival; CSS, cancer-specific survival.
Discussion
In this study, we calculated the OS rate and competitive risk mortality of patients with advanced GBC patients who underwent radical resection. In this case, we established an effective prognostic model, which contains clinical features that the AJCC 8th TNM staging does not have.
Most studies have shown that the increase in age may have an impact on survival (23–25). In our study, most non-cancer-specific deaths occurred in elderly patients. It may be caused by the high comorbidity rate in elderly patients, which indicates that non-cancer-specific death is an extremely important competitive risk event for elderly patients (26). Therefore, it is very necessary to evaluate the surgical tolerance of elderly patients before surgery to reduce unnecessary non-cancer-specific deaths, and to pay attention to age when considering prognosis.
In our study of OS and CSS, the tumor differentiation, distant metastasis, radiotherapy and chemotherapy, and LODDS levels had a significant impact on survival. Similar to most studies, once a tumor had metastasized, it usually indicated a poor prognosis (14, 27). Even if the distant metastasis of the tumor is surgically removed, it is easy to recur, which will greatly affect the survival of the patient. The degree of tumor differentiation is an inherent characteristic of the tumor, and it is necessary to take it into consideration when considering the prognosis of the patient. In this study, we can saw that as the tumor grade changed from well to poor, the prognosis becomes worse. Like most studies (28, 29), the degree of tumor differentiation was also an independent risk factor affecting the prognosis of GBC patients. The advantage of the nomogram and the 8th AJCC TNM staging is that it can already add variables that are not included in the 8th AJCC TNM staging, and these variables are available in the clinic. Adjuvant therapy is becoming more and more important in the comprehensive treatment of tumors. In our study, both radiotherapy and chemotherapy had a significant impact on the prognosis of patients with advanced gallbladder cancer. Previous study (12) have shown that adjuvant therapy has benefited only in patients with stage II and higher grades, which is consistent with our results.
Lymph nodes are the most important metastasis route for GBC and an important factor affecting the prognosis after radical resection (30, 31), It may have a greater impact than T staging in patients with advanced focal lesions (32). In addition, the LODDS level also has a significant impact on the prognosis of GBC patients through univariate and multivariate analysis. This is different from the traditional N staging that only focuses on the number of lymph node metastases. LODDS also considers the number of negative lymph nodes to be removed. Previous study (13) have proved that LOODS has a significant impact on the prognosis of GBC patients, but it has a significant effect on the overall GBC patients, and what we have observed is more significant in advanced patients. Although LODDS is gradually recognized by clinicians and pathologists, there is still no uniform standard for the cut-off value of LODDS stratification.
We should consider non-cancer-specific death when evaluating the prognosis of decision-making and patient consultation, because this is the most important competitive risk in survival analysis. In this study, we included the factors of TNM staging and other tumor-related factors, which enhanced the ability to predict OS and CSS in advanced GBC patients. In addition, survival curve or competitive risk analysis demonstrates the use of nomograms to predict probabilistic survival rates or clear risk stratification for cancer-specific survival rates. As far as we know, this is the first study of OS and CSS nomograms for patients with advanced gallbladder cancer after surgery. At the same time, the nomogram also showed relatively high accuracy, with the C-index exceeding 0.7 in both the training cohort and the verification cohort. However, high accuracy does not necessarily indicate whether this prediction model has high clinical applicability (20, 33). The decision curve analysis can evaluate the clinical practical value of the prediction model by quantifying the net income of the prediction model according to the threshold probability (34). Therefore, we introduced DCA to evaluate the clinical utility of our nomogram, and the decision curve analysis confirmed the clinical validity of our nomogram in OS and CSS in patients with advanced gallbladder cancer after surgery.
Of course, our research also has some limitations. First of all, there are no relevant serological examinations in the SEER database and there are some surgical-related indicators, such as vascular invasion. These variables will be in our future research. Second, similar to other retrospective studies, both the development cohort and the validation cohort are affected by selection bias. Finally, our research only selected external verification from one hospital, and multi-center verification is needed to verify the accuracy of the nomogram. And our nomogram does not include all prognostic factors, and in clinical practice cannot always provide an accurate prognosis.
Conclusion
In summary, based on the competitive risk analysis model and survival model established on the SEER database, this study established the estimated values of 1-, 2-, and 3-year OS and CSS for patients with advanced GBC after surgical resection. In addition, our nomograms showed relatively good performance, which may contribute to highly individualized patient management in clinical practice.
Data Availability Statement
The raw data supporting the conclusions of this article will be made available by the authors, without undue reservation.
Ethics Statement
Ethical review and approval was not required for the study on human participants in accordance with the local legislation and institutional requirements. Written informed consent for participation was not required for this study in accordance with the national legislation and the institutional requirements.
Author Contributions
SZ was responsible for conception, design, quality control of this study, reviewed, and edited the manuscript. CY, ZH, QT, and KW performed the study selection, data extraction, statistical analyses, and were major contributors in writing the manuscript, and contributed to classification criteria discussion. CY, JW, and ZH participated in study selection and statistical analyses. All authors have read and approved the final version of the manuscript.
Funding
This study was supported by the Research Project of Science and Technology from Healthy Committee of Jiangxi Province (No. 20204247) and Research Project of Science and Technology from Education Bureau of Jiangxi Province (No. 2020).
Conflict of Interest
The authors declare that the research was conducted in the absence of any commercial or financial relationships that could be construed as a potential conflict of interest.
Publisher's Note
All claims expressed in this article are solely those of the authors and do not necessarily represent those of their affiliated organizations, or those of the publisher, the editors and the reviewers. Any product that may be evaluated in this article, or claim that may be made by its manufacturer, is not guaranteed or endorsed by the publisher.
References
1. Schmidt MA, Marcano-Bonilla L, Roberts LR. Gallbladder cancer: epidemiology and genetic risk associations. Chin Clin Oncol. (2019) 8:31. doi: 10.21037/cco.2019.08.13
2. Goetze TO. Gallbladder carcinoma: prognostic factors and therapeutic options. World J Gastroenterol. (2015) 21:12211–7. doi: 10.3748/wjg.v21.i43.12211
3. Jung W, Jang JY, Kang MJ. Effects of surgical methods and tumor location on survival and recurrence patterns after curative resection in patients with T2 gallbladder cancer. Gut Liver. (2016) 10:140–6. doi: 10.5009/gnl15080
4. Hundal R, Shaffer EA. Gallbladder cancer: epidemiology and outcome. Clin Epidemiol. (2014) 6:99–109. doi: 10.2147/CLEP.S37357
5. Zeng H, Chen W, Zheng R, Zhang S, Ji JS, Zou X, et al. Changing cancer survival in China during 2003-15: a pooled analysis of 17 population-based cancer registries. Lancet Glob Health. (2018) 6:e555–67. doi: 10.1016/S2214-109X(18)30127-X
6. Abdel-Rahman O, Elsayed Z, Elhalawani H. Gemcitabine-based chemotherapy for advanced biliary tract carcinomas. Cochrane Database Syst Rev. (2018) 4:CD011746. doi: 10.1002/14651858.CD011746.pub2
7. Ben-Josef E, Guthrie KA, El-Khoueiry AB, Corless CL, Zalupski MM, Lowy AM, et al. SWOG S0809: a phase II intergroup trial of adjuvant capecitabine and gemcitabine followed by radiotherapy and concurrent capecitabine in extrahepatic cholangiocarcinoma and gallbladder carcinoma. J Clin Oncol. (2015) 33:2617–22. doi: 10.1200/JCO.2014.60.2219
8. Stein A, Arnold D, Bridgewater J, Goldstein D, Jensen LH, Klümpen HJ, et al. Adjuvant chemotherapy with gemcitabine and cisplatin compared to observation after curative intent resection of cholangiocarcinoma and muscle invasive gallbladder carcinoma (ACTICCA-1 trial) - a randomized, multidisciplinary, multinational phase III trial. BMC Cancer. (2015) 15:564. doi: 10.1186/s12885-015-1498-0
9. Mitin T, Enestvedt CK, Jemal A, Sineshaw HM. Limited use of adjuvant therapy in patients with resected gallbladder cancer despite a strong association with survival. J Natl Cancer Inst. (2017) 109:djw324. doi: 10.1093/jnci/djw324
10. Kondo S, Takada T, Miyazaki M, Miyakawa S, Tsukada K, Nagino M, et al. Guidelines for the management of biliary tract and ampullary carcinomas: surgical treatment. J Hepatobiliary Pancreat Surg. (2008) 15:41–54. doi: 10.1007/s00534-007-1279-5
11. Fong Y, Wagman L, Gonen M, Crawford J, Reed W, Swanson R, et al. Evidence-based gallbladder cancer staging: changing cancer staging by analysis of data from the National Cancer Database. Ann Surg. (2006) 243:767–71; discussion: 771–4. doi: 10.1097/01.sla.0000219737.81943.4e
12. Yan Y, Lin J, Zhang M, Liu H, Zhou Q, Chen R, et al. A novel staging system to forecast the cancer-specific survival of patients with resected gallbladder cancer. Front Oncol. (2020) 10:1281. doi: 10.3389/fonc.2020.01281
13. Xiao Z, Shi Z, Hu L, Gao Y, Zhao J, Liu Y, et al. A new nomogram from the SEER database for predicting the prognosis of gallbladder cancer patients after surgery. Ann Transl Med. (2019) 7:738. doi: 10.21037/atm.2019.11.112
14. Wang C, Yang C, Wang W, et al. A Prognostic nomogram for cervical cancer after surgery from SEER Database. J Cancer. (2018) 9:3923–8. doi: 10.7150/jca.26220
15. Xu XL, Cheng H, Tang MS, Zhang H-L, Wu R-Y, Yu Y, et al. A novel nomogram based on LODDS to predict the prognosis of epithelial ovarian cancer. Oncotarget. (2017) 8:8120–30. doi: 10.18632/oncotarget.14100
16. Wang ZX, Qiu MZ, Jiang YM, Zhou Z-W, Li G-X, Xu R-H. Comparison of prognostic nomograms based on different nodal staging systems in patients with resected gastric cancer. J Cancer. (2017) 8:950–8. doi: 10.7150/jca.17370
17. Janssen-Heijnen ML, Houterman S, Lemmens VE, Louwman MWJ, Maas HAAM, Coebergh JWW. Prognostic impact of increasing age and co-morbidity in cancer patients: a population-based approach. Crit Rev Oncol Hematol. (2005) 55:231–40. doi: 10.1016/j.critrevonc.2005.04.008
18. Noordzij M, Leffondré K, van Stralen KJ, Zoccali C, Dekker FW, Jager KJ. When do we need competing risks methods for survival analysis in nephrology? Nephrol Dial Transplant. (2013) 28:2670–7. doi: 10.1093/ndt/gft355
19. Austin PC, Fine JP. Practical recommendations for reporting Fine-Gray model analyses for competing risk data. Stat Med. (2017) 36:4391–400. doi: 10.1002/sim.7501
20. Vickers AJ, Cronin AM, Elkin EB, Gonen M. Extensions to decision curve analysis, a novel method for evaluating diagnostic tests, prediction models and molecular markers. BMC Med Inform Decis Mak. (2008) 8:53. doi: 10.1186/1472-6947-8-53
21. Hijazi Z, Oldgren J, Lindbäck J, et al. The novel biomarker-based ABC (age, biomarkers, clinical history)-bleeding risk score for patients with atrial fibrillation: a derivation and validation study. Lancet. (2016) 387:2302–11. doi: 10.1016/S0140-6736(16)00741-8
22. Dong F, Shen Y, Gao F, Shi X, Xu T, Wang X, et al. Nomograms to predict individual prognosis of patients with primary small cell carcinoma of the bladder. J Cancer. (2018) 9:1152–64. doi: 10.7150/jca.23344
23. Wu X-X, Chen R-P, Chen R-C, Gong H-P, Wang B-F, Li Y-L, et al. Nomogram predicting cancer-specific mortality in patients with esophageal adenocarcinoma: a competing risk analysis. J Thorac Dis. (2019) 11:2990–3003. doi: 10.21037/jtd.2019.07.56
24. Wang F, Zhang H, Wen J, Zhou J, Liu Y, Cheng B, et al. Nomograms forecasting long-term overall and cancer-specific survival of patients with oral squamous cell carcinoma. Cancer Med. (2018) 7:943–52. doi: 10.1002/cam4.1216
25. Eggener SE, Scardino PT, Walsh PC, Han M, Partin AW, Trock BJ, et al. Predicting 15-year prostate cancer specific mortality after radical prostatectomy. J Urol. (2011) 185:869–75. doi: 10.1016/j.juro.2010.10.057
26. Eguchi T, Bains S, Lee MC, Han M, Partin AW, Trock BJ, et al. Impact of increasing age on cause-specific mortality and morbidity in patients with stage I non-small-cell lung cancer: a competing risks analysis. J Clin Oncol. (2017) 35:281–90. doi: 10.1200/JCO.2016.69.0834
27. Zhang J, Gong Z, Gong Y, Guo W. Development and validation of nomograms for prediction of overall survival and cancer-specific survival of patients with Stage IV colorectal cancer. Jpn J Clin Oncol. (2019) 49:438–46. doi: 10.1093/jjco/hyz035
28. He C, Cai Z, Zhang Y, Lin X. Prognostic model to predict cancer-specific survival for patients with gallbladder carcinoma after surgery: a population-based analysis. Front Oncol. (2019) 9:1329. doi: 10.3389/fonc.2019.01329
29. Li P, Song L. Prognostic evaluation for patients over 45 years old with gallbladder adenocarcinoma resection: a SEER-based nomogram analysis. Biomed Res Int. (2020) 2020:6370946. doi: 10.1155/2020/6370946
30. Murakami Y, Uemura K, Sudo T, Hashimoto Y, Nakashima A, Kondo N, et al. Prognostic factors of patients with advanced gallbladder carcinoma following aggressive surgical resection. J Gastrointest Surg. (2011) 15:1007–16. doi: 10.1007/s11605-011-1479-9
31. Zaydfudim V, Feurer ID, Wright JK, Pinson CW. The impact of tumor extent (T stage) and lymph node involvement (N stage) on survival after surgical resection for gallbladder adenocarcinoma. HPB. (2008) 10:420–7. doi: 10.1080/13651820802320057
32. Birnbaum DJ, Viganò L, Ferrero A, Langella S, Russolillo N, Capussotti L. Locally advanced gallbladder cancer: which patients benefit from resection? Eur J Surg Oncol. (2014) 40:1008–15. doi: 10.1016/j.ejso.2013.10.014
33. Vickers AJ, Elkin EB. Decision curve analysis: a novel method for evaluating prediction models. Med Decis Making. (2006) 26:565–74. doi: 10.1177/0272989X06295361
Keywords: gallbladder cancer, nomogram, prognostic, cancer-specific survival, LODDS
Citation: Yuan C, Tao Q, Wang J, Wang K, Zou S and Hu Z (2021) Nomogram Based on Log Odds of Positive Lymph Nodes Predicting Cancer-Specific Survival in Patients With T3 and T4 Gallbladder Cancer After Radical Resection. Front. Surg. 8:675661. doi: 10.3389/fsurg.2021.675661
Received: 03 March 2021; Accepted: 20 September 2021;
Published: 27 October 2021.
Edited by:
Marco Scarpa, University Hospital of Padua, ItalyReviewed by:
Antonio Sommariva, Veneto Institute of Oncology (IRCCS), ItalyMarco Massani, ULSS2 Marca Trevigiana, Italy
Copyright © 2021 Yuan, Tao, Wang, Wang, Zou and Hu. This is an open-access article distributed under the terms of the Creative Commons Attribution License (CC BY). The use, distribution or reproduction in other forums is permitted, provided the original author(s) and the copyright owner(s) are credited and that the original publication in this journal is cited, in accordance with accepted academic practice. No use, distribution or reproduction is permitted which does not comply with these terms.
*Correspondence: Zhigang Hu, jackiehu918@163.com