Forest Edges Near Farms Enhance Wheat Productivity Measures: A Test Using High Spatial Resolution Remote Sensing of Smallholder Farms in Southern Ethiopia
 Kevin F. Yang
 Sarah E. Gergel
 Jean-Yves Duriaux-Chavarría
 Frédéric Baudron
- 1Department of Forest and Conservation Science, Faculty of Forestry, University of British Columbia, Vancouver, BC, Canada
- 2International Maize and Wheat Improvement Centre (CIMMYT), Harare, Zimbabwe
Staple crops are grown by millions of smallholder farmers yet estimating field-level yields over broad regions can be challenging. Furthermore, agricultural productivity can be impacted by nearby forests and trees. In an agricultural-forest mosaic in Southern Ethiopia, we used remote sensing imagery to identify and differentiate among dominant crops and assess the impact of nearby forest patches on wheat productivity. Using a suite of vegetation indices (VIs) derived from high spatial resolution (5–10 m) satellite imagery as a proxy for wheat productivity, we determined whether VIs were enhanced or suppressed with increasing distance to forest. We found that 5–10 m resolution satellite imagery was sufficient for identifying and differentiating among field boundaries and dominant crops, however, imagery from higher spatial resolution satellites would see increased benefits in accuracy. VIs increased by as much as 5% in areas of the fields within 30 m of forest edges compared to fields further from forests. Our results highlight potential benefits of a landscape approach for enhancing smallholder agricultural productivity in Southern Ethiopia. High spatial resolution imagery is a cost-effective method to map and identify promising landscape approaches in agricultural-forest mosaics dominated by smallholder farms. Thus, a landscape perspective aided by remote-sensing can provide a straightforward and cost-effective way to monitor crop productivity and track changes in agricultural productivity due to forest fragmentation and/or restoration. A landscape approach to achieving food security goals, particularly within the context of climate considerations, and should play a more prominent role in planning forest conservation and restoration.
Introduction
Maize (Zea mays), rice (Oryza sativa), and wheat (Triticum aestivum) are vital to food security, accounting for over half of the world's dietary caloric supply (FAO, 2018). Global food security has improved during recent decades and the number of people who are undernourished has fallen by more than 200 million people since 1990 (FAO, 2015). However, despite this progress, one in nine people remain undernourished (FAO, 2018). Numerous international, national, and regional initiatives have made food security a priority. For example, the United Nation's second Sustainable Development Goal (SDG 2) aims to end all hunger and food insecurity by 2030 (UNHCR, 2017). Staple crops are especially important in the least developed countries, where food insecurity is very common (FAO, 2015) and many people rely most heavily on subsistence agriculture for their livelihoods.
Remote sensing is one approach that can help support food security goals by lowering costs and reducing logistical challenges associated with the monitoring of crop yields and other landscape factors that may influence agricultural productivity; yet a problematic data gap exists for smallholder farms. To date, a greater emphasis has been placed on remote sensing of yields at broad spatial extents and coarse spatial resolutions, and often on industrial-scale agriculture in developed countries (Mulla, 2013). For example, yields of staple crops such as maize and wheat are routinely monitored over large areas using coarse or moderate resolution satellite imagery such as MODIS (Moderate Resolution Imaging Spectroradiometer) and Landsat (Doraiswamy et al., 2004; Ren et al., 2008). However, such approaches are unable to differentiate heterogeneous crops in smallholder fields (Grassini et al., 2015).
Almost 85% of the world's estimated 570 million farms are smaller than 2 ha in size (Lowder et al., 2016). As with any farm, assessing the productivity and health of smallholder farms can help identify problems and improve yields. However, obtaining direct yield measurements from small, fragmented, and highly diverse fields and farms common to smallholders can be particularly challenging. High spatial resolution satellite imagery such as Sentinel-2 (10 m), RapidEye (5 m), and Quickbird (2.5 m), can help fill this data gap for smallholder fields otherwise impossible to analyze with coarser resolution imagery. In addition, high spatial resolution imagery also enables identification of small yet important fine resolution features such as small forest patches and scattered trees which can impact agricultural productivity (Pu and Landry, 2012).
Forests and scattered trees can help improve food security by providing ecosystem services and improving agricultural productivity (Zomer et al., 2009; Bommarco et al., 2013; Reed et al., 2017). For example, when grown alongside staple crops as part of an agroforestry system, Faidherbia albida (F. albida) can improve water availability, soil moisture, and water use efficiency (Laike, 1991; Camargo and Kapos, 1995; Jackson et al., 2000; Payne, 2000; Sida et al., 2018a). This tree species can also enhance soil fertility via nitrogen fixation (Giller, 2001; Kho et al., 2001), organic matter build-up (Gelaw et al., 2014), and nutrient cycling (Cannell et al., 1996). Importantly, forests near field margins also moderate microclimatic conditions within fields (Gehlhausen et al., 2000; Chen et al., 2010), enhancing agricultural yields especially for C3 crops such as wheat (Reed et al., 2017). In certain ecosystems, forests and trees may provide habitat for both pollinators and natural enemies that prey on agricultural pests, thereby increasing yields (Dix et al., 1995; Bianchi et al., 2006; Garibaldi et al., 2013).
The landscape mosaic of smallholder farms interspaced with forest patches throughout Southern Ethiopia represents an ideal location for exploring relationships between forest edges and agricultural productivity. Here, smallholder farms are often composed of a complex mosaic of croplands, pastures, home gardens, and forest patches integrated into a mixed crop-livestock system (Baudron et al., 2017). Wheat is a major staple crop for smallholders in the cooler Ethiopian highlands (Tanner and Hulluka, 1991) and is among the primary cereal crops grown in Ethiopia, following only teff (Eragrostis tef) and maize in terms of total production and cultivated area (Taffesse et al., 2012). Additionally, wheat yield is extremely dependent on water availability and temperature (Pinter et al., 1990; Baldocchi, 1994; Streck, 2005), and is therefore potentially susceptible to microclimatic effects from nearby forest edges. Within this context, we explore two primary questions regarding the relationship between forests and wheat productivity:
Can high spatial resolution remote sensing be used to distinguish among crops and estimate productivity on smallholder farms?
Using recently available high spatial resolution satellite imagery (RapidEye and Sentinel-2), we aimed to identify and distinguish between wheat and maize fields and measure patterns of agricultural productivity in smallholder farms. RapidEye is a series of commercial satellites capturing 5 m resolution imagery from five multi-spectral sensors. The geographic extent of image capture depends on commercial demand, and therefore, archived historical imagery is limited. In contrast, the European Space Agency Sentinel-2 satellites with 10 m resolution imagery has a free and open data policy and an average global revisit time of 5 days. To distinguish wheat and maize fields, we first use RapidEye and Sentinel-2 imagery to discriminate field boundaries and identify crop types based on seasonal differences due to vegetation phenology and field preparation (including timing of plowing and handling of crop residue).
Does proximity to forest edge impact wheat productivity in smallholder farms?
Second, we also explored whether forest proximity affects sub-field-level wheat productivity using remotely sensed vegetation indices (VIs). A vegetation index is a simple empirical index derived from two (or more) spectral responses, which can be used as a surrogate of vegetation conditions such as plant health and vigor. Agricultural productivity can be estimated in this way because higher productivity and healthier crops are often associated with higher VIs (Hatfield, 1983; Doraiswamy et al., 2004; Ferencz et al., 2004; Burke and Lobell, 2017; Jin et al., 2017). Because certain VIs exhibit higher correlations with crop status, we assessed and compared several VIs. Using VIs we examined how agricultural productivity is affected by forest edges. We hypothesized that VI will be highest in sections of the field closest to forests due to potential benefits from forest edges. Understanding this relationship as well as how the configuration of landscape mosaics affects crop productivity is key to improving food security by helping farmers better optimize agricultural productivity at the landscape level.
Materials and Methods
To answer these questions, we used a suite of field-based assessments and high spatial resolution imagery from the Sentinel-2 and RapidEye satellites. We first classified the landscape into general land cover types and then distinguished two major crop types (wheat and maize) using ground verification. After isolating fields of wheat adjacent to forest patches, we analyzed wheat productivity at different distances from forest patches using a suite of vegetation indices. Next, we explain each of these steps in more detail.
Study Region
The 50 km2 study region is south of the capital city of Addis Ababa, Ethiopia, within the Arsi-Negele woreda (district) of the Oromia Region and situated 40 km northeast of the city of Awassa (Figure 1). The study region has a prominent forest-agricultural gradient, which provides a large sample of fields of varying proximity to forest. Bordered by the state forest of Munesa to the east and the town of Arsi-Negele to the west, forest patches as well as individual trees become larger and more abundant moving eastward (Baudron et al., 2017). The main crops grown in the area are wheat, potato, and maize, often integrated with livestock as part of a mixed farming system (Baudron et al., 2017). The main tree species in the forested areas are Podocarpus falcatus, Eucalyptus sp., Croton sp., Pinus patula, and Prunus Africana (Baudron et al., 2019).
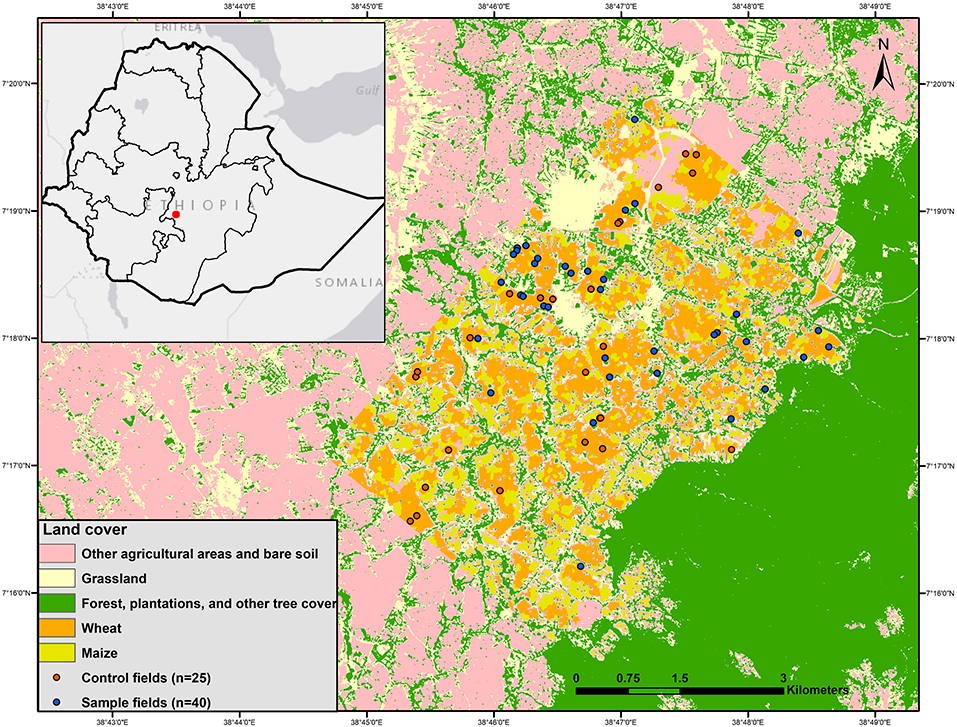
Figure 1. Map of land cover classification in Arsi-Negele, Oromia, Ethiopia. Land cover is classified from 5 m RapidEye imagery (“Forests, plantations, and tree cover,” “Grassland,” and “Other agricultural areas and bare soils”) and from 10 m Sentinel-2 imagery (“Wheat” and “Maize”). Sample and control fields from the landscape are also shown as points (color).
The site is situated within the oceanic climate (Cfb) zone (Kottek et al., 2006). The Degaga weather station (~20 km north from the study region) reports a mean annual rainfall of 1,075 mm (18-year mean) and a mean annual temperature of 15°C (16-year mean) (Halle-Wittenberg University, 2002). A bimodal rainfall pattern produces a shorter rainy season from March to May and a longer rainy season from July to September. As such, the growing season encompasses two distinct periods impacted by these two rainy seasons. During the shorter rains, land is either fallowed or used to grow potato. During the longer rains, wheat is generally planted following either the fallow or potato crop. Additionally, maize is planted at the beginning of the shorter rains and harvested at the end of the longer rains.
Image Classification
To answer our first research question, we classified high spatial resolution RapidEye imagery into general land cover classes and then used Sentinel-2 imagery to further differentiate crop types within agriculture.
RapidEye 2015 Classification
To classify general land cover, we acquired orthorectified RapidEye 3A imagery (5 m resolution) from January 3rd, 2015. Orthorectification of Rapideye imagery is based on ground control points and digital elevation models, and has an accuracy of 10 m RMSE (root mean square error). The post-harvest dry season (December-February) was selected to enable optimal differentiation between classes using seasonal phenology of vegetation. We performed a maximum likelihood supervised classification to distinguish among three broad land cover classes: (1) forests, (2) grassland (which included pastures, meadows, and floodplains), and (3) agricultural fields and/or bare soil. Around 200 training sites (to train the classification algorithm) were visually delineated from the RapidEye imagery using Google Earth imagery (from January 24th 2014). The minimum mapping unit for forests was 125 m2 (i.e., five RapidEye pixels) which helped minimize the effects of misclassification by ensuring single trees and extremely small forest patches were carefully delineated/excluded from the RapidEye classification.
Sentinel 2016 Classification
Orthorectified (surface reflectance based) Sentinel-2 2A imagery (10 m resolution) from December 31st 2016 was used to further separate the agricultural land into two classes, wheat and maize, using ENVI 5.4. Imagery from the post-harvest period (i.e., December–February) was particularly useful in differentiating wheat and maize. From this imagery, we performed an object-based classification to group homogenous pixels into spectrally similar clusters (similar to patches). First, within the areas corresponding to the agricultural areas of the RapidEye imagery, the Sentinel-2 imagery was segmented into clusters of pixels with homogenous characteristics. This procedure used the “edge” and “full lambda schedule” merge algorithms. The levels of edge and merge were set at 50 and 80, respectively, to enable segmentation of clusters approximating average field sizes in the region (~0.3 ha).
Second, classification of clusters was based primarily on their spectral characteristics. The selected image date optimally differentiated the two crops because of the distinct bright signature of straw residue left behind on wheat fields immediately after harvest. In contrast, post-harvest maize fields were differentiable by their darker spectral signature associated with bare soil (because maize crop residues are typically removed and used as livestock feed). Training data for the classification was selected from the Sentinel-2 imagery guided by these spectral distinctions.
Ground Verification
An accuracy assessment was performed on both the RapidEye 2015 classification and the Sentinel-2 2016 classification. Seventy-one randomly selected ground verification points collected via field work in April 2015 were used to assess the RapidEye classification. Additionally, 25 photos of fields with identifiable crop residue were taken in February 2017 and used as ground verification points for the Sentinel-2 classification. We created a confusion matrix to evaluate the producer's, user's, and overall accuracy, as well as the Kappa coefficient. User's accuracy helps identify over-mapping of a class, as user's accuracy is inversely proportional to errors of commission. Producer's accuracy is inversely related to errors of omission (or exclusion), indicating a given class was missed and erroneously mapped as another class (Congalton and Green, 2008). The kappa statistic is a measure of the quality of the classification relative to assignment of classes by random chance (Congalton and Green, 2008).
Forest Edge Yield Relationships Using Vegetation Indices
To answer the second question, we conducted a proximity analysis using the results of the classified wheat map and then derived a suite of vegetation indices from Sentinel-2 imagery from October 31st, 2016 just prior to harvest. We evaluated three VIs for comparative purposes: modified soil-adjusted vegetation index 2 (MSAVI2), normalized vegetation index (NDVI), and green chlorophyll vegetation index (GCVI) (detailed in Table 1). NDVI is a simple indicator calculated using the red and infrared bands and was selected due to its widespread use among various scientific and natural resource applications (Xue and Su, 2017). However, as NDVI products have been shown to produce incorrect results when it comes to landscapes with exposed soil, MSAVI2 was included to minimize the impact of bare soil on canopy reflectance in a way that differs from other soil-adjusted indices by quantitatively streamlining the soil brightness correction (Qi et al., 1994). Lastly, we included GCVI, a VI utilizing green reflectance, which is more responsive to leaf chlorophyll than the more oft-used red reflectance. Leaf chlorophyll is a photosynthetic pigment in plants that correlates with nitrogen levels (Shangguan et al., 2000; Cartelat et al., 2005). As a result of this link with plant nutrient deficiency, GCVI is potentially more highly correlated with yield (Burke and Lobell, 2017).
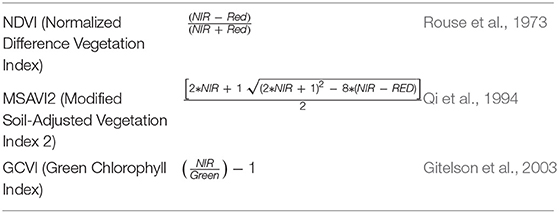
Table 1. Mathematical formulas and references for the three vegetation indices used in this study.
Taking advantage of a newly available dataset which wasn't originally available during the start of the project, we compared wheat yield values of 11 fields to these three VIs in order to confirm the VI-yield relationship assumption underlying this work. Wheat yields (for the 2014 growing season) came from farm surveys and were calculated by dividing the quantity of grain harvested from the field as recalled by the farmer by the field area measured with a GPS (Wood and Baudron, 2018). These yield values were then compared to VI values derived from RapidEye imagery (October 26th 2014) at identical locations.
Statistical Analysis
To examine patterns of wheat productivity, we compared VIs within sub-sections of wheat fields, where sections of the field were located at different distances from forest. To do so, we first delineated boundaries of all individual wheat fields (using the above classification). From these, potential “treatment” fields were identified as those adjacent to a forest patch (using a minimum forest patch width and length of 20 and 80 m, respectively). From these fields, 40 fields were randomly selected and further partitioned into “treatments” based on distance from forest edge: 10–30, 31–40, 51–70, 71–90 m. Additionally, we left a 10 m gap between the first distance class (10–30 m) and the forest edge to minimize potential “mixed-pixel” problems (i.e., tree crowns overlapping into the first distance class). Lastly, we randomly selected another 25 fields which were more than 200 m from any forest patch to serve as “control” fields which required some important assumptions. A distance of 200 m was chosen because it is far enough away that microclimatic effects from forest edges would be negligible (Davies-Colley et al., 2000), however, ecosystem services such as pollination and pest control could extend more than 200 m from forests (Chacoff et al., 2008; Ricci et al., 2009; Bailey et al., 2014). Further, the general configuration and interspersion of forests in the study area did not allow for creation of a sufficient number of controls at distances any further than 200 m. At the pixel level, we compared VIs among distance classes using a linear model. Additionally, we conducted post-hoc pairwise comparisons using Tukey's range tests. Each distance class within each field had various replicates (pixels), with a total of 2,431 pixels in treatment fields and 1,611 in control fields. Lastly, to evaluate the underlying assumed relationship between VI and wheat yield, we conducted a simple linear regression between ground verified wheat yields in 11 fields to VIs from 2014 imagery.
Results
High Spatial Resolution Remote Sensing Can Distinguish Wheat and Maize Fields and Estimate Wheat Productivity on Smallholder Farms
The RapidEye image was classified into three broad classes (forest and tree cover, grasslands, and agricultural areas and bare soils) (Figure 1). Overall accuracy of the RapidEye classification was 96%, with a kappa statistic of 0.83 (Table 2). Both the producer's and user's accuracy ranged from 94 to 100%. The two land cover classes of most importance to our analysis, forest and agriculture, had high user's and producer's accuracies.
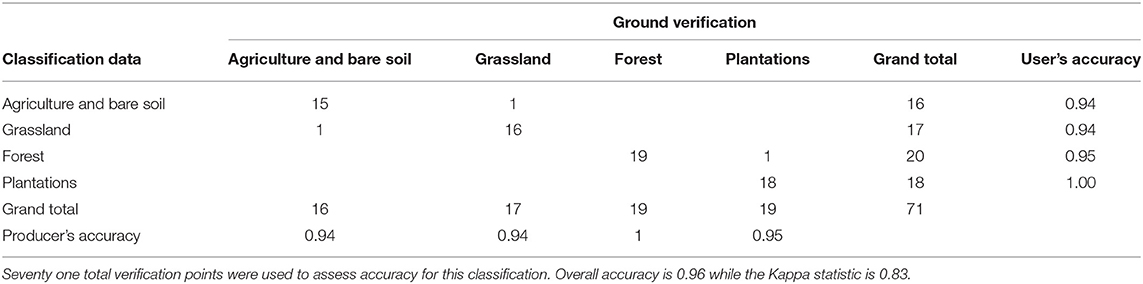
Table 2. Raw tally confusion matrix of land cover and accuracies of the RapidEye (January 3rd 2015) classification.
A subset of RapidEye-derived agriculture class was then classified into wheat and maize using Sentinel-2 imagery (Figure 1). The mapped extent of wheat was 1,806 ha whereas the total extent of maize was 1,835 ha. Overall accuracy, based on 25 ground verification points, was 91% (Table 3). Per class user's accuracies for wheat and maize was 87 and 100%, respectively, and producer's accuracy was 100 and 83%, respectively.
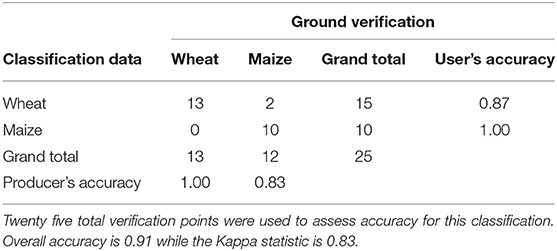
Table 3. Raw tally confusion matrix of land cover and accuracies of the Sentinel-2 (December 30th 2016) classification.
Through a simple linear regression analysis we found a moderately strong, positive relationship between NDVI and yield (R2 = 0.3675) (Figure 2).
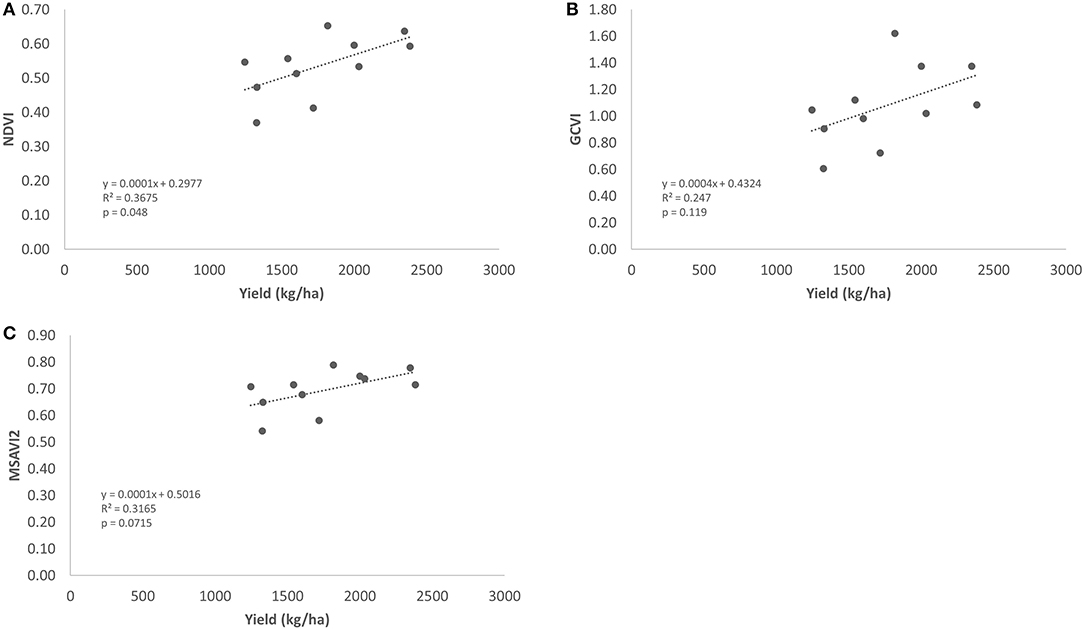
Figure 2. Scatterplots for NDVI (A), GCVI (B), and MSAVI2 (C) showing the relationship between the VIs and yield for n = 11 fields in the study site.
Closer Proximity to Forest Edges Increases Indices of Wheat Productivity in Smallholder Farms
VI values throughout all fields ranged from 0.55–0.78 for MSAVI, 0.52–0.81 for NDVI, and 1.14–3.25 for GCVI. Generally, VIs decreased with distance from forest edge. Mean VI values were highest at the 10–30 m distance class and generally decreased with increasing distance from the forest (Table 4, Figure 3). Mean VI at 10–30 m was significantly higher than at 31–50 m, 51–70 m, and 71–90 m (Table 4). However, the latter three distance classes were generally not significantly different from one another with a few exceptions (Table 5, Figure 3). Mean VI values of all distance classes were generally higher than control fields located >200 m away from forest edges (Table 4). Only the first distance class (10–30 m) was statistically significantly different from the controls (p ≤ 0.0001) for all three VIs, while the second distance class was significantly different from the control for GCVI and MSAVI2 (Table 5).
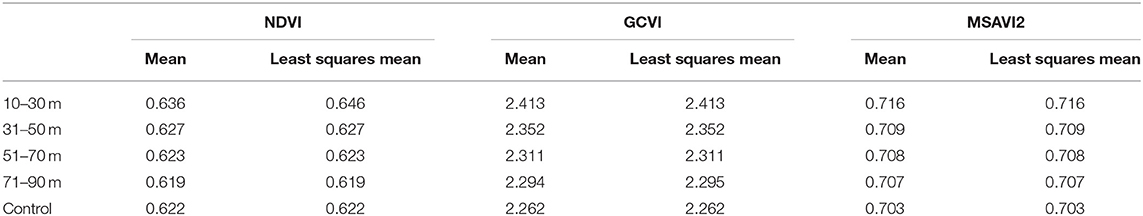
Table 4. Mean and LS means across all distance classes and control for all three VIs.
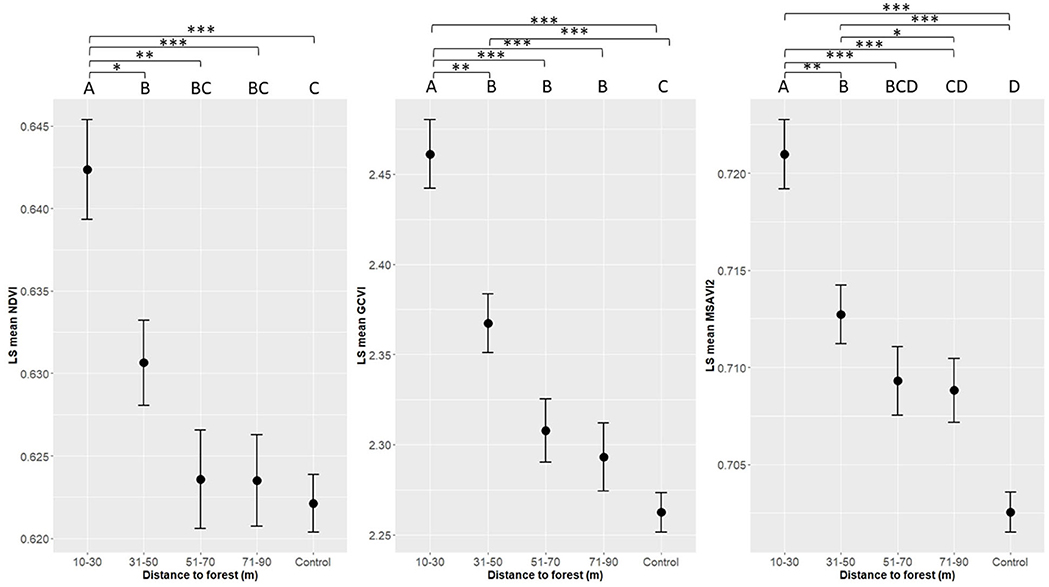
Figure 3. Plot of least squares mean for NDVI, GCVI, and MSAVI in wheat fields at distances of 10–30, 31–40, 51–70, 71–90 m, and control. Derived from linear model least squares means. Error bars denote standard error. n = 40 for all distance classes, n = 25 for control. *P ≤ 0.05, **P ≤ 0.01, ***P ≤ 0.001.
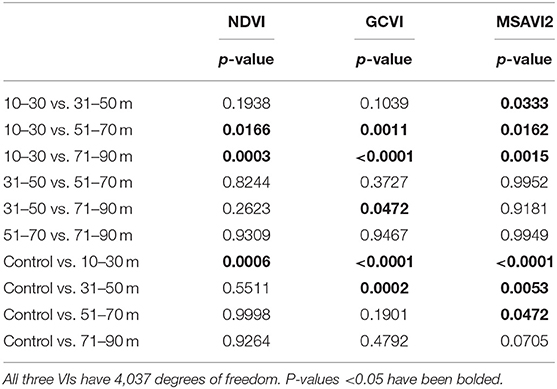
Table 5. P-values resulting from Tukey's range test between the distances classes from linear mixed effect models for each vegetation index.
Discussion
Forest restoration is receiving renewed attention globally and particularly in Ethiopia Chazdon, 2008; Pistorius et al., 2017. Thus, clarifying the relationship between forests and crop productivity could aid forest restoration as well as forest conservation planning. By providing guidance for how to optimize landscape features to provide multiple benefits, it is conceivable that multiple stakeholders, from subsistence smallholder farmers to governments planning carbon sequestration programs could benefit. Our research estimated agricultural productivity using a suite of vegetation indices (VIs) derived from remote sensing of wheat and maize fields within a forest mosaic. We found that wheat fields could be well-discriminated from other crop types (i.e., maize) and that forests were associated with higher wheat yields, with some caveats.
Successful Mapping of Crop Types and Productivity Using High Resolution Remote Sensing on Smallholder Farms
We were able to successfully distinguish between two crops using high spatial resolution imagery with classification rules based on seasonal harvest patterns. Overall, user's, and producer's accuracies for both the RapidEye and Sentinel-2 classification were all high (exceeding 85% in most cases). Additionally, specific classes of interest (forest, agriculture, and wheat in particular) were mapped with a high degree of accuracy. Arguably, some of the success in achieving high accuracies is attributable to implementation of a classification scheme with few classes (Olofsson et al., 2014). However, we also captured and incorporated land use practices (fallows and crop residues) in a novel way in heterogeneous smallholder farms. The use of post-harvest field phenology for crop identification (light vs. dark spectral signatures for wheat and maize, respectively) uniquely and effectively differentiated between these two crop types. This approach was both simple and cost-effective in that it only required one image from a post-harvest date. However, our approach greatly benefitted from familiarity with local farming practices, on-the-ground local knowledge, and fortuitous spectral differences in residual post-harvest agricultural biomass.
Crop identification using remote sensing is often complex, especially in small heterogeneous farms. Crop identification often uses coarse spatial resolution image time series over large fields, often on large commercial farms. For example, a “crop proportion phenology index” was created from a MODIS (250 m) image time series to estimate wheat productivity in China (Pan et al., 2012). A harmonic analysis on time-series data from National Oceanic Atmospheric Administration's (NOAA) advanced very high resolution radiometer (AVHRR) (1.1 km) was used to estimate maize, soybean and alfalfa in the USA (Jakubauskas et al., 2003) and MODIS-EVI time series was used to identify rice paddies in Japan (Sakamoto et al., 2013). While these studies aid in crop monitoring of large fields, the same geodata and methods are unlikely to be successful on smallholder fields (for example, a 2 ha farm is roughly 200 by 100 m).
Due to its increasing availability, the use of higher spatial resolution imagery for crop identification has expanded. For example, in India, sugarcane, ragi, paddy, and mulberry were distinguished using Quickbird imagery (2.4 m) with high overall accuracies (87–98%) (Senthilnath et al., 2008). Cotton, winter wheat, and rice were identified in Uzbekistan using a combination of imagery from the Satellite Pour l'Observation de la Terre (SPOT) (2.5–5 m) and advanced spaceborne thermal emission and reflection radiometer (ASTER) (15–30 m) satellites with an overall accuracy of 80% (Conrad et al., 2010). With improved access to higher resolution imagery, remote crop identification for smallholder farms is becoming increasingly feasible. Notably, imagery at these higher spatial resolutions is also capable of characterizing detailed off-farm features important to smallholder food security and health, including forests and scattered trees (Immitzer et al., 2012), and small water resources (Sawaya et al., 2003).
Relating Agricultural Yields to Vegetation Indices (VIs)
While this study does not directly estimate yield, we considered VIs to be a useful proxy for productivity due to the abundant literature supporting a strong correlation between the two along with our ground verification in 11 fields. Higher vegetation productivity is often indicative of greater yields as strong linear relationships exist between VIs and crop yield (Hatfield, 1983; Doraiswamy et al., 2004; Ferencz et al., 2004; Burke and Lobell, 2017; Jin et al., 2017). Despite the influence of additional factors on yield (such as temperature, precipitation, soil properties, and fertilizer inputs), this linear relationship is often used to directly estimate yields using simple linear regression. For example, maize and soybean yields were estimated in Iowa using NDVI (at 8 km resolution from the AVHRR), achieving model R2 of 0.78 and 0.86, respectively (Prasad et al., 2006). In Shandong, China, winter wheat yields were also estimated using MODIS-derived NDVI with similar levels of agreement (R2 = 0.66–0.87) (Ren et al., 2008). Successful mapping of yields on broad-scale commercial farms using VIs derived from low-resolution imagery has been common over the past decade.
More recently there have been increasing efforts to map and estimate crop yield using high resolution imagery on smaller farms, oftentimes in developing countries. In Kenya, yield from smallholder farms was estimated from GCVI derived from Terra Bella imagery (1 m resolution) (Burke and Lobell, 2017). Empirical estimation of yields using VIs and ground measurements was compared to a model comparing VI and simulations from APSIM (Agricultural Production Systems Simulator) with reasonable agreement (R2 = 0.4) (Burke and Lobell, 2017). Furthermore, of all the VIs assessed (EVI, NDVI, and GCVI) in the study, GCVI consistently showed the best results in terms of agreement with ground-measured yields (Burke and Lobell, 2017). Similar methods replicated in Zambia and India achieved successful results (Jain et al., 2016; Azzari et al., 2017).
Using a limited dataset from our study area we also tested the relationship between VI and wheat yield, and found a significant relationship between wheat yield and NDVI (R2 = 0.3675, p = 0.048). Our methods constitute a reliable way of estimating relative productivity throughout a landscape, but further work would benefit from exploring yield estimates using APSIM simulations calibrated with detailed soil and weather data and/or additional field verification.
Effects of Proximity to Forests on Wheat Yields
Our proximity analysis detected an increase in VI in field margins situated closest to forests. Regardless of the specific VI used, mean/median VIs were generally higher in areas of the fields nearer to than further from forests. Considering the range and equation for NDVI and MSAVI2 for example (Figure 3); an increase of 0.01 in VI (half of the difference seen between the first distance class and control) would equate to around a 3–5% increase in productivity. For context, yield increases of 2–14.5% occurred with the addition of fertilizer in two trials in Argentina and the USA (Díaz-Zorita et al., 2004; Freeman et al., 2006).
While trees and forests within agroforestry systems will compete with crops for sunlight, water, and nutrients, they could also provide many positive benefits as well. Trees from agroforestry systems have been shown to reduce runoff and soil evaporation (Kinama et al., 2005) as well as increase soil fertility and create beneficial microclimatic effects (Mbow et al., 2014). In Central Ethiopia, ~200 km north of our study area, grain yield and aboveground biomass of wheat increased under the canopy of F. albida (Sida et al., 2018a). In this case, temperature regulation helped mitigate heat stress, promote higher water use efficiency, and increased soil mineral nitrogen, resulting in higher wheat yields aided by F. albida (Sida et al., 2018a).
With few exceptions, there has been little research on staple food crops demonstrating positive impacts of forests on yields. More commonly reported are instances where trees and forests negatively impact staple crop yields. For maize and soybean in Canada, net assimilation and photosynthetic radiation (PAR) (both highly correlated with crop yield), decreased within 2 m of intercropped trees (Reynolds et al., 2007). Similarly, wheat yield has generally been found to decrease with proximity to trees or forest in several other locations (Akbar et al., 1990; Puri and Bangarwa, 1992; Khan and Ehrenreich, 1994; Reynolds et al., 2007; Schmidt et al., 2019). However, it is ultimately external geographic, biological, or other environmental factors that determine whether trees and forest positively or negatively impact wheat. For example, extreme heat stress has been shown to drastically decrease wheat yield (Farooq et al., 2011; Lobell et al., 2012), leading to instances where wheat yield is higher in areas that are shaded and have lower temperatures (Sida et al., 2018b).
Our results showing higher VI (a proxy for yield) in close proximity to the forest edge is especially interesting because the relationship between proximity to forest patches and wheat productivity can have important implications on desirable landscape configuration and food security in the region. Although the results of competition and facilitation between forests and agriculture may be mixed, our results are suggestive of some potential benefits which may counteract nutrient, light, and water competition from trees and forests. Although our study does not isolate the exact mechanisms behind this increase in productivity, it is likely that microclimatic effects (such as those demonstrated with F. albida) play a part (Laike, 1991; Sida et al., 2018a). If trees and forests can provide beneficial microclimatic buffering impacts, this could aid climate change mitigation strategies. Nonetheless, it is important to note that this benefit may change depending on geographic and biologically-dependent factors.
Limitations and Additional Future Research
Despite the high spatial resolution (5 and 10 m) of our imagery, our vegetation indices and resulting proximity analysis could have been unduly affected by mixed signals from nearby forests. Pixels at the margin of wheat fields (and thus closest to forest) could be impacted by spectral signatures of nearby trees and forests which would artificially inflate measured VI values. However, we took several measures to lessen this problem. Our VI values were derived from a coarser resolution Sentinel-2 (10 m) imagery while the classification of forests utilized finer resolution RapidEye (5 m) imagery. While this was originally done due to a lack of RapidEye availability during a specific time, when incorporated into the proximity analysis, this approach helped ensure that no wheat pixels located near the forest edge consisted of mixed forest pixels. Finally, we also tried to mitigate this problem within our sampling design by leaving a 10 m gap between the forest edge and first distance class (10–30 m) for our statistical comparisons.
Our study was also limited by a lack of image availability. High cloud cover during the rainy seasons and high commercial demand elsewhere (which translates to less archived imagery of the region) prevented the capture and archival of RapidEye images during several relevant time periods in the study area. A lack of imagery during pre-harvest season was one reason the land cover classification used to characterize the fields was from a different year and source (2015, RadpidEye) than the image used to derive the VIs (2016, Sentinel-2). Additionally, the only cloud-free image available during the pre-harvest period in 2014 was for October 26th. Because many fields were already harvested before this date, only 11 out of the 23 fields were able to be analyzed to determine the VI-yield relationship.
The landscape configuration of our study area also created a limitation in the sampling design. In selecting the sample fields we made sure that a given treatment distance class was sufficiently far away from any surrounding non-treatment forests edges (at least 80 m). However, because average field size in the region was small (0.3 ha) and hedgerows were abundantly scattered throughout the landscape it was hard to find sample fields big enough where the distance classes were also 80 m away from edges of other fields. Therefore, our study did not account for non-forest field edges.
Two lines of future research are deemed particularly important to support and extend our research findings. First, we propose additional field work to conduct crop cuts to validate the edge effects on wheat productivity, along with exploring the potential mechanisms behind such edge effects (e.g., shade vs. nitrogen-fixing hedgerows). Second, we modeled different landscape configurations of forests and fields to explore regional landscape scenarios which maximize benefits to farmers (Yang et al., 2020).
Conclusions
Improving food security throughout the developing world remains one of humanity's greatest challenges in the twenty first century. Of the many different facets affecting this complex problem, the first part of our research improves regional scale crop yield monitoring in smallholder farms. By analyzing VIs from accessible, low cost, high spatial resolution satellite imagery, we provide an alternative to conventional on-site field monitoring of crops on smallholder farms. With increasing availability of high and very high resolution data (e.g., Skysat, Pléiades, Worldview-3, etc.), it will be increasingly feasible to assess not only crop health but other variables affecting yields such as forests and forest edges.
The second half of this research investigated wheat productivity as it relates to nearby forest patches in Southern Ethiopia. VIs in wheat fields were significantly higher in field margins closer to forests. Although the exact mechanisms behind such VI increases is unknown, it is possible that microclimatic effects are a contributing factor. Both the grain filling and antithesis development stages of wheat are significantly affected by water availability and temperature (Fischer et al., 1998; Gooding et al., 2003). Heat stress, and potentially a lack of water availability via drought, are factors that could be mitigated by the effects of forests. With temperatures projected to increase significantly in the Central Rift Valley, adoption of agroforestry based practices or landscape approaches, including the retention of forest patches could mitigate some of the effects of climate change.
In addition, future climatic changes are likely to impact food security in many regions (Schmidhuber and Tubiello, 2007; Wheeler and von Braun, 2013). Higher temperatures and lower water availability could have severe impacts on crops such as wheat (Intergovernmental Panel on Climate Change, 2014). In fact, global wheat production is projected to decline significantly under current IPCC scenarios as a result of heat stress and drought (Parry et al., 2004; Lobell et al., 2011; Semenov and Shewry, 2011). Forests have been shown to create microclimates that alleviate extreme heat and help retain soil moisture (Camargo and Kapos, 1995; Gehlhausen et al., 2000; Chen et al., 2010). If forests can provide beneficial microclimatic conditions, our research adds to the growing body of literature suggesting positive edge effects from forests despite some known potential negative effects.
Data Availability Statement
The datasets generated for this study are available on request to the corresponding author.
Author Contributions
FB conceived of the initial hypotheses and assisted with statistical analyses. KY wrote the manuscript and conducted the analyses. SG guided the methods and study design. J-YD-C was responsible for ground data collection and field-size mapping. All authors contributed to editing the manuscript and providing feedback that shaped the research, analysis, and interpretation.
Funding
This study was conducted with funding from CRP WHEAT (www.wheat.org; C4032 Maize S12 Systems Intensification–CIMMYT subgrant, FB and SG) and NSERC–Discovery Grant (2014-05012, SG).
Conflict of Interest
The authors declare that the research was conducted in the absence of any commercial or financial relationships that could be construed as a potential conflict of interest.
Acknowledgments
This work was implemented by UBC and CIMMYT thanks to the support of CRP WHEAT (www.wheat.org). Any opinions, findings, conclusion, or recommendations expressed in this publication are those of the authors and do not necessarily reflect the view of CRP WHEAT. We would like to thank Dr. Nicholas Coops and Dr. Sean Smukler for their feedback and advice. We would also like to thank Kedir Gemedo for supporting data collection.
References
Akbar, G., Ahmad, M., Rafique, S., and Babar, K. N. (1990). Effect of trees on the yield of wheat crop. Agrofor. Syst. 11, 1–10. doi: 10.1007/BF00122808
Azzari, G., Jain, M., and Lobell, D. B. (2017). Towards fine resolution global maps of crop yields: testing multiple methods and satellites in three countries. Remote Sens. Environ. 202, 129–141. doi: 10.1016/j.rse.2017.04.014
Bailey, S., Requier, F., Roberts, S. P. M., Potts, S. G., and Bouget, C. (2014). Distance from forest edge affects bee pollinators in oilseed rape fields. Ecol. Evol. 4, 370–380. doi: 10.1002/ece3.924
Baldocchi, D. D. (1994). A comparative study of mass and energy exchange over a closed C3 (wheat) and an open C4 (corn) canopy: II. CO2 exchange and water use efficiency. Agric. For. Meteorol. 67, 291–321. doi: 10.1016/0168-1923(94)90008-6
Baudron, F., Duriaux-Chavarría, J.-Y., Remans, R., Yang, K., and Sunderland, T. (2017). Indirect contributions of forests to dietary diversity in Southern Ethiopia. Ecol. Soc. 22:28. doi: 10.5751/ES-09267-220228
Baudron, F., Schultner, J., Duriaux, J. Y., Gergel, S. E., and Sunderland, T. (2019). Agriculturally productive yet biodiverse: human benefits and conservation values along a forest-agriculture gradient in Southern Ethiopia. Landsc. Ecol. 34, 341–356. doi: 10.1007/s10980-019-00770-6
Bianchi, F. J. J. A., Booij, C. J. H., and Tscharntke, T. (2006). Sustainable pest regulation in agricultural landscapes: a review on landscape composition, biodiversity and natural pest control. Proc. Biol. Sci. 273, 1715–1727. doi: 10.1098/rspb.2006.3530
Bommarco, R., Kleijn, D., and Potts, S. G. (2013). Ecological intensification: harnessing ecosystem services for food security. Trends Ecol. Evol. 28, 230–238. doi: 10.1016/j.tree.2012.10.012
Burke, M., and Lobell, D. B. (2017). Satellite-based assessment of yield variation and its determinants in smallholder African systems. Proc. Natl. Acad. Sci. U.S.A. 114, 2189–2194. doi: 10.1073/pnas.1616919114
Camargo, J. L., and Kapos, V. (1995). Complex edge effects on soil moisture and microclimate in central amazonian forest. J. Trop. Ecol. 11, 205–221. doi: 10.1017/S026646740000866X
Cannell, M., Van Noordwijk, M., and Ong, C. K. (1996). The central agroforestry hypothesis: the trees must acquire resources that the crop would not otherwise acquire. Agrofor. Syst. 34, 27–31. doi: 10.1007/BF00129630
Cartelat, A., Cerovic, Z. G., Goulas, Y., Meyer, S., Lelarge, C., Prioul, J. L., et al. (2005). Optically assessed contents of leaf polyphenolics and chlorophyll as indicators of nitrogen deficiency in wheat (Triticum aestivum L.). Field Crop. Res. 91, 35–49. doi: 10.1016/j.fcr.2004.05.002
Chacoff, N. P., Aizen, M. A., and Aschero, V. (2008). Proximity to forest edge does not affect crop production despite pollen limitation. Proc. R. Soc. B 275, 907–913. doi: 10.1098/rspb.2007.1547
Chazdon, R. L. (2008). Beyond deforestation: restoring forests and ecosystem services on degraded lands. Science 320, 1458–1460. doi: 10.1126/science.1155365
Chen, J., Saunders, S. C., Crow, T. R., Naiman, R. J., Kimberley, D., Mroz, G. D., et al. (2010). Microclimate in forest microclimate and ecosystem ecology landscape the effects of different management regimes. BioScience 49, 288–297. doi: 10.2307/1313612
Congalton, R. G., and Green, K. (2008). Assessing the Accuracy of Remotely Sensed Data: Principles and Practices. Boca Raton, FL: CRC press. doi: 10.1201/9781420055139
Conrad, C., Fritsch, S., Zeidler, J., Rücker, G., and Dech, S. (2010). Per-field irrigated crop classification in arid Central Asia using SPOT and ASTER data. Remote Sens. 2, 1035–1056. doi: 10.3390/rs2041035
Davies-Colley, R. J., Payne, G. W., and van Elswijk, M. (2000). Microforest gradients across a forest edge. New Z. J. Ecol. 24, 111–121.
Díaz-Zorita, M., Duarte, G. A., and Barraco, M. (2004). Effects of chloride fertilization on wheat (Triticum aestivum L.) productivity in the sandy Pampas region, Argentina. Agron. J. 96, 839–844. doi: 10.2134/agronj2004.0839
Dix, M. E., Johnson, R. J., Harrell, M. O., Case, R. M., Wright, R. J., Hodges, L., et al. (1995). Influences of trees on abundance of natural enemies of insect pests: a review. Agrofor. Syst. 29, 303–311. doi: 10.1007/BF00704876
Doraiswamy, P. C., Hatfield, J. L., Jackson, T. J., Akhmedov, B., Prueger, J., and Stern, A. (2004). Crop condition and yield simulations using landsat and MODIS. Remote Sens. Environ. 92, 548–559. doi: 10.1016/j.rse.2004.05.017
FAO (2018). The State of Food Security and Nutrition in the World 2018, Building Climate Resilience for Food Security and Nutrition. Rome: FAO.
FAO IFAD, and WFP. (2015). The State of Food Insecurity in the World: Meeting the 2015 International Hunger Targets: Taking Stock of Uneven Progress. Rome: FAO, IFAD and WFP.
Farooq, M., Bramley, H., Palta, J. A., and Siddique, K. H. (2011). Heat stress in wheat during reproductive and grain-filling phases. Crit. Rev. Plant Sci. 30, 491–507. doi: 10.1080/07352689.2011.615687
Ferencz, C., Bognár, P., Lichtenberger, J., Hamar, D., Tarcsai, G., Timár, G., et al. (2004). Crop yield estimation by satellite remote sensing. Int. J. Remote Sens. 25, 4113–4149. doi: 10.1080/01431160410001698870
Fischer, R. A., Rees, D., Saire, K. D., Lu, Z. M., Condon, A. G., and Larque Saavedra, A. (1998). Wheat yield associated with higher stomatal conductance and photosynthetic rate, and cooler canopies. Crop Sci. 38, 1467–1475. doi: 10.2135/cropsci1998.0011183X003800060011x
Freeman, K., Girma, K., Mosali, J., Teal, R., Martin, K., and Raun, W. (2006). Response of winter wheat to chloride fertilization in sandy loam soils. Commun. Soil Sci. Plant Anal. 37, 1947–1955. doi: 10.1080/00103620600767231
Garibaldi, L. A., Steffan-Dewenter, I., Winfree, R., Aizen, M. A., Bommarco, R., Cunningham, S. A., et al. (2013). Wild pollinators enhance fruit set of crops regardless of honey bee abundance. Science 340, 1608–1611. doi: 10.1126/science.1230200
Gehlhausen, S. M., Schwartz, M. W., and Augspurger, C. K. (2000). Vegetation and microclimatic edge effects in two mixed-mesophytic forest fragments. Plant Ecol. 147, 21–35. doi: 10.1023/A:1009846507652
Gelaw, A., Singh, B. R., and Lal, R. (2014). Soil organic carbon and total nitrogen stocks under different land uses in a semi-arid watershed in Tigray, Northern Ethiopia. Agric. Ecosyst. Environ. 188, 256–263. doi: 10.1016/j.agee.2014.02.035
Giller, K. (2001). Nitrogen Fixation in Tropical Cropping Systems. New York, NY: CABI. doi: 10.1079/9780851994178.0000
Gitelson, A. A., Gritz, Y., and Merzlyak, M. N. (2003). Relationships between leaf chlorophyll content and spectral reflectance and algorithms for non-destructive chlorophyll assessment in higher plant leaves. J. Plant Physiol. 160, 271–282. doi: 10.1078/0176-1617-00887
Gooding, M. J., Ellis, R. H., Shewry, P. R., and Schofield, J. D. (2003). Effects of restricted water availability and increased temperature on the grain filling, drying and quality of winter wheat. J. Cereal Sci. 37, 295–309. doi: 10.1006/jcrs.2002.0501
Grassini, P., van Bussel, L. G. J., Van Wart, J., Wolf, J., Claessens, L., Yang, H., et al. (2015). How good is good enough? Data requirements for reliable crop yield simulations and yield-gap analysis. Field Crop. Res. 177, 49–63. doi: 10.1016/j.fcr.2015.03.004
Halle-Wittenberg University (2002). Munessa Forest–Location [WWW Document]. Available online at: http://www.munessa-forest.uni-halle.de/location/ (accessed January 5, 2017).
Hatfield, J. L. (1983). Remote sensing estimators of potential and actual crop yield. Remote Sens. Environ. 13, 301–311. doi: 10.1016/0034-4257(83)90032-9
Immitzer, M., Atzberger, C., and Koukal, T. (2012). Tree species classification with random forest using very high spatial resolution 8-band worldView-2 satellite data. Remote Sens. 4, 2661–2693. doi: 10.3390/rs4092661
IPCC (2014). “Climate change 2014: synthesis report,” in Contribution of Working Groups I, II and III to the Fifth Assessment Report of the Intergovernmental Panel on Climate Change eds Core Writing Team, eds R. K. Pachauri, and L. A. Meyer (Geneva: IPCC), 151.
Jackson, N. A., Wallace, J. S., and Ong, C. K. (2000). Tree pruning as a means of controlling water use in an agroforestry system in Kenya. For. Ecol. Manag. 126, 133–148. doi: 10.1016/S0378-1127(99)00096-1
Jain, M., Srivastava, A., Balwinder-Singh Joon, R. K., McDonald, A., Royal, K., et al. (2016). Mapping smallholder wheat yields and sowing dates using micro-satellite data. Remote Sens. 8:860. doi: 10.3390/rs8100860
Jakubauskas, M. E., Legates, D. R., and Kastens, J. H. (2003). Crop identification using harmonic analysis of time-series AVHRR NDVI data. Comput. Electron. Agric. 37, 127–139. doi: 10.1016/S0168-1699(02)00116-3
Jin, Z., Azzari, G., Burke, M., Aston, S., and Lobell, D. B. (2017). Mapping smallholder yield heterogeneity at multiple scales in Eastern Africa. Remote Sens. 9:931. doi: 10.3390/rs9090931
Khan, G. S., and Ehrenreich, J. H. (1994). Effect of increasing distance from acacia-nilotica trees on wheat yield. Agrofor. Syst. 25, 23–29. doi: 10.1007/BF00705704
Kho, R. M., Yacouba, B., Yayé, M., Katkoré, B., Moussa, A., Iktam, A., et al. (2001). Separating the effects of trees on crops: the case of Faidherbia albida and millet in niger. Agrofor. Syst. 52, 219–238. doi: 10.1023/A:1011820412140
Kinama, J. M., Stigter, C. J., Ong, C. K., and Gichuki, F. N. (2005). Evaporation from soils below sparse crops in contour hedgerow agroforestry in semi-arid Kenya. Agric. For.Meteorol. 130, 149–162. doi: 10.1016/j.agrformet.2005.03.007
Kottek, M., Grieser, J., Beck, C., Rudolf, B., and Rubel, F. (2006). World map of the köppen-geiger climate classification updated. Meteorol. Zeitschrift 15, 259–263. doi: 10.1127/0941-2948/2006/0130
Laike, A. (1991). Faidherbia albida in the traditional farming systems of Central Ethiopia. Int. Crop. Res. Inst. Semi-Arid Trop. Int. Cent. Res. Agrofor. 502, 39–41.
Lobell, D. B., Schlenker, W., and Costa-Roberts, J. (2011). Climate trends and global crop production since 1980. Science 333, 616–620. doi: 10.1126/science.1204531
Lobell, D. B., Sibley, A., and Ortiz-Monasterio, J. I. (2012). Extreme heat effects on wheat senescence in India. Nat. Clim. Change 2, 186–189. doi: 10.1038/nclimate1356
Lowder, S. K., Skoet, J., and Raney, T. (2016). The number, size, and distribution of farms, smallholder farms, and family farms worldwide. World Dev. 87, 16–29. doi: 10.1016/j.worlddev.2015.10.041
Mbow, C., Smith, P., Skole, D., Duguma, L., and Bustamante, M. (2014). Achieving mitigation and adaptation to climate change through sustainable agroforestry practices in Africa. Curr. Opin. Environ. Sustain. 6, 8–14. doi: 10.1016/j.cosust.2013.09.002
Mulla, D. J. (2013). Twenty five years of remote sensing in precision agriculture: key advances and remaining knowledge gaps. Biosyst. Eng. 114, 358–371. doi: 10.1016/j.biosystemseng.2012.08.009
Olofsson, P., Foody, G. M., Herold, M., Stehman, S. V., Woodcock, C. E., and Wulder, M. A. (2014). Good practices for assessing accuracy and estimating area of land change good practices for estimating area and assessing accuracy of land change. Remote Sens. Environ. 148, 42–57. doi: 10.1016/j.rse.2014.02.015
Pan, Y., Li, L., Zhang, J., Liang, S., Zhu, X., and Sulla-Menashe, D. (2012). Winter wheat area estimation from MODIS-EVI time series data using the crop proportion phenology index. Remote Sens. Environ. 119, 232–242. doi: 10.1016/j.rse.2011.10.011
Parry, M. L., Rosenzweig, C., Iglesias, A., Livermore, M., and Fischer, G. (2004). Effects of climate change on global food production under SRES emissions and socio-economic scenarios. Glob. Environ. Chang. 14, 53–67. doi: 10.1016/j.gloenvcha.2003.10.008
Payne, W. A. (2000). Optimizing crop water use in sparse stands of pearl millet. Argon. J. 92, 808–814. doi: 10.2134/agronj2000.925808x
Pinter, P., Zipoli, G., Reginato, R., Jackson, R., Idso, S., and Hohman, J. (1990). Canopy temperature as an indicator of differential water use and yield performance among wheat cultivars. Agric. Water Manag. 18, 35–48. doi: 10.1016/0378-3774(90)90034-V
Pistorius, T., Carodenuto, S., and Wathum, G. (2017). Implementing forest landscape restoration in Ethiopia. Forests 8, 1–19. doi: 10.3390/f8030061
Prasad, A. K., Chai, L., Singh, R. P., and Kafatos, M. (2006). Crop yield estimation model for Iowa using remote sensing and surface parameters. Int. J. Appl. Earth Obs. Geoinf. 8, 26–33. doi: 10.1016/j.jag.2005.06.002
Pu, R., and Landry, S. (2012). A comparative analysis of high spatial resolution IKONOS and worldview-2 imagery for mapping urban tree species. Remote Sens. Environ. 124, 516–533. doi: 10.1016/j.rse.2012.06.011
Puri, S., and Bangarwa, K. S. (1992). Effects of trees on the yield of irrigated wheat crop in semi-arid regions. Agrofor. Syst. 20, 229–241. doi: 10.1007/BF00053141
Qi, J., Chehbouni, A., Huete, A. R., Kerr, Y. H., and Sorooshian, S. (1994). A modified adjusted vegetation index (MSAVI). Remote Sens. Environ. 48, 119–126. doi: 10.1016/0034-4257(94)90134-1
Reed, J., van Vianen, J., Foli, S., Clendenning, J., Yang, K., MacDonald, M., et al. (2017). Trees for life: the ecosystem service contribution of trees to food production and livelihoods in the tropics. For. Policy Econ. 84, 62–71. doi: 10.1016/j.forpol.2017.01.012
Ren, J., Chen, Z., Zhou, Q., and Tang, H. (2008). Regional yield estimation for winter wheat with MODIS-NDVI data in Shandong, China. Int. J. Appl. Earth Obs. Geoinf. 10, 403–413. doi: 10.1016/j.jag.2007.11.003
Reynolds, P. E., Simpson, J. A., Thevathasan, N. V., and Gordon, A. M. (2007). Effects of tree competition on corn and soybean photosynthesis, growth, and yield in a temperate tree-based agroforestry intercropping system in southern Ontario, Canada. Ecol. Eng. 29, 362–371. doi: 10.1016/j.ecoleng.2006.09.024
Ricci, B., Franck, P., Toubon, J. F., Bouvier, J. C., Sauphanor, B., and Lavigne, C. (2009). The influence of landscape on insect pest dynamics: a case study in southeastern France. Landscape Ecol. 24, 337–349. doi: 10.1007/s10980-008-9308-6
Rouse, J. W., Hass, R. H., Schell, J. A., and Deering, D. W. (1973). “Monitoring vegetation systems in the great plains with ERTS,” in Third Earth Resources Technology Satellite Symposium 1 (Washington DC), 309–317.
Sakamoto, T., Gitelson, A. A., and Arkebauer, T. J. (2013). MODIS-based corn grain yield estimation model incorporating crop phenology information. Remote Sens. Environ. 131, 215–231. doi: 10.1016/j.rse.2012.12.017
Sawaya, K. E., Olmanson, L. G., Heinert, N. J., Brezonik, P. L., and Bauer, M. E. (2003). Extending satellite remote sensing to local scales: land and water resource monitoring using high-resolution imagery. Remote Sens. Environ. 88, 144–156. doi: 10.1016/j.rse.2003.04.006
Schmidhuber, J., and Tubiello, F. N. (2007). Global food security under climate change. Proc. Natl. Acad. Sci. U.S.A. 104, 19703–19708. doi: 10.1073/pnas.0701976104
Schmidt, M., Nendel, C., Funk, R., Mitchell, M. G., and Lischeid, G. (2019). Modeling yields response to shading in the field-to-forest transition zones in heterogeneous landscapes. Agriculture 9:6. doi: 10.3390/agriculture9010006
Semenov, M. A., and Shewry, P. R. (2011). Modelling predicts that heat stress, not drought, will increase vulnerability of wheat in Europe. Sci. Rep. 1, 1–5. doi: 10.1038/srep00066
Senthilnath, S. N. O. J., Mudigere, D., and Kumar, M. M. (2008). Crop classification using biologically-inspired techniques with high resolution satellite image. J. Indian Soc. Remote Sens. 36, 175–182. doi: 10.1007/s12524-008-0018-y
Shangguan, Z., Shao, M., and Dyckmans, J. (2000). Effects of nitrogen nutrition and water deficit on net photosynthetic rate and chlorophyll fluorescence in winter wheat. J. Plant Physiol. 156, 46–51. doi: 10.1016/S0176-1617(00)80271-0
Sida, T. S., Baudron, F., Hadgu, K., Derero, A., and Giller, K. E. (2018a). Crop vs. tree: can agronomic management reduce trade-offs in tree-crop interactions? Agric. Ecosyst. Environ. 260, 36–46. doi: 10.1016/j.agee.2018.03.011
Sida, T. S., Baudron, F., Kim, H., and Giller, K. E. (2018b). Climate-smart agroforestry: Faidherbia albida trees buffer wheat against climatic extremes in the Central Rift Valley of Ethiopia. Agric. For. Meteorol. 248, 339–347. doi: 10.1016/j.agrformet.2017.10.013
Streck, N. A. (2005). Climate change and agroecosystems: the effect of elevated atmospheric CO2 and temperature on crop growth, development, and yield. Ciência Rural 35, 730–740. doi: 10.1590/S0103-84782005000300041
Taffesse, A. S., Dorosh, P., and Asrat, S. (2012). “Crop production in Ethiopia: regional patterns and trends,” in Food and Agriculture in Ethiopia: Progress and Policy Challenges eds P. Dorosh and S. Rashid (Philadelphia, PA), 53–82.
Tanner, D. G., and Hulluka, M. (1991). Wheat Research in Ethiopia. Addis Ababa: Institute of Agricultural Research.
UNHCR (2017). The Sustainable Development Goals and Addressing Statelessness [WWW Document]. Available online at: http://www.refworld.org/docid/58b6e3364.html (accessed September 1, 2017).
Wheeler, T., and von Braun, J. (2013). Climate change impacts on global food security. Science 341, 508–513. doi: 10.1126/science.1239402
Wood, S. A., and Baudron, F. (2018). Agriculture, ecosystems and environment soil organic matter underlies crop nutritional quality and productivity in smallholder agriculture. Agric. Ecosyst. Environ. 266, 100–108. doi: 10.1016/j.agee.2018.07.025
Xue, J., and Su, B. (2017). Significant remote sensing vegetation indices: a review of developments and applications. J. Sens. 2017, 1–17. doi: 10.1155/2017/1353691
Yang, K. F., Gergel, S. E., and Baudron, F. (2020). Forest restoration scenarios produce synergies for agricultural production in southern Ethiopia. Agric. Ecosyst. Environ. 295:106888. doi: 10.1016/j.agee.2020.106888
Keywords: forest edge effects, vegetation indices, landscape approach, smallholder agriculture, high spatial resolution imagery, food security, ecosystem services, forest fragmentation
Citation: Yang KF, Gergel SE, Duriaux-Chavarría J-Y and Baudron F (2020) Forest Edges Near Farms Enhance Wheat Productivity Measures: A Test Using High Spatial Resolution Remote Sensing of Smallholder Farms in Southern Ethiopia. Front. Sustain. Food Syst. 4:130. doi: 10.3389/fsufs.2020.00130
Received: 26 June 2019; Accepted: 23 July 2020;
Published: 02 September 2020.
Edited by:
Rebecca Chaplin-Kramer, Stanford University, United StatesReviewed by:
Karl Kunert, University of Pretoria, South AfricaLuis F. Goulao, School of Agriculture, University of Lisbon, Portugal
Copyright © 2020 Yang, Gergel, Duriaux-Chavarría and Baudron. This is an open-access article distributed under the terms of the Creative Commons Attribution License (CC BY). The use, distribution or reproduction in other forums is permitted, provided the original author(s) and the copyright owner(s) are credited and that the original publication in this journal is cited, in accordance with accepted academic practice. No use, distribution or reproduction is permitted which does not comply with these terms.
*Correspondence: Kevin F. Yang, k.yang180@gmail.com