Photometric Redshifts With Machine Learning, Lights and Shadows on a Complex Data Science Use Case
 Massimo Brescia1*
  Stefano Cavuoti1,2*
  Oleksandra Razim2 Valeria Amaro2
  Giuseppe Riccio1 Giuseppe Longo2
- 1INAF Astronomical Observatory of Capodimonte, Naples, Italy
- 2Department of Physics Ettore Pancini, University Federico II, Naples, Italy
The importance of the current role of data-driven science is constantly increasing within Astrophysics, due to the huge amount of multi-wavelength data collected every day, characterized by complex and high-volume information requiring efficient and, as much as possible, automated exploration tools. Furthermore, to accomplish main and legacy science objectives of future or incoming large and deep survey projects, such as James Webb Space Telescope (JWST), James Webb Space Telescope (LSST), and Euclid, a crucial role is played by an accurate estimation of photometric redshifts, whose knowledge would permit the detection and analysis of extended and peculiar sources by disentangling low-z from high-z sources and would contribute to solve the modern cosmological discrepancies. The recent photometric redshift data challenges, organized within several survey projects, like LSST and Euclid, pushed the exploitation of the observed multi-wavelength and multi-dimensional data or ad hoc simulated data to improve and optimize the photometric redshifts prediction and statistical characterization based on both Spectral Energy Distribution (SED) template fitting and machine learning methodologies. They also provided a new impetus in the investigation of hybrid and deep learning techniques, aimed at conjugating the positive peculiarities of different methodologies, thus optimizing the estimation accuracy and maximizing the photometric range coverage, which are particularly important in the high-z regime, where the spectroscopic ground truth is poorly available. In such a context, we summarize what was learned and proposed in more than a decade of research.
1. Introduction
Most open questions in cosmology, such as galaxy formation and evolution, the distribution of dark matter, or the understanding of large-scale structure, rely on an accurate estimate of galaxy distances. In the past, such distances could be obtained only for small samples of objects via the displacement (redshift) of spectral features caused by the cosmological expansion, but the time-consuming and expensive spectroscopy could not be effectively used, either on very faint sources or on large samples of galaxies. This led to the development of alternative techniques, collectively called photometric redshift estimation methods, first proposed by Baum (1962) and better formalized by Butchins (1981) and in the seminal paper of Connolly et al. (1995).
The true turning point, however, came with the era of Sloan Digital Sky Survey (SDSS, York et al., 2000), the first extensive multi-band and spectroscopic native digital survey of the sky. Among many other applications, this survey made the widest astrophysical community able to explore different approaches to the evaluation of galaxy distances. With its enormous success, SDSS also paved the way to present and future survey projects, such as the Dark Energy Survey (DES, The Dark Energy Survey Collaboration, 2005), the Kilo-Degree Survey (KiDS, de Jong et al., 2013), Hyper Suprime-Cam Survey (HSC, Aihara et al., 2018), Vera C. Rubin Observatory Legacy Survey of Space and Time (LSST, LSST Science Collaboration et al., 2009), Euclid (Laureijs et al., 2011), Cosmic Evolution Survey (COSMOS, Scoville et al., 2007), James Webb Space Telescope (JWST, Kauffmann, O. B. et al., 2020), and Roman Space Telescope (Green et al., 2012), all driven by a new reliance on the possibility to pursue precision cosmology by combining high precision and deep photometry for very large samples of galaxies with a largely incomplete spectroscopic knowledge.
The field of photometric redshift (photo-z) estimation benefited from this new wealth of data. The idea behind this line of research is simple: due to the cosmological expansion, the spectrum of a galaxy is stretched toward the red end of the spectrum and, therefore, in a given photometric system, the spectrum of identical galaxies at different distances is weighted differently. In other words: two identical galaxies at different redshifts will have different photometric signatures (magnitudes and colors). In practice, things are not so easy, since the function mapping of a given photometric space into the redshift space z is complex, depending on many factors (such as morphological type, large scale structure, and evolutionary stage) and cannot be uncovered analytically.
In the first approximation, photometric redshift estimation methods can be grouped in two broad branches:
- Spectral Energy Distribution (SED) template fitting methods. The redshift is derived by fitting the observed photometry of a galaxy to a set of templates which can be either observed or derived by averaging the spectra of similar galaxies or computed via synthetic spectroscopy.
- Empirical Methods. This category is characterized by machine learning (ML) or data-driven methods that learn how to map photometric space onto z using, in the case of supervised learning, a-priori knowledge provided by a subsample of objects for which accurate spectroscopic information is available or, alternatively, proceeding to self-organize the photometric information, identifying regions of the parameter space characterized by similarity factors.
In the early 2000, it became apparent that ML-based methods were ideal and promising tools to deal with this kind of problems (Firth et al., 2003; Tagliaferri et al., 2003).
Over the years, the positive aspects and intrinsic limitations, as well as the complementary nature, of both methodological branches were evident, depending on a variety of factors (Salvato et al., 2019). For instance, the coverage and sampling of the observable parameter space, i.e., an N-dimensional space, where each dimension is defined by an observed photometric quantity (either fluxes, magnitudes, or derived colors), the quality of spectroscopic templates, the fraction of peculiar objects, the redshift range, the depth and variety of the photometric information, etc.
In what follows, the discussion is mostly centered on empirical methods, based on ML, by focusing the attention on some aspects of the photometric redshift estimation problem, which seem to be the most relevant.
In the following, all the quantities related to the photometric redshift error measurement (Δz = zphot − zspec) are considered as normalized to (1 + zspec).
This review paper does not claim to be a review on the subject, but rather a synthesis aimed at focusing attention on particular aspects related to the photo-z problem and to the approach based on data-driven methods, which we faced over the years. Aspects that are primarily related to some crucial problems, still open, by highlighting the state of the art of the proposed solutions, both in terms of benefits and critical points. Therefore, this review is primarily aimed at astrophysicists, already familiar with data science techniques (typically astroinformaticians), who are interested in the problem of prediction and estimation of photometric redshifts with ML methodologies. Of course, with the ultimate aim of improving the quality of the photo-z estimation in view of their better scientific exploitation in large astronomical survey projects.
1.1. Outline
Section 2 illustrates how ML is involved in photo-z estimation and its relevant aspects in this field. In section 3, the critical role of the parameter space and the selection of the features is discussed, while, in section 4, we have drawn some conclusions, projected on next future perspectives.
2. The Leverage of ML on Photo-z Estimation
In order to be useful, photometric redshifts need to meet strict requirements dictated by the specific application in mind. For example, in the tomographic photo-z bins, the estimation error of the true average redshift is required to be less than ~0.002, with a very low outlier rate, in order to be suitable for cosmic shear estimations (Knox et al., 2006; Pasquet et al., 2019). For the LSST survey project, a series of scientific requirements is envisaged, aimed at avoiding the domination of the statistical background noise of the cosmological sample by any systematics, in the estimation of the photometric redshifts of several billion galaxies. In this respect, the requirements specify that the photometric redshift of any individual galaxy should have a bias below 0.003, an estimation error σz < 0.02, and a 3σ outlier rate below 10% (Schmidt et al., 2020).
Furthermore, in the case of gravitational lensing, i.e., the image distortion of background galaxies due to the differential deflection of their light, caused by the masses of foreground sources, and the distortion of the coherent shape of galaxies are called the shear of weak lensing and are usually much smaller than the intrinsic ellipticity of galaxies. The measurement of these effects is feasible only in statistical terms, by evaluating the average over a large sample of galaxies, but it is considered as one of the most perspective tools to probe the distribution of the dark matter (Mandelbaum, 2018). Being less sensitive to the precision of the photometric redshift of individual galaxies, the three metrics usually adopted to quantify the accuracy of photometric redshifts, i.e., mean bias, scatter, and catastrophic outliers rate, are not sufficient to quantify the efficacy of a photo-z method for lensing. For example, some results show that the calibration bias for higher photo-z estimation in the case of galaxy-galaxy lensing can be as high as 30%, although the average redshift bias is well below the dispersion (Mandelbaum et al., 2008). The main reason is the non-linear dependence of the surface density on the redshift of the source, which induces an asymmetrical increase of the photo-z estimation errors. Therefore, the error associated with photometric redshift measurements is a function of the type and apparent magnitude of the galaxy, with the lensing calibration being very sensitive to the details of the uncertainty distribution on the photo-z estimation (Ma et al., 2006; Mandelbaum et al., 2008; Fu et al., 2018).
These are just a few examples of the crucial role played by photometric redshifts in Astrophysics, which justifies the constant and massive proliferation of proposed solutions to optimize their accurate and reliable estimation.The strong dependence of lensing accuracy and galaxy characterization from photo-z precision, together with the required availability of a wide sample of sources, pushed many large survey projects, like LSST, KiDS, and Euclid, to perform an extensive investigation campaign dedicated to a comparison among all the most popular photo-z methods (Hildebrandt et al., 2017; Euclid Collaboration et al., 2020; Schmidt et al., 2020).
2.1. General Aspects of the Photo-z Estimation With ML
In order to face the relationship between photo-z and ML, we started by introducing a series of general aspects.
Photo-z estimation has now become an indispensable tool in extragalactic astronomy, as the pace of galaxy detection in imaging surveys far outstrips the rate at which follow-up spectroscopy can be performed. A wide plethora of methods and techniques have been, and are, studied and experimented on a large variety of all-sky multi-band surveys, based either on physical template models fitting the SED or on empirical explorations of the photometric parameter space, trying to learn its hidden cross-correlation with spectroscopic redshifts, provided for a limited sample of objects. In general, the ML-based techniques are able to produce a high-quality photo-z estimation within the photometric ranges imposed by the spectroscopic training set but are less capable of reaching the same photo-z estimation quality outside those ranges. Nevertheless, the positive contribution of data-driven methodologies to the estimation of distances for galaxies and peculiar objects, such as quasars (Baron, 2019; Fluke and Jacobs, 2020), is well-known. Without claiming to be exhaustive, we can cite the following methods proposed in the literature, which testify to their diversity of approach:
• supervised feed-forward neural networks (Collister and Lahav, 2004; Vanzella et al., 2004; Brescia et al., 2013, 2014, 2015, 2019; Cavuoti et al., 2014; Almosallam et al., 2016; Sadeh et al., 2016);
• self-adaptive methods for the detection and removal of anomalies from photometric and spectroscopic data (Hoyle et al., 2015; Baron and Poznanski, 2017; Reis et al., 2019);
• Support Vector Machines (Zheng and Zhang, 2012; Zhang and Zhao, 2014; Han et al., 2016; Jones and Singal, 2017);
• tree-based (Carrasco Kind and Brunner, 2013; Jouvel et al., 2017; Meshcheryakov et al., 2018);
• k-Nearest Neighbors (kNN) (Graham et al., 2018; Curran, 2020);
• Gaussian processes (Bonfield et al., 2010; Almosallam et al., 2016);
• Mixture Density Networks (Ansari et al., 2020);
• unsupervised models for clustering and for estimating the coverage of the parameter space (Way and Klose, 2012; Masters et al., 2015; Stensbo-Smidt et al., 2017) or for calibration purposes (Hildebrandt et al., 2010; Masters et al., 2015; Wright et al., 2020);
• deep Neural Networks, especially relevant for the photo-z prediction from images (D'Isanto and Polsterer, 2018; Chong and Yang, 2019; Pasquet et al., 2019);
• hybrid methods for the selection of photometric redshifts considered particularly accurate and useful for cosmological purposes (Bonnett et al., 2016; Leistedt and Hogg, 2017; Morrison et al., 2017; Fu et al., 2018; Salvato et al., 2019).
For the sake of completeness, techniques based on prior physical knowledge in the form of template SEDs, the so-called SED template fitting methods, which are able to adapt to the observed flows and to extrapolate the redshift through chi-square minimization (Arnouts et al., 1999; Bolzonella et al., 2000; Brammer et al., 2008), are available in an equally rich variety of nuances, as well as in several hybrid methods exploiting the Bayesian inference and nested sampling techniques (Benítez, 2000; Goodman and Weare, 2010; Feroz et al., 2019).
The crucial aspect of supervised ML methods applied to photo-z prediction is that they require a knowledge base to learn the complex relationship between broad-band photometry and distance, mainly composed by a spectroscopic redshift counterpart subsample of the photometric sources used for training, validation, and blind testing. When it is available a sufficient spectroscopic coverage of the photometric parameter space, the ML models demonstrated a high photo-z prediction accuracy, although within the limits imposed by the spectroscopic sample (Brescia et al., 2019; Euclid Collaboration et al., 2020; Schmidt et al., 2020).
A weakness of these methods is that the results of most ML models are often biased in the presence of large numbers of missing data within the training set. This can be easily understood by realizing that these models require the definition of a metric distance that, in order to work properly, needs geometrical varieties characterized by the same dimensionality. In Astronomy, the problem is further complicated by the fact that missing data can be of different types, truly missing data (e.g., a given object has not been observed in one or more bands) or upper limits (i.e., the object has been observed but not detected), and therefore result as a Not-a-Number in the dataset. This second type of data carries information on the properties of the objects, which need to be taken into account wherever possible. In most cases, when only a relatively low fraction of the data is plagued by missing values, it is an acceptable compromise to reject the incomplete data or to apply any imputation technique (Ejaz Awan et al., 2020). This approach, however, is not viable in all those cases where a high amount of data is incomplete. In these cases, a more reliable solution is to use methods which are less sensitive to the problem, such as, the Probabilistic Random Forest (Reis et al., 2019).
Finally, there are no standard rules for the random splitting of the knowledge base in training, validation, and testing subsets, neither in terms of relative percentages nor in terms of the extraction mechanism (random extraction, decimation, etc). The optimal partition and sampling strategy can be pursued on a trial and error base, but, as a rule of thumb, in the presence of a congruous data amount (at least few thousands), relative percentages of, respectively, 60, 20, and 20%, randomly extracted data are a standard choice.
2.2. Unity Is Strength. Virtuous Synergies Among Methodologies
From earlier observations, it is clear that the SED template fitting methods, based on the adaptation of multi-wavelength photometric observations of objects to a synthetic or observed model SED library, are able to simultaneously provide the estimate of photometric redshifts, the PDF and the spectral type of each source. However, such methods suffer, in particular, from the potential mismatch among the synthetic models used for the fitting and the physical properties of the selected sample of observed galaxies (Abdalla et al., 2011), from color/redshift degeneracy, bias induced by the attenuation law (Calzetti et al., 2012; Calzetti, 2015), and from the incompleteness of the model template library available. Nonetheless, they have the prerogative of being able to derive an estimate of the redshifts, theoretically without any limit in photometric depth.
Conversely, the supervised ML methods suffer from the difficulty of obtaining good performances outside the regions of the observed parameter space, adequately covered by the reference spectroscopic sample. On the other hand, it has been amply demonstrated that, where a sufficiently adequate knowledge base is available, most ML methods are more accurate than SED fitting methods in terms of redshift prediction (Hildebrandt et al., 2010; Cavuoti et al., 2012; Brescia et al., 2019). This basic complementarity between the two methodologies has recently inspired the hybridization of methods for estimating photometric redshifts, in which it was possible to combine the positive aspects of both techniques in order to overcome their intrinsic limits. For example, the CPz method (Fotopoulou and Paltani, 2018) combines the two techniques to derive an automatic method to identify different types of sources, estimating their photometric redshifts and identifying anomalies. In another case, a hierarchical Bayesian combination of redshift estimates from different models results capable of producing a more accurate estimate of the performance of individual models (Duncan et al., 2018).
Cavuoti et al. (2017b) started from the assumption that the spectral type classification provided by the SED fitting method allows to derive statistical errors as a function of the spectral type for ML models, thus making possible a more accurate and specific characterization of the prediction errors. In other words, it is possible to assign a specific spectral class to each source and build specialized (i.e., gated expert) regression models for each spectral type class, thus refining the photometric redshift estimation process. At the end of the hybridization process and the improvement of the quality of the redshifts obtained by the expert ML regression estimator on single spectral types of objects, the proposed method was able to reduce the overall photo-z estimation error by more than 10% compared to the whole blind test set. This improvement was mainly a consequence of the reduction in the percentage of outliers. This result, combined with the prerogative of total arbitrariness in the choice of SED fitting and ML methods to be used, demonstrates the potential of optimizing the accuracy of the photometric redshifts estimation through the mutual cooperation among theoretical and empirical methods (Cavuoti et al., 2017b).
More recently, Soo et al. (2021) analyzed and optimized the hybrid empirical-template method, Delight (Leistedt and Hogg, 2017), on a subset of the early Physics of the Accelerating Universe Survey (PAUS) data release (Eriksen et al., 2019). Delight is an algorithm for the determination of photo-z that combines template-based and ML techniques. Delight constructs a large collection of SED templates from training data, with a template SED library as a learning guide for the model. Soo et al. (2021) optimized Delight by calibrating its 40 narrow bands with six broad bands in the COSMOS field and by performing an interesting analysis of outliers, obtaining, as a preliminary result, that narrow band filters produce a large amount of outliers (Soo et al., 2021). This fact was experimented by performing photo-z predictions with ML models with the 30-band COSMOS data, composed of a variety of broad and narrow bands, and which was also recently confirmed by Razim et al. (2021).
2.3. Combined Predictions of Photo-z and Galaxy Properties
In the context of upcoming and future large survey projects, such as LSST, Euclid, and JWST, which will extend our knowledge of the dependence of galaxy populations on environments, as well as the characterization of large scale structures, the determination of star-forming activity, such as the Star Formation rate (SFR) and stellar mass from UV, optical, or IR luminosity, will be crucial. Their traditional study was based on complex models and prior knowledge of the properties of the galaxy, which limited their capability to accurately describe peculiar categories of extended sources, such as passive galaxies, which are of particular interest in the study of large-scale structures. It is worth emphasizing that the derivation of such physical quantities of galaxies cannot be separated from an accurate and reliable estimate of their distances, and that the redshifts and the physical properties of galaxies are intrinsically correlated.
Ideally, spectroscopic data are needed not only to calculate redshifts but also to estimate the SFR and stellar mass properties (Brinchmann et al., 2004; Delli Veneri et al., 2019). However, spectroscopy is not always available and is extremely expensive in terms of observing time, becoming even more prohibitive when the goal is to characterize the properties of galaxies in large surveys. A potentially effective and alternative method of deriving such quantities in a combined framework, based on the exploitation of the supervised paradigm of ML, has recently been proposed. For example, Bonjean et al. (2019) approached a Random Forest model to simultaneously estimate SFR and stellar masses of galaxies from a sample of WISE NIR sources and related redshifts, by training the model on the SFR and stellar mass values extracted from spectra of the SDSS DR8. The encouraging results, although restricted to a limited redshift range, i.e., up to z < 0.3, prompted the use of this methodology to derive redshift and stellar mass in a combined way from a selected sample of galaxies from the DES survey, training the Random Forest on COSMOS2015 data, achieving interesting performances even in the regime of a limited space of photometric parameters (Mucesh et al., 2020). The preliminary results demonstrate that ML could be a powerful methodology to find intrinsic correlations among photometric redshifts and galaxy physical parameters, which are extremely useful for large galaxy survey projects like Euclid (Laureijs et al., 2011; Bisigello et al., 2020).
2.4. Is the Photo-z Point Estimate Enough?
Due to the wide variety of proposed solutions to the estimation of photometric redshifts, the need of a fair comparison among different methods is naturally needed. There are many studies in which people tried to compare their own method with what was available in literature (Laurino et al., 2011; Brescia et al., 2013, 2019; Polsterer, 2016; D'Isanto and Polsterer, 2018). Furthermore, over the last decade, within large survey projects, there was a rise in challenges dedicated to the comparison among different methods following common rules and using same data, specifically provided for these contests. The Photo-z accuracy testing (PHAT) challenge (Hildebrandt et al., 2010; Cavuoti et al., 2012) was among pioneers of such initiative, more recently followed by the Euclid and LSST challenges (Euclid Collaboration et al., 2020; Schmidt et al., 2020). In all such contests, a portion of the dataset, used for the final comparison analysis, was kept hidden from the participants in order to allow a blind test, thus providing a fair comparison in the same conditions (more examples are in Abdalla et al., 2011; de Jong et al., 2017; Bilicki et al., 2018; Tanaka et al., 2018; Amaro et al., 2019; Norris et al., 2019), often with the purpose of testing a specific case of interest. The evaluation of the results was usually performed using standard statistical estimations, such as standard deviation, bias, normalized median absolute deviation, root mean square, and outlier percentage rate, all metrics commonly adopted to evaluate the quality of photo-z predictions in terms of point estimates and considered as sufficient and reliable for assessing the results.
However, in the last few years, several studies showed that the use of the point estimation to fully represent the quality of photo-z's is insufficient and could lead to biases (Mandelbaum et al., 2008; Cunha et al., 2009; Myers et al., 2009; Wittman, 2009; Bordoloi et al., 2010; Abrahamse et al., 2011). For such reason, there was the tendency to adopt the Probability Density Functions (PDFs) in order to provide a wider confidence range on the photo-z prediction reliability, which could result in suitable assessing the accuracy of photo-z estimation in cases where a higher precision is required, for instance, to derive cosmological parameter measurements. For example, Mandelbaum (2018) demonstrated that the weak lensing studies, in particular, the measurement of the critical mass surface density, require a reliable photo-z PDF estimation to remove any calibration bias effect.
Within few years, the trend to provide both photo-z point estimates and PDFs has now become a consolidated practice (Sheldon et al., 2012; Carrasco Kind and Brunner, 2013; Carrasco Kind and Brunner, 2014a,b; Bonnett, 2015; Cavuoti et al., 2017a; Malz et al., 2018; Tanaka et al., 2018; Amaro et al., 2019; Mucesh et al., 2020; Nishizawa et al., 2020). The idea is that a PDF should be able to provide a more complete information than the point estimation of the redshift. For instance, they should embed the presence of a secondary solution that, in presence of a degeneration of the parameter space, would be systematically suppressed. Some studies (Viola et al., 2015; Mandelbaum, 2018) showed that the PDFs allow to improve the accuracy of cosmological and weak lensing measurements and to ensure a sufficient analysis of the cosmological uncertainties, from weak lensing tomography, to baryon acoustic oscillations. For this reason, most of the surveys are now producing or are planning to provide photo-z catalogs, including the PDFs and their statistics, rather than just the point estimates [see for instance KiDS (de Jong et al., 2017), Euclid (Euclid Collaboration et al., 2020), and LSST (Schmidt et al., 2020)].
For SED fitting methods, it is well-established the usage of the χ2 fit among data and a predefined set of galaxies (Abdalla et al., 2011), which leads directly to the derivation of a PDF by weighting all the possible solutions with their fit. Conversely, in the case of empirical methods, there is not such kind of homogeneity, and different methods provide PDFs in different ways, spanning from the measure of the internal model error, by performing several independent training (Sadeh et al., 2016), to the measure of the effect due to the fluctuation in the parameter space (see Cavuoti et al., 2017a and Schmidt et al., 2020 for a list of different methods with different strategies for PDFs derivation). It goes without saying that, in order to understand which is the best strategy (and the best method), in the absence of an objective analytical tool, a comparison among different methods is required.
One of main differences among point estimates and PDFs is in the way in which they are evaluated and optimized. While, for point estimates, there is a common agreement on the statistical metrics, for what concerns PDFs, there is still no general agreement on how to assess their reliability. To demonstrate this, it is sufficient to refer to the examples of Euclid and LSST. In the first case, the quantities to optimize are the fractions of the stacked PDF enclosed in ±0.05 or in ±0.15 (Euclid Collaboration et al., 2020), named f0.05 and f0.15, respectively. Such kind of metrics (as proved in Amaro et al., 2019) can be easily falsified by using a simple dummy PDF, consisting of a single bin PDF centered on the value of the photo-z point estimate.
Amaro et al. (2019) showed that, on a KiDS DR3 dataset with zspec < 1, a simple dummy PDF is able to reach 93.1 and 99.0% in terms of f0.05 and f0.15, while well-assessed methods, such as METAPHOR, ANNz2, and BPZ, reach, respectively, 65.6, 76.9, and 46.9% on f0.05 and 91.0, 97.7, and 92.6% on f0.15, thus implying that those two parameters are only partially useful as metrics within an exhaustive evaluation process of photo-z PDFs.
In the second case (LSST, Schmidt et al., 2020), main drivers are related to the property of the cumulative distribution function (CDF), such as the probability integral transform (PIT, Seillier-Moiseiwitsch, 1993) and the Quantile-Quantile plots (hereafter QQ, Wilk and Gnanadesikan, 1968). Within the same experiment, those metrics were falsified through the usage of the same PDF for each point, corresponding to the redshift normalized distribution of the training set (see TrainZ panel of Figure 1). While it is clear that the optimization of one of those estimators leads to meaningless PDFs, on the other hand, the solution, that is to identify the correct estimator to optimize, is not at all clear and still remains an open issue.

Figure 1. Figure from Schmidt et al. (2020). Statistical comparison among different methods for photo-z PDFs within the LSST Challenge (see Schmidt et al., 2020 for further details). The panels show the QQ plots (red) and PIT histograms (blue) with the superimposed ideal QQ (black dashed diagonal) and ideal PIT (gray horizontal) curves, including a residual plot for the QQ estimation with respect to the ideal diagonal (lower inset). In the last bottom right panel, TrainZ is the fake PDF described in section 2.4.
3. The Critical Role of the Parameter Space
The utility of photometric redshifts, derived from broad-band galaxy fluxes and colors rather than spectra, is now well-established through the high quality and reliability probed by many different techniques in a wide range of astrophysical contexts. The accuracy of the photometric redshift estimate certainly depends not only on the method used but also on a complex combination of extension and distance of the galaxy, on the set of photometric bands, on the signal/noise ratio of photometry, and on the type of spectrum of the galaxy (in general, intrinsically redder objects produce more accurate photometric redshifts).
3.1. The Impact of the Photometric Uncertainties
By considering the role played by the photo-z prediction error, the blurring of the large-scale structure in the radial direction, due to the photometric error of the redshift, degrades the measurements of the clustering pattern. Nonetheless, on physical scales greater than that implied by the redshift error, the information is preserved. On the other hand, even on smaller scales, the large area covered by an image survey can potentially provide structural information very close to that produced by a fully spectroscopic survey, which implies very competitive cosmological constraints. However, it is known that some sub-classes of galaxies exhibit better behavior in terms of photometric redshift. For example, experience with ML on SDSS data has shown that, on a sample of luminous red galaxies, we were able to obtain a redshift accuracy at least twice as high as that obtained on blue galaxies (Csabai et al., 2003; D'Abrusco et al., 2007; Brescia et al., 2014). In particular, the availability of sufficiently deep near infrared images is significant for galaxies with redshift z > 0.4 (Bolzonella et al., 2000). Therefore, the combined use of optical and infrared bands has been able to improve the quality of distance predictions by exploiting the entire population of galaxies, rather than particular subclasses. However, Blake and Bridle (2005) have shown that a significant optical depth (r ~ 24) over an area of several thousand square degrees is required to ensure the accuracy of photometric redshifts useful for formulating measurements of cosmological properties (Figure 2).
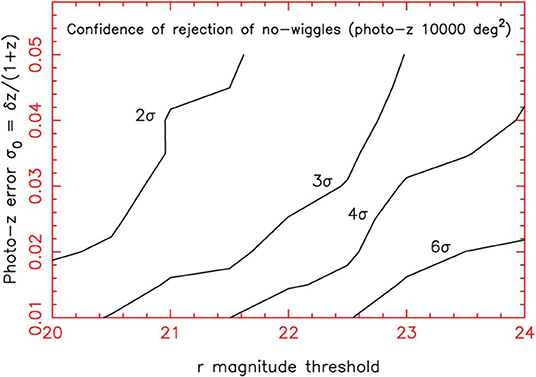
Figure 2. Figure from Blake and Bridle (2005). Confidence boundaries of photometric redshift imaging surveys with variable photometric error thresholds. The probabilities are expressed as a rejection “σ number” for a Gaussian distribution. A detection area of 10,000 deg2 is used.
This photometric limit may exceed in the coming years due to survey projects, such as LSST, for which the photometric detection of the redshift will cover an AΩ area, approximating the entire sky to a depth of magnitude r ~ 26.
Modern precision cosmology requires very small statistical errors that, to be achieved, require the minimization of systematic errors through an in-depth knowledge of the various contributions to the loss of performance (Oyaizu et al., 2008). For example, it was estimated that, for the tomographic investigations on a cosmic scale, based on the sampling of the dynamic range of distances, it is necessary to guarantee an uncertainty of ~0.003 or less for the bias and dispersion in each bin of redshift, in order to control the constraints imposed by shot-noise on the estimation of dark energy (Ma et al., 2006). Furthermore, theoretically, a dependence on photometry errors would also be expected. The photometric simulations of the redshift and the subsequent modeling of the observed cases usually start from the assumption that the photometric errors follow a Gaussian distribution. However, the evidence of real data reveals a much more complex situation. Several redshift estimation experiments with ML methods have shown that the statistical quantities of the analysis of the prediction residuals, calculated with respect to the spectroscopic knowledge base, are always altered by anomalies induced by the tails in the distributions of photometric errors. The presence of a quantity of sources in the tails equal to about 10% of the analyzed sample can cause an alteration in terms of dispersion of the prediction precision of more than 2σ compared to the impact of a halving of the S/N ratio (Wittman et al., 2007). This, therefore, implies the need to minimize the amount of error tails in magnitude and color, especially for the photometric bands more sensitive to noise sources, such as the U band.
This problem obviously has also a strong impact in the tomographic analysis of the distribution of photometric redshifts, for which the only viaticum would be the substantial increase of the reference spectroscopic sample for the training of prediction models. Therefore, regardless of the photometric quality of the data, limiting the presence of tails in the photometric distributions can reduce the dependence on the spectroscopic sample, especially in the context of wide photometric surveys.
Concerning the contribution of the photometric errors to the accuracy of photo-z predictions with data-driven methods, despite the errors not being widely used in literature as input features to improve redshift estimation, there are a few exceptions. For instance, in Laurino et al. (2011), the errors on each SDSS color are used, while, in D'Isanto et al. (2018), the feature defined as , where σrmodel and σrdev are the errors, respectively, on model and dev magnitudes in the r band1, has been selected as the third most important for redshift estimation of QSO in the SDSS DR7.
Certainly, a positive aspect of data-driven learning methods is that they are automatically able to correctly learn the characteristics of the noise model. This requires that the learning data should be characterized by a parameter space sufficiently extended to acquire the right information on the non-Gaussian characteristics of photometry, in addition to the need for the training and complete data sets to be homogeneous with each other in terms of uncertainty rate. In these cases, setting limits to the tails of the photometric error distribution can induce a greater control over the error model, minimizing the photometric dispersion of distances.
3.2. The Characterization of the Photometric Space
In the case of normal galaxies, a high efficiency of photo-z estimation with the supervised ML model MLPQNA, a neural network based on the Multi-layer Perceptron with two hidden layers (Rosenblatt, 1963), was experienced, which uses the Quasi Newton approximation of the Hessian error matrix as learning rule (Nocedal and Wright, 2006). This model performed particularly well for galaxies from the SDSS DR9 (Brescia et al., 2014) and in the PHAT (Photo-z accuracy testing) challenge (Hildebrandt et al., 2010; Cavuoti et al., 2012), achieving excellent statistical results, according to the usual set of metrics, i.e., bias, scatter rate, and outliers rate. This level of prediction accuracy was particularly unexpected in the case of the PHAT contest, which was a sort of worst case for machine learning methods. In fact, in that case, the very limited amount of training data (~500 sources) evidenced their applicability limits with respect to SED fitting techniques, whenever the knowledge base is strongly lacking, regardless of the intrinsic wavelength extension and the quality of the photometry (Hildebrandt et al., 2010).
Another interesting use case was the photo-z estimation of galaxies provided by KiDS, a wide-area optical imaging survey in the four filters (u, g, r, i), performed by the VLT Survey Telescope and the OmegaCAM camera (de Jong et al., 2013). These redshifts are currently being used by the KiDS collaboration for several studies related to the evolution of galaxy stellar masses and the structural parameters with redshift (Roy et al., 2018; Scognamiglio et al., 2020; Tortora et al., 2020).
The KiDS DR2 contains 148 tiles observed in all four filters (de Jong et al., 2015). In order to derive the photometric redshifts, the multi-band source catalogs, based on source detection in the r-band images, were used, for which it was extracted from the training sample after having filtered objects having close and bright companions, affected by blending or bad pixels. The training spectroscopic redshifts were composed by merging data from SDSS DR9 and GAMA DR2 (Driver et al., 2011), therefore dominated by GAMA galaxies at low-z (z ≲ 0.4) and by SDSS at the higher redshift regime (out to z ~ 0.7), with r < 22, while using 4 and 6 arcsec diameter apertures for the photometry, thus, obtaining an overall 1σ uncertainty of 0.0305 with a very small average bias of 0.0011, a low NMAD of 0.021, and a low fraction of outliers, i.e., 0.39% above the standard limit of 0.15 (Cavuoti et al., 2015).
Main differences between the KiDS-ESO DR3 and previous releases were the inclusion of GAaP type magnitudes (Kuijken et al., 2015) and the combined set of 440 survey tiles, including large contiguous areas and achieving a refinement of the photometric calibration that benefits both the overlap among single filter observations and the stellar colors across filters. In the specific case of the KiDS-ESO DR3, two distinct experiments within different spectroscopic ranges were performed, respectively, 0.01 ≤ zspec ≤ 1 and 0.01 ≤ zspec ≤ 3.5. The statistics obtained in the first case were a bias = 0.0014, σ = 0.035, and NMAD = 0.018, with 0.93% of outliers (|Δz| > 0.15(zspec + 1)), while, in the second case, a bias = 0.0063, σ = 0.101, and NMAD = 0.022 with 3.4% of outliers rate were reached. These results are shown in Figure 3. In terms of accuracy, within the spectroscopic limit of zspec ≤ 1, our model (also in this case a MLPQNA, Cavuoti et al., 2015) shows comparable results, while, as expected, the scatter and outlier rate efficiency decreases at fainter distances, due to the lower amount of sources available within the training sample. By looking at the histograms of the residual distributions of Figure 3, a peculiar behavior appears, very frequent in the case of photo-z prediction with ML methods, as also it occurred for photo-z estimation in the SDSS galaxy experiments (Brescia et al., 2014), characterized by a leptokurtic and symmetric distribution, i.e., an over-density of sources within the central region, populated by objects with a small error, which also reflects on the very low percentage of outlier rates and a low NMAD value.
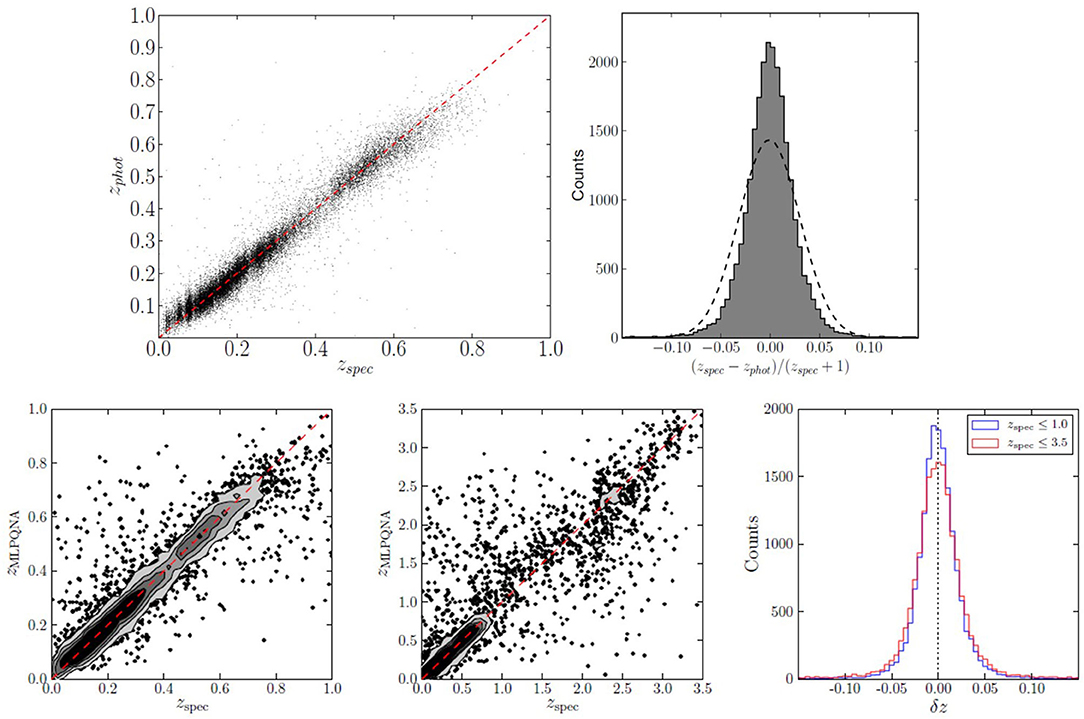
Figure 3. Merged diagrams from Cavuoti et al. (2015) and de Jong et al. (2017). Upper panels: Photo-z results obtained with KiDS DR2 data. In the right diagram, the dashed line represents the Gaussian fit to the residual distribution. Lower panels: Results of photo-z experiments with KiDS DR3 data. The left and central panels are the scatter plots for the experiments limiting the spectroscopic redshifts, respectively, to 1 and 3.5. On the right, the superimposed histograms of the residual distributions for the two cases are shown.
The MLPQNA neural network was also applied to the evaluation of photometric redshift for optically selected quasars (Brescia et al., 2013) using a multi-wavelength photometric space composed by GALEX, SDSS, UKIDSS, and WISE data, achieving very good levels of accuracy (bias = 0.004 with a SD of σ = 0.069) and a reduction of the number of catastrophic outliers to <3%. The comparison of performances reached by varying the number of bands (Figure 4), from the optical SDSS photometry to the complete multi-band photometry and from UV of GALEX to mid-IR of WISE, clearly shows that, in the case of QSOs, a wide photometric coverage improves the quality of predicted photo-z, by using psf type magnitudes, instead of the aperture type, which is more efficient for galaxies (Brescia et al., 2013).
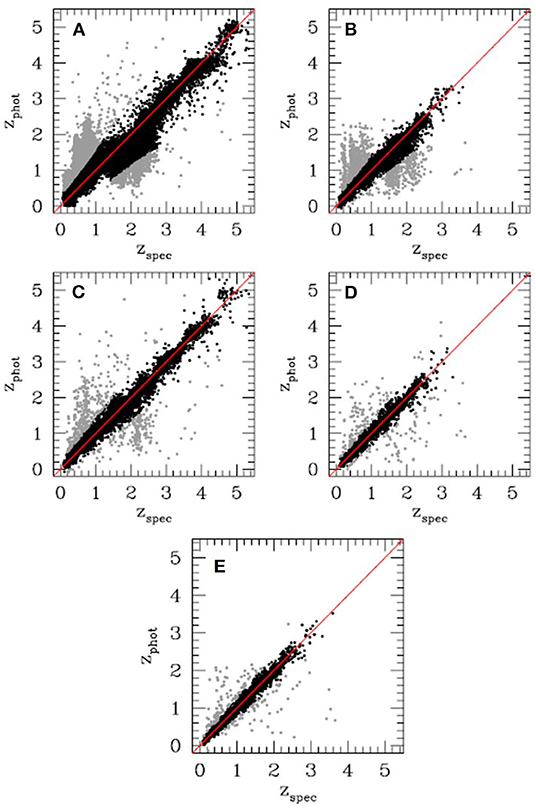
Figure 4. Figure from Brescia et al. (2013). Scatter plots of photo-z predictions for QSOs referred to the multi-band photometry using bands from, respectively, (A) SDSS, (B) GALEX + SDSS, (C) SDSS + UKIDSS, (D) GALEX + SDSS + UKIDSS, and (E) GALEX + SDSS + UKIDSS + WISE. Gray points are catastrophic outliers.
Another example of the positive contribution of near-IR bands to the photo-z prediction accuracy was discussed by Fu et al. (2018), where they compared the cosmological constraints of σ68 and ΩM, under the ΛCDM model, obtained by using the photometric redshifts derived from two different parameter spaces, respectively, with only four optical bands [u, g, r, i from VOICE (Vaccari et al., 2016)] and with eight bands, by adding the near-IR bands [Y, J, H, Ks, obtained from VIDEO (Jarvis et al., 2013)]. The comparison, shown in Figure 5, clearly reveals that, in the 4-band photo-z case, the contours appear to have shifted to the higher σ68 and ΩM side, coherent with the fact that the near-IR contribution correctly assigned the 15% of the high-z galaxies to low-z regime (see Fu et al., 2018 for more details).
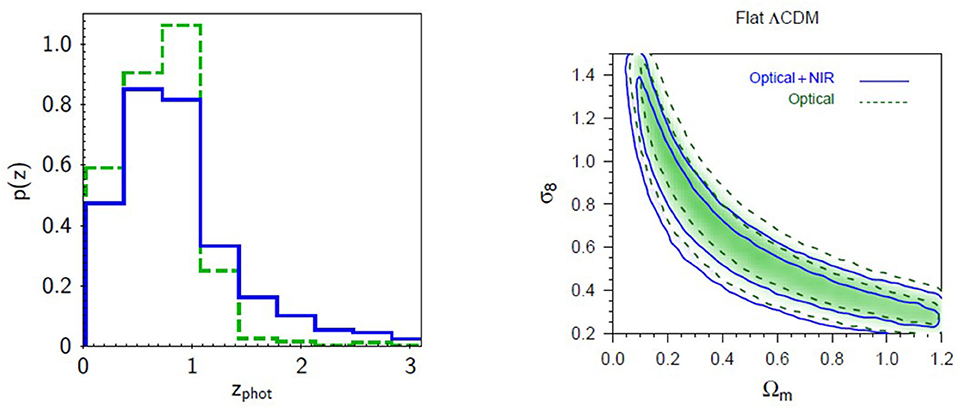
Figure 5. Figure from Fu et al. (2018). (Left) The normalized histogram of photo-z estimated using photo-z derived using, four optical bands (green dash line) and eight (optical plus near-IR) bands (blue solid line). (Right) Diagram of marginalized posterior density contours (68.3 and 95.5%) for ΩM and σ68 in the case of flat ΛCDM. The blue contours are the constraints related to the 8-band photo-z, while for blue contours, the results using 4-band photo-z are shown.
In general, therefore, given that the photo-z estimation is particularly crucial for acquiring knowledge about the formation and evolution of galaxies, by expanding the statistical sample available with respect to spectroscopic distances, it is possible to obtain a reliable knowledge of the distances even in regions of photometric space usually less covered by spectroscopy. Naturally, this implies a careful choice of photometric bands by large survey projects in the regions of interest, as well as ensuring the widest possible multi-wavelength coverage in order to minimize the occurrence of parameter space degeneration.
3.3. Anomalies in the Training Set
Another important aspect in the photometric redshift prediction experiments concerns the identification of anomalies in the training set, which are potentially capable of leading to erroneous distance estimations. This aspect is directly related to the identification of regions of the photometric and spectroscopic parameters space that are undersampled from the training data. This analysis is particularly important, as it can provide useful information to optimally and efficiently guide the follow-up spectroscopy, in order to optimize the training data set. This information can also be used to evaluate the effectiveness of different combinations of photometric features by obtaining a statistical prediction of the redshift quality. For example, in the case of the Random Forest model, it is possible to verify the informative contribution of the photometric features, using the Out-Of-Bag (OOB) sampling technique, which consists of the random extraction of a sample of data excluded from the training during the construction of the various decision trees. This subsample of extracted data can then be used to estimate the relative importance of each photometric feature present in the parameter space. It is, therefore, an effective method to identify and remove features whose information entropy is redundant or even misleading (Breiman, 2001).
The informative contribution of the features can also be used to better understand the training data, to verify if it is possible to reduce the dimensionality of the problem, and to identify areas of the space of the mapped parameters where the new training data can be incorporated in the most effective way. This prerogative can be obtained with supervised methods, as in the case of the TPZ model (Carrasco Kind, 2015), and unsupervised methods, as in the case of the Self Organizing Map (Masters et al., 2015) model. In the second case, the spectroscopic information on the target is not used in the process of constructing the Kohonen maps (Kohonen and Mäkisara, 1989), but only, in offline, to identify the objects that belong to a cell in order to make predictions from the two-dimensional map.
In the case of Active Galactic Nuclei (AGN), the huge potential of the catalogs available for their science remains practically untapped, because most sources lack a redshift. The above techniques are routinely applied to galaxies, but their application to AGN (where the nuclear contribution to the global emission is unknown and depends on the type of source) is not straightforward. For this reason, SDSS photometric redshifts have a low level of reliability for X-ray selected sources, especially at redshift below z ~ 1.
Nevertheless, recent studies have shown that the hybridization of empirical and SED fitting methods can provide encouraging results in the estimation of photo-z for mixed populations of galaxies and AGNs (Duncan et al., 2018; Fotopoulou and Paltani, 2018), although the efficiency achieved for galaxies hosting AGN is not comparable to that obtained for inactive galaxies. In fact, the problem is that the extent of the AGN contribution to the total emission in the various bands is a priori unknown, causing uncertainty in determining a correct set of template models in the case of SED fitting (Salvato et al., 2011; Ananna et al., 2017). This is true, except in the case of Seyfert galaxies (with low redshift and low luminosity), where the quality of the photo-z can reach that of normal galaxies, as long as a narrow/intermediate filter band photometry is available, like in the case of the COSMOS survey (Salvato et al., 2009). Similarly, for empirical models based on the supervised paradigm, the limit is the availability of a sufficiently large and complete training spectroscopic sample (Budavári et al., 2001; Bovy et al., 2012). In this respect, it must be pointed out that, since most spectroscopic samples are usually extracted from optically selected galaxy catalogs, this problem unavoidably leads to an unbalanced distribution of AGNs (or any other peculiar objects), which are underrepresented. The effects of this bias on future radio surveys (such as those to be performed with SKA) is clearly shown in Norris et al. (2019).
However, empirical methods, which are implicitly less sensitive to differences in photometry, offer better performance but show the need to identify the most suitable photometric parameter space. In this scenario, the ~3 million sources, that eROSITA (Extended Roentgen Survey with an Imaging Telescope Array, Merloni et al., 2012) should observe, constitute the positive turning point. A recent work (Brescia et al., 2019) investigated the contribution provided by the photometry, with an incremental number of bands, of the counterparts of the X-ray sources detected in the Stripe 82X (LaMassa et al., 2013a,b, 2016), to the quality of photo-z of AGN sources estimated with ML methods. The photometric catalog included GALEX, SDSS, UKIRT, VHS, SPITZER/IRAC, and WISE with sufficient depth to detect X-ray sources, at least to the depth of eROSITA (Ananna et al., 2017). The results of the comparison between spectroscopic and photometric redshifts, obtained by our neural network for the sources in each wavelength subsample and by a SED fitting model, are shown in Figure 6. Looking at the various diagrams, as it is reasonable to expect, the photometric coverage limited to the optical bands causes an excess of high redshift values for sources that actually have a low redshift. This effect can be reduced by adding the mid-IR bands of WISE, which show a better contribution than the near-IR bands of VHS. In particular, the addition of these bands allows a drastic removal of outliers, although it reduces the sample of available sources by about 35%. A further improvement in statistical accuracy is achieved by adding the IRAC bands, a case in which the empirical model proves to be better than the SED fitting method, both in terms of a lower rate of outliers and an almost total absence of systematics.
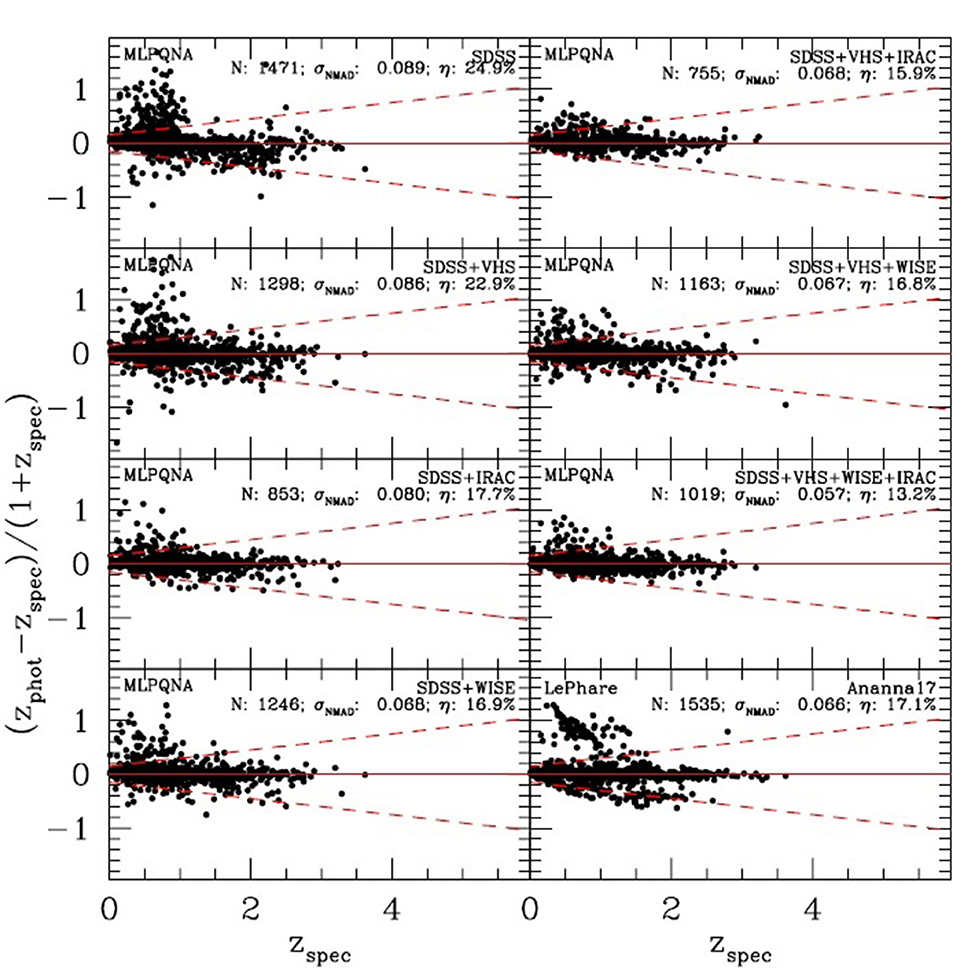
Figure 6. Figure from Brescia et al. (2019). Comparison between spectroscopic redshift and photo-z for the sources cut at the eROSITA flux and divided on the basis of available photometry. For comparison, the result from Ananna et al. (2017) are reported in the lower right panel. By comparing the accuracy and the fraction of outliers in all panels, it appears clearly that using only optical bands for bright X-ray sources is not sufficient.
However, at the depth of eROSITA, the two methods turn out to be comparable, especially in terms of percentages of outliers, as it can be seen from Figure 7. This diagram is particularly significant since it shows the recurrent phenomenon of a low rate of source outliers common to both prediction methods. This reveals the problem of the dependence of the outliers on the method used, which however excludes the peculiar nature, from the astrophysical point of view, of the uncommon outlier objects.
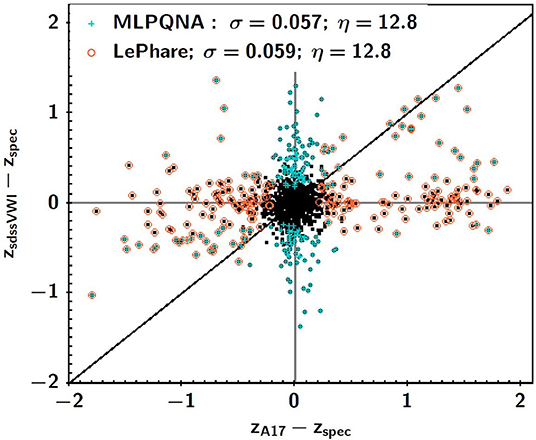
Figure 7. Figure from Brescia et al. (2019). Difference between spectroscopic redshift and photo-z computed via the MLPQNA neural network and the SED fitting method, LePhare, for the subsample including the complete photometry available (SDSS, VHS, WISE, and IRAC), regardless of their X-ray flux. Sources that are outliers for MLPQNA (LePhare) are plotted in cyan (orange). For this subsample, the two methods have a similar performance behavior. Nevertheless, the majority of the outliers are such only for one of the two algorithms. For the common outliers along the black one-to-one line, the two methods agree in terms of predicted photo-z.
As a concluding remark, in the presence of a conspicuous parameter space, for example magnitudes, colors, and ratios on tens of photometric bands, the removal of less important features is able to improve the quality of redshift prediction. The photo-z prediction accuracy through empirical methods has a complex dependence on the observed source types, the amount and quality of photometric bands, the spectroscopic quality and coverage of the photometric parameter space, and the size of training set.
3.4. The Impact of Spectroscopic Reliability
Despite the existing plethora of photometric redshift estimation solutions, so far, none of the methods have been found to be able to achieve the accuracy of the spectroscopic redshifts measurement, which is of the order of ~10−3 (e.g., Le Fèvre et al., 2005; Biviano et al., 2013; Rosati et al., 2014; Karman et al., 2015; Hasinger et al., 2018; Scodeggio et al., 2018; Angora et al., 2020). While the best quality of photometric redshifts, obtained with broad-band photometry, can reach an error of σ ~ 0.02 (Brescia et al., 2014; Salvato et al., 2019; Euclid Collaboration et al., 2020; Schmidt et al., 2020), which has a higher order of magnitude.
The accuracy of the photometric redshifts, obtained through supervised learning, has a natural dependence on the degree of completeness and the quality of the spectroscopic catalogs used as ground truth. In fact, the incompleteness of the spectroscopic sample, although usually accentuated in the faint part of the photometric parameter space, can induce an altered selection effect that can be found throughout the parameter space. In addition, the residual error in estimating spectroscopic distances can affect the reliability of the metrics used for the validation of training by ML models, thus directly affecting the quality of the photo-z. The typical quality of spectroscopic redshifts, between 95 and 99%, implies that between 1 and 5% of the training sample is unreliable. Also, the real problem is that it is not possible to establish a priori for samples contaminated by such spectroscopic uncertainties, compared to those induced by photometry. A further complication is the impracticability of manual analysis methods, based on visual inspection, in the catalogs obtained from large survey projects, hence the need to explore automatic mechanisms and procedures capable of distinguishing the different sources of uncertainty in the data available.
In a recent study, Razim et al. (2021) proposed a method to identify the unreliable spectroscopic sample and consequently isolate the set of sources whose photometric parameter space is correctly mapped onto the spectroscopic sample. Obviously, with the ultimate goal of improving the quality of the photo-z estimation by exploiting the spectroscopy from COSMOS and the Deep Imaging Multi-Object Spectrograph (DEIMOS, Hasinger et al., 2018) catalogs, together with the 30-band photometry of the COSMOS2015 catalog (Laigle et al., 2016), used to produce the photometric redshifts, the proposed method was based on two ML models, the Self Organizing Map (SOM, Kohonen, 1982) for data analysis and cleaning, the MLPQNA for photo-z prediction, and the SED template fitting photo-z catalog, described in Laigle et al. (2016), as an additional testing and validation tool.
As known, an SOM produces a topographic map formed by a grid of neurons becoming selective representatives of the various input patterns and changing their topological location during the course of the competitive learning. The final topology of the grid identifies more dense areas that result as overdensities (proto-clusters or cells) within the output space, corresponding to subsets of input patterns sharing some similarities in terms of internal features. The unsupervised model SOM was introduced to identify and reject the unreliable spectroscopic redshifts, by introducing the coefficient Kspec to quantify the difference between a given galaxy spectrum and the average spectra of all galaxies located in the same SOM cell after training and then reject objects above a given threshold in Kspec. Such a coefficient had the multiple effect to reduce the outlier rate of about the 88% and the 1σ scatter by a factor of ~2 within the photo-z predicted by MLPQNA, and at the same time, to reveal a high sensitivity to the physical variance of the galaxy population, thus becoming a reliable parameter to evaluate the correct mapping between spectroscopic distance and the photometric parameter space of the sources. Furthermore, using the DEIMOS spectroscopic catalog as validation set, the so-called galaxy occupation map concept was exploited, to verify that the sources of the validation sample and those of the knowledge base used by the MLPQNA model for the estimation of the photometric redshifts, occupied the same area of the SOM map, thus ensuring a correct correspondence between photometry and spectroscopic distances. Such a procedure reduced the outliers rate from ~11 to ~2%.
The scatter plots shown in Figure 8, taken from Razim et al. (2021), show the results of the proposed filtering method in terms of outlier reduction for the two involved ML and SED fitting models. In particular, the third row of panels demonstrates the predictions for the DEIMOS in the whole range of redshifts. Both models evidently show their need of the proposed occupation map filtering, in order to select the correct sources. Otherwise, as shown in the panels of the first column, the results from the SED fitting models affected an important amount of catastrophic outliers in the whole range of spectroscopic redshifts, while the ML model tends to systematically fail for sources with specz > 1. Furthermore, the filtering method appears particularly efficient in the case of outliers produced by overestimated photometric distances.
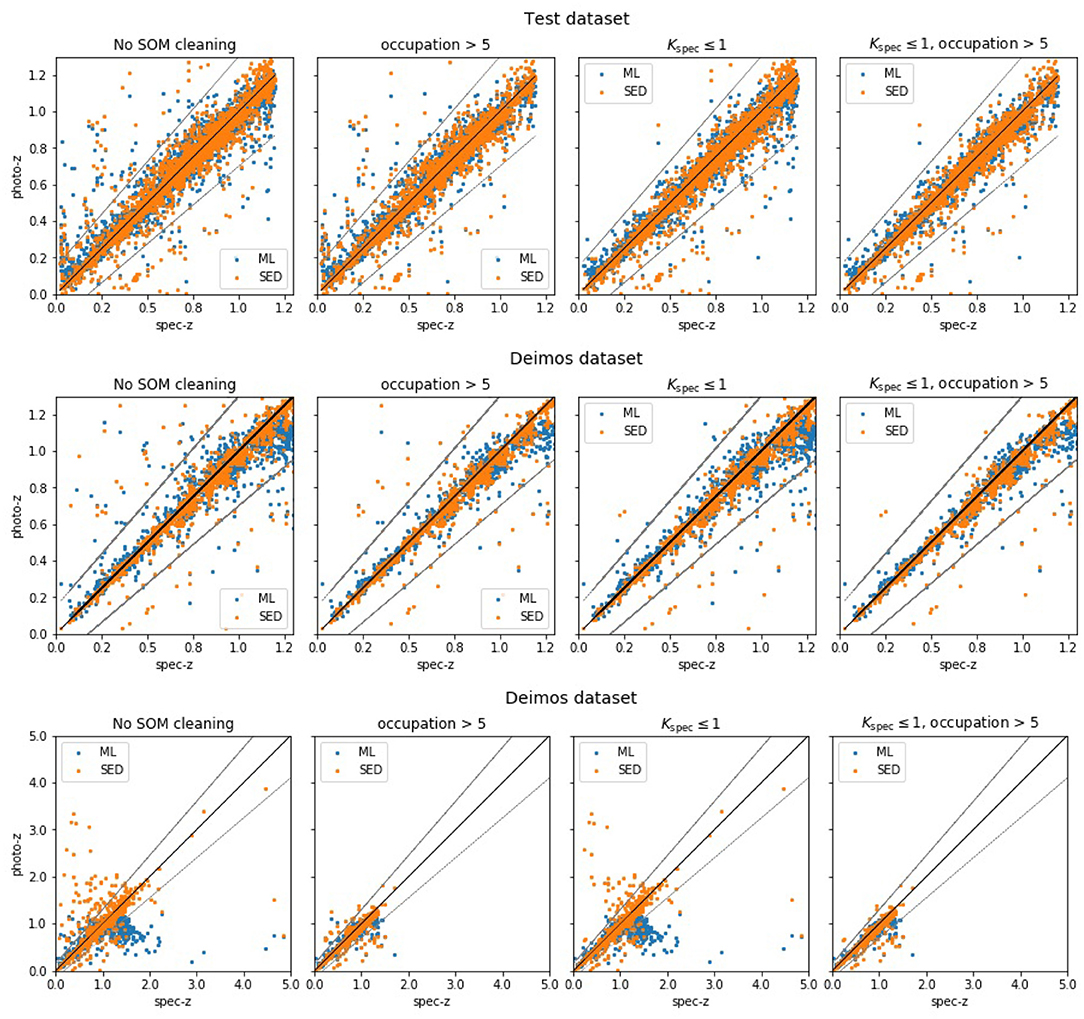
Figure 8. Figure from Razim et al. (2021). Scatter plots of machine learning (ML) and SED fitting photometric (photoz) against spectroscopic (specz) redshifts. The photo-z were predicted by the MLPQNA neural network, trained on COSMOS spectroscopy and photometry and validated also on DEIMOS spectroscopic catalog. The first left column of panels shows the datasets before SOM filtering. The panels of the second column show the results after having filtered only the spec-z outliers. The third column panels report the plots after the filtering of only occupation maps, while, in the last column, the panels show the datasets after the combination of the two cleaning methods. The dotted lines show outlier boundaries defined as photoz = specz ± 0.15. The top first two rows show the results for the test and DEIMOS datasets limited to specz < 1.2 and photoz < 1.2.
It goes without saying that a proper coverage of the parameter space is the only viable way in order to obtain reliable photo-z. In fact, in the presence of portions of the parameter space, not properly covered by the knowledge base, it would cause a proliferation of outliers. On the other hand, the presence of unreliable spectroscopic redshifts would result in a wrong training of the ML methods, inducing further bias that are hard to be handled.
3.5. The Importance of Feature Selection
The concept of feature selection is linked to the property of the importance and relevance of features in the context of a parameter space used for prediction/classification purposes with methods based on ML. The importance of a feature is the relevance of its informative contribution to the solution of a learning problem, whereas a feature x is formally relevant if its removal from the parameter space always causes a degradation of the learning quality. Conversely, the feature x is considered weakly relevant if there is at least a subset A of features for which the accuracy of learning on A is worse than the union between A and x. In all other cases, the feature is considered irrelevant. Furthermore, on one hand, the computational cost of most ML methods scales badly with the number of dimensions. It, therefore, proves to be crucial to reduce the dimensionality by projecting the original space onto spaces of lower dimensionality; on the other hand, an important aspect of dimensionality reduction is to avoid overfitting if the number of dimensions is high.
This means that an increase in information does not always correspond to an increase in knowledge in order to solve a problem, primarily due to the fact that the expansion of a parameter space inevitably causes an incremental dispersion of the correlation between the data, regardless of the metrics used to define their mutual distances. A further crucial factor linked to feature selection is the possibility of obtaining a better physical interpretation of the phenomena underlying the problem addressed. In fact, by optimizing the parameter space, the features capable of solving/characterizing a problem are identified against those redundant or misleading.
These considerations introduce the taxonomy of approaches to feature selection: (i) most-relevant feature selection, i.e., the selection of the smallest parameter space that provides the best accuracy. There are many methods proposed in the literature (cf. Guyon and Elisseeff, 2003), both for prediction and classification problems [Principal Component Analysis (Jolliffe, 1986), leave-one-out, forward selection, backward elimination, Random Forest (Breiman, 2001), PPS (Staiano et al., 2005), Naive-Bayes (Ripley, 1996)]; (ii) all-relevant feature selection, i.e., the identification of the exact space of the parameters that are relevant to a variable extent for the solution of a given problem. Basically, in the second case, a predictive/classification model is more likely to describe the various aspects of a problem, although it is necessary to increase the complexity of the feature selection method.
There are three general classes of feature selection methods. Filters, based on arbitrary measures independent of any forecast/classification model and that are not designed to find complex correlations between features, are unable to solve the all-relevant problem (Gheyas and Smith, 2010). Embedded, which performs the feature selection at the same time of the prediction/classification model training execution, optimizes the feature set to improve accuracy. Such class is naturally designed to solve the most-relevant problem (Guyon and Elisseeff, 2003). Finally there is the Wrapper class, a category in which the selection of features is performed by a dedicated prediction/classification model, in addition to the model used for the prediction or classification training task (Kohavi and John, 1998). As for being specialized, it can use a deeper insight into the data than the filter class. Therefore, it can solve both most- and all-relevant problems.
One of the reasons why the all-relevant problem is more complex, such that only the methods of the wrapper class can address it, is that it is not always possible to use prediction/classification accuracy as a criterion for declaring a feature as not important. Indeed, the degradation of accuracy, upon removing a feature from the parameter space, is sufficient to declare the feature as important, but the lack of this effect is not sufficient to declare it as unimportant. In these cases, nothing can be said about the importance of one feature in combination with the others. Therefore, a more complex method for feature selection is required.
For feature selection in the context of photometric redshifts prediction, early studies relied on a trial-and-error approach. In other words, among the possible features, experiments were performed using all possible combinations of subsets of features, selected according to the prescription of an expert. An alternative was the so-called data driven approach, where a large subset (if not all) of all possible combinations of features are tried and the most performing one is selected, for instance, by using a forward selection algorithm (Guyon and Elisseeff, 2003) in order to identify the best set of feature for a given task (such an approach has been used with good results in Polsterer, 2016; D'Isanto et al., 2018). Brescia et al. (2013) selected the most significant features by trying different combinations of magnitudes derived from a combination of surveys, namely, GALEX (ultra-violet, Martin et al., 2005), SDSS (optical), UKIDSS (near-IR, Lawrence et al., 2007), and WISE (mid-IR, Wright et al., 2010). This approach, however, also adopted by Donalek et al. (2013) and D'Isanto et al. (2016), besides requiring a huge number of experiments and being, therefore, prone to computing limitations, does not ensure that the optimal performances are achieved. A more effective approach is to identify objective grounds for all the features which carry information useful to solve a given problem.
As known, Random Forest is one of the most suitable methods to perform the evaluation of the importance of features. It is mainly composed of a set (forest) of numerous simple predictors/classifiers (i.e., decision trees), each one built from different, randomly selected, combinations of feature subsets and data samples. During the learning phase, which corresponds to the forest tree building, each feature may have the same chance of being included in the decision chain, so even weakly relevant features will be statistically used in the forest construction process. The contribution of any feature can be easily calculated by considering all the trees that include that feature, so the contribution of both highly and weakly relevant features is well visible and measurable. Furthermore, Random Forest has a limited number of hyperparameters and is relatively scalable with the data and parameter space sizes.
Recently, in Brescia et al. (2019) and Delli Veneri et al. (2019), ΦLAB (Parameter handling investigation LABoratory), a hybrid method, based on the exploitation of the Random Forest model, was introduced, incorporating properties of both wrapper and embedding categories, thus designed to solve the all-relevant feature selection problem. The basic idea is the conjugation of two techniques, the inclusion within the parameter space of the so-called shadow features (Kursa and Rudnicki, 2010), a randomly noised version of real features and the L1 norm regularization through Naive LASSO statistics (Least Absolute Shrinkage and Selection, Tibshirani, 2013). For instance, in the study by Brescia et al. (2019), this method was evaluated by performing the feature selection on the multi-wavelength catalog of the counterparts to the X-ray selected sources detected in Stripe 82X (LaMassa et al., 2016; Ananna et al., 2017), to compare the quality of photometric redshifts estimations between our ML method, MLPQNA (Brescia et al., 2013), and the SED template fitting, obtained by LePhare (Arnouts et al., 1999; Ilbert et al., 2006). The optimization of the parameter space, composed in the specific case of magnitudes and colors, enabled the extraction of a complete subset of high and weak relevant features capable of guaranteeing high precision in the estimation of redshifts and, at the same time, avoiding the degeneration of performance induced by the occurrence of redundant information, together with the simplification of the problem by reducing the size of the space of the photometric parameters.
As shown in Figure 9, the results of the all-relevant feature selection confirm an usual trend within the photometric redshift prediction cases, which has an intrinsic physical motivation. By considering a multi-wavelength parameter space composed only by magnitudes, the K band is, by far, the most relevant feature. This can be easily motivated by considering that this rest-frame band corresponds to the knee of the galaxy SED, thus making it most suitable to determine the redshift than other bands. However, the relevance of this band and of magnitudes, in general, drastically changes by introducing the continuous information carried by colors, which become the most relevant features. In fact, by looking at the right panel of Figure 9, the first four features collect more than 60% of the total feature importance carried by the whole parameter space.
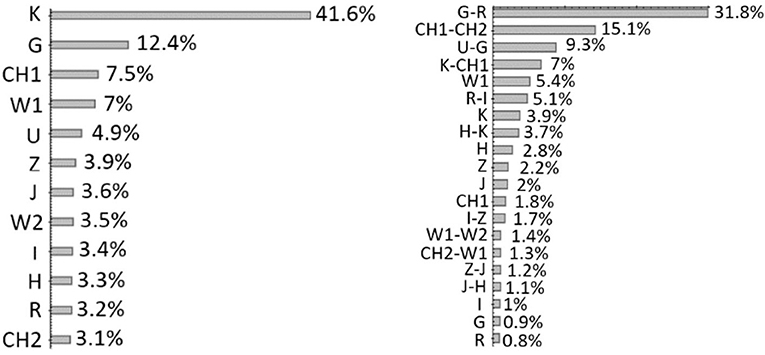
Figure 9. Figure from Brescia et al. (2019). (Left) Results of the feature analysis performed with ΦLAB. The importance of each feature is estimated for the case in which only magnitudes are considered for the sample. (Right) The case in which a mixed parameter space (magnitudes and colors) is considered.
The reduction of the number of dimensions in a parameter space is convenient not only from the point of view of simplifying the computing complexity but also, and above all, to overcome the well-known problem of the curse of dimensionality (Bishop, 2006), in which ML models exhibit a performance degradation when the number of features in the data representation space becomes significantly higher than the optimal one.
3.6. Why Not Take Advantage of Astronomical Images?
As evidenced from previous discussions, photometric redshifts are characterized by two main limitations. First, their precision decreases as the true redshift increases and, second, photometric redshifts are affected by the degeneracy between photometric colors and the spectroscopic redshifts, which means that, within the source catalogs, there are a plenty of objects sharing same color band ranges but at different redshift.
For such objects, any supervised ML method, working with a photometric parameter space restricted to magnitudes and derived colors, would be hopelessly induced into confusion. Therefore, as also stated by Hildebrandt et al. (2012), one of the strongest limiting factor of both empirical and SED fitting techniques is the input information type used, i.e., the photometric measurements. They are directly affected by blending sources, variations of the Point Spread Function, being driven by the chosen aperture sizes or by the magnitude models, which were able to bring a limited fraction of the information that is potentially available from observed images.
The recent widespread diffusion of the deep learning paradigm (Lecun et al., 2015) also involved various fields of Astrophysics, from the morphological classification within a population of galaxies, to strong lensing, time domain astronomy and cluster membership recognition (Dieleman et al., 2015; Pasquet-Itam and Pasquet, 2018; Metcalf et al., 2019; Angora et al., 2020).
In a deep learning model, both tasks of extraction of the input parameter space and the self-adaptive optimization are embedded into a single model. The first task is performed by the deep part of the model through a series of convolutions with specific filters and pooling operations, while the last smaller part of the hierarchical architecture is dedicated to the optimization task, which can be performed by any kind of traditional ML model. The outstanding property of deep learning to automatically extract features from images, like color gradients, disk inclination, peculiar shapes, size, and surface brightness of galaxies, opens a new and very promising perspective in the photo-z estimation field, becoming an efficient alternative to the manual feature selection, in particular by avoiding biases introduced during manual extraction and selection. There are already several studies proposed in this respect, reaching high photo-z accuracy, at least competitive with other ML techniques based on boosted decision tree, feed-forward neural networks, or random forest. Chong and Yang (2019) proposed a convolutional neural network (CNN) to predict galaxy morphological shapes, provided through Galaxy Zoo (Willett et al., 2013), to determine accurate photometric redshifts. Hoyle (2016) exploited a CNN on multi-color SDSS galaxy images, by splitting the spectroscopic redshift distribution into several bins, deriving a probability for any source to belong to those bins and assigning its redshift based on the most likely bin. An hybrid deep learning/ML, based on the combined use of a CNN and a mixture density network, was the choice of D'Isanto and Polsterer (2018) to obtain accurate photo-z from SDSS image cutouts and colors, derived by a pairwise subtraction of images, of galaxies and quasars. The five band images from the flux-limited spectroscopic main galaxy sample (MGS) of the SDSS were used as input data of a CNN by Pasquet et al. (2019) for photo-z estimation. We take this case to highlight an interesting property of deep learning applied to photometric redshift estimation.
As it is shown in Figure 10, presented in Pasquet et al. (2019), the CNN predicts photo-z estimated slightly outside the median redshift of the training sample. This implies the presence of a residual bias toward the most crowd redshift bins. However, such bias appears strongly limited in 1σ, significantly smaller than the bias induced by the kNN method, used for direct comparison. In particular, no bias as a direct function of photo-z (such as galactic extinction or galaxy inclination) was found.
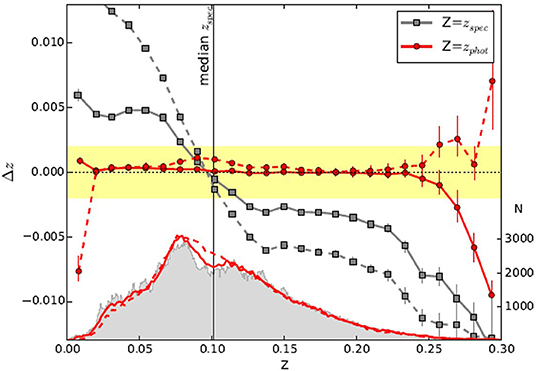
Figure 10. Figure from Pasquet et al. (2019). The bias as a function of both spectroscopic (gray) and photometric redshifts predicted by the CNN (red), with the corresponding redshift distributions and the comparison of results with that of Beck et al. (2016). The yellow shaded zone represents the requirement for Euclid (Δz ≤ 0.002) in photometric redshift bins.
The application of deep learning is to be considered a prerogative extremely suitable for large survey projects, although it still needs to be validated by comparing deep learning with more accurate ML models and by performing a double check between image and tabular features.
4. Conclusions and Perspectives
Astronomy is, by definition, a data-intensive science, especially by considering the incoming and future photometric survey projects, such as LSST, Euclid, and JWST, all of which are examples that will require data processing and storage solutions in peta- and exa-scale regimes. In such a context, data-driven approaches are not an option, and a massive exploitation of deep learning paradigms seems to be the only chance to provide feasible solutions for analyzing those datasets. The massive exploitation of deep learning could open the possibility to predict photometric redshifts at the pixel level of calibrated images, instead of just using the limited and biased information carried by pre-processed catalogs. An indirect benefit of such strategy would also minimize the serious problem of the right selection of the photometric space, having to choose among different apertures, psf or model magnitudes, luptitudes (Lupton et al., 1999), derived colors, or magnitude ratios (D'Isanto et al., 2018).
Using fully data-driven methods, such as unsupervised models, it is possible to identify regions of the multidimensional feature space in which every single method performs better, thus providing important insights not only on the methods themselves but also within the parameter space at different redshift regimes. Moreover, the data-driven paradigm can be successfully employed to verify the right coverage balance between photometric and spectroscopic spaces, to perform combined predictions of distances and galaxy physical parameters, as well as to disentangle different error contributions to the training data.
We are convinced that the present and future trends, driven by the demanding initiatives of large photometric surveys, are based on the photo-z challenges, in which several methods are carefully evaluated in a common and standardized framework, including same real/simulated training and blind testing data, as well as metrics, to evaluate the strengths and weaknesses of each proposed solution. This is perfectly aligned with the recent satisfactory efforts to identify hybrid solutions, based on the combined use of empirical models, SED fitting methods, and Bayesian statistics, showing that the best solution to optimize the quality of photo-z is to mediate the different prerogatives, in order to exploit, at best, the different useful sources of information.
Author Contributions
MB, SC, and GL oversaw the structuring and editing of the article. In particular, VA contributed to the sections 2.1 and 2.4. OR contributed to the sections 1 and 3 and GR contributed to the sections 3 and 3.5. All authors contributed to the bibliography search and selection.
Funding
MB acknowledges the funding from INAF PRIN-SKA 2017 program 1.05.01.88.04. MB and GR acknowledge the financial contribution from the agreement ASI/INAF 2018-23-HH.0, Euclid ESA mission—Phase D. SC acknowledges the funding from Fondo di Finanziamento per le Attività Base di Ricerca (FFABR 2017).
Conflict of Interest
The authors declare that the research was conducted in the absence of any commercial or financial relationships that could be construed as a potential conflict of interest.
Acknowledgments
The authors wish to warmly thank the colleagues Micol Bolzonella, Raffaele D'Abrusco, Antonio D'Isanto, Amata Mercurio, Mara Salvato, and Crescenzo Tortora for their contribution in many studies and for their valuable suggestions in long and passionate discussions and exchanges of ideas. Furthermore, the authors acknowledge various contributions to their study offered by the survey projects CLASH-VLT, KiDS, Euclid, and LSST and their communities, in which most of the authors are involved.
Footnotes
1. ^See https://www.sdss.org/dr12/algorithms/magnitudes for further details.
References
Abdalla, F. B., Banerji, M., Lahav, O., and Rashkov, V. (2011). A comparison of six photometric redshift methods applied to 1.5 million luminous red galaxies. Mon. Not. RAS 417, 1891–1903. doi: 10.1111/j.1365-2966.2011.19375.x
Abrahamse, A., Knox, L., Schmidt, S., Thorman, P., Tyson, J. A., and Zhan, H. (2011). Characterizing and propagating modeling uncertainties in photometrically derived redshift distributions. Astrophys. J. 734:36. doi: 10.1088/0004-637X/734/1/36
Aihara, H., Arimoto, N., Armstrong, R., Arnouts, S., Bahcall, N. A., Bickerton, S., et al. (2018). The hyper suprime-cam ssp survey: overview and survey design. Publ. ASJ 70:S4. doi: 10.1093/pasj/psx066
Almosallam, I. A., Lindsay, S. N., Jarvis, M. J., and Roberts, S. J. (2016). A sparse Gaussian process framework for photometric redshift estimation. Mon. Not. RAS 455, 2387–2401. doi: 10.1093/mnras/stv2425
Amaro, V., Cavuoti, S., Brescia, M., Vellucci, C., Longo, G., Bilicki, M., et al. (2019). Statistical analysis of probability density functions for photometric redshifts through the KiDS-ESO-DR3 galaxies. Mon. Not. RAS 482, 3116–3134. doi: 10.1093/mnras/sty2922
Ananna, T. T., Salvato, M., LaMassa, S., Urry, C. M., Cappelluti, N., Cardamone, C., et al. (2017). AGN populations in large-volume X-ray surveys: photometric redshifts and population types found in the stripe 82X survey. Astrophys. J. 850:66. doi: 10.3847/1538-4357/aa937d
Angora, G., Rosati, P., Brescia, M., Mercurio, A., Grillo, C., Caminha, G., et al. (2020). The search for galaxy cluster members with deep learning of panchromatic HST imaging and extensive spectroscopy. Astron. Astrophys. 643:A177. doi: 10.1051/0004-6361/202039083
Ansari, Z., Agnello, A., and Gall, C. (2020). Mixture models for photometric redshifts. arXiv 2010.07319. doi: 10.1051/0004-6361/202039675
Arnouts, S., Cristiani, S., Moscardini, L., Matarrese, S., Lucchin, F., Fontana, A., et al. (1999). Measuring and modelling the redshift evolution of clustering: the Hubble Deep Field North. Mon. Not. RAS 310, 540–556. doi: 10.1046/j.1365-8711.1999.02978.x
Baron, D., and Poznanski, D. (2017). The weirdest SDSS galaxies: results from an outlier detection algorithm. Mon. Not. RAS 465, 4530–4555. doi: 10.1093/mnras/stw3021
Baum, W. A. (1962). “Photoelectric magnitudes and red-shifts,” in Problems of Extra-Galactic Research, Vol. 15, ed G. C. McVittie (New York, NY: Macmillan Press), 390.
Beck, R., Dobos, L., Budavári, T., Szalay, A. S., and Csabai, I. (2016). Photometric redshifts for the SDSS Data Release 12. Mon. Not. RAS 460, 1371–1381. doi: 10.1093/mnras/stw1009
Benítez, N. (2000). Bayesian photometric redshift estimation. Astrophys. J. 536, 571–583. doi: 10.1086/308947
Bilicki, M., Hoekstra, H., Brown, M. J. I., Amaro, V., Blake, C., Cavuoti, S., et al. (2018). Photometric redshifts for the Kilo-Degree survey. Machine-learning analysis with artificial neural networks. Astron. Astrophys. 616:A69. doi: 10.1051/0004-6361/201731942
Bishop, C. M. (2006). Pattern Recognition and Machine Learning (Information Science and Statistics). Secaucus, NJ: Springer-Verlag New York, Inc.
Bisigello, L., Kuchner, U., Conselice, C. J., Andreon, S., Bolzonella, M., Duc, P. A., et al. (2020). Euclid: the selection of quiescent and star-forming galaxies using observed colours. Mon. Not. RAS 494, 2337–2354. doi: 10.1093/mnras/staa885
Biviano, A., Rosati, P., Balestra, I., Mercurio, A., Girardi, M., Nonino, M., et al. (2013). CLASH-VLT: the mass, velocity-anisotropy, and pseudo-phase-space density profiles of the z = 0.44 galaxy cluster MACS J1206.2–0847. Astron. Astrophys. 558:A1. doi: 10.1051/0004-6361/201321955
Blake, C., and Bridle, S. (2005). Cosmology with photometric redshift surveys. Mon. Not. RAS 363, 1329–1348. doi: 10.1111/j.1365-2966.2005.09526.x
Bolzonella, M., Miralles, J. M., and Pelló, R. (2000). Photometric redshifts based on standard SED fitting procedures. Astron. Astrophys. 363, 476–492.
Bonfield, D. G., Sun, Y., Davey, N., Jarvis, M. J., Abdalla, F. B., Banerji, M., et al. (2010). Photometric redshift estimation using Gaussian processes. Mon. Not. RAS 405, 987–994. doi: 10.1111/j.1365-2966.2010.16544.x
Bonjean, V., Aghanim, N., Salomé, P., Beelen, A., Douspis, M., and Soubrié, E. (2019). Star formation rates and stellar masses from machine learning. Astron. Astrophys. 622:A137. doi: 10.1051/0004-6361/201833972
Bonnett, C. (2015). Using neural networks to estimate redshift distributions. An application to CFHTLenS. Mon. Not. RAS 449, 1043–1056. doi: 10.1093/mnras/stv230
Bonnett, C., Troxel, M. A., Hartley, W., Amara, A., Leistedt, B., Becker, M. R., et al. (2016). Redshift distributions of galaxies in the Dark Energy Survey Science Verification shear catalogue and implications for weak lensing. Phys. Rev. D 94:042005. doi: 10.1103/PhysRevD.94.042005
Bordoloi, R., Lilly, S. J., and Amara, A. (2010). Photo-z performance for precision cosmology. Mon. Not. RAS 406, 881–895. doi: 10.1111/j.1365-2966.2010.16765.x
Bovy, J., Myers, A. D., Hennawi, J. F., Hogg, D. W., McMahon, R. G., Schiminovich, D., et al. (2012). Photometric redshifts and quasar probabilities from a single, data-driven generative model. Astrophys. J. 749:41. doi: 10.1088/0004-637X/749/1/41
Brammer, G. B., van Dokkum, P. G., and Coppi, P. (2008). EAZY: a fast, public photometric redshift code. Astrophys. J. 686, 1503–1513. doi: 10.1086/591786
Brescia, M., Cavuoti, S., D'Abrusco, R., Longo, G., and Mercurio, A. (2013). Photometric redshifts for quasars in multi-band surveys. Astrophys. J. 772:140. doi: 10.1088/0004-637X/772/2/140
Brescia, M., Cavuoti, S., and Longo, G. (2015). Automated physical classification in the SDSS DR10. A catalogue of candidate quasars. Mon. Not. RAS 450, 3893–3903. doi: 10.1093/mnras/stv854
Brescia, M., Cavuoti, S., Longo, G., and De Stefano, V. (2014). A catalogue of photometric redshifts for the SDSS-DR9 galaxies. Astron. Astrophys. 568:A126. doi: 10.1051/0004-6361/201424383
Brescia, M., Salvato, M., Cavuoti, S., Ananna, T. T., Riccio, G., LaMassa, S. M., et al. (2019). Photometric redshifts for X-ray-selected active galactic nuclei in the erosita era. Mon. Not. RAS 489, 663–680. doi: 10.1093/mnras/stz2159
Brinchmann, J., Charlot, S., White, S. D. M., Tremonti, C., Kauffmann, G., Heckman, T., et al. (2004). The physical properties of star-forming galaxies in the low-redshift Universe. Mon. Not. RAS 351, 1151–1179. doi: 10.1111/j.1365-2966.2004.07881.x
Budavári, T., Csabai, I., Szalay, A. S., Connolly, A. J., Szokoly, G. P., Vanden Berk, D. E., et al. (2001). Photometric redshifts from reconstructed Quasar templates. Astron. J. 122:1163–1171. doi: 10.1086/322131
Butchins, S. A. (1981). Predicted redshifts of galaxies by broadband photometry. Astron. Astrophys. 97, 407–409.
Calzetti, D. (2015). “The scaling of star formation: from molecular clouds to galaxies,” in Galaxies in 3D Across the Universe, Vol. 309, eds B. L. Ziegler, F. Combes, H. Dannerbauer, and M. Verdugo (Cambridge: Cambridge University Press), 121–128. doi: 10.1017/S1743921314009442
Calzetti, D., Liu, G., and Koda, J. (2012). Star formation laws: the effects of gas cloud sampling. Astrophys. J. 752:98. doi: 10.1088/0004-637X/752/2/98
Carrasco Kind, M. (2015). Probabilistic photometric redshifts in the era of petascale astronomy (Ph.D. thesis), University of Illinois at Urbana-Champaign, Champaign, IL, United States.
Carrasco Kind, M., and Brunner, R. J. (2013). TPZ: photometric redshift PDFs and ancillary information by using prediction trees and random forests. Mon. Not. RAS 432, 1483–1501. doi: 10.1093/mnras/stt574
Carrasco Kind, M., and Brunner, R. J. (2014a). Exhausting the information: novel Bayesian combination of photometric redshift PDFs. Mon. Not. RAS 442, 3380–3399. doi: 10.1093/mnras/stu1098
Carrasco Kind, M., and Brunner, R. J. (2014b). SOMz: photometric redshift PDFs with self-organizing maps and random atlas. Mon. Not. RAS 438, 3409–3421. doi: 10.1093/mnras/stt2456
Cavuoti, S., Amaro, V., Brescia, M., Vellucci, C., Tortora, C., and Longo, G. (2017a). METAPHOR: a machine-learning-based method for the probability density estimation of photometric redshifts. Mon. Not. RAS 465, 1959–1973. doi: 10.1093/mnras/stw2930
Cavuoti, S., Brescia, M., D'Abrusco, R., Longo, G., and Paolillo, M. (2014). Photometric classification of emission line galaxies with machine-learning methods. Mon. Not. RAS 437, 968–975. doi: 10.1093/mnras/stt1961
Cavuoti, S., Brescia, M., Longo, G., and Mercurio, A. (2012). Photometric redshifts with the quasi Newton algorithm (MLPQNA) results in the PHAT1 contest. Astron. Astrophys. 546:A13. doi: 10.1051/0004-6361/201219755
Cavuoti, S., Brescia, M., Tortora, C., Longo, G., Napolitano, N. R., Radovich, M., et al. (2015). Machine-learning-based photometric redshifts for galaxies of the ESO Kilo-Degree survey data release 2. Mon. Not. RAS 452, 3100–3105. doi: 10.1093/mnras/stv1496
Cavuoti, S., Tortora, C., Brescia, M., Longo, G., Radovich, M., Napolitano, N. R., et al. (2017b). A cooperative approach among methods for photometric redshifts estimation: an application to KiDS data. Mon. Not. RAS 466, 2039–2053. doi: 10.1093/mnras/stw3208
Chong, K., and Yang, A. (2019). Photometric redshift analysis using supervised learning algorithms and deep learning. EPJ Web Conf. 206:09006. doi: 10.1051/epjconf/201920609006
Collister, A. A., and Lahav, O. (2004). ANNz: estimating photometric redshifts using artificial neural networks. Publ. ASP 116, 345–351. doi: 10.1086/383254
Connolly, A. J., Csabai, I., Szalay, A. S., Koo, D. C., Kron, R. G., and Munn, J. A. (1995). Slicing through multicolor space: galaxy redshifts from broadband photometry. Astron. J. 110:2655. doi: 10.1086/117720
Csabai, I., Budavári, T., Connolly, A. J., Szalay, A. S., Győry, Z., Benítez, N., et al. (2003). The application of photometric redshifts to the SDSS early data release. Astron. J. 125, 580–592. doi: 10.1086/345883
Cunha, C. E., Lima, M., Oyaizu, H., Frieman, J., and Lin, H. (2009). Estimating the redshift distribution of photometric galaxy samples–II. Applications and tests of a new method. Mon. Not. RAS 396, 2379–2398. doi: 10.1111/j.1365-2966.2009.14908.x
Curran, S. J. (2020). QSO photometric redshifts from SDSS, WISE, and GALEX colours. Mon. Not. RAS 493, L70–L75. doi: 10.1093/mnrasl/slaa012
D'Abrusco, R., Staiano, A., Longo, G., Brescia, M., Paolillo, M., De Filippis, E., et al. (2007). Mining the SDSS archive. I. Photometric redshifts in the nearby universe. Astrophys. J. 663, 752–764. doi: 10.1086/518020
de Jong, J. T. A., Kuijken, K., Applegate, D., Begeman, K., Belikov, A., Blake, C., et al. (2013). The Kilo-Degree survey. Messenger 154, 44–46. doi: 10.1007/s10686-012-9306-1
de Jong, J. T. A., Verdoes Kleijn, G. A., Boxhoorn, D. R., Buddelmeijer, H., Capaccioli, M., Getman, F., et al. (2015). The first and second data releases of the Kilo-Degree survey. Astron. Astrophys. 582:A62. doi: 10.1051/0004-6361/201526601
de Jong, J. T. A., Verdoes Kleijn, G. A., Erben, T., Hildebrandt, H., Kuijken, K., Sikkema, G., et al. (2017). The third data release of the Kilo-Degree survey and associated data products. Astron. Astrophys. 604:A134. doi: 10.1051/0004-6361/201730747
Delli Veneri, M., Cavuoti, S., Brescia, M., Longo, G., and Riccio, G. (2019). Star formation rates for photometric samples of galaxies using machine learning methods. Mon. Not. RAS 486, 1377–1391. doi: 10.1093/mnras/stz856
Dieleman, S., Willett, K. W., and Dambre, J. (2015). Rotation-invariant convolutional neural networks for galaxy morphology prediction. Mon. Not. RAS 450, 1441–1459. doi: 10.1093/mnras/stv632
D'Isanto, A., Cavuoti, S., Brescia, M., Donalek, C., Longo, G., Riccio, G., et al. (2016). An analysis of feature relevance in the classification of astronomical transients with machine learning methods. Mon. Not. RAS 457, 3119–3132. doi: 10.1093/mnras/stw157
D'Isanto, A., Cavuoti, S., Gieseke, F., and Polsterer, K. L. (2018). Return of the features. Efficient feature selection and interpretation for photometric redshifts. Astron. Astrophys. 616:A97. doi: 10.1051/0004-6361/201833103
D'Isanto, A., and Polsterer, K. L. (2018). Photometric redshift estimation via deep learning. Generalized and pre-classification-less, image based, fully probabilistic redshifts. Astron. Astrophys. 609:A111. doi: 10.1051/0004-6361/201731326
Donalek, C., Arun Kumar, A., Djorgovski, S. G., Mahabal, A. A., Graham, M. J., Fuchs, T. J., et al. (2013). Feature selection strategies for classifying high dimensional astronomical data sets. arXiv 1310.1976. doi: 10.1109/BigData.2013.6691731
Driver, S. P., Hill, D. T., Kelvin, L. S., Robotham, A. S. G., Liske, J., Norberg, P., et al. (2011). Galaxy and Mass Assembly (GAMA): survey diagnostics and core data release. Mon. Not. RAS 413, 971–995. doi: 10.1111/j.1365-2966.2010.18188.x
Duncan, K. J., Brown, M. J. I., Williams, W. L., Best, P. N., Buat, V., Burgarella, D., et al. (2018). Photometric redshifts for the next generation of deep radio continuum surveys–I. Template fitting. Mon. Not. RAS 473, 2655–2672. doi: 10.1093/mnras/stx2536
Ejaz Awan, S., Bennamoun, M., Sohel, F., Sanfilippo, F. M., and Dwivedi, G. (2020). Imputation of missing data with class imbalance using conditional generative adversarial networks. arXiv 2012.00220. doi: 10.1016/j.neucom.2021.04.010
Eriksen, M., Alarcon, A., Gaztanaga, E., Amara, A., Cabayol, L., Carretero, J., et al. (2019). The PAU survey: early demonstration of photometric redshift performance in the COSMOS field. Mon. Not. RAS 484, 4200–4215. doi: 10.1093/mnras/stz204
Euclid Collaboration, Desprez, G., Paltani, S., Coupon, J., Almosallam, I., Alvarez-Ayllon, A., Amaro, V., et al. (2020). Euclid preparation. X. The Euclid photometric-redshift challenge. Astron. Astrophys. 644:A31. doi: 10.1051/0004-6361/202039403
Feroz, F., Hobson, M. P., Cameron, E., and Pettitt, A. N. (2019). Importance nested sampling and the multinest algorithm. Open J. Astrophys. 2:10. doi: 10.21105/astro.1306.2144
Firth, A. E., Lahav, O., and Somerville, R. S. (2003). Estimating photometric redshifts with artificial neural networks. Mon. Not. RAS 339, 1195–1202. doi: 10.1046/j.1365-8711.2003.06271.x
Fluke, C. J., and Jacobs, C. (2020). Surveying the reach and maturity of machine learning and artificial intelligence in astronomy. WIREs Data Mining Knowl. Discov. 10:e1349. doi: 10.1002/widm.1349
Fotopoulou, S., and Paltani, S. (2018). CPz: classification-aided photometric-redshift estimation. Astron. Astrophys. 619:A14. doi: 10.1051/0004-6361/201730763
Fu, L., Liu, D., Radovich, M., Liu, X., Pan, C., Fan, Z., et al. (2018). Weak-lensing study in VOICE survey–I. Shear measurement. Mon. Not. RAS 479, 3858–3872. doi: 10.1093/mnras/sty1579
Gheyas, I. A., and Smith, L. S. (2010). Feature subset selection in large dimensionality domains. Pattern Recogn. 43, 5–13. doi: 10.1016/j.patcog.2009.06.009
Goodman, J., and Weare, J. (2010). Ensemble samplers with affine invariance. Commun. Appl. Math. Comput. Sci. 5, 65–80. doi: 10.2140/camcos.2010.5.65
Graham, M. L., Connolly, A. J., Ivezić, Ž., Schmidt, S. J., Jones, R. L., Jurić, M., et al. (2018). Photometric redshifts with the LSST: evaluating survey observing strategies. Astron. J. 155:1. doi: 10.3847/1538-3881/aa99d4
Green, J., Schechter, P., Baltay, C., Bean, R., Bennett, D., Brown, R., et al. (2012). Wide-field infrared survey telescope (WFIRST) final report. arXiv 1208.4012.
Guyon, I., and Elisseeff, A. (2003). An introduction to variable and feature selection. J. Mach. Learn. Res. 3, 1157–1182.
Han, B., Ding, H., Zhang, Y., and Zhao, Y. (2016). Improving accuracy of Quasars' photometric redshift estimation by integration of KNN and SVM. IAU Focus Meeting 29A:209. doi: 10.1017/S1743921316002830
Hasinger, G., Capak, P., Salvato, M., Barger, A. J., Cowie, L. L., Faisst, A., et al. (2018). The DEIMOS 10K spectroscopic survey catalog of the COSMOS field. Astrophys. J. 858:77. doi: 10.3847/1538-4357/aabacf
Hildebrandt, H., Arnouts, S., Capak, P., Moustakas, L. A., Wolf, C., Abdalla, F. B., et al. (2010). Phat: photo-z accuracy testing. Astron. Astrophys. 523:A31. doi: 10.1051/0004-6361/201014885
Hildebrandt, H., Erben, T., Kuijken, K., van Waerbeke, L., Heymans, C., Coupon, J., et al. (2012). CFHTLenS: improving the quality of photometric redshifts with precision photometry. Mon. Not. RAS 421, 2355–2367. doi: 10.1111/j.1365-2966.2012.20468.x
Hildebrandt, H., Viola, M., Heymans, C., Joudaki, S., Kuijken, K., Blake, C., et al. (2017). KiDS-450: cosmological parameter constraints from tomographic weak gravitational lensing. Mon. Not. RAS 465, 1454–1498. doi: 10.1093/mnras/stw2805
Hoyle, B. (2016). Measuring photometric redshifts using galaxy images and deep neural networks. Astron. Comput. 16, 34–40. doi: 10.1016/j.ascom.2016.03.006
Hoyle, B., Rau, M. M., Paech, K., Bonnett, C., Seitz, S., and Weller, J. (2015). Anomaly detection for machine learning redshifts applied to SDSS galaxies. Mon. Not. RAS 452, 4183–4194. doi: 10.1093/mnras/stv1551
Ilbert, O., Arnouts, S., McCracken, H. J., Bolzonella, M., Bertin, E., Le Fèvre, O., et al. (2006). Accurate photometric redshifts for the CFHT legacy survey calibrated using the VIMOS VLT deep survey. Astron. Astrophys. 457, 841–856. doi: 10.1051/0004-6361:20065138
Jarvis, M. J., Bonfield, D. G., Bruce, V. A., Geach, J. E., McAlpine, K., McLure, R. J., et al. (2013). The VISTA deep extragalactic observations (VIDEO) survey. Mon. Not. RAS 428, 1281–1295. doi: 10.1093/mnras/sts118
Jones, E., and Singal, J. (2017). Analysis of a custom support vector machine for photometric redshift estimation and the inclusion of galaxy shape information. Astron. Astrophys. 600:A113. doi: 10.1051/0004-6361/201629558
Jouvel, S., Delubac, T., Comparat, J., Camacho, H., Carnero, A., Abdalla, F. B., et al. (2017). Photometric redshifts and clustering of emission line galaxies selected jointly by DES and eBOSS. Mon. Not. RAS 469, 2771–2790. doi: 10.1093/mnras/stx163
Karman, W., Caputi, K. I., Grillo, C., Balestra, I., Rosati, P., Vanzella, E., et al. (2015). MUSE integral-field spectroscopy towards the Frontier Fields cluster Abell S1063. I. Data products and redshift identifications. Astron. Astrophys. 574:A11. doi: 10.1051/0004-6361/201424962
Kauffmann, O. B., Le Fèvre, O., Ilbert, O., Chevallard, J., Williams, C. C., Curtis-Lake, E., et al. (2020). Simulating JWST deep extragalactic imaging surveys and physical parameter recovery. Astron. Astrophys. 640:A67. doi: 10.1051/0004-6361/202037450
Knox, L., Song, Y.-S., and Zhan, H. (2006). Weighing the universe with photometric redshift surveys and the impact on dark energy forecasts. Astrophys. J. 652, 857–863. doi: 10.1086/508605
Kohavi, R., and John, G. H. (1998). “The wrapper approach,” in Feature Extraction, Construction and Selection: A Data Mining Perspective, Chapter 3, eds H. Liu and H. Motoda (Boston, MA: Springer US), 33–50. doi: 10.1007/978-1-4615-5725-8_3
Kohonen, T. (1982). Self-organized formation of topologically correct feature maps. Biol. Cybernet. 43, 59–69. doi: 10.1007/BF00337288
Kohonen, T., and Mäkisara, K. (1989). The self-organizing feature maps. Phys. Scripta 39, 168–172. doi: 10.1088/0031-8949/39/1/027
Kuijken, K., Heymans, C., Hildebrandt, H., Nakajima, R., Erben, T., de Jong, J. T. A., et al. (2015). Gravitational lensing analysis of the Kilo-Degree survey. Mon. Not. RAS 454, 3500–3532. doi: 10.1093/mnras/stv2140
Kursa, M., and Rudnicki, W. (2010). Feature selection with the boruta package. J. Stat. Softw. 36, 1–13. doi: 10.18637/jss.v036.i11
Laigle, C., McCracken, H. J., Ilbert, O., Hsieh, B. C., Davidzon, I., Capak, P., et al. (2016). The COSMOS2015 catalog: exploring the 1 < z < 6 universe with half a million galaxies. Astrophys. J. Suppl. 224:24. doi: 10.3847/0067-0049/224/2/24
LaMassa, S. M., Urry, C. M., Cappelluti, N., Böhringer, H., Comastri, A., Glikman, E., et al. (2016). The 31 Deg2 release of the Stripe 82 X-ray survey: the point source catalog. Astrophys. J. 817:172. doi: 10.3847/0004-637X/817/2/172
LaMassa, S. M., Urry, C. M., Cappelluti, N., Civano, F., Ranalli, P., Glikman, E., et al. (2013a). Finding rare AGN: XMM-Newton and Chandra observations of SDSS Stripe 82. Mon. Not. RAS 436, 3581–3601. doi: 10.1093/mnras/stt1837
LaMassa, S. M., Urry, C. M., Glikman, E., Cappelluti, N., Civano, F., Comastri, A., et al. (2013b). Finding rare AGN: X-ray number counts of Chandra sources in Stripe 82. Mon. Not. RAS 432, 1351–1360. doi: 10.1093/mnras/stt553
Laureijs, R., Amiaux, J., Arduini, S., Auguères, J. N., Brinchmann, J., Cole, R., et al. (2011). Euclid definition study report. arXiv 1110.3193.
Laurino, O., D'Abrusco, R., Longo, G., and Riccio, G. (2011). Astroinformatics of galaxies and quasars: a new general method for photometric redshifts estimation. Mon. Not. RAS 418, 2165–2195. doi: 10.1111/j.1365-2966.2011.19416.x
Lawrence, A., Warren, S. J., Almaini, O., Edge, A. C., Hambly, N. C., Jameson, R. F., et al. (2007). The UKIRT infrared deep sky survey (UKIDSS). Mon. Not. RAS 379, 1599–1617. doi: 10.1111/j.1365-2966.2007.12040.x
Le Fèvre, O., Vettolani, G., Garilli, B., Tresse, L., Bottini, D., Le Brun, V., et al. (2005). The VIMOS VLT deep survey. First epoch VVDS-deep survey: 11 564 spectra with 17.5 ≤ IAB ≤ 24, and the redshift distribution over 0 ≤ z ≤ 5. Astron. Astrophys. 439, 845–862. doi: 10.1051/0004-6361:20041960
Lecun, Y., Bengio, Y., and Hinton, G. (2015). Deep learning. Nature 521, 436–444. doi: 10.1038/nature14539
Leistedt, B., and Hogg, D. W. (2017). Data-driven, interpretable photometric redshifts trained on heterogeneous and unrepresentative data. Astrophys. J. 838:5. doi: 10.3847/1538-4357/aa6332
LSST Science Collaboration, Abell, P. A., Allison, J., Anderson, S. F., Andrew, J. R., Angel, J. R. P., et al. (2009). LSST science book, version 2.0. arXiv 0912.0201.
Lupton, R. H., Gunn, J. E., and Szalay, A. S. (1999). A modified magnitude system that produces well-behaved magnitudes, colors, and errors even for low signal-to-noise ratio measurements. Astron. J. 118, 1406–1410. doi: 10.1086/301004
Ma, Z., Hu, W., and Huterer, D. (2006). Effects of photometric redshift uncertainties on weak-lensing tomography. Astrophys. J. 636, 21–29. doi: 10.1086/497068
Malz, A. I., Marshall, P. J., DeRose, J., Graham, M. L., Schmidt, S. J., Wechsler, R., et al. (2018). Approximating Photo-z PDFs for large surveys. Astron. J. 156:35. doi: 10.3847/1538-3881/aac6b5
Mandelbaum, R. (2018). Weak lensing for precision cosmology. Annu. Rev. Astron. Astrophys. 56:393–433. doi: 10.1146/annurev-astro-081817-051928
Mandelbaum, R., Seljak, U., Hirata, C. M., Bardelli, S., Bolzonella, M., Bongiorno, A., et al. (2008). Precision photometric redshift calibration for galaxy-galaxy weak lensing. Mon. Not. RAS 386, 781–806. doi: 10.1111/j.1365-2966.2008.12947.x
Martin, D. C., Fanson, J., Schiminovich, D., Morrissey, P., Friedman, P. G., Barlow, T. A., et al. (2005). The galaxy evolution explorer: a space ultraviolet survey mission. Astrophys. J. Lett. 619, L1–L6. doi: 10.1086/426387
Masters, D., Capak, P., Stern, D., Ilbert, O., Salvato, M., Schmidt, S., et al. (2015). Mapping the galaxy color-redshift relation: optimal photometric redshift calibration strategies for cosmology surveys. Astrophys. J. 813:53. doi: 10.1088/0004-637X/813/1/53
Merloni, A., Predehl, P., Becker, W., Böhringer, H., Boller, T., Brunner, H., et al. (2012). eROSITA science book: mapping the structure of the energetic universe. arXiv 1209.3114.
Meshcheryakov, A. V., Glazkova, V. V., Gerasimov, S. V., and Mashechkin, I. V. (2018). Measuring the probabilistic photometric redshifts of X-ray Quasars based on the quantile regression of ensembles of decision trees. Astron. Lett. 44, 735–753. doi: 10.1134/S1063773718120058
Metcalf, R. B., Meneghetti, M., Avestruz, C., Bellagamba, F., Bom, C. R., Bertin, E., et al. (2019). The strong gravitational lens finding challenge. Astron. Astrophys. 625:A119. doi: 10.1051/0004-6361/201832797
Morrison, C. B., Hildebrandt, H., Schmidt, S. J., Baldry, I. K., Bilicki, M., Choi, A., et al. (2017). The-wizz: clustering redshift estimation for everyone. Mon. Not. RAS 467, 3576–3589. doi: 10.1093/mnras/stx342
Mucesh, S., Hartley, W. G., Palmese, A., Lahav, O., Whiteway, L., Amon, A., et al. (2020). A machine learning approach to galaxy properties: joint redshift–stellar mass probability distributions with random forest. arXiv 2012.05928. doi: 10.1093/mnras/stab164
Myers, A. D., White, M., and Ball, N. M. (2009). Incorporating photometric redshift probability density information into real-space clustering measurements. Mon. Not. RAS 399, 2279–2287. doi: 10.1111/j.1365-2966.2009.15432.x
Nishizawa, A. J., Hsieh, B.-C., Tanaka, M., and Takata, T. (2020). Photometric redshifts for the Hyper Suprime-Cam Subaru strategic program data release 2. arXiv 2003.01511.
Nocedal, J., and Wright, S. J. (2006). Numerical Optimization, 2nd Edn. Springer Series in Operations Research and Financial Engineering. Berlin: Springer.
Norris, R. P., Salvato, M., Longo, G., Brescia, M., Budavari, T., Carliles, S., et al. (2019). A comparison of photometric redshift techniques for large radio surveys. Publ. ASP 131:108004. doi: 10.1088/1538-3873/ab0f7b
Oyaizu, H., Lima, M., Cunha, C. E., Lin, H., and Frieman, J. (2008). Photometric redshift error estimators. Astrophys. J. 689, 709–720. doi: 10.1086/592591
Pasquet, J., Bertin, E., Treyer, M., Arnouts, S., and Fouchez, D. (2019). Photometric redshifts from sdss images using a convolutional neural network. Astron. Astrophys. 621:A26. doi: 10.1051/0004-6361/201833617
Pasquet-Itam, J., and Pasquet, J. (2018). Deep learning approach for classifying, detecting and predicting photometric redshifts of quasars in the Sloan Digital Sky Survey Stripe 82. Astron. Astrophys. 611:A97. doi: 10.1051/0004-6361/201731106
Polsterer, K. L. (2016). Dealing with uncertain multimodal photometric redshift estimations. Proc. Int. Astron. Union 12, 156–165. doi: 10.1017/S1743921316013089
Razim, O., Cavuoti, S., Brescia, M., Riccio, G., Salvato, M., and Longo, G. (2021). Towards reliable photometric redshifts with machine learning methods. Mon. Not. RAS. [Epub ahead of print].
Reis, I., Baron, D., and Shahaf, S. (2019). Probabilistic random forest: a machine learning algorithm for noisy data sets. Astron. J. 157:16. doi: 10.3847/1538-3881/aaf101
Ripley, B. D. (1996). Pattern Recognition and Neural Networks. Cambridge: Cambridge University Press. doi: 10.1017/CBO9780511812651
Rosati, P., Balestra, I., Grillo, C., Mercurio, A., Nonino, M., Biviano, A., et al. (2014). CLASH-VLT: a VIMOS large programme to map the dark matter mass distribution in galaxy clusters and probe distant lensed galaxies. Messenger 158, 48–53.
Rosenblatt, F. (1963). Principles of neurodynamics. Perceptrons and the theory of brain mechanisms. Am. J. Psychol. 76:705. doi: 10.2307/1419730
Roy, N., Napolitano, N. R., La Barbera, F., Tortora, C., Getman, F., Radovich, M., et al. (2018). Evolution of galaxy size-stellar mass relation from the Kilo-Degree survey. Mon. Not. RAS 480, 1057–1080. doi: 10.1093/mnras/sty1917
Sadeh, I., Abdalla, F. B., and Lahav, O. (2016). ANNz2: photometric redshift and probability distribution function estimation using machine learning. Publ. ASP 128:104502. doi: 10.1088/1538-3873/128/968/104502
Salvato, M., Hasinger, G., Ilbert, O., Zamorani, G., Brusa, M., Scoville, N. Z., et al. (2009). Photometric redshift and classification for the XMM-COSMOS sources. Astrophys. J. 690, 1250–1263. doi: 10.1088/0004-637X/690/2/1250
Salvato, M., Ilbert, O., Hasinger, G., Rau, A., Civano, F., Zamorani, G., et al. (2011). Dissecting photometric redshift for active galactic nucleus using XMM- and Chandra-COSMOS samples. Astrophys. J. 742:61. doi: 10.1088/0004-637X/742/2/61
Salvato, M., Ilbert, O., and Hoyle, B. (2019). The many flavours of photometric redshifts. Nat. Astron. 3, 212–222. doi: 10.1038/s41550-018-0478-0
Schmidt, S. J., Malz, A. I., Soo, J. Y. H., Almosallam, I. A., Brescia, M., Cavuoti, S., et al. (2020). Evaluation of probabilistic photometric redshift estimation approaches for the rubin observatory legacy survey of space and time (LSST). Mon. Not. RAS 499, 1587–1606. doi: 10.1093/mnras/staa2799
Scodeggio, M., Guzzo, L., Garilli, B., Granett, B. R., Bolzonella, M., de la Torre, S., et al. (2018). The VIMOS public extragalactic redshift survey (VIPERS). Full spectroscopic data and auxiliary information release (PDR-2). Astron. Astrophys. 609:A84. doi: 10.1051/0004-6361/201630114
Scognamiglio, D., Tortora, C., Spavone, M., Spiniello, C., Napolitano, N. R., D'Ago, G., et al. (2020). Building the largest spectroscopic sample of ultracompact massive galaxies with the Kilo Degree survey. Astrophys. J. 893:4. doi: 10.3847/1538-4357/ab7db3
Scoville, N., Aussel, H., Brusa, M., Capak, P., Carollo, C. M., Elvis, M., et al. (2007). The cosmic evolution survey (COSMOS): overview. Astrophys. J. Suppl. Series 172, 1–8. doi: 10.1086/516585
Seillier-Moiseiwitsch, F. (1993). Sequential probability forecasts and the probability integral transform. Int. Stat. Rev. 61, 395–408. doi: 10.2307/1403751
Sheldon, E. S., Cunha, C. E., Mandelbaum, R., Brinkmann, J., and Weaver, B. A. (2012). Photometric redshift probability distributions for galaxies in the SDSS DR8. Astrophys. J. Suppl. 201:32. doi: 10.1088/0067-0049/201/2/32
Soo, J. Y. H., Joachimi, B., Eriksen, M., Siudek, M., Alarcon, A., Cabayol, L., et al. (2021). The PAU survey: narrowband photometric redshifts using Gaussian processes. arXiv 2101.03723. doi: 10.1093/mnras/stab711
Staiano, A., Ciaramella, A., De Vinco, L., Donalek, C., Longo, G., Raiconi, G., et al. (2005). “Visualization, clustering and classification of multidimensional astronomical data,” in Seventh International Workshop on Computer Architecture for Machine Perception (CAMP'05) (New York, NY), 141–146. doi: 10.1109/CAMP.2005.54
Stensbo-Smidt, K., Gieseke, F., Igel, C., Zirm, A., and Steenstrup Pedersen, K. (2017). Sacrificing information for the greater good: how to select photometric bands for optimal accuracy. Mon. Not. RAS 464, 2577–2596. doi: 10.1093/mnras/stw2476
Tagliaferri, R., Longo, G., Andreon, S., Capozziello, S., Donalek, C., and Giordano, G. (2003). “Neural networks for photometric redshifts evaluation,” in Neural Nets, eds B. Apolloni, M. Marinaro, and R. Tagliaferri (Berlin; Heidelberg: Springer Berlin Heidelberg), 226–234. doi: 10.1007/978-3-540-45216-4_26
Tanaka, M., Coupon, J., Hsieh, B.-C., Mineo, S., Nishizawa, A. J., Speagle, J., et al. (2018). Photometric redshifts for Hyper Suprime-Cam Subaru strategic program data release 1. Publ. ASJ 70:S9. doi: 10.1093/pasj/psx077
Tibshirani, R. J. (2013). The lasso problem and uniqueness. Electron. J. Statist. 7, 1456–1490. doi: 10.1214/13-EJS815
Tortora, C., Napolitano, N. R., Radovich, M., Spiniello, C., Hunt, L., Roy, N., et al. (2020). Nature versus nurture: relic nature and environment of the most massive passive galaxies at z < 0.5. Astron. Astrophys. 638:L11. doi: 10.1051/0004-6361/202038373
Vaccari, M., Covone, G., Radovich, M., Grado, A., Limatola, L., Botticella, M. T., et al. (2016). “The VOICE survey: VST optical imaging of the CDFS and ES1 fields,” in The 4th Annual Conference on High Energy Astrophysics in Southern Africa (HEASA 2016) (Trieste), 26. doi: 10.22323/1.275.0026
Vanzella, E., Cristiani, S., Fontana, A., Nonino, M., Arnouts, S., Giallongo, E., et al. (2004). Photometric redshifts with the multilayer perceptron neural network: application to the HDF-S and SDSS. Astron. Astrophys. 423, 761–776. doi: 10.1051/0004-6361:20040176
Viola, M., Cacciato, M., Brouwer, M., Kuijken, K., Hoekstra, H., Norberg, P., et al. (2015). Dark matter halo properties of GAMA galaxy groups from 100 square degrees of KiDS weak lensing data. Mon. Not. RAS 452, 3529–3550. doi: 10.1093/mnras/stv1447
Way, M. J., and Klose, C. D. (2012). Can self-organizing maps accurately predict photometric redshifts? Publ. ASP 124:274. doi: 10.1086/664796
Wilk, M. B., and Gnanadesikan, R. (1968). Probability plotting methods for the analysis of data. Biometrika 55, 1–17. doi: 10.2307/2334448
Willett, K. W., Lintott, C. J., Bamford, S. P., Masters, K. L., Simmons, B. D., Casteels, K. R. V., et al. (2013). Galaxy Zoo 2: detailed morphological classifications for 304 122 galaxies from the Sloan Digital Sky survey. Mon. Not. RAS 435, 2835–2860. doi: 10.1093/mnras/stt1458
Wittman, D. (2009). What lies beneath: using p(z) to reduce systematic photometric redshift errors. Astrophys. J. Lett. 700, L174–L177. doi: 10.1088/0004-637X/700/2/L174
Wittman, D., Riechers, P., and Margoniner, V. E. (2007). Photometric redshifts and photometry errors. Astrophys. J. Lett. 671, L109–L112. doi: 10.1086/525020
Wright, A. H., Hildebrandt, H., van den Busch, J. L., and Heymans, C. (2020). Photometric redshift calibration with self-organising maps. Astron. Astrophys. 637:A100. doi: 10.1051/0004-6361/201936782
Wright, E. L., Eisenhardt, P. R. M., Mainzer, A. K., Ressler, M. E., Cutri, R. M., Jarrett, T., et al. (2010). The wide-field infrared survey explorer (WISE): mission description and initial on-orbit performance. Astron. J. 140, 1868–1881. doi: 10.1088/0004-6256/140/6/1868
York, D. G., Adelman, J., Anderson, J. E., Anderson, S. F., Annis, J., Bahcall, N. A., et al. (2000). The sloan digital sky survey: technical summary. Astron. J. 120, 1579–1587. doi: 10.1086/301513
Zhang, Y., and Zhao, Y. (2014). “Applications of support vector machines in astronomy,” in Astronomical Data Analysis Software and Systems XXIII, Volume 485 of Astronomical Society of the Pacific Conference Series, eds N. Manset and P. Forshay (Chicago), 239.
Zheng, H., and Zhang, Y. (2012). “Support vector machines for photometric redshift measurement of Quasars,” in Software and Cyberinfrastructure for Astronomy II, Volume 8451 of Society of Photo-Optical Instrumentation Engineers (SPIE) Conference Series, eds N. M. Radziwill and G. Chiozzi (Bellingham), 845133. doi: 10.1117/12.925761
Keywords: photometric redshifts, machine learning, astroinformatics, galaxies, data analysis
Citation: Brescia M, Cavuoti S, Razim O, Amaro V, Riccio G and Longo G (2021) Photometric Redshifts With Machine Learning, Lights and Shadows on a Complex Data Science Use Case. Front. Astron. Space Sci. 8:658229. doi: 10.3389/fspas.2021.658229
Received: 25 January 2021; Accepted: 13 April 2021;
Published: 02 June 2021.
Edited by:
Didier Fraix-Burnet, UMR5274 Institut de Planétologie et d'Astrophysique de Grenoble (IPAG), FranceReviewed by:
Bahram Mobasher, University of California, Riverside, United StatesAli Luo, National Astronomical Observatories (CAS), China
Copyright © 2021 Brescia, Cavuoti, Razim, Amaro, Riccio and Longo. This is an open-access article distributed under the terms of the Creative Commons Attribution License (CC BY). The use, distribution or reproduction in other forums is permitted, provided the original author(s) and the copyright owner(s) are credited and that the original publication in this journal is cited, in accordance with accepted academic practice. No use, distribution or reproduction is permitted which does not comply with these terms.
*Correspondence: Massimo Brescia, massimo.brescia@inaf.it; Stefano Cavuoti, stefano.cavuoti@inaf.it