Detection of Faint BLR Components in the Starburst/Seyfert Galaxy NGC 6221 and Measure of the Central BH Mass
 Fabio La Franca1*
  Francesca Onori2
  Federica Ricci1
  Stefano Bianchi1
  Alessandro Marconi3
  Eleonora Sani4
  Cristian Vignali5
- 1Dipartimento di Matematica e Fisica, Università degli Studi Roma Tre, Roma, Italy
- 2Netherlands Institute for Space Research, SRON, Utrecht, Netherlands
- 3Dipartimento di Fisica e Astronomia, Università degli Studi di Firenze, Sesto Fiorentino, Italy
- 4European Southern Observatory, Santiago, Chile
- 5Dipartimento di Fisica e Astronomia, Università di Bologna, Bologna, Italy
In the last decade, using single epoch virial based techniques in the optical band, it has been possible to measure the central black hole mass on large type 1 Active Galactic Nuclei (AGN) samples. However, these measurements use the width of the broad line region (BLR) as a proxy of the virial velocities and are therefore difficult to be carried out on those obscured (type 2) or low luminosity AGN where the nuclear component does not dominate in the optical. Here we present the optical and near infrared spectrum of the starburst/Seyfert galaxy NGC 6221, observed with X-shooter/VLT. Previous observations of NGC 6221 in the X-ray band shows an absorbed () spectrum typical of a type 2 AGN with luminosity log() = 42.05, while in the optical band its spectrum is typical of a reddened (AV = 3) starburst. Our deep X-shooter/VLT observations have allowed us to detect faint broad emission in the Hα, HeI, and Paβ lines (FWHM ~1400–2300 km s−1) confirming previous studies indicating that NGC 6221 is a reddened starbust galaxy which hosts an AGN. We use the measure of the broad components to provide a first estimate of its central black hole mass (, λEdd = 0.01−0.03), obtained using recently calibrated virial relations suitable for moderately obscured (NH < 1024 cm−2) AGN.
1. Introduction
Nowadays there is robust evidence that every galaxy hosts a supermassive black hole (SMBH; MBH = 106–109 M⊙) whose mass scales with the hosting galaxy bulge properties (mass, luminosity, and stellar dispersion; e.g., Ferrarese and Merritt, 2000; Gebhardt et al., 2000; Marconi and Hunt, 2003; Sani et al., 2011). The existence of these scaling relationships implies that the evolution of the galaxy and the growth of SMBHs are intricately tied together (AGN/galaxy co-evolution scenario). In order to obtain a clear picture of the AGN/galaxy co-evolution, it is important to accurately derive the shape and the evolution of both the AGN luminosity function and the SMBH mass function in a consistent way. While the complete AGN luminosity function is fairly well measured up to z~4, this is not the case for the SMBH mass function.
Recently it has been possible to obtain some estimates of the SMBH mass function for large samples of type 1 AGN (AGN1). In this class of AGN the broad line region (BLR) is visible in the rest-frame optical band and this allows the use of virial methods to derive in a direct way the AGN BH mass (Greene and Ho, 2007; Kelly et al., 2009; Merloni et al., 2010; Bongiorno et al., 2014). However, this kind of measurements cannot be applied on narrow line type 2 AGN (AGN2), where the BLR is not visible in the optical spectrum because of dust absorption. Moreover, nowadays there is growing evidence that AGN1 and AGN2 are intrinsically different populations (see e.g., Elitzur, 2012), having, on average, different luminosities (smaller for AGN2; Lawrence and Elvis, 1982; Ueda et al., 2003; La Franca et al., 2005), different accretion rates (smaller for AGN2; Winter et al., 2010), different Eddington ratios (Lusso et al., 2012), different clustering, halo mass properties and merger rates (Allevato et al., 2014; Lanzuisi et al., 2015). It is, therefore, very important to find a method to easily and reliably estimate the BH mass of the AGN2. Recently, La Franca et al. (2015) have calibrated a new virial relationship suitable for moderately absorbed/obscured AGN2, which is based on the measure of the Full Width at Half Maximum (FWHM) of the BLR component of the Paβ emission line (emitted in the near infrared; NIR) together with the measure of the hard (14–195 keV) luminosity. We here present the X-shooter/VLT UV-Optical-NIR spectrum of the starburst/Seyfert 2 galaxy NGC 6221. We fitted the regions of the Hβ+[OIII], Hα+[SII], HeI, and Paβ lines in order to try to detect faint BLR components and eventually estimate the BH mass. Troughout the paper uncertainties are given at the 1σ confidence level. We adopt a Ωm = 0.3, ΩΛ = 0.7, cosmology.
2. The Galaxy NGC 6221
NCG 6221 (α = 16h 52m 46.3s, δ = –59° 13m 07s; J2000) is a nearby (z = 0.0050; Koribalski and Dickey, 2004) spiral galaxy (22 × 15 kpc2) classified as Sbc by Dressler and Sandage (1978), Sbc(a) by Sandage and Tammann (1981) and as SBc(s), with position angle (PA) 5° and inclination 44°, by de Vaucouleurs et al. (1991). The bar, which is clearly visible in the optical and infrared images (Laustsen et al., 1987; Sandage and Bedke, 1994), lies at a PA of 118° (Pence and Blackman, 1984) and has a length of ~6 kpc. Large amount of dust is visible in both spiral arms as well as along the bar. NGC 6221 forms an apparent physical pair with the late type spiral NGC 6215 wich is about 110 kpc distant and is also possibly interacting with two low-surface brightness galaxies nearby (Koribalski and Dickey, 2004). The rotation curve reaches a maximum velocity of 160 km/s at ~10 kpc of radius, corresponding to an enclosed mass of 6 × 10¹⁰ M⊙ (8 × 10¹⁰ M⊙ at 20 kpc; Koribalski and Dickey, 2004).
NGC 6221 is an example of the so called X-ray Bright Optical Normal Galaxies (XBONG; Moran et al., 1996; Fiore et al., 2000; Civano et al., 2007). This classification comes from the comparison between its optical spectrum, which is not AGN-like (starburst in this case), and its X-ray data, where the AGN is revealed (Levenson et al., 2001). In the X-ray band NGC 6221 shows an absorbed () variable (on timescales of days and years) spectrum typical of type 2 AGN with a 2–10 keV intrinsic luminosity (Levenson et al., 2001, Bianchi et al., in preparation). NGC 6221 has been observed by SWIFT/BAT in the 14–195 keV band and a luminosity log() = 42.05 was measured (70-month catalog; Baumgartner et al., 2013).
The net nuclear spectrum of NGC 6221 is typical of a reddened (AV = 3) starburst (Phillips, 1979; Morris and Ward, 1988; Storchi-Bergmann et al., 1995). A possible sign of non-stellar activity at these wavelenghts is an [OIII] component broader than, and blueshifted with respect to, Hβ. This feature, as well as the early detection of NGC 6221 as an X-ray source (Marshall et al., 1979) motivated (Veron et al., 1981) to propose a composite Seyfert 2/starburst scenario (see also Pence and Blackman, 1984; Boisson and Durret, 1986; Dottori et al., 1996; Levenson et al., 2001). The radio continuum emission consists of a bright nucleus and diffuse circumnuclear emission extending as far as the optical disc, resulting to a star formation rate of ~15 M⊙ yr−1 (Koribalski and Dickey, 2004). Fernandes et al. (2003) give, indeed, a (fairly short) mean starburst age of 107.4 ± 1.1 year for the central 10 × 20 arcsec2 of NGC 6221.
Kinematical studies of NGC 6221, using several long-slit spectra of the Hα line emission out to radii of 80 arcsec (Pence and Blackman, 1984; Vega Beltran et al., 1998), revealed non-circular motion of ionized gas, possibly as a result of streaming motions along the bar and tidal interaction with NGC 6215. The iso-velocity contour map shows a conspicuous S-shaped pattern of closely spaced contours near the minor axis indicating a very sudden change in velocity of about 150 km s−1 at the position of the dust lanes in the bar. The gas is moving radially outward as it approaches the dust lane, and then inward after passing trough the shock. This transition occurs in a narrow region, less than 200 pc wide (see the cartoon of the model described in Figure 5 of Pence and Blackman, 1984).
In the optical spectrum, broad and blue components are observed which dominates the [OIII] profile (but not the Hβ line) extending to more than 1000 km s−1. The [OIII] to Hβ ratio vary from 0.2 at the line peak (typical of normal HII regions) to more than 3 in the blue wing. Since the [OIII] to Hβ ratio is an indicator of the excitation conditions, either from shocks or highly ionizing radiation (Baldwin et al., 1981), the gas with highest blueshift shows the highest excitation. Moreover, the [OIII] profile changes as a function of the distance from the nucleus. In the nuclear (1.5″ × 1.5″; 1 arcsec ~ 103 pc at the distance of NGC 6221) spectrum, the broad and blue component dominates. The fitting of the [OIII] profile yields a broad component with FWHM ~ 600 km/s shifted by ~230 km/s with respect to the narrow unresolved component, while in the Hβ the narrow component dominates. At variance, at distance of 500 pc from the nucleus the broad and blue wing of the Hβ line is no longer visible, and both the [OIII] and Hβ profiles look narrow and very similar. However, it should be noticed that also in both the Hα and Hβ profiles a weak broad component of FWHM~ 500–600 km/s, blueshifted by 150–250 km/s with respect to an unresolved narrower component (whose intrinsic FWHM ~ 100 km/s) was observed (Levenson et al., 2001). As reported by Levenson et al. (2001) all the total nuclear emission-line ratios are consistent with a reddened (AV = 3; AV = 2.5 once corrected for the Milky Way absorption) starburst classification on conventional diagnostic diagrams (Veilleux and Osterbrock, 1987). Similar values of the extinction have been measured by Ramos Almeida et al. (2011) by spectral energy distribution (SED) fitting in the NIR. No indications of broad (FWHM > 1000 km s−1) permitted emission lines were found both in the optical and in the NIR (Levenson et al., 2001, and references therein).
All these observations motivated Levenson et al. (2001) to draw a scenario (see the cartoon in their Figure 6) where a face on type 1 AGN, surrounded by a starburst galaxy (responsible for the reddening in the optical and for the absorption in X-ray band), is observed. So that, if it were possible to turn off the starburst, NGC 6221 would be classified as a Seyfert 1 galaxy (as previously proposed by Fabian et al., 1998).
As under the above hypothesis, or any other model in which NGC 6221 hosts a reddened AGN, it could be possible to detect the faint BLR components with deep NIR spectroscopy, we have decided to observe the nucleus of NGC 6221 with X-shooter at the VLT.
3. Data and Spectral Line Analysis
NGC 6221 was observed on April 24th 2014 with X-shooter at the VLT. X-shooter is a single target spectrograph covering in a single exposure the spectral range from the UV to the K band (300−2500 nm) (Vernet et al., 2011). The instrument operates at intermediate resolutions, R = 4000−18,000, depending on the wavelength and the slit width. Ten images with exposures, in the NIR band, of ~290 s each, were acquired. A 1.0″ × 11″ slit for the ultraviolet and blue (UVB) arm and a 0.9″ × 11″ slit for the optical (VIS) and NIR arms were used, corresponding to a spectral resolution R = Δλ/λ = 4350 for the UVB arm, R = Δλ/λ = 7450 for the VIS arm, and R = Δλ/λ = 5300 for the NIR arm, and to a velocity uncertainty of Δv ~ 70/40/60 km/s at redshift 0, in the UVB/VIS/NIR arms, respectively. The data reduction has been carried out using the REFLEX X-shooter pipeline (Freudling et al., 2013).
We have analyzed those emission lines where faint BLR components could be present: i.e., Hβ, Hα, HeI, Paγ, and Paβ lines. The air rest-frame wavelengths were used (Morton, 1991). The 1σ uncertainties provided by the data reduction pipelines, and compared with featureless regions of the spectra, were used to carry out the line fitting using XSPEC 12.7.1 (Arnaud, 1996). At 5100 Å the spectrum has a S/N ~ 55 per resolution element. The local continuum was always modeled with a power-law and subtracted, then all significant (using the F-test) components were modeled with Gaussian profiles. All measurements were performed in the redshift corrected spectrum (i.e., in the object rest frame). We have identified as narrow (N) all the components having widths less than ~200 km s−1, well centered with the line profiles, and usually compatible with the forbidden lines widths (i.e., belonging to the narrow line region, NLR). At variance, the widest components of the permitted HI and HeI lines, significantly larger than the narrow components, have been classified as broad (B) and then associated to the BLR. Other intermediate (I) width components (all blueshifted with respect to the narrow components. See previous results by Levenson et al., 2001) were also identified. The narrow components of permitted lines (HI and HeI) have been modeled by imposing the same FWHM (in the velocity space) found for the narrow components of the forbidden lines measured in the same spectral band. In the optical we have imposed that the intensity ratios between the [OIII]4959 and [OIII]5007 and between [NII]6548 and [NII]6583 satisfied the expected 1:2.99 relation (Osterbrock and Ferland, 2006) and that the central wavelenghts of all lines shared the same systemic redshift. When intermediate components were found, we have fixed their FWHM and their blueshift to be equal to those found for the corresponding intermediate component of the most intense forbidden line in the same spectral region. The main fitting parameters (equivalent width, EW, FWHM, and the velocity off-set with respect to the NLR rest frame, ΔV) are listed in Table 1.
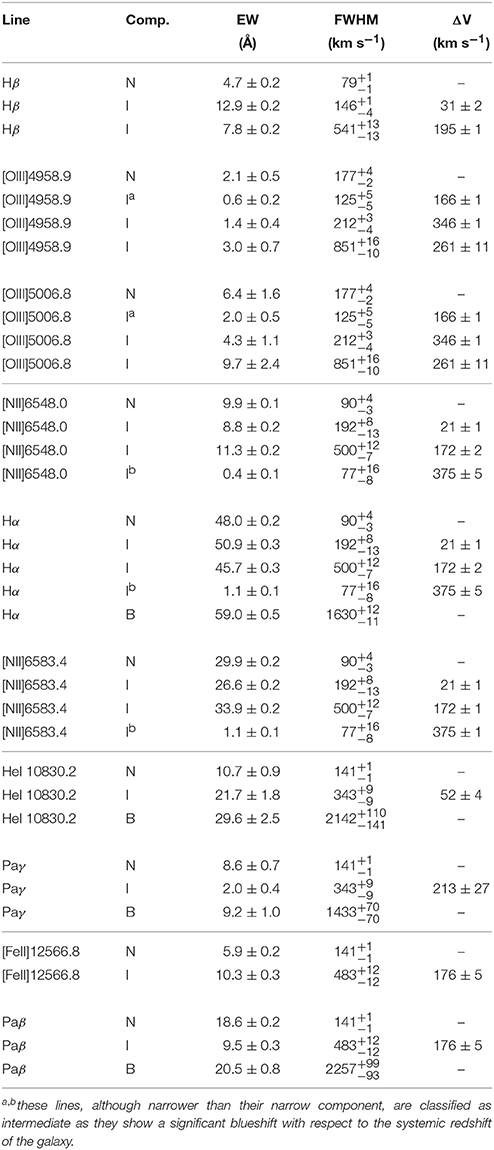
Table 1. Emission line fitting parameters.
The X-shooter NIR spectrum of NGC 6221 is rich of intense emission lines, both permitted and forbidden, such as: Hβ+[OIII] and Hα+[NII] in the optical and HeI (well separated from the Paγ) and Paβ+[FeII]12570 in the NIR (see Figures 1, 2).
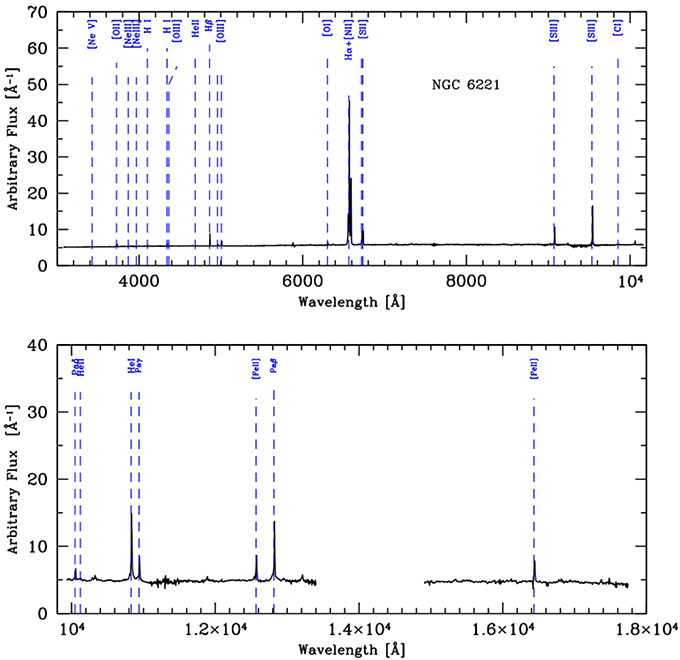
Figure 1. UV, Optical, and Near infrared rest frame spectrum of NGC 6221 obtained with X-Shooter/VLT. The blue dashed lines show the expected wavelength position of the most relevant emission lines.
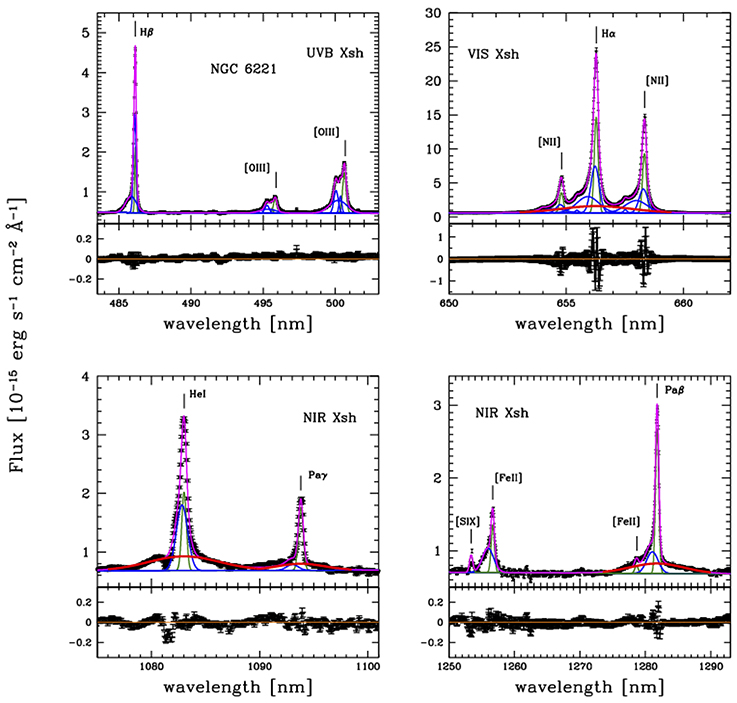
Figure 2. Optical and NIR rest-frame spectra of NGC 6221. Top-left: Hβ+[OIII] region. Top-right: Hα+[NII] region. Bottom-left: HeI+Paγ region. Bottom-right: Paβ+[FeII] region. The narrow, intermediate, and broad components are shown with green, blue, and red lines, respectively. The magenta line shows the total fitting model. Vertical lines shows the wavelength of the emission lines. Bottom panels show the residuals of the fitting models.
In the optical region, beside the NLR components, both in the Hβ and Hα regions three intermediate components, having a blueshift up to ΔV = 380 km s−1, have been found. Moreover, to significantly better model the data, a broad Hα component (FWHM = 1630 km s−1 and centered with the Hα NLR component) was also added (see Figure 2 and Table 1). Indeed, the F-test gives a probability of 1 × 10−256 that the improvement of the fit obtained including this last broad component is due to statistical fluctuations. The Hα to Hβ flux ratio of the narrow components confirms the previous estimates of reddening with AV = 3 (see previous section).
The fitting models of the NIR spectrum are similar to the models found in the optical band. Besides the presence of the NLR components, in each emission line an intermediate component having a blueshift up to ΔV = 210 km s−1 has been added. Moreover, to significantly improve the modeling of the data, for each of the HeI, Paγ, and Paβ lines, broad (FWHM = 1430–2260 km s−1) components, centered with the NLR, were also added (see Figure 2 and Table 1). As an example, in Figure 3 the fit with, and without, the inclusion of the broad Paβ component is shown. The F-test gives a probability of 1 × 10−118 that the improvement of the fit is due to statistical fluctuations.
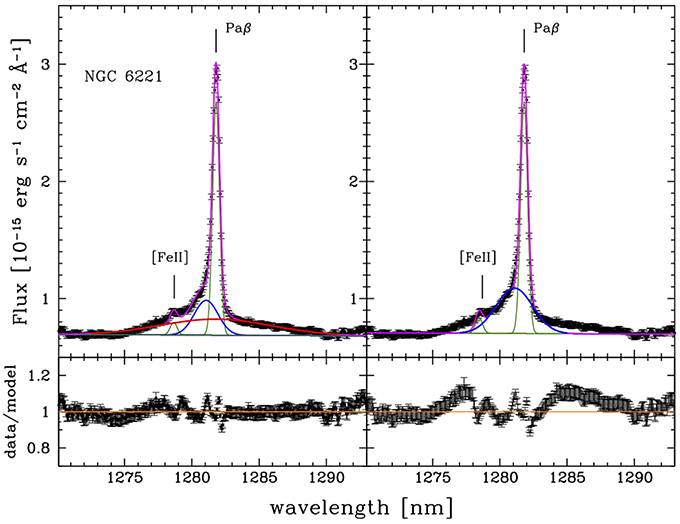
Figure 3. Left: Best fit of the Paβ line of NGC 6221 including a broad (FWHM = 2257 km s−1) component. Right: Same as before without including a broad Paβ component. The narrow, intermediate, and broad components are shown with green, blue, and red lines, respectively. Lower panels show the data to model ratio.
In summary, all the lines show narrow components, all sharing the same systemic redshift, with FWHM < 180 km s−1 and some intermediate components showing blueshifts up to ΔV = 380 km s−1 with respect to the narrow components. This result is in line with the results of Levenson et al. (2001) and many other authors as described in Section 2. Moreover, the Hα, HeI, Paγ, and Paβ lines show significant broad components, with FWHM ~1400–2300 km s−1, having their center in the rest frame measured by the NLR and which can then be attributed to the BLR. As we are interested in the detection of these BLR components, we have not carried out either a more detailed kinematic or line fitting analysis of the intermediate and narrow components, which is beyond the scope of this paper.
4. Discussion and Conclusions
The detection of faint broad emission line components in AGN2 (or reddened AGN, in general), although difficult, is not uncommon (see e.g., Veilleux et al., 1997; Riffel et al., 2006; Cai et al., 2010). As discussed in the introduction, when detected, the width (e.g., the FWHM) of the BLR could be used to estimate the BH mass of the AGN using single epoch virial relationships. However, all these relationships use the AGN luminosity as a proxy of the virial radius (R ∝ ) but, unfortunately, in AGN2 the luminosity is absorbed by surrounding material (probably a clumpy torus within few pc from the center; see Burtscher et al., 2013; Marinucci et al., 2016 and references therein). For these reasons, recently, virial relationships have been calibrated, based on the use of the very hard X-ray (14–195 keV) luminosity (which is very little affected, if not at all, by absorption) and the measure of the FWHM of the BLR component of the Paβ line which, being emitted in the NIR, is less affected by reddening:
The resulting observed spread is 0.23 dex, while the intrinsic spread results to be 0.20 dex (La Franca et al., 2015).
NGC 6221 has been observed by SWIFT/BAT in the 14–195 keV band and, according to the SWIFT/BAT 70-month catalog, it has a luminosity log() = 42.05 (Baumgartner et al., 2013). Therefore, using Equation (1) and our measure of FWHMPaβ = km s−1, its BH mass results log(M/M⊙) = 6.60 ± 0.25. As a broad component of the Hα has been also measured (FWHMHα = km s−1), we can further estimate the BH mass using either a new virial relationship where the 14–195 keV luminosity and the FWHM of the Hα line are instead used (Onori et al., in preparation), or the relation by Greene and Ho (2007, their Equation A1 normalized to f = 4.31), where both the Hα line FWHM and luminosities are used. In the first case a BH mass of log(M/M⊙) = 6.4 ± 0.3 is derived. Also the relation by Greene and Ho (2007) (once our measure of the luminosity of the broad Hα component, logLHα = 39.2 erg s−1, is used) gives a BH mass log(M/M⊙) = 6.4±0.2. All the above reported measures, according to their uncertainties, are in agreement. It should be however noted that the 0.2 dex lower value obtained using the Hα luminosity (if compared to the value obtained using the Paβ) can be attributed to the effects of the reddening. Indeed, once corrected for reddening, the relation by Greene and Ho (2007) gives log(M/M⊙) ~ 6.7.
The bolometric luminosity of NGC 6221 has been evaluated through multiwavelength SED fitting to be (Ramos Almeida et al., 2011). While, using the 2–10 keV intrinsic luminosity (Bianchi et al., in preparation) as a proxy, and following the bolometric correction of Marconi et al. (2004), is obtained. Therefore, our estimate of a BH mass log(M/M⊙) = 6.6 corresponds to an Eddington ratio λEdd = LBol/LEdd = 0.01−0.03.
According to previous studies (see Introduction), low luminosity AGN (AGN2 in particular) were expected to populate the low mass regime of the SMBH mass function. Our result of a BH mass smaller than 107 M⊙ in the starburst/AGN NGC 6221 is in line (together with the results of La Franca et al., 2015) with these studies. In this context the virial relation by La Franca et al. (2015) which could be used to measure the BH mass in moderately absorbed AGN (mainly AGN2), is also useful to derive, in statistically significant hard X-ray selected samples of AGN2, the BH mass and the Eddington ratio distributions (Onori et al., in preparation), and verify if the galaxy BH mass scale relations are also valid in their case.
Author Contributions
The project was originally conceived by FL. All the authors have then contributed to its design, acquisition, interpretation of the data, and writing of the paper.
Funding
PRIN/MIUR 2010NHBSBE and PRIN/INAF 2014_3.
Conflict of Interest Statement
The authors declare that the research was conducted in the absence of any commercial or financial relationships that could be construed as a potential conflict of interest.
The handling Editor declared a past co-authorship with one of the authors, ES, and states that the process nevertheless met the standards of a fair and objective review.
Acknowledgments
Based on observations made with ESO Telescopes at the La Silla Paranal Observatory under programme ID 093.A-0766. We thank the reviewers for careful reading of the manuscript and numerous helpful suggestions.
References
Allevato, V., Finoguenov, A., Civano, F., Cappelluti, N., Shankar, F., Miyaji, T., et al. (2014). Clustering of moderate luminosity X-ray-selected Type 1 and Type 2 AGNS at Z 3. Astrophys. J. 796:4. doi: 10.1088/0004-637X/796/1/4
Arnaud, K. A. (1996). “XSPEC: the first ten years,” in Astronomical Data Analysis Software and Systems V, Vol. 101 of Astronomical Society of the Pacific Conference Series, eds G. H. Jacoby and J. Barnes (San Francisco, CA), 17.
Baldwin, J. A., Phillips, M. M., and Terlevich, R. (1981). Classification parameters for the emission-line spectra of extragalactic objects. Publ. Astron. Soc. Pac. 93, 5–19.
Baumgartner, W. H., Tueller, J., Markwardt, C. B., Skinner, G. K., Barthelmy, S., Mushotzky, R. F., et al. (2013). The 70 month Swift-BAT All-sky hard X-ray survey. Astrophysics 207:19. doi: 10.1088/0067-0049/207/2/19
Boisson, C., and Durret, F. (1986). The ultraviolet of infrared continuum of ten narrow emission line active galaxies. Astron. Astrophys. 168, 32–40.
Bongiorno, A., Maiolino, R., Brusa, M., Marconi, A., Piconcelli, E., Lamastra, A., et al. (2014). The MBH-M* relation for X-ray-obscured, red QSOs at 1.2 < z < 2.6. MNRAS 443, 2077–2091. doi: 10.1093/mnras/stu1248
Burtscher, L., Meisenheimer, K., Tristram, K. R. W., Jaffe, W., Hönig, S. F., Davies, R. I., et al. (2013). A diversity of dusty AGN tori. Data release for the VLTI/MIDI AGN Large Program and first results for 23 galaxies. Astron. Astrophys. 558:A149. doi: 10.1051/0004-6361/201321890
Cai, H.-B., Shu, X.-W., Zheng, Z.-Y., and Wang, J.-X. (2010). The study of Seyfert 2 galaxies with and without infrared broad lines. Res. Astron. Astrophys. 10, 427–437. doi: 10.1088/1674-4527/10/5/003
Civano, F., Mignoli, M., Comastri, A., Vignali, C., Fiore, F., Pozzetti, L., et al. (2007). The HELLAS2XMM survey. XI. Unveiling the nature of X-ray bright optically normal galaxies. Astron. Astrophys. 476, 1223–1233. doi: 10.1051/0004-6361:20077945
de Vaucouleurs, G., de Vaucouleurs, A., Corwin, H. G. Jr., Buta, R. J., Paturel, G., and Fouqué, P. (1991). Third Reference Catalogue of Bright Galaxies. Vol. I: Explanations and References. Vol. II: Data for Galaxies Between 0h and 12h. Vol. III: Data for Galaxies Between 12h and 24h. New York, NY: Springer.
Dottori, H., Duval, M. F., Carranza, G., Goldes, G., Diaz, R., and Paolantonio, S. (1996). “First spectroscopic results on NGC 151, NGC 1433, NGC 6221 and Fairall 9 Obtained at Bosque Alegre Station,” in Revista Mexicana de Astronomia y Astrofisica Conference Series, Vol. 4 of Revista Mexicana de Astronomia y Astrofisica, Vol. 27, eds E. Falco, J. A. Fernandez, and R. F. Ferrero (Ciudad de Mexico), 136.
Dressler, A., and Sandage, A. (1978). First results of the Las Campanas Survey to classify southern galaxies photographed with the du Pont 2.5-meter reflector. Publ. Astron. Soc. Pac. 90, 5. doi: 10.1086/130266
Elitzur, M. (2012). On the unification of active galactic nuclei. Astrophys. J. Lett. 747:L33. doi: 10.1088/2041-8205/747/2/L33
Fabian, A. C., Barcons, X., Almaini, O., and Iwasawa, K. (1998). Do nuclear starbursts obscure the X-ray background? MNRAS 297, L11–l15.
Fernandes, R. C., Leão, J. R. S., and Lacerda, R. R. (2003). The evolution of stars and gas in starburst galaxies. MNRAS 340, 29–42. doi: 10.1046/j.1365-8711.2003.06203.x
Ferrarese, L., and Merritt, D. (2000). A fundamental relation between supermassive black holes and their host galaxies. Astrophys. J. Lett. 539, L9–L12. doi: 10.1086/312838
Fiore, F., La Franca, F., Vignali, C., Comastri, A., Matt, G., Perola, G. C., et al. (2000). Spectroscopic identification of ten faint hard X-ray sources discovered by Chandra. New Astron. 5, 143–153. doi: 10.1016/S1384-1076(00)00017-8
Freudling, W., Romaniello, M., Bramich, D. M., Ballester, P., Forchi, V., García-Dabló, C. E., et al. (2013). Automated data reduction workflows for astronomy. The ESO Reflex environment. Astron. Astrophys. 559:A96. doi: 10.1051/0004-6361/201322494
Gebhardt, K., Kormendy, J., Ho, L. C., Bender, R., Bower, G., Dressler, A., et al. (2000). Black hole mass estimates from reverberation mapping and from spatially resolved kinematics. Astrophys. J. Lett. 543, L5–L8. doi: 10.1086/318174
Greene, J. E., and Ho, L. C. (2007). A new sample of low-mass black holes in active galaxies. Astrophys. J. Lett. 670, 92–104. doi: 10.1086/522082
Kelly, B. C., Vestergaard, M., and Fan, X. (2009). Determining Quasar black hole mass functions from their broad emission lines: application to the Bright Quasar Survey. Astrophys. J. Lett. 692, 1388–1410. doi: 10.1088/0004-637X/692/2/1388
Koribalski, B., and Dickey, J. M. (2004). Neutral hydrogen gas in interacting galaxies: the NGC 6221/6215 galaxy group. MNRAS 348, 1255–1274. doi: 10.1111/j.1365-2966.2004.07444.x
La Franca, F., Fiore, F., Comastri, A., Perola, G. C., Sacchi, N., Brusa, M., et al. (2005). The HELLAS2XMM Survey. VII. The hard X-ray luminosity function of AGNs up to z = 4: more absorbed AGNs at low luminosities and high redshifts. Astrophys. J. 635, 864–879. doi: 10.1086/497586
La Franca, F., Onori, F., Ricci, F., Sani, E., Brusa, M., Maiolino, R., et al. (2015). Extending virial black hole mass estimates to low-luminosity or obscured AGN: the cases of NGC 4395 and MCG -01-24-012. MNRAS 449, 1526–1535. doi: 10.1093/mnras/stv368
Lanzuisi, G., Perna, M., Delvecchio, I., Berta, S., Brusa, M., Cappelluti, N., et al. (2015). The most obscured AGN in the COSMOS field. Astron. Astrophys. 578:A120. doi: 10.1051/0004-6361/201526036
Laustsen, S., Madsen, C., and West, R. M. (1987). Exploring the Southern Sky. A Pictorial Atlas from the European Southern Observatory (ESO). Berlin; Heidelberg; New York, NY: Springer-Verlag.
Lawrence, A., and Elvis, M. (1982). Obscuration and the various kinds of Seyfert galaxies. Astrophys. J. 256, 410–426. doi: 10.1086/159918
Levenson, N. A., Cid Fernandes, R. Jr., Weaver, K. A., Heckman, T. M., and Storchi-Bergmann, T. (2001). The obscuring starburst of NGC 6221 and implications for the hard X-ray background. Astrophys. J. 557, 54–66. doi: 10.1086/321656
Lusso, E., Comastri, A., Simmons, B. D., Mignoli, M., Zamorani, G., Vignali, C., et al. (2012). Bolometric luminosities and Eddington ratios of X-ray selected active galactic nuclei in the XMM-COSMOS survey. MNRAS 425, 623–640. doi: 10.1111/j.1365-2966.2012.21513.x
Marconi, A., and Hunt, L. K. (2003). The relation between black hole mass, Bulge mass, and near-infrared luminosity. Astrophys. J. Lett. 589, L21–L24. doi: 10.1086/375804
Marconi, A., Risaliti, G., Gilli, R., Hunt, L. K., Maiolino, R., and Salvati, M. (2004). Local supermassive black holes, relics of active galactic nuclei and the X-ray background. MNRAS 351, 169–185. doi: 10.1111/j.1365-2966.2004.07765.x
Marinucci, A., Bianchi, S., Matt, G., Alexander, D. M., Baloković, M., Bauer, F. E., et al. (2016). NuSTAR catches the unveiling nucleus of NGC 1068. MNRAS 456, L94–L98. doi: 10.1093/mnrasl/slv178
Marshall, F. E., Boldt, E. A., Holt, S. S., Mushotzky, R. F., Rothschild, R. E., Serlemitsos, P. J., et al. (1979). New hard X-ray sources observed with HEAO A-2. Astrophys. J. Suppl. Ser. 40, 657–665. doi: 10.1086/190600
Merloni, A., Bongiorno, A., Bolzonella, M., Brusa, M., Civano, F., Comastri, A., et al. (2010). On the cosmic evolution of the scaling relations between black holes and their host galaxies: broad-line active galactic nuclei in the zCOSMOS Survey. Astrophys. J. 708, 137–157. doi: 10.1088/0004-637X/708/1/137
Moran, E. C., Halpern, J. P., and Helfand, D. J. (1996). Classification of IRAS-selected X-ray galaxies in the ROSAT All-Sky Survey. Astrophys. J. Suppl. Ser. 106:341.
Morris, S. L., and Ward, M. J. (1988). Spectrophotometry of active galaxies. I - The observations. MNRAS 230, 639–669.
Morton, D. C. (1991). Atomic data for resonance absorption lines. I - wavelengths longward of the Lyman limit. Astrophys. J. Suppl. Ser. 77, 119–202.
Osterbrock, D. E., and Ferland, G. J. (2006). Astrophysics of Gaseous Nebulae and Active Galactic Nuclei. Mill Valley, CA: University Science Books.
Pence, W. D., and Blackman, C. P. (1984). Dynamics of gas in barred spiral galaxies. I - NGC 6221. MNRAS 207, 9–23.
Phillips, M. M. (1979). Optical spectrophotometry of the suspected X-ray galaxies NGC 6221 and NGC 7213. Astrophys. J. Lett. 227:L121.
Ramos Almeida, C., Levenson, N. A., Alonso-Herrero, A., Asensio Ramos, A., Rodríguez Espinosa, J. M., Pérez García, A. M., et al. (2011). Testing the unification model for active galactic nuclei in the infrared: are the obscuring Tori of Type 1 and 2 Seyferts different? Astrophys. J. 731:92. doi: 10.1088/0004-637X/731/2/92
Riffel, R., Rodríguez-Ardila, A., and Pastoriza, M. G. (2006). A 0.8-2.4 μm spectral atlas of active galactic nuclei. Astron. Astrophys. 457, 61–70. doi: 10.1051/0004-6361:20065291
Sandage, A., and Bedke, J. (1994). The Carnegie Atlas of Galaxies, Vol. I, II. Washington, DC: Carnegie Institution of Washington Publication.
Sandage, A., and Tammann, G. A. (1981). “Revised Shapley-Ames catalog of bright galaxies,” in Carnegie Institution of Washington Publication (Carnegie Institution of Washington).
Sani, E., Marconi, A., Hunt, L. K., and Risaliti, G. (2011). The Spitzer/IRAC view of black hole-bulge scaling relations. MNRAS 413, 1479–1494. doi: 10.1111/j.1365-2966.2011.18229.x
Storchi-Bergmann, T., Kinney, A. L., and Challis, P. (1995). Ultraviolet to near-infrared spectral distributions of star-forming and Seyfert 2 galaxies. Astrophys. J. Suppl. Ser. 98:103. doi: 10.1086/192156
Ueda, Y., Akiyama, M., Ohta, K., and Miyaji, T. (2003). Cosmological evolution of the hard X-ray active galactic nucleus luminosity function and the origin of the hard X-ray background. Astrophys. J. 598, 886–908. doi: 10.1142/9789812702432_0082
Vega Beltran, J. C., Zeilinger, W. W., Amico, P., Schultheis, M., Corsini, E. M., Funes, J. G., et al. (1998). Mixed early and late-type properties in the bar of NGC 6221: evidence for evolution along the Hubble sequence? Astron. Astrophys. Suppl. Ser. 131, 105–114.
Veilleux, S., Goodrich, R. W., and Hill, G. J. (1997). Infrared spectroscopy of Seyfert 2 galaxies: a look through the obscuring Torus? II. Astrophys. J. 477, 631–660.
Veilleux, S., and Osterbrock, D. E. (1987). Spectral classification of emission-line galaxies. Astrophys. J. Suppl. Ser. 63, 295–310.
Vernet, J., Dekker, H., D'Odorico, S., Kaper, L., Kjaergaard, P., Hammer, F., et al. (2011). X-shooter, the new wide band intermediate resolution spectrograph at the ESO very large telescope. Astron. Astrophys. 536:A105. doi: 10.1051/0004-6361/201117752
Veron, M. P., Veron, P., and Zuiderwijk, E. J. (1981). High-resolution spectrophotometry of the low-excitation X-ray galaxies NGC 1672 and NGC 6221. Astron. Astrophys. 98:34.
Keywords: extragalactic astronomy, galaxies, active galactic nuclei, black holes
Citation: La Franca F, Onori F, Ricci F, Bianchi S, Marconi A, Sani E and Vignali C (2016) Detection of Faint BLR Components in the Starburst/Seyfert Galaxy NGC 6221 and Measure of the Central BH Mass. Front. Astron. Space Sci. 3:12. doi: 10.3389/fspas.2016.00012
Received: 18 November 2015; Accepted: 24 March 2016;
Published: 18 April 2016.
Edited by:
Mauro D'Onofrio, University of Padova, ItalyReviewed by:
Giovanna Maria Stirpe, Istituto Nazionale di Astrofisica-Osservatorio Astronomico di Bologna, ItalyAlenka Negrete, Universidad Nacional Autónoma de México, Mexico
Copyright © 2016 La Franca, Onori, Ricci, Bianchi, Marconi, Sani and Vignali. This is an open-access article distributed under the terms of the Creative Commons Attribution License (CC BY). The use, distribution or reproduction in other forums is permitted, provided the original author(s) or licensor are credited and that the original publication in this journal is cited, in accordance with accepted academic practice. No use, distribution or reproduction is permitted which does not comply with these terms.
*Correspondence: Fabio La Franca, lafranca@fis.uniroma3.it