 Yong Wei1,2
 Song He2Jiatian Wang1Peiyang Fan1Yulan He1Ke Hu1Yulan Chen1
 Guofa Zhou3
 Daibin Zhong3
 Xueli Zheng1*
- 1Department of Pathogen Biology, School of Public Health, Southern Medical University, Guangzhou, China
- 2Clinical Laboratory, Shenzhen Qianhai Shekou Free Trade Zone Hospital, Shenzhen, China
- 3Program in Public Health, College of Health Sciences, University of California, Irvine, Irvine, CA, United States
Introduction: Since the second half of the 20th century, Aedes albopictus, a vector for more than 20 arboviruses, has spread worldwide. Aedes albopictus is the main vector of infectious diseases transmitted by Aedes mosquitoes in China, and it has caused concerns regarding public health. A comprehensive understanding of the spatial genetic structure of this vector species at a genomic level is essential for effective vector control and the prevention of vector-borne diseases.
Methods: During 2016–2018, adult female Ae. albopictus mosquitoes were collected from eight different geographical locations across China. Restriction site-associated DNA sequencing (RAD-seq) was used for high-throughput identification of single nucleotide polymorphisms (SNPs) and genotyping of the Ae. albopictus population. The spatial genetic structure was analyzed and compared to those exhibited by mitochondrial cytochrome c oxidase subunit 1 (cox1) and microsatellites in the Ae. albopictus population.
Results: A total of 9,103 genome-wide SNP loci in 101 specimens and 32 haplotypes of cox1 in 231 specimens were identified in the samples from eight locations in China. Principal component analysis revealed that samples from Lingshui and Zhanjiang were more genetically different than those from the other locations. The SNPs provided a better resolution and stronger signals for novel spatial population genetic structures than those from the cox1 data and a set of previously genotyped microsatellites. The fixation indexes from the SNP dataset showed shallow but significant genetic differentiation in the population. The Mantel test indicated a positive correlation between genetic distance and geographical distance. However, the asymmetric gene flow was detected among the populations, and it was higher from south to north and west to east than in the opposite directions.
Conclusions: The genome-wide SNPs revealed seven gene pools and fine spatial genetic structure of the Ae. albopictus population in China. The RAD-seq approach has great potential to increase our understanding of the spatial dynamics of population spread and establishment, which will help us to design new strategies for controlling vectors and mosquito-borne diseases.
Introduction
Aedes (Stegomyia) albopictus (Skuse, 1894), one of the 100 most dangerous invasive species worldwide, can be found on every continent except for Antarctica, because of global warming, human-aided transport, and insecticide resistance (1–3). The global spread of Ae. albopictus has attracted public health concern for mosquito-borne diseases. Aedes albopictus is a vector for more than 20 arboviruses, some of which are highly pathogenic and transmissible, for example, dengue virus, Chikungunya virus (CHIKV), and yellow fever virus (4).
Aedes albopictus as well as Ae. aegypti are responsible for the recent re-emergence of dengue and Chikungunya and new outbreaks of Zika virus infection (5, 6). Aedes albopictus is the predominant species found in nearly one-third of China (7, 8), whereas the distribution of Ae. aegypti is limited to small areas of southern China, including Hainan, Guangdong, Guangxi, and Yunnan Provinces (9–11). Aedes albopictus is the main vector of infectious diseases transmitted by Aedes mosquitoes in China. The threat of infectious disease transmission has led to the establishment of surveillance and vector control strategies, which gain from knowledge of the genetic, ecological, and behavioral traits of the mosquito populations (12).
Many studies on the genetic diversity and population structure of Aedes albopictus population have been conducted by using molecular markers such as mitochondrial gene cytochrome c oxidase subunit 1 (cox1) (13–20) and microsatellite markers (14, 21–23). However, the use of mitochondrial DNA as a marker in population, phylogeographic, and phylogenetic studies may be a problem due to the existence of inherited symbionts in Ae. albopictus (5, 24, 25). Microsatellite markers are codominant nuclear loci that are commonly used to infer levels of genetic diversity and population genetic structure in natural populations. However, bias selection for only the most polymorphic markers in the genome may result in reduced sensitivity and an inaccurate reflection of the underlying genome-wide levels of genetic diversity (26). Many population genetic studies have used mitochondrial DNA and microsatellite markers and provided limited resolution of population genetic structure patterns because of low levels of sequence variation or limited number of markers (5). For example, Gao et al. (14) and Wei et al. (27) reported two patterns of broad population structure on the basis of microsatellite markers alone and three major haplotype clusters of cox1 in the Ae. albopictus population in China. Genetic indices and environmental factors were combined and 17 Ae. albopictus populations across China were sampled and clustered into three groups that approximately correlated to three climate regions: tropical, subtropical, and temperature regions (14).
Currently, single nucleotide polymorphisms (SNPs), identified using next-generation sequencing techniques, are the markers of choice because of their abundance in the genomes of virtually all populations (28). Restriction site-associated DNA sequencing (RAD-seq) is one of the most popular strategies used to identify large numbers of bi-allelic SNPs in the genomes of vector mosquito populations. Several studies have been conducted using genome-wide SNPs to decipher the genetic diversity (29), spatial population structure (30), gene flow patterns (31, 32), incursion pathways (32–34), as well as cold adaptation (35, 36) of Ae. albopictus. However, limited numbers of mosquito populations have been sampled from the native population for studying the population genomics of this species, especially in China (34). Genome-wide SNPs could provide a valuable tool for identifying the genetic basis of important ecological adaptations, including traits related to invasion success and range expansion (37). Such information may provide the basis for novel vector-control strategies based on the genetic or chemical disruption of these adaptations.
This study was designed to investigate the genomic patterns of the spatial population genetic structure of Ae. albopictus across China. We used genome-wide SNPs to determine the distribution of genetic diversity and population structure of the Ae. albopictus populations across eight different geographical locations. Combined with the cox1 and microsatellite datasets from the same populations in our previous study (27), we compared the spatial genetic structure exhibited by the genome-wide SNPs, cox1, and microsatellite markers in the populations.
Methods
Mosquito sampling and DNA extraction
Between August 2016 and September 2018, we collected Ae. albopictus adult female mosquitoes from different geographical clusters in eight locations (Beijing, BJ; Shijiazhuang, SJZ; Hangzhou, HZ; Wuhan, WH; Meishan, MS; Guangzhou, GZ; Zhanjiang, ZJ; and Lingshui, LS) from our previous study (27) in China (Figure 1). At each location, 8–12 households or collection points 400–3,000 m apart were selected randomly for obtaining adult mosquitoes, and 20–32 Ae. albopictus female mosquitoes from each location, with 2–3 individuals per collection point, were used for DNA extraction and genetic analysis. All adult mosquito specimens were identified using morphology under a stereomicroscope (Nikon, Tokyo, Japan) and cox1 sequencing. Sampling bias was examined using previous microsatellite data (27). Total genomic DNA was individually extracted using the Insect DNA Kit (Omega Bio-tek, GA, USA), according to the manufacturer's instructions.
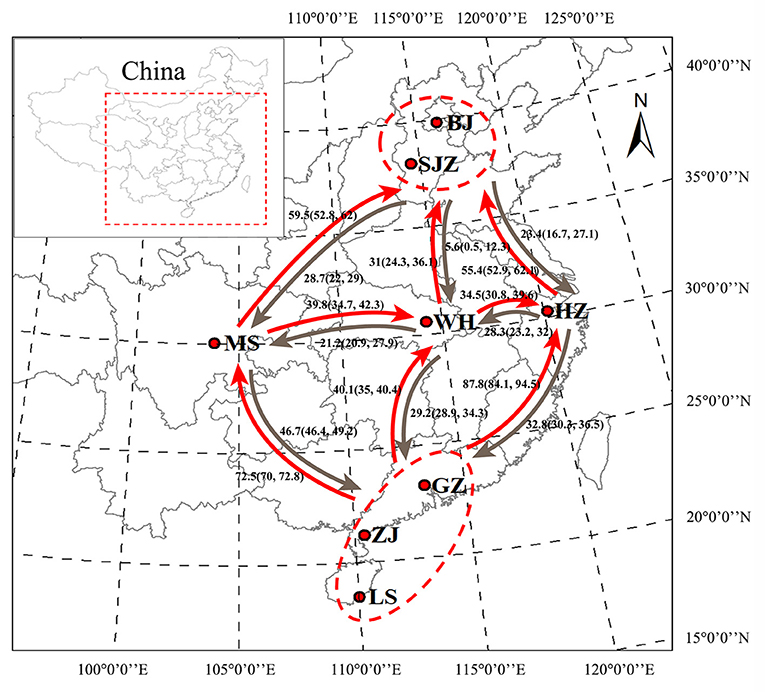
Figure 1. Geographical locations of Ae. albopictus sampling sites in China. Bayesian estimates of historical asymmetrical migration between five locality groups of Ae. albopictus on the basis of the genome-wide SNPs. The numbers indicate migration rate, and arrows indicate the direction of migration. BJ, Beijing; SJZ, Shijiazhuang; HZ, Hangzhou; WH, Wuhan; MS, Meishan; GZ, Guangzhou; ZJ, Zhanjiang; LS, Lingshui. The map was generated using ArcMap 10.2.2 software. Map source: ESRI (available at: www.esri.com).
PCR amplification and mtDNA sequencing
SNPs in the mitochondrial gene cox1 of the mosquito specimens were examined. PCR was performed to amplify a 796 bp fragment in the 5′ cox1 region of the mtDNA by using the DNA primer pairs 2027F (5′-CCCGTATTAGCCGGAGCTAT-3′) and 2886R (5′-ATGGGGAAAGAAGGAGTTCG-3′) (16). The 25 μl reaction mixture contained 40 ng of genomic DNA, 12.5 μl of 2 × PCR Master Mix (Promega, WI, USA), 1 μl each of the forward and reverse primers at 10 μmol/l, and nuclease-free water. The PCR conditions were as follows: 95°C for 5 min; 35 cycles of 95°C for 30 s, 60°C for 30 s, and 72°C for 1 min; and a final extension at 72°C for 10 min. The amplified fragments were run on a 1% agarose gel to check integrity, stained with ethidium bromide, and analyzed under UV light. The PCR products were purified using a gel extraction kit (Omega Bio-tek, GA, USA) and sequenced with PCR primer 2027F by using the ABI 3730XL automatic sequencer (Applied Biosystems, CA, USA).
Library construction for RAD-seq
Samples with total DNA quantity >1 μg were sequenced using RAD-seq, and the sample sizes from the eight locations for library construction were 13 (BJ), 13 (SJZ), 13 (HZ), 12 (WH), 13 (MS), 14 (GZ), 15 (ZJ), and 12 (LS). One microgram of genomic DNA was digested with EcoRI (New England Biolabs, MA, USA), which identifies the 5′-GAATTC-3′ sequence. The Illumina P1 adapter (BGI, Shenzhen, China) was ligated to the digested DNA. Then, the products from different samples were pooled and randomly fragmented using Covaris E210 (Covaris, MA, USA) with agarose gel selection for 300–500 bp. The products were purified using the QIAquick PCR Purification Kit (Qiagen, CA, USA). The fragments were end-repaired using End Repair Mix (Qiagen) and then purified. The repaired DNA was combined with A-Tailing Mix (Qiagen); Illumina P2 adaptors (BGI) were ligated to the adenylated 3′ ends of the DNA, followed by product purification. PCR amplification with PCR Primer Cocktail and PCR Master Mix (NEB, MA, USA) was performed to enrich the adapter-ligated DNA fragments. The PCR conditions were as follows: 98°C for 30 s; 15 cycles of 98°C for 10 s, 65°C for 30 s, and 72°C for 30 s; and a final extension at 72°C for 5 min. The PCR products were selected using agarose gel electrophoresis with target fragments and then purified. The library was quantified using the Agilent Technologies 2100 bioanalyzer (Agilent Technologies, CA, USA) and ABI StepOnePlus Real-Time PCR System (Applied Biosystems). The libraries, with 16 samples pooled per library, were pair-end sequenced using the PE150 strategy on the HiSeq X Ten platform (Illumina, CA, USA).
Sequence alignment and SNP identification
The filtered reads from all mosquito specimens were aligned to the reference genome of Aedes albopictus Foshan strain (GenBank accession: GCA_001444175.2) (38) and C6/36 cell line (GenBank accession: GCA_001876365.2) (39) with the Burrows–Wheeler Aligner bwa-0.7.17 software (bwa mem –M -t 5 -T 20) (40). The aligned.bam files were sorted and indexed using SAMtools v1.9 (41). GATK modules RealignerTargetCreator, IndelRealigner, BaseRecalibrator, and ApplyBQSR were used to process the.bam files (42). Then, HaplotypeCaller of GATK was used for variant calling of each sample (42). In this study, only SNPs were detected, and other complex events such as indels and multi-nucleotide polymorphisms were ignored. For instance, loci with more than two alleles were discarded to avoid potential sequencing errors. SNPs with global MAF > 0.05 across samples were retained to reduce false SNP identification (43). In addition, SNPs with a minimum genotyping rate of 80% within each population were retained. The following quality controls were also used for SNP calling: (a) mapping quality ≥55, (b) coverage depth >200 and <,000, and (c) Phred quality score for the assertion made in alternate bases >100. The SNPs were further filtered by removing the loci out of Hardy-Weinberg equilibrium with VCFtools v0.1.16 (44) and linkage disequilibrium with the parameter (–indep-pairwise 50 10 0.1) by using PLINK v1.9 (45) and then retained in the VCF output file. We only retained SNPs that were successfully genotyped in 50% of the individuals, a minimum quality score of 30, and a minimum read depth of 3 for further analysis.
Data analysis
The cox1 sequences from 231 mosquitoes were aligned using Clustal W multiple alignment in BioEdit version 7.2.5 (46). The number of segregating sites (S), haplotype diversity (Hd), average number of nucleotide differences (k), and nucleotide diversity (π) within each population were determined using DnaSP v5.10.1 (47). To determine the genealogical relationships among the haplotypes, a haplotype network was constructed using a statistical parsimony algorithm implemented in TCS v1.21 (48). The minimum number of mutational steps between sequences was calculated with >95% confidence.
The filtered VCF file containing the genome-wide SNPs was analyzed for the population genetics of Ae. albopictus. The SNP dataset was analyzed as follows: PGDSPIDER v.2.0.5.0 (49) was used to reformat the VCF files into ARP format files for Arlequin. Deviations from selective neutrality were tested using Fu's Fs statistic (50) and Tajima's D (51). The neutrality test was performed for each population to examine population expansion. The Bayesian model-based clustering program STRUCTURE v2.3 and the Maximum-Likelihood (ML) clustering program ADMIXTURE v1.3.0 (52) were used to infer the cryptic genetic structure. On the basis of the genome-wide SNPs, cox1 data, and microsatellite data from our previous study, Bayesian clustering analysis was performed by conducting 20 independent runs for each K = 1 to 8, using a “burn-in” value of 50,000 iterations followed by 200,000 repetitions with STRUCTURE v2.3 (53). The optimal number of clusters (K) was determined using the Delta K method of Evanno et al. (54). The results of the clustering analysis were visualized using the ggplot2 package in R v4.0.3 (55). VCFtools v0.1.16 (44) was used to reformat the VCF file of the SNP data into PLINK format files (MAP/PED) for ADMIXTURE. Furthermore, average pairwise FST was calculated between each pair of sampling populations, and the Mantel test and AMOVA were conducted using Arlequin v3.5.2.2 (56). The gene flow and migration rates between all pairwise populations were estimated using the Bayesian coalescence-based approach implemented in LAMARC v2.1.10 (57). The Adegenet package (58) in R software (55) was used to perform principal component analysis (PCA) and discriminant analysis of principal components (DAPC). Neighbor-joining (NJ) and ML phylogenetic trees were constructed using MEGA 7.0 (59), according to the Kimura 2-parameter (K2P) model (bootstrap = 100) for cox1, microsatellite, and genome-wide SNP data. The best-fitting model for evolution and model parameters was determined using the Bayesian Information Criterion in jModelTest 2.1.10 (60). A significance level at P < 0.05 was set for all statistical tests, and sequential Bonferroni correction (61) was used when significant correlations were detected between the paired data.
Results
Genetic variation and haplotype network based on Cox1
PCR amplification and sequencing of the mitochondrial cox1 gene resulted in the detection of a 765 bp fragment in each specimen, with no insertions or deletions. All 231 sequences were identical or possessed >99% similarity to Ae. albopictus (GenBank: KR068634). According to cox1 sequencing and identification of cryptic species in our previous study (27), no cryptic Ae. albopictus species were found in all populations. Twenty-seven variable sites were detected, and 20 of them were parsimony-informative. The ZJ population had the highest number of polymorphic sites (S = 10, the same as the GZ population), haplotype diversity (Hd = 0.890), and nucleotide diversity (π = 0.248) and the highest average number of nucleotide differences (k = 1.897). However, the BJ population had the lowest values for these genetic indices, as it had only two haplotypes (Table 1).
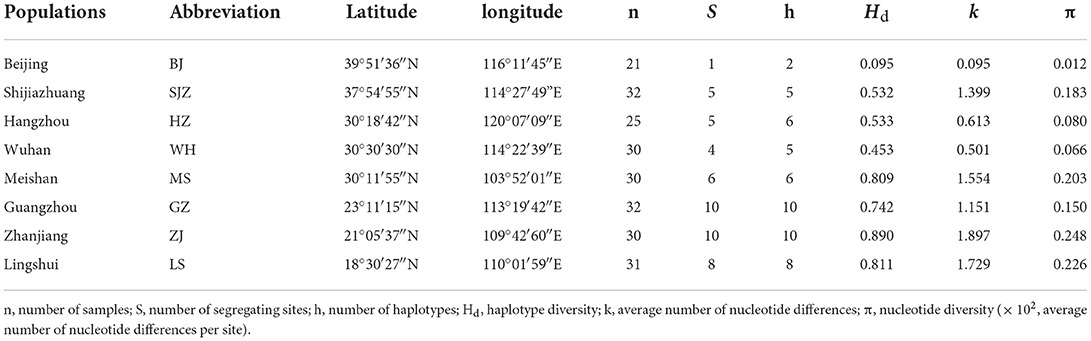
Table 1. Population information and genetic polymorphism based on cox1 of Ae. albopictus in China.
A total of 32 haplotypes of cox1 mtDNA were detected in the 231 specimens (GenBank: MT188111–MT188130, MT755918–MT755929). To determine the relationships between the specimens or haplotypes, we constructed a median-joining network using the haplotypes on the basis of sequence variation (Supplementary Figure S1). Most of the specimens were identified as H01 (45.9%) in the Ae. albopictus populations, but H01 was not detected in the LS population (Supplementary Figure S1). Some haplotypes were unique to a specific population (for example, H12, H13, and H15 in MS; H16, H17, H18, H19, H20, and H21 in GZ; H22, H23, H24, H26, and H27 in ZJ; and H28, H29, H30, H31, and H32 in LS), whereas the H05 and H06 haplotypes appeared simultaneously in specimens of the SJZ, ZJ, and LS populations (Supplementary Figure S1).
RAD-seq and data filtering
The average number of filtered quality reads per individual was approximately 24.79 million reads (range: 4,630,354–42,550,002; Supplementary Table S1). The Q20_rate (ratio of bases with a quality value >20 in all reads to the total length of reads) was more than 96%. Quality filtering yielded 33,769 SNPs, and a total of 9,968 SNPs were retained after checking for Hardy-Weinberg equilibrium and linkage disequilibrium. The mean and median values of SNP coverage per sample were shown using box-and-whisker plots (Supplementary Figure S2). Four samples had <50% of the loci genotyped, and 865 SNPs identified in <50% samples were removed; the remaining 9103 SNPs from the 101 samples were used for further population genetics analysis. A summary of the statistics for the counts of putative SNP loci and final counts of candidate SNPs after each filtering step is available in Table 2.
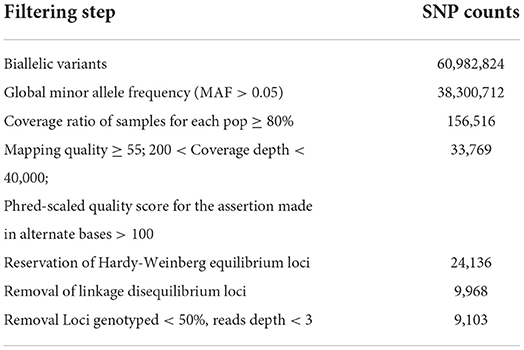
Table 2. Summary statistics for counts of putative SNP loci and final counts of candidate SNPs after different filtering steps.
Neutrality test, gene flow, and population genetic analysis
The neutrality of the SNP dataset was checked using Tajima's D and Fu's Fs tests. Tajima's D tests for all populations were not statistically significant (Table 3); this indicates that the populations are in genetic equilibrium, which is consistent with the neutral mutation hypothesis. Likewise, Fu's Fs tests were not statistically significant (Table 3) and rejected the population expansion/bottleneck model. Tajima's D tests and Fu's Fs tests of the cox1 data for the HZ and GZ populations were statistically significant (Table 3).
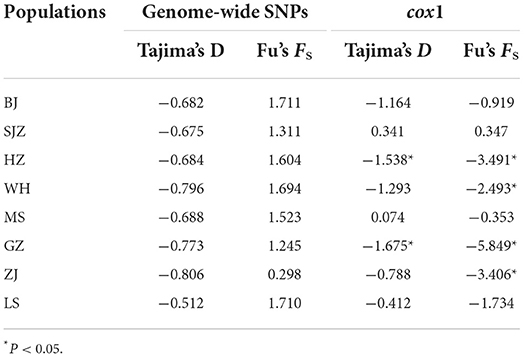
Table 3. Neutrality tests based on genome-wide SNPs and cox1 of Ae. albopictus populations in China.
On the basis of the SNP dataset, all 28 pairwise tests of genetic differentiation were significant at P < 0.05 after Bonferroni correction, and the pairwise FST values ranged from 0.020 (between WH and GZ) to 0.106 (between HZ and ZJ); a few pairwise tests showed no significance on the basis of the cox1 and microsatellite data (Supplementary Table S2). The Mantel test showed a statistically significant correlation (SNPs: y = 0.0177x−0.0618, R2 = 0.190, P = 0.006; microsatellites: y = 0.008x−0.0341, R2 = 0.288, P = 0.002) between the genetic distance [y, estimated as FST/(1 – FST)] and the geographical distance [x, estimated as Ln (km)] of populations on the basis of the SNP and microsatellite data, with no significant correlation (y = 0.1185x−0.5812, R2 = 0.117, P = 0.054) on the basis of the cox1 data (Supplementary Figure S3). The LAMARC analysis showed that the historical gene flow rates ranged from 5.6 to 87.8. An asymmetric gene flow was detected among populations, and it was higher from south to north and from west to east regions than the opposite directions (Figure 1).
The Bayesian clustering analysis based on the datasets of the three DNA markers showed that the ZJ and LS samples were clustered together and separated from the other populations when K = 2. In addition, the optimal cluster numbers (K) determined using the Delta K method for SNPs, cox1, and microsatellite data were 2, 2, and 3, respectively (Supplementary Figure S4). The ML clustering analysis based on the SNP dataset showed obvious division among the samples when K = 7, as the cross-validation error was the lowest (Figure 2). All samples were clearly separated on the basis of the SNP data rather than the cox1 and microsatellite data in the coordinate system of the DAPC (Figure 3). A large number of dots representing the samples of the DAPC based on the cox1 data (Figure 3B) overlapped because of many identical haplotypes in each population. The division of samples by DAPC on the basis of the microsatellite data was unclear (Figure 3C). The PCA results via the two-dimensional plots (Supplementary Figure S5) were consistent with those of the DAPC. The NJ phylogenetic tree (Figure 4) and ML phylogenetic tree (Supplementary Figure S6) constructed using the SNP dataset showed that each sample could be clearly separated and classified from its original population. In this respect, the SNPs outperformed cox1 (Figure 5; Supplementary Figure S7) and microsatellites (Figure 6). The phylogenetic analysis based on the SNP dataset showed that some samples from the SJZ had a close relationship with those from LS and ZJ, which is congruent with the H05 and H06 haplotypes limited to these populations in the cox1 haplotype network. The AMOVA results (Table 4) indicated that most variations in Ae. albopictus were within populations: 94.08%, SNPs; 67.24%, cox1; and 97.82%, microsatellites; variations among the populations accounted for 5.92% (genome-wide SNPs), 32.76% (cox1), and 2.18% (microsatellites) of the total variation. The fixation index among the populations showed significant genetic variation on the basis of Fisher's exact test for the three types of DNA marker data.
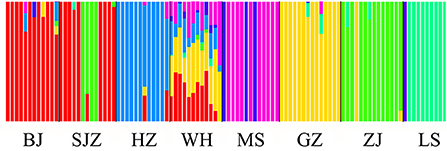
Figure 2. Structure analysis of the SNP dataset on the basis of the Maximum-Likelihood clustering method.
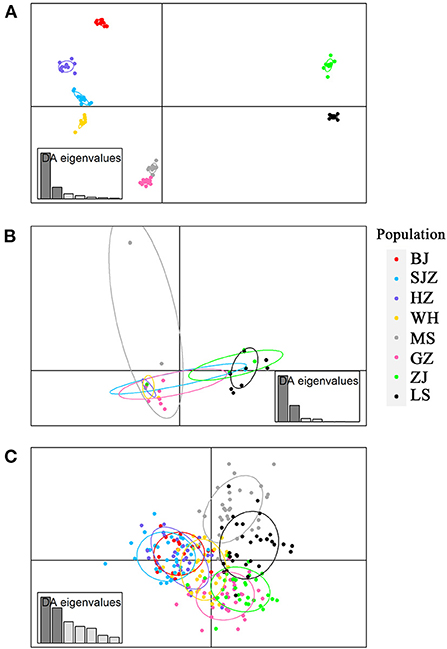
Figure 3. Discriminant analysis of principal components (DAPC) plots for genome-wide SNPs (A), cox1 (B) and microsatellites (C) in eight field populations of Ae. albopictus in China. The plots show the relationship between individuals belonging to eight different populations (represented by colored dots, where the color of a dot corresponds to a population).
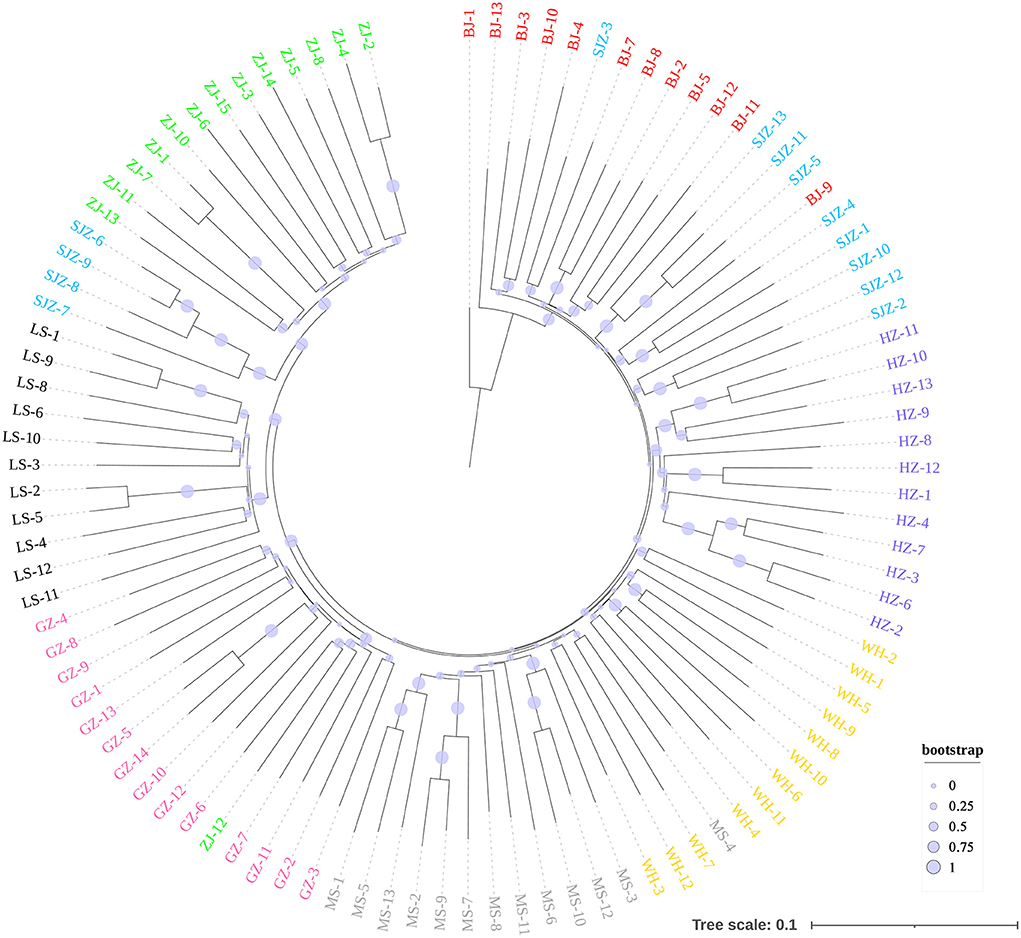
Figure 4. Neighbor-Joining phylogenetic tree constructed using 9,103 genome-wide SNPs.
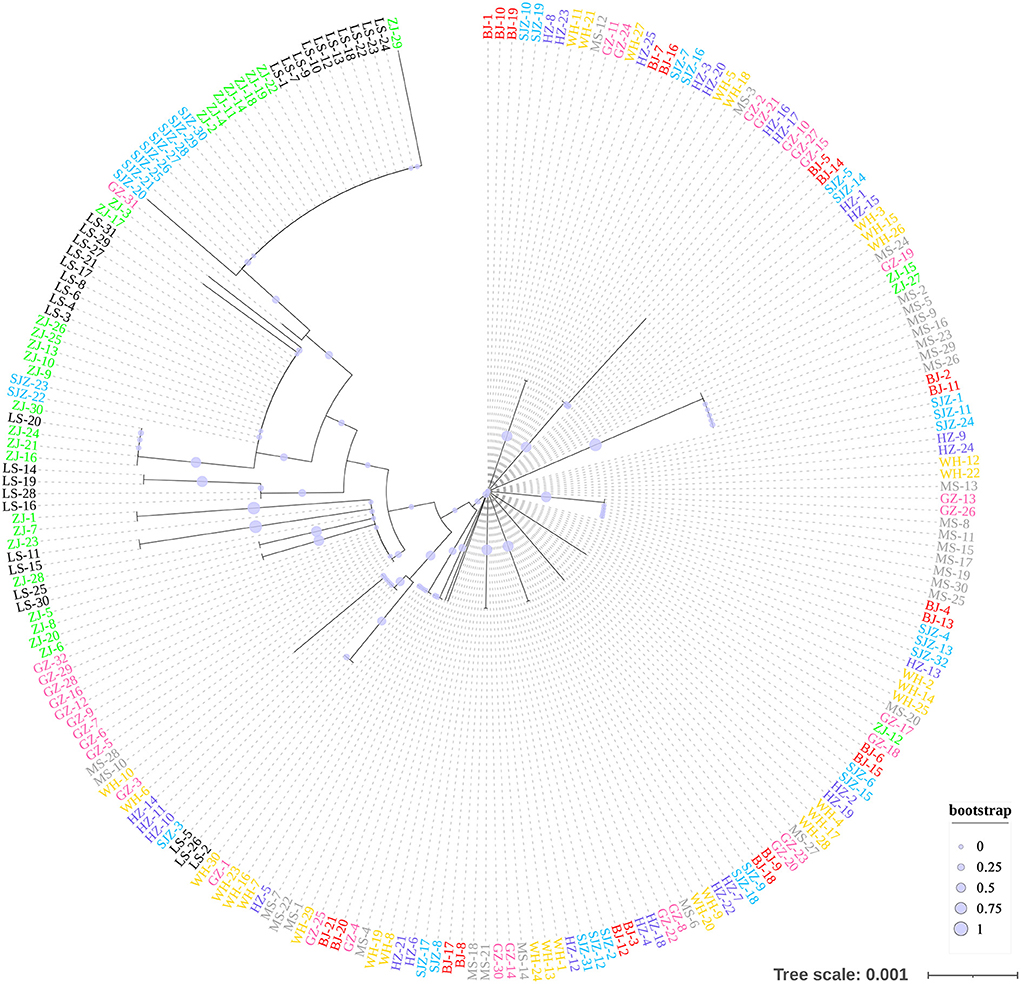
Figure 5. Neighbor-Joining phylogenetic tree constructed using the cox1 data.
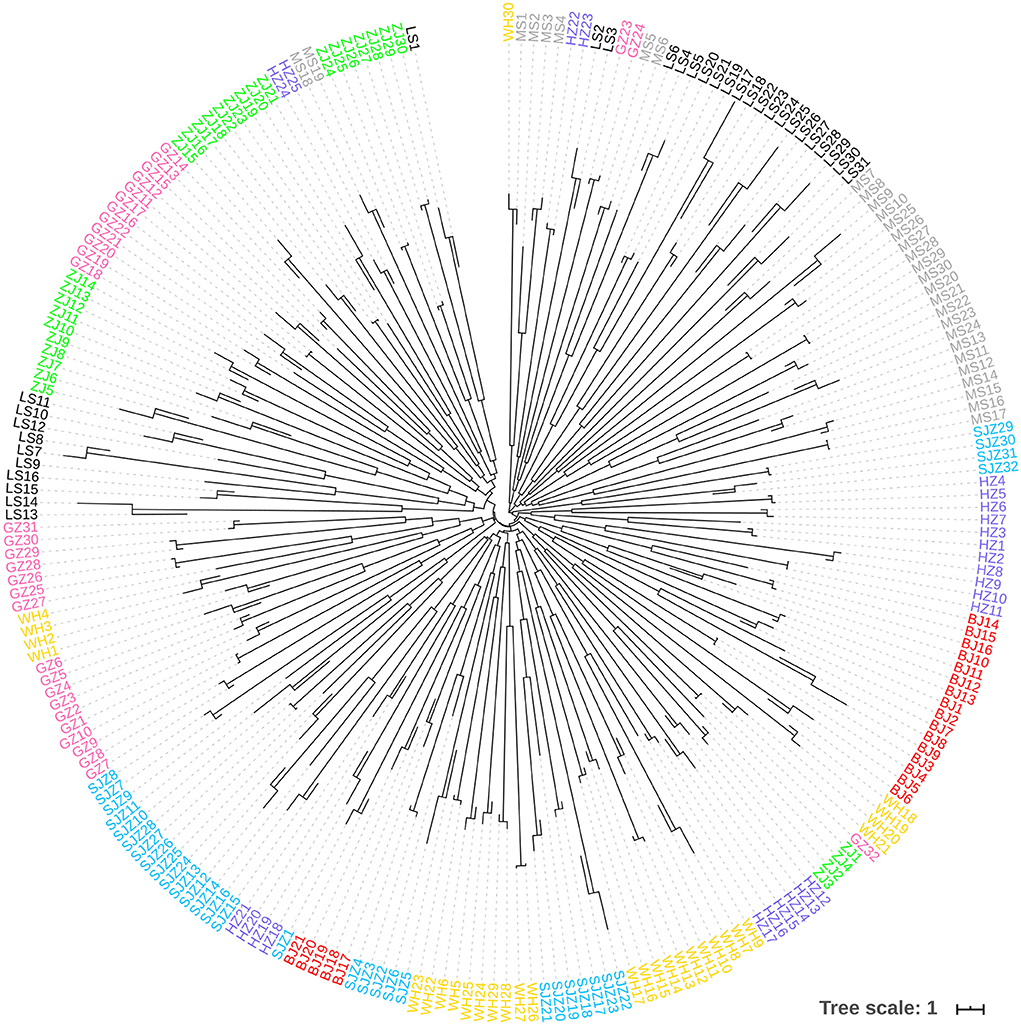
Figure 6. Neighbor-Joining phylogenetic tree constructed using the microsatellite data.
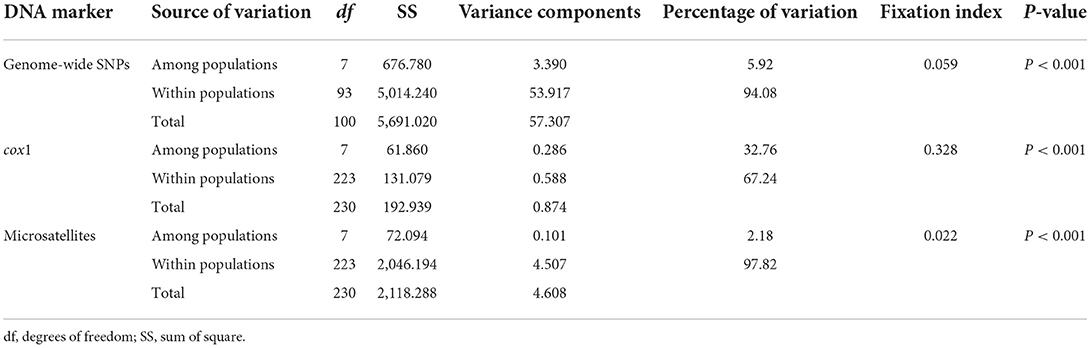
Table 4. Analysis of molecular variance (AMOVA) based on the three DNA markers of Ae. albopictus populations in China.
Discussion
Global warming and rapid development of transportation have caused the distribution of Ae. albopictus to continuously expand to the north of China (11). The invasion of Ae. albopictus has increased the potential risks of mosquito-borne diseases in some non-endemic areas in China (62). High-throughput genotyping with next-generation sequencing technology is being increasingly used to study the population genetics of disease vectors (31, 63, 64). An appropriate genotyping strategy and fine-population genetic analysis of Ae. albopictus would help us to understand the dynamics of its population spread and establishment and design strategies for controlling the vectors and mosquito-borne diseases (5, 22, 65).
In this study, the dominate haplotype H01 of cox1 was detected in seven geographical Ae. albopictus populations in mainland China, suggesting H01 is relatively conservative, as observed in another study of the Ae. albopictus population in China (66). The haplotype diversity is richer in southern China, which is similar to the findings of our previous study and other studies (14, 16, 27). One possible explanation is that the environment and climate in southern China are more conducive to survival, reproduction, and continuous dispersion, whereas the relatively dry and cold climate in northern China could result in lower allele richness and genetic diversity in Ae. albopictus populations (14, 16).
The results of Tajima's D and Fu's Fs tests based on the genome-wide SNPs indicated demographic equilibrium and no population bottleneck/expansion. Thus, these populations may exist stably and not have invaded recently as new founding populations (18). Previous studies have indicated two gene pools on the basis of microsatellites from the Ae. albopictus population in China (14, 27). The genome-wide SNPs results divided the eight Chinese Ae. albopictus populations into seven genetic clusters, indicating the presence of seven gene pools in the sampled areas. Individuals sampled from six populations were assigned to six different clusters, corresponding to actual geographical locations; in contrast, the WH and SJZ populations were mixed with individuals from other gene pools, indicating the coexistence of different genetic units in these locations, similar to other vector species in China (67).
Our results showed that the FST-values were low but significantly different among all populations, and some pairs were not significantly different in our previous study using microsatellites, for example, BJ and SJZ, HZ and SJZ, and GZ and ZJ populations. Compared to the results of clustering and population differentiation on the basis of cox1 and microsatellites, the genome-wide SNPs exhibited stronger separation between populations than the other markers, which is consistent with the results of previous studies (64, 68, 69). On the basis of the SNPs, the LS and ZJ populations were more genetically different than the other populations. Several factors may contribute to the genetic differentiation and shape the structure of the two southern populations and other populations in China: (1) The tropical climate characteristics (hot and humid) of Hainan Island and southern China facilitate the breeding and development of Ae. albopictus (70–73). (2) The thriving border trades and many famous tourist attractions in southern China provide many pathways for the introduction and movement of this species from other Southeast Asian countries, thus increasing genetic diversity (74). (3) The geographical isolation of Hainan Island is probably an important factor that limits species dispersal to other places, thus affecting the gene flow and distribution of genetic diversity (66, 75).
The population analysis using the SNP dataset showed that the SJZ population specimens had close evolutionary relationships with the ZJ and LS population specimens, which also confirms that they have the same specific cox1 haplotypes (H05 and H06). We speculated that several mosquitoes from individual SJZ collection points may have originated from ZJ and LS populations because of human-assisted transportation over long distances. When compared with the customs of provincial capital cities such as BJ, HZ, and WH, the customs of SJZ may have a relatively loose control on commercial transportation and species invasion. The population structure bar plots generated using STRUCTURE on the basis of the SNPs showed that the WH population had the highest shared SNP alleles with neighboring populations; this is possibly because Wuhan is a central city in China and a transportation hub, leading to an increase in mosquito migration and gene flow. The overall gene flow showed a trend from south to north and from west to east, which is consistent with the trend determined using a large number of samples in our previous study (27). Similar dispersal behavior can produce similar patterns of differentiation (76). Mosquitoes spread from south to north through active dispersal affected by global warming and passive dispersal caused by human activities (77–80). This also explains the reports of some dengue cases in new non-endemic areas in recent years (62, 81).
Genome-wide SNPs identified with next-generation sequencing (such as RAD-seq) that are used to analyze population genetics have two major advantages when compared with microsatellites and cox1: the need for smaller sample sizes and no need for prior genomic information (82, 83). SNP analyses have corroborated microsatellite-based findings and provided a more accurate and robust population structure than microsatellite analyses (68, 84). In our previous study (27), a set of polymorphic microsatellites were an economical choice for a large-scale population genetic clustering analysis, but not suitable for finer genetic structural analysis of relatively few populations of Ae. albopictus. It is important to consider a very high probability of incorrect conclusions from cox1 data when the data alone are used to infer the population history of arthropods, due to indirect selection on mtDNA cox1 arising from linkage disequilibrium with inherited microorganisms (such as Wolbachia) in Ae. albopictus (24). The Mantel test detected significant positive relationships between genetic and geographical distance, whereas no such relationships were evident from the cox1 data. Therefore, cox1 data could be problematic when performing the Mantel test for isolation by distance (IBD), as they often do not provide reliable information on the true dispersal potential of a species (25).
Currently, next-generation sequencing costs have decreased dramatically, and several reference genome assemblies of Ae. albopictus are available, including reference genomes AaloF1 (38) and AalbF2 (85) assembled from the Chinese Foshan strain and MNAF02 assembled from the C6/36 cell line (39); these assemblies greatly facilitate allele-specific measurements (65). In this study, we used two assembled genomes as references, and several samples were aligned with only 50% or less reads to the reference genome. This suggests reference bias, although the reference genome AaloF1 is based on a laboratory strain from a local population in China. Indeed, a previous study also obtained a low read mapping rate (25%) based on the primary reference assembly (29). However, the ~9,000 high-quality SNPs obtained in the study should be enough to assess the genetic diversity and population structure of Ae. albopictus. Overall, the genomic patterns identified in this study can help to identify biosecurity threats in Ae. albopictus by revealing a likely degree of gene flow (31, 80). The fine spatial genetic structure and gene flow data based on the genome-wide SNPs, in combination with other related factors such as mosquito density, climate, and rainfall, will be valuable for vector surveillance as well as epidemiological prediction and modeling of the incidence and spread of vector-borne diseases.
Conclusions
Next-generation sequencing techniques such as RAD-seq provide an increasingly affordable approach for generating numerous genetic markers to study disease vector populations. A total of 9,103 SNP loci and seven gene pools were identified from Ae. albopictus specimens by using RAD-seq, and the SNP dataset showed shallow but significant genetic differentiation among the populations, except specimens from WH and SJZ. The LS and ZJ populations were isolated from the other populations and exhibited the effects of geographical distance and barriers to gene flow. The Mantel test indicated a positive correlation between genetic distance and geographical distance. However, asymmetric gene flow was detected among the populations, and it was higher from south to north and west to east regions than the opposite directions. The resolution of the population genetic structure inferred from the genome-wide SNPs was better than that from the cox1 data and a set of polymorphic microsatellites. The RAD-seq based approach demonstrates great potential for obtaining information on the spatial dynamics of population spread and establishment and designing new strategies for the control of vectors and mosquito-borne diseases.
Data availability statement
The datasets presented in this study can be found in online repositories. The names of the repository/repositories and accession number(s) can be found in the article/Supplementary material.
Author contributions
YW and XZ conceived and designed the experiments. YW, SH, JW, PF, YH, KH, and YC performed the experiments. YW and DZ analyzed the data. YW, XZ, DZ, and GZ wrote and revised the manuscript. All authors read and approved the final manuscript.
Funding
This work was supported by the National Natural Science Foundation of China (No. 31630011), Natural Science Foundation of Guangdong Province (No. 2017A030313625), and the Science and Technology Planning Project of Guangzhou (No. 201804020084).
Acknowledgments
We would like to thank Yuanhuan Wei, Zhangyao Song, and Zihao Zheng for their assistance in collecting mosquito samples. We would also like to thank the native English speaking scientists of Elixigen Company (Huntington Beach, California) for editing our manuscript.
Conflict of interest
The authors declare that the research was conducted in the absence of any commercial or financial relationships that could be construed as a potential conflict of interest.
Publisher's note
All claims expressed in this article are solely those of the authors and do not necessarily represent those of their affiliated organizations, or those of the publisher, the editors and the reviewers. Any product that may be evaluated in this article, or claim that may be made by its manufacturer, is not guaranteed or endorsed by the publisher.
Supplementary material
The Supplementary Material for this article can be found online at: https://www.frontiersin.org/articles/10.3389/fpubh.2022.1028026/full#supplementary-material
References
1. Jia P, Chen X, Chen J, Lu L, Liu Q, Tan X. How does the dengue vector mosquito Aedes albopictus respond to global warming? Parasit Vectors. (2017) 10:140. doi: 10.1186/s13071-017-2071-2
2. Beebe NW, Ambrose L, Hill LA, Davis JB, Hapgood G, Cooper RD, et al. Tracing the tiger: population genetics provides valuable insights into the Aedes (Stegomyia) albopictus invasion of the Australasian Region. PLoS Negl Trop Dis. (2013) 7:e2361. doi: 10.1371/journal.pntd.0002361
3. Li Y, Xu J, Zhong D, Zhang H, Yang W, Zhou G, et al. Evidence for multiple-insecticide resistance in urban Aedes albopictus populations in southern China. Parasit Vectors. (2018) 11:4. doi: 10.1186/s13071-017-2581-y
4. Gratz NG. Critical review of the vector status of Aedes albopictus. Med Vet Entomol. (2004) 18:215–27. doi: 10.1111/j.0269-283X.2004.00513.x
5. Goubert C, Minard G, Vieira C, Boulesteix M. Population genetics of the Asian tiger mosquito Aedes albopictus, an invasive vector of human diseases. Heredity. (2016) 117:125–34. doi: 10.1038/hdy.2016.35
6. Pereira-dos-Santos T, Roiz D, Lourenço-de-Oliveira R, Paupy C. A systematic review: is Aedes albopictus an efficient bridge vector for zoonotic arboviruses? Pathogens. (2020) 9:266. doi: 10.3390/pathogens9040266
7. Wu F, Liu Q, Lu L, Wang J, Song X, Ren D. Distribution of Aedes albopictus (Diptera: Culicidae) in northwestern China. Vector Borne Zoonotic Dis. (2011) 11:1181–6. doi: 10.1089/vbz.2010.0032
8. Zheng X, Zhong D, He Y, Zhou G. Seasonality modeling of the distribution of Aedes albopictus in China based on climatic and environmental suitability. Infect Dis Poverty. (2019) 8:98. doi: 10.1186/s40249-019-0612-y
9. Lu L, Lin H, Tian L, Yang W, Sun J, Liu Q. Time series analysis of dengue fever and weather in <city>Guangzhou </city>, China. BMC Public Health. (2009) 9:395. doi: 10.1186/1471-2458-9-395
10. Guo YH, Lai SJ, Liu XB Li GC, Yu HJ, Liu QY. Governmental supervision and rapid detection on dengue vectors: an important role for dengue control in China. Acta Trop. (2016) 156:17–21. doi: 10.1016/j.actatropica.2015.12.011
11. Liu B, Gao X, Ma J, Jiao Z, Xiao J, Hayat MA, et al. Modeling the present and future distribution of arbovirus vectors Aedes aegypti and Aedes albopictus under climate change scenarios in Mainland China. Sci Total Environ. (2019) 664:203–14. doi: 10.1016/j.scitotenv.2019.01.301
12. Achee NL, Grieco JP, Vatandoost H, Seixas G, Pinto J, Ching-Ng L, et al. Alternative strategies for mosquito-borne arbovirus control. PLoS Negl Trop Dis. (2019) 13:e0006822. doi: 10.1371/journal.pntd.0006822
13. Fang Y, Zhang J, Wu R, Xue B, Qian Q, Gao B. Genetic polymorphism study on Aedes albopictus of different geographical regions based on DNA barcoding. Biomed Res Int. (2018) 2018:1501430. doi: 10.1155/2018/1501430
14. Gao J, Zhang HD, Guo XX, Xing D, Dong YD, Lan CJ, et al. Dispersal patterns and population genetic structure of Aedes albopictus (Diptera: Culicidae) in three different climatic regions of China. Parasit Vectors. (2021) 14:12. doi: 10.1186/s13071-020-04521-4
15. Md Naim D, Kamal NZM, Mahboob S. Population structure and genetic diversity of Aedes aegypti and Aedes albopictus in Penang as revealed by mitochondrial DNA cytochrome oxidase I. Saudi J Biol Sci. (2020) 27:953–67. doi: 10.1016/j.sjbs.2020.01.021
16. Zhong D, Lo E, Hu R, Metzger ME, Cummings R, Bonizzoni M, et al. Genetic analysis of invasive Aedes albopictus populations in Los Angeles County, California and its potential public health impact. PLoS ONE. (2013) 8:e68586. doi: 10.1371/journal.pone.0068586
17. Kamgang B, Wilson-Bahun TA, Irving H, Kusimo MO, Lenga A, Wondji CS. Geographical distribution of Aedes aegypti and Aedes albopictus (Diptera: Culicidae) and genetic diversity of invading population of Ae. albopictus in the Republic of the Congo. Wellcome Open Res. (2018) 3:79. doi: 10.12688/wellcomeopenres.14659.2
18. Maia RT, Scarpassa VM, Maciel-Litaiff LH, Tadei WP. Reduced levels of genetic variation in Aedes albopictus (Diptera: Culicidae) from Manaus, Amazonas State, Brazil, based on analysis of the mitochondrial DNA ND5 gene. Genet Mol Res. (2009) 8:998–1007. doi: 10.4238/vol8-3gmr624
19. Tedjou AN, Kamgang B, Yougang AP, Njiokou F, Wondji CS. Update on the geographical distribution and prevalence of Aedes aegypti and Aedes albopictus (Diptera: Culicidae), two major arbovirus vectors in Cameroon. PLoS Negl Trop Dis. (2019) 13:e0007137. doi: 10.1371/journal.pntd.0007137
20. Motoki MT, Fonseca DM, Miot EF, Demari-Silva B, Thammavong P, Chonephetsarath S, et al. Population genetics of Aedes albopictus (Diptera: Culicidae) in its native range in Lao People's Democratic Republic. Parasit Vectors. (2019) 12:477. doi: 10.1186/s13071-019-3740-0
21. Latreille AC, Milesi P, Magalon H, Mavingui P, Atyame CM. High genetic diversity but no geographical structure of Aedes albopictus populations in Réunion Island. Parasit Vectors. (2019) 12:597. doi: 10.1186/s13071-019-3840-x
22. Manni M, Guglielmino CR, Scolari F, Vega-Rua A, Failloux AB, Somboon P, et al. Genetic evidence for a worldwide chaotic dispersion pattern of the arbovirus vector, Aedes albopictus. PLoS Negl Trop Dis. (2017) 11:e0005332. doi: 10.1371/journal.pntd.0005332
23. Multini LC, de Souza AS, Marrelli MT, Wilke ABB. Population structuring of the invasive mosquito Aedes albopictus (Diptera: Culicidae) on a microgeographic scale. PLoS ONE. (2019) 14:e0220773. doi: 10.1371/journal.pone.0220773
24. Hurst GD, Jiggins FM. Problems with mitochondrial DNA as a marker in population, phylogeographic and phylogenetic studies: the effects of inherited symbionts. Proc Biol Sci. (2005) 272:1525–34. doi: 10.1098/rspb.2005.3056
25. Teske PR, Golla TR, Sandoval-Castillo J, Emami-Khoyi A, van der Lingen CD, von der Heyden S, et al. Mitochondrial DNA is unsuitable to test for isolation by distance. Sci Rep. (2018) 8:8448. doi: 10.1038/s41598-018-25138-9
26. Väli U, Einarsson A, Waits L, Ellegren H. To what extent do microsatellite markers reflect genome-wide genetic diversity in natural populations? Mol Ecol. (2008) 17:3808–17. doi: 10.1111/j.1365-294X.2008.03876.x
27. Wei Y, Wang J, Song Z, He Y, Zheng Z, Fan P, et al. Patterns of spatial genetic structures in Aedes albopictus (Diptera: Culicidae) populations in China. Parasit Vectors. (2019) 12:552. doi: 10.1186/s13071-019-3801-4
28. Kumar S, Banks TW, Cloutier S. SNP discovery through next-generation sequencing and its applications. Int J Plant Genomics. (2012) 2012:831460. doi: 10.1155/2012/831460
29. Sherpa S, Rioux D, Pougnet-Lagarde C, Despres L. Genetic diversity and distribution differ between long-established and recently introduced populations in the invasive mosquito Aedes albopictus. Infect Genet Evol. (2018) 58:145–56. doi: 10.1016/j.meegid.2017.12.018
30. Schmidt TL, Swan T, Chung J, Karl S, Demok S, Yang Q, et al. Spatial population genomics of a recent mosquito invasion. Mol Ecol. (2021) 30:1174–89. doi: 10.1111/mec.15792
31. Schmidt TL, Rasic G, Zhang D, Zheng X, Xi Z, Hoffmann AA. Genome-wide SNPs reveal the drivers of gene flow in an urban population of the Asian Tiger Mosquito, Aedes albopictus. PLoS Negl Trop Dis. (2017) 11:e0006009. doi: 10.1371/journal.pntd.0006009
32. Schmidt TL, Chung J, Honnen AC, Weeks AR, Hoffmann AA. Population genomics of two invasive mosquitoes (Aedes aegypti and Aedes albopictus) from the Indo-Pacific. PLoS Negl Trop Dis. (2020) 14:e0008463. doi: 10.1371/journal.pntd.0008463
33. Schmidt TL, Chung J, van Rooyen AR, Sly A, Weeks AR, Hoffmann AA. Incursion pathways of the Asian tiger mosquito (Aedes albopictus) into Australia contrast sharply with those of the yellow fever mosquito (Aedes aegypti). Pest Manag Sci. (2020) 76:4202–9. doi: 10.1002/ps.5977
34. Sherpa S, Blum MGB, Capblancq T, Cumer T, Rioux D, Després L. Unravelling the invasion history of the Asian tiger mosquito in Europe. Mol Ecol. (2019) 28:2360–77. doi: 10.1111/mec.15071
35. Sherpa S, Blum MGB, Després L. Cold adaptation in the Asian tiger mosquito's native range precedes its invasion success in temperate regions. Evolution. (2019) 73:1793–808. doi: 10.1111/evo.13801
36. Sherpa S, Gueguen M, Renaud J, Blum MGB, Gaude T, Laporte F, et al. Predicting the success of an invader: Niche shift versus niche conservatism. Ecol Evol. (2019) 9:12658–75. doi: 10.1002/ece3.5734
37. Wray GA. Genomics and the evolution of phenotypic traits. Annu Rev Ecol Evol Syst. (2013) 44:51–72. doi: 10.1146/annurev-ecolsys-110512-135828
38. Chen XG, Jiang X, Gu J, Xu M, Wu Y, Deng Y, et al. Genome sequence of the Asian Tiger mosquito, Aedes albopictus, reveals insights into its biology, genetics, and evolution. Proc Natl Acad Sci U S A. (2015) 112:E5907–15. doi: 10.1073/pnas.1516410112
39. Miller JR, Koren S, Dilley KA, Puri V, Brown DM, Harkins DM, et al. Analysis of the Aedes albopictus C6/36 genome provides insight into cell line utility for viral propagation. Gigascience. (2018) 7:1–13. doi: 10.1093/gigascience/gix135
40. Jo H. Multi-threading the generation of Burrows-Wheeler Alignment. Genet Mol Res. (2016) 15:1–7. doi: 10.4238/gmr.15028650
41. Li H, Handsaker B, Wysoker A, Fennell T, Ruan J, Homer N, et al. The Sequence Alignment/Map format and SAMtools. Bioinformatics. (2009) 25:2078–9. doi: 10.1093/bioinformatics/btp352
42. McKenna A, Hanna M, Banks E, Sivachenko A, Cibulskis K, Kernytsky A, et al. The Genome Analysis Toolkit: a MapReduce framework for analyzing next-generation DNA sequencing data. Genome Res. (2010) 20:1297–303. doi: 10.1101/gr.107524.110
43. Corander J, Majander KK, Cheng L, Merilä J. High degree of cryptic population differentiation in the Baltic Sea herring Clupea harengus. Mol Ecol. (2013) 22:2931–40. doi: 10.1111/mec.12174
44. Danecek P, Auton A, Abecasis G, Albers CA, Banks E, DePristo MA, et al. The variant call format and VCFtools. Bioinformatics. (2011) 27:2156–8. doi: 10.1093/bioinformatics/btr330
45. Slifer SH. PLINK key functions for data analysis. Curr Protoc Hum Genet. (2018) 97:e59. doi: 10.1002/cphg.59
46. Hall TA. BioEdit: a user-friendly biological sequence alignment editor and analysis program for Windows 95/98/NT. Nucleic Acids Symp Ser. (1999) 41:95–8.
47. Librado P, Rozas J. DnaSP v5: a software for comprehensive analysis of DNA polymorphism data. Bioinformatics. (2009) 25:1451–2. doi: 10.1093/bioinformatics/btp187
48. Clement MD, Posada D. Crandall KA. TCS: A computer program to estimate gene genealogies. Mol Ecol. (2000) 9:1657–9. doi: 10.1046/j.1365-294x.2000.01020.x
49. Lischer HE, Excoffier L. PGDSpider: an automated data conversion tool for connecting population genetics and genomics programs. Bioinformatics. (2012) 28:298–9. doi: 10.1093/bioinformatics/btr642
50. Fu YX. Statistical tests of neutrality of mutations against population growth, hitchhiking and background selection. Genetics. (1997) 147:915–25. doi: 10.1093/genetics/147.2.915
51. Tajima F. Statistical method for testing the neutral mutation hypothesis by DNA polymorphism. Genetics. (1989) 123:585–95. doi: 10.1093/genetics/123.3.585
52. Alexander DH, Novembre J, Lange K. Fast model-based estimation of ancestry in unrelated individuals. Genome Res. (2009) 19:1655–64. doi: 10.1101/gr.094052.109
53. Pritchard JK, Stephens M, Donnelly P. Inference of population structure using multilocus genotype data. Genetics. (2000) 155:945–59. doi: 10.1093/genetics/155.2.945
54. Evanno G, Regnaut S, Goudet J. Detecting the number of clusters of individuals using the software STRUCTURE: a simulation study. Mol Ecol. (2005) 14:2611–20. doi: 10.1111/j.1365-294X.2005.02553.x
55. R Core Team. R: A Language and Environment for Statistical Computing. Vienna: R Foundation for Statistical Computing (2020).
56. Excoffier L, Lischer HEL. Arlequin suite ver 35: a new series of programs to perform population genetics analyses under Linux and Windows. Mol Ecol Resour. (2010) 10:564–7. doi: 10.1111/j.1755-0998.2010.02847.x
57. Kuhner MK, LAMARC. 2.0: maximum likelihood and Bayesian estimation of population parameters. Bioinformatics. (2006) 22:768–70. doi: 10.1093/bioinformatics/btk051
58. Jombart T. Ahmed I. Adegenet 13-1: new tools for the analysis of genome-wide SNP data. Bioinformatics. (2011) 27:3070–1. doi: 10.1093/bioinformatics/btr521
59. Caspermeyer J. MEGA evolutionary software re-engineered to handle today's big data demands. Mol Biol Evol. (2016) 33:1887. doi: 10.1093/molbev/msw074
60. Darriba D, Taboada GL, Doallo R, Posada D. jModelTest 2: more models, new heuristics and parallel computing. Nat Methods. (2012) 9:772. doi: 10.1038/nmeth.2109
61. Rice WR. Analyzing tables of statistical tests. Evolution. (1989) 43:223–5. doi: 10.1111/j.1558-5646.1989.tb04220.x
62. Lai S, Huang Z, Zhou H, Anders KL, Perkins TA, Yin W, et al. The changing epidemiology of dengue in China, 1990-2014: a descriptive analysis of 25 years of nationwide surveillance data. BMC Med. (2015) 13:100. doi: 10.1186/s12916-015-0336-1
63. Evans BR, Gloria-Soria A, Hou L, McBride C, Bonizzoni M, Zhao H, et al. A multipurpose, high-throughput single-nucleotide polymorphism chip for the dengue and yellow fever mosquito, Aedes aegypti. G3. (2015) 5:711–8. doi: 10.1534/g3.114.016196
64. Rasic G, Filipovic I, Weeks AR, Hoffmann AA. Genome-wide SNPs lead to strong signals of geographic structure and relatedness patterns in the major arbovirus vector, Aedes aegypti. BMC Genomics. (2014) 15:275. doi: 10.1186/1471-2164-15-275
65. Kotsakiozi P, Richardson JB, Pichler V, Favia G, Martins AJ, Urbanelli S, et al. Population genomics of the Asian tiger mosquito, Aedes albopictus: insights into the recent worldwide invasion. Ecol Evol. (2017) 7:10143–57. doi: 10.1002/ece3.3514
66. Ruiling Z, Peien L, Xuejun W, Zhong Z. Molecular analysis and genetic diversity of Aedes albopictus (Diptera, Culicidae) from China. Mitochondrial DNA A DNA Mapp Seq Anal. (2018) 29:594–9. doi: 10.1080/24701394.2017.1325481
67. Ma Y, Yang M, Fan Y, Wu J, Ma Y, Xu J. Population structure of the malaria vector Anopheles sinensis (Diptera: Culicidae) in China: two gene pools inferred by microsatellites. PLoS ONE. (2011) 6:e22219. doi: 10.1371/journal.pone.0022219
68. Jeffries DL, Copp GH, Lawson Handley L, Olsén KH, Sayer CD, Hänfling B. Comparing RADseq and microsatellites to infer complex phylogeographic patterns, an empirical perspective in the Crucian carp, Carassius carassius, L. Mol Ecol. (2016) 25:2997–3018. doi: 10.1111/mec.13613
69. Campos M, Conn JE, Alonso DP, Vinetz JM, Emerson KJ, Ribolla PE. Microgeographical structure in the major Neotropical malaria vector Anopheles darlingi using microsatellites and SNP markers. Parasit Vectors. (2017) 10:76. doi: 10.1186/s13071-017-2014-y
70. Jackson JM, Pimsler ML, Oyen KJ, Koch-Uhuad JB, Herndon JD, Strange JP, et al. Distance, elevation and environment as drivers of diversity and divergence in bumble bees across latitude and altitude. Mol Ecol. (2018) 27:2926–42. doi: 10.1111/mec.14735
71. Du Z, Ishikawa T, Liu H, Kamitani S, Tadauchi O, Cai W, et al. Phylogeography of the Assassin bug Sphedanolestes impressicollis in East Asia inferred from mitochondrial and nuclear gene sequences. Int J Mol Sci. (2019) 20:1234. doi: 10.3390/ijms20051234
72. Chen B, Harbach RE, Walton C, He Z, Zhong D, Yan G, et al. Population genetics of the malaria vector Anopheles aconitus in China and Southeast Asia. Infect Genet Evol. (2012) 12:1958–67. doi: 10.1016/j.meegid.2012.08.007
73. Ruiling Z, Tongkai L, Zhendong H, Guifen Z, Dezhen M, Zhong Z. Genetic analysis of Aedes albopictus (Diptera, Culicidae) reveals a deep divergence in the original regions. Acta Trop. (2018) 185:27–33. doi: 10.1016/j.actatropica.2018.05.001
74. Lai S, Johansson MA, Yin W, Wardrop NA, van Panhuis WG, Wesolowski A, et al. Seasonal and interannual risks of dengue introduction from South-East Asia into China, 2005-2015. PLoS Negl Trop Dis. (2018) 12:e0006743. doi: 10.1371/journal.pntd.0006743
75. Yi C, Zheng C, Zeng L, Xu Y. High genetic diversity in the offshore island populations of the tephritid fruit fly Bactrocera dorsalis. BMC Ecol. (2016) 16:46. doi: 10.1186/s12898-016-0101-0
76. Dawson MN. Parallel phylogeographic structure in ecologically similar sympatric sister taxa. Mol Ecol. (2012) 21:987–1004. doi: 10.1111/j.1365-294X.2011.05417.x
77. Kraemer MUG, Reiner RC Jr, Brady OJ, Messina JP, Gilbert M, Pigott DM, et al. Past and future spread of the arbovirus vectors Aedes aegypti and Aedes albopictus. Nat Microbiol. (2019) 4:854–63. doi: 10.1038/s41564-019-0440-7
78. Roche B, Léger L, L'Ambert G, Lacour G, Foussadier R, Besnard G, et al. The spread of Aedes albopictus in Metropolitan France: contribution of environmental drivers and human activities and predictions for a near future. PLoS ONE. (2015) 10:e0125600. doi: 10.1371/journal.pone.0125600
79. Tatem AJ, Hay SI, Rogers DJ. Global traffic and disease vector dispersal. Proc Natl Acad Sci U S A. (2006) 103:6242–7. doi: 10.1073/pnas.0508391103
80. Medley KA, Jenkins DG, Hoffman EA. Human-aided and natural dispersal drive gene flow across the range of an invasive mosquito. Mol Ecol. (2015) 24:284–95. doi: 10.1111/mec.12925
81. Chen B, Liu Q. Dengue fever in China. Lancet. (2015) 385:1621–2. doi: 10.1016/S0140-6736(15)60793-0
82. Davey JW, Hohenlohe PA, Etter PD, Boone JQ, Catchen JM, Blaxter ML. Genome-wide genetic marker discovery and genotyping using next-generation sequencing. Nat Rev Genet. (2011) 12:499–510. doi: 10.1038/nrg3012
83. Willing EM, Hoffmann M, Klein JD, Weigel D, Dreyer C. Paired-end RAD-seq for de novo assembly and marker design without available reference. Bioinformatics. (2011) 27:2187–93. doi: 10.1093/bioinformatics/btr346
84. Telfer EJ, Stovold GT, Li Y, Silva-Junior OB, Grattapaglia DG, Dungey HS. Parentage reconstruction in Eucalyptus nitens using SNPs and microsatellite markers: a comparative analysis of marker data power and robustness. PLoS ONE. (2015) 10:e0130601. doi: 10.1371/journal.pone.0130601
Keywords: invasive species, restriction site-associated DNA sequencing (RAD-Seq), genetic diversity, gene pool, isolation by distance
Citation: Wei Y, He S, Wang J, Fan P, He Y, Hu K, Chen Y, Zhou G, Zhong D and Zheng X (2022) Genome-wide SNPs reveal novel patterns of spatial genetic structure in Aedes albopictus (Diptera Culicidae) population in China. Front. Public Health 10:1028026. doi: 10.3389/fpubh.2022.1028026
Received: 25 August 2022; Accepted: 28 October 2022;
Published: 10 November 2022.
Edited by:
Sheng-Qun Deng, Anhui Medical University, ChinaReviewed by:
Susanta Kumar Ghosh, National Institute of Malaria Research (ICMR), IndiaYang Luo, Hunan University of Technology, China
Copyright © 2022 Wei, He, Wang, Fan, He, Hu, Chen, Zhou, Zhong and Zheng. This is an open-access article distributed under the terms of the Creative Commons Attribution License (CC BY). The use, distribution or reproduction in other forums is permitted, provided the original author(s) and the copyright owner(s) are credited and that the original publication in this journal is cited, in accordance with accepted academic practice. No use, distribution or reproduction is permitted which does not comply with these terms.
*Correspondence: Xueli Zheng, zhengxueli2001@126.com