 Ying Zhang
 Yongmei Guan1
- 1School of Economics and Management, Southeast University, Nanjing, China
- 2Business School, Nanjing University, Nanjing, China
- 3Faculty of Business and Economics, University of Antwerp, Antwerp, Belgium
Alleviating catastrophic health expenditure (CHE) is one of the vital objectives of health systems, as defined by the World Health Organization. However, no consensus has yet been reached on the measurement of CHE. With the aim of further relieving the adverse effects of CHE and alleviating the problem of illness-caused poverty, the Critical Illness Insurance (CII) program has been operational in China since 2012. In order to verify whether the different measurements of CHE matter under China's CII program, we compare the two-layer CII models built by using the basic approach and the ability-to-pay (ATP) approach at a range of thresholds. Exploiting the latest China family panel studies dataset, we demonstrate that the basic approach is more effective in relieving CHE for all insured households, while the ATP approach works better in reducing the severity of CHE in households facing it. These findings have meaningful implications for policymaking. The CII program should be promoted widely as a supplement to the current Social Basic Medical Insurance system. To improve the CII program's effectiveness, it should be based on the basic approach, and the threshold used to measure CHE should be determined by the goal pursued by the program.
Introduction
As a kind of financial shock, catastrophic health expenditure (CHE) is a critical contributor to income and expenditure uncertainty, which in turn affect social welfare around the world (1–3). It is often justified as a way to create heavy financial burden for the sake of necessary health care and forces people to suffer from loss of income owing to their reduced labor supply and fall in productivity (4, 5); this significantly lowers the living standards of residents and pushes households below, or further below, the poverty line (6, 7).
However, no consensus has yet been reached on the measurement of CHE. Two approaches—the basic and ability-to-pay (ATP)—have been proposed (8). The basic approach defines CHE as spending for health care that exceeds a certain level of the patient's total income, consumption, or expenditure. The ATP approach defines CHE as the amount by which health spending exceeds the threshold of a household's ability to pay for health care. In addition, there is no agreement among health economists on the threshold of household expenditure (9). The basic approach usually uses 10% as the threshold value (10), whereas the ATP approach commonly adopts 40% (11). Some studies also compare a range of thresholds—typically 10–40%—to measure CHE (8). According to the previous literature, these two approaches have their own strengths and drawbacks. For instance, the basic approach defines as easy to understand, requires no further calculation, and does not depend on household allocation decisions; the ATP approach can make up for the shortcoming in the basic approach—its inability to distinguish between the poor and the rich (12).
Therefore, the present study intends to investigate whether using different approaches to measuring CHE affects China's Critical Illness Insurance (CII) program. Specifically, there are two methodological issues to consider. The first is to identify household resources that are available for health spending. The second is to determine the threshold used to identify health expenditures as catastrophic. Thus, we construct two-layer CII models based on the basic and ATP approaches and adopt a range of thresholds to measure CHE through two approaches. The empirical analysis is performed with household-level data from the latest China family panel study dataset, which is a national social survey project that includes detailed survey data on counties, households, and family members in 25 provinces and autonomous regions. Our study intends to expand the existing research by revealing that different measurements of CHE can lead to different performances in China's CII program. Further, as the second-largest economy and the most populous country in the world, China has established a CII program that covers a high percentage of CHE; thus, the CHE measurement approach used in China can provide reliable and worthwhile insights for countries around the world.
The remainder of the paper is organized as follows. Section Institutional Background and Comparison of Approaches provides a detailed introduction to China's CII program and compares the basic approach with the ATP approach. Section Two-Layer CII Models Based on the Two Approaches constructs two-layer CII models based on these two approaches. Section Empirical Results and Comparison makes the empirical comparison. Section Concluding Remarks concludes.
Institutional Background and Comparison of Approaches
Development of the Critical Illness Insurance Program in China
Since 1998, China has gradually established a multilevel medical insurance system (see Figure 1), of which the Social Basic Medical Insurance (SBMI) system is an essential component. The SBMI system consists of the following four schemes: the Government Free Medical Insurance (GFMI); the Urban Employee Basic Medical Insurance (UEBMI); the Urban Resident Basic Medical Insurance (URBMI); and the New Rural Cooperative Medical (NRCM). By the end of 2018, more than 95% of the population has been covered by the SBMI system, whose total expenditure accounted for 30.36% of the total medical expenses (13). However, the out-of-pocket (OOP) expenses in China remained high and, in some instances, catastrophic; they accounted for 28.77% of the total health expenditure in 2017.
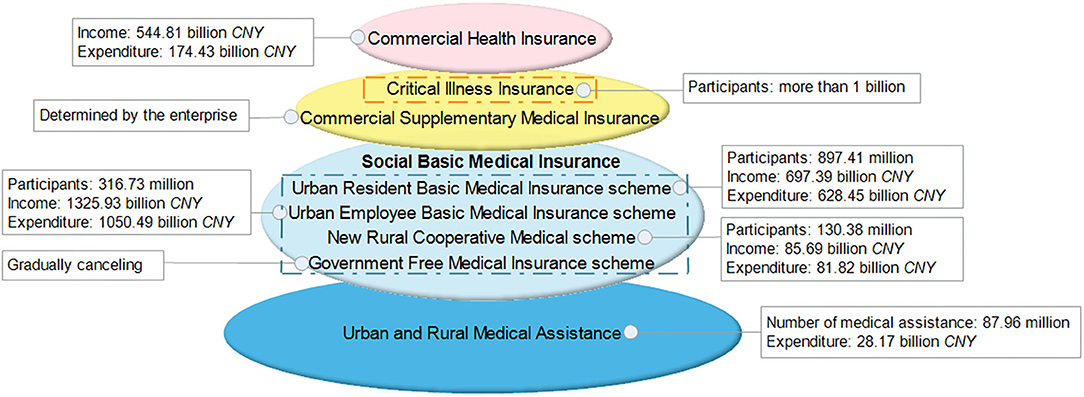
Figure 1. China's multilevel medical insurance system and its operation (2018).
With the aim of further reducing CHE and alleviating the problem of illness-caused poverty, the CII program—a supplement to the SBMI system—was launched in 2012 and fully implemented in 2015.
Coverage of the CII
The CII program covers the enrollees of both the URBMI scheme and the NRCM scheme. The two schemes, covering urban unemployed and self-employed residents and rural residents, are collectively referred to as the Social Resident Basic Medical Insurance (SRBMI). After 6 years of operations, the coverage of the CII program has greatly improved. By the end of 2017, the CII program had covered 1.06 billion residents.
The CII program is a medical program that compensates its members for CHE owing to critical illnesses that exceed the cap line of SRBMI. There are some differences in the scope of diseases reimbursed by CII for urban and rural residents. For urban residents, the diseases mainly include malignant tumor chemotherapy (including endocrine-specific antitumor treatment), malignant tumor radiotherapy, isotope antitumor treatment, interventional antitumor treatment, traditional Chinese medicine antitumor treatment, hemodialysis, and dialysis for severe uremia, anti-rejection treatment after kidney transplantation, and mental illness treatment (including schizophrenia, moderate to severe depression, mania, obsessive–compulsive disorder, mental retardation accompanied by mental disorder, epilepsy associated with mental disorder, and paranoid psychosis).
For rural residents, the diseases covered include gastric cancer, esophageal cancer, colon cancer, rectal cancer, lung cancer, liver cancer, breast cancer, cervical cancer, end-stage kidney disease, childhood congenital heart disease, childhood leukemia, childhood lymphoma, cataract, pneumoconiosis, neuroblastoma, osteosarcoma, hemophilia, thalassemia, cleft lip and palate, hypospadias, multidrug-resistant tuberculosis, stroke, chronic obstructive emphysema, and AIDS-related opportunistic infections.
However, in some provinces the scope of CII compensation is defined by the level of medical expenses, rather than disease type. For example, in Beijing, the deductible under CII is the annual per capita disposable income of rural residents in the previous year. When an individual's OOP expenses exceed the deductible, it means that the individual has suffered from critical illnesses.
The specific reimbursement rate of the CII program (i.e., 55% in Shanghai and 60% in Hebei) is determined by the local government; however, the central government has mandated that the rate should be no <50%. By the end of 2017, the overall reimbursement ratio of CII had reached 70%, far exceeding the target of “not <50%” (14).
Financing Patterns of the CII
Currently, the CII program is financed by the SRBMI Fund. If there is sufficient surplus in the SRBMI fund, part of the surplus is to be used as CII fund; otherwise, part of the SRBMI fund raised in that year will be set aside for the CII fund. The specific financing patterns can be divided into two types. The first allocates a certain percentage—the most common is 5% and has been implemented in Beijing, Fujian, Guangdong, Guizhou, Hubei, Hunan, Inner Mongolia, Jiangxi, and Jiangsu—of the SRBMI fund to the CII fund. The other type uses a certain amount—ranging from CNY 28 to CNY 80 per person—from the SRBMI. Most provinces, municipalities, and autonomous regions in China adopt the first pattern, which is supplemented by the second pattern. In general, no matter what kind of financing pattern is adopted, the funding standard is low, and the funding source is not sustainable (15).
According to the policy requirements, the CII program should be implemented at least at the municipal level, while provincial-level coordination is encouraged to improve the ability to diversified risks. At present, only nine out of the 34 provinces, including the four direct-controlled municipalities, that is, Beijing, Tianjin, Shanghai, and Chongqing and five other administrative units, that is, Jilin, Gansu, Qinghai, Hainan, and Tibet, have achieved provincial-level coordination for the CII program. All the other regions have municipal-level coordination.
Problems of the CII
The current CII program needs further improvement. On the one hand, the coverage of the CII program should be increased to reduce OOP expenses. The OOP expenses in China accounted for 28.77% of the total health expenditure in 2017—a figure that is much higher than the world average of 18.15% in 2015. On the other hand, the pricing mechanism needs to be converted from fixed premium [fixed amount or a percentage of the SRBMI fund] to actuarial pricing to maintain the fund's sustainable performance.
The Basic vs. Ability-to-Pay Approaches
The Definitions
CHE is an indicator reflecting the effectiveness of the financial protection that a health insurance policy could provide for its members, and investigating the extent of CHE is the first step to develop appropriate policy responses (11). In previous studies, the basic and ATP are two most commonly used approaches for measuring CHE.
The basic approach defines CHE as spending for health care that exceeds a certain level of a household's entire budget, that is, its total income (16–18) consumption (19, 20), or expenditure (21–23). The household budget is defined as the value of consumption in low- and middle-income countries, but in the high-income countries, it is given by the expenditure on goods and services (24). In empirical studies, the expenditure method takes precedence (25). If total household expenditure is not available, income or consumption can be used as its proxy variable (25).
The ATP approach defines CHE as health spending that exceeds the threshold of a household's ability to pay for health care (9, 11, 22, 26). According to different understandings of household's ability to pay, the ATP approach can be further divided into three methods—actual food spending, partial normative food spending, and normative spending on food, housing, and utilities (25). The main difference among the three methods is the basic need that is subtracted from household total expenditure to calculate CHE.
The Comparison
There is much academic debate on the applicability and effectiveness of the basic and ATP approaches. Both approaches have their own advantages and limitations, and neither approach is universally applicable. Therefore, the choice of approach requires specific consideration of the problem studied and the availability of data. A comparison of the two approaches is given below.
The basic approach, which uses household total income, consumption, or expenditure as the denominator for calculation of CHE, has the virtue of simplicity. A further advantage of this approach is that it is not dependent on household allocation decisions across consumption items (12). However, it has some limitations. First, it fails to distinguish between poor households that just manage to meet subsistence needs and rich households that enjoy some latitude in spending (12). Second, if households finance a substantial share of their health payments through coping strategies, the gross expenditure on OOP payments is not equal to the resources available for non-medical consumption; thus, in this case, poverty will be underestimated (8). Finally, the measurement of CHE and impoverishment that ignores the personal financing means can mislead in terms of the consequences of high OOP expenses. It can not only exaggerate the risk to current consumption and CHE but also overlook the long-term burden of health payments (3).
The ATP approach can address the first limitation of the basic approach effectively. Because it assumes that the poor households would spend a much higher proportion of available resources on necessary items (commonly food, rent, and utilities) than the rich households, it defines household resources as being net of such spending, that is, actual food spending or a standard amount representing the subsistence spending. Nevertheless, the ATP approach has its own drawbacks. First, it is unhelpful in determining the extent to which OOP expenses eat into resources required for necessities (27). Besides, the usefulness of the way used to measure the ability to pay remains doubtful. If the household can borrow or save to finance their OOP medical expenses, its ability to pay should be measured by consumption; otherwise, it needs to be measured by income (27, 28). However, it is often the case that the precise income data is unavailable in low- and middle-income countries, so there is no option but to use household consumption; this can lead to a misestimation of the incidence of CHE (28).
The Threshold
The threshold level used to identify CHE in empirical papers is arbitrary. For the Sustainable Development Goals (SDGs), CHE is measured by the basic approach, in which both 10% (10, 21, 29) and 25% of the budget are commonly used to determine it. Among studies using total consumption, 10% is more common and is used in 41% of the literature; 5, 20, and 25% of consumption are less common and account for 13, 12, and 6%, respectively, of the literature (28). The ATP approach commonly adopts 25% (25) or 40% (30, 31) as the threshold value. Besides, a range of thresholds, typically extending from 10 to 40%, are used to compare the difference in CHE between the basic approach (32, 33) and the ATP approach (34–37). Scholars also compare the performances of these two approaches at different thresholds (8, 38–40). The existing literature shows that the incidence and intensity of CHE and the poverty impact decrease when the threshold rises (32, 34, 36). Some papers arrive at the conclusion that the incidence of CHE in the basic approach at the 10 % threshold is higher than that in the ATP approach at the 40% threshold (24, 38).
Two-Layer CII Models Based on the Two Approaches
The Models
The two-layer CII models (41, 42) are constructed to act as a bridge between the SRBMI and private health insurance (PHI). In these models, we assume that the CII covers all the enrollees of SRBMI and compensates inpatient medical expenses partially by the choice of the deductible, compensation ratio, and cap line.
The First Layer
The first layer CII model uses the reinsurance technique to compensate the excessive cumulative annual inpatient medical expense above the deductible CD, but within the cap line TL1, and the compensation ratio is (1 − β1).
When CD < xi ≤ TL1, the OOP expense can be expressed as:
Here, xi is the cumulative annual medical expense of household i, and the compensation ratio in SRBMI is (1 − α).
The Second Layer
The second layer CII model uses the coinsurance technique to partially compensate for the OOP expense. The cap line and compensation ratio are TL2 and (1 − β2), respectively.
When TL1 < xi ≤ TL2, the OOP expense can be expressed as:
The Indicators
Deductible
The deductibles for the CII models in the basic approach at 10 and 25% thresholds are 0.1y1 and 0.25y1, respectively, while in the ATP approach the deductibles at the 25 and 40% thresholds are 0.25y2 and 0.4y2, respectively. Here, y1 represents the household annual total expense and y2 represents the household annual non-food expense.
Cap Line
The cap line of the first layer and second layer can be expressed as follows:
(4) Here, F(•) is the cumulative distribution function of household total expense or household non-food expense.
Compensation Ratio
The purpose of the CII program is to alleviate CHE. Based on this objective, the objective function can be expressed as.
Here, I(•) equals to 1 when the inequality condition in the parentheses is satisfied, and 0 otherwise. The parameter b, which is related to the threshold used, satisfies the following relationship.
Detailed indicators of the CII models are shown in Figure 2.
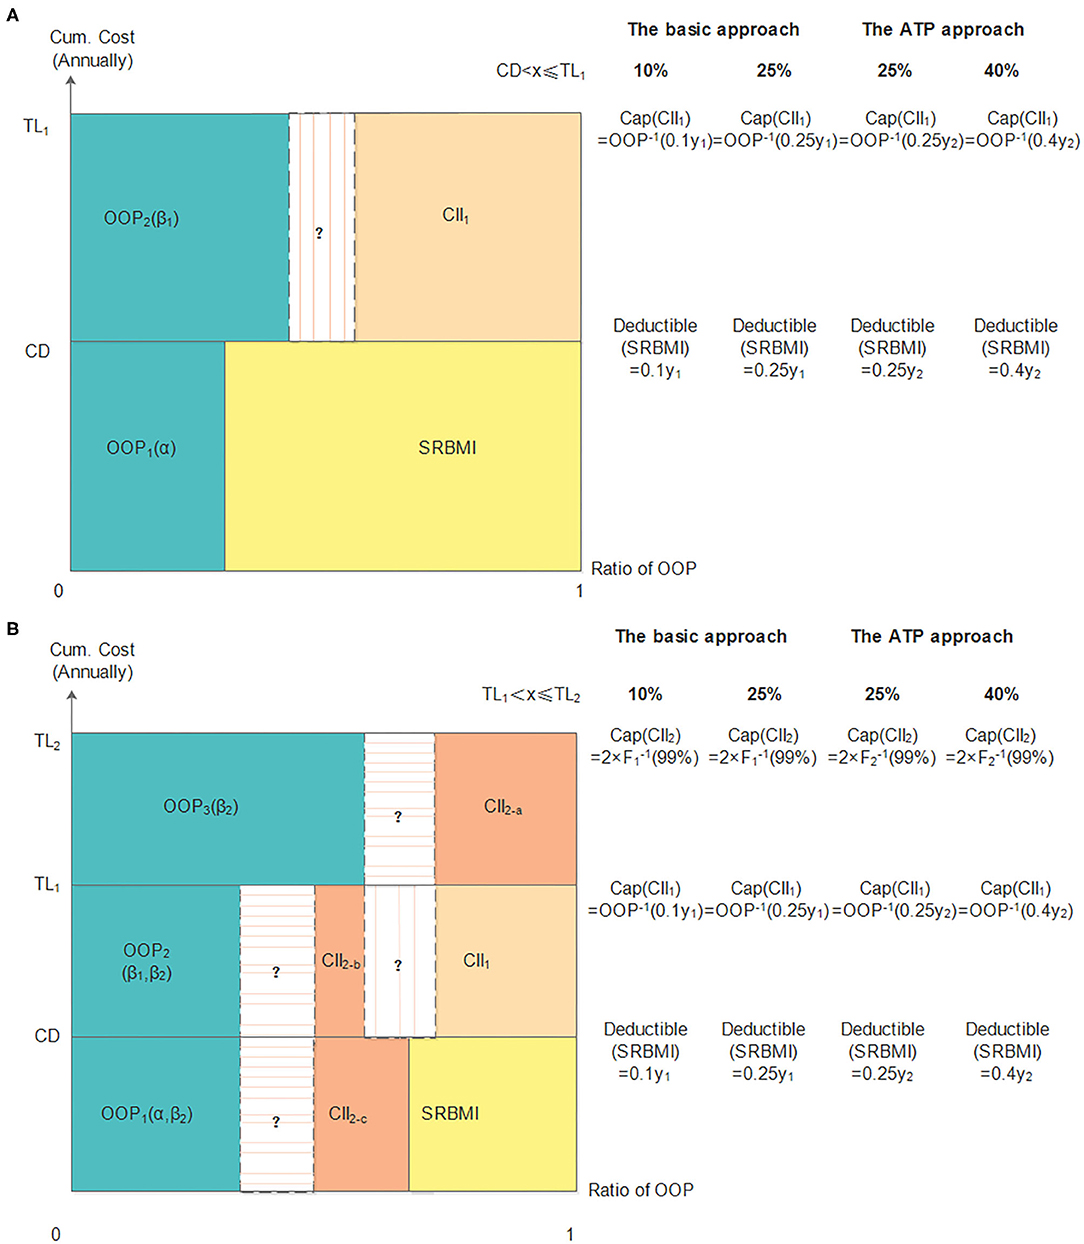
Figure 2. The two-layer CII models in the basic and ATP approaches. (A) shows the first layer CII model and panel (B) shows the two-layer CII model.
The Performance Evaluation
Incidence
The incidence is the ratio of insured households whose OOP expenses exceed the CHE. The number of insured households whose OOP expenses exceed the CHE is denoted as e, and the total number of insured households is denoted as E.
Severity
Overall severity (S) is the average surplus of OOP expenses exceeding the CHE of all insured households. In order to measure the severity in households that incurred catastrophic expenses, regional severity (Sreg) is proposed. It is the average value by which the OOP expenses exceed the CHE of those who suffer from it. Further, considering that the severity of household CHE can be affected by the number of family members, average severity (Save) is adopted. It is the per capita surplus of OOP expenses beyond the CHE for all insured households. Here, N is the total number of household residents.
Premium Setting
Assume that the probability of a member of a family being hospitalized is P(h = 1). The conditional probability distribution function can be expressed as follows:
Here, X1 represents the factors that affect P(h = 1), and B1 is the coefficient vector of X1. In this paper, the multivariate logit model is adopted to predict the probability of a member of a family being hospitalized.
CHE often exhibits the characteristics of an event with a low probability, but causing a large loss, and the distribution function is typically right-skewed and fat-tailed. Therefore, the lognormal distribution shown in Equation (12) can be adopted to fit high inpatient medical expenses. Assuming that household inpatient medical expenses and household total expense or non-food expense in the previous year are independent, the Weibull distribution (43) can be used to fit a household's total expense and its non-food expense. The joint probability density function is expressed in Equation (13).
Here, X2 represents the factors that affect household inpatient medical expenses, and B2 is the coefficient vector of X2.
In the first layer, the expected loss of CII can be expressed as:
Considering that it is difficult to obtain medical expense data that fully satisfy the actuarial requirements, we add a risk loading that is 30%1 of the risk premium. Further, to attract commercial health insurers, the additional premium ratio is set at 15%.2. The pure premium and gross premium can be calculated as follows.
In the second layer, the expected loss can be expressed as Equation (17).
We apply a risk loading of 40%3 of the pure premium, and the additional premium ratio is set at 15%. The pure premium and gross premium can be calculated as follows4:
The Fund Balance
The balance of the CII fund is measured by the difference between the fund's income and expenditure. The income and expenditure are expressed in Equation (20). Here, EXPi is the reimbursement paid to household i.
Empirical Results and Comparison
Data Description
We use household-level data from the latest CFPS to test the performances of the CII models by using the basic and ATP approaches. The database is updated every 2 years, and after deleting missing data, our samples in 2010, 2012, 2014, and 2016 cover 7,579, 7,685, 10,080, and 7,056 households, respectively. The number of households that had inpatient experiences in 2010, 2012, 2014, and 2016 is 1,315, 1,842, 2,326, and 2,154, respectively. The definitions of the variables and the data descriptions are listed in the Appendix.
Our process of empirical analysis process is as follows. First, the samples in 2014 are used to fit household hospitalization probability and inpatient medical expense in 2016. Specifically, the multivariate logit model is adopted to predict the probability that a member of a family is hospitalized, and the ordinary least square (OLS) model is used to predict the conditional probability distribution function of household inpatient medical expenses. Then, by combining the coefficients in Table 5 in the Appendix and the linear trend of the variables between 2010 and 2014, the hospitalization probability and inpatient medical expense in 2016 can be predicted. After that, assuming that the compensation ratio of SRBMI in China is 0.75, we can calculate the indicators of the CII models in the two approaches using the data from the CFPS (2012). At last, the performances of the CII models and the balance performances of the CII fund in the two approaches can be simulated using the data from CFPS (2016).
Table 1 shows that the hospitalization probability in 2016 is 24%, and the mean lognormal inpatient medical expense is CNY 8.89.
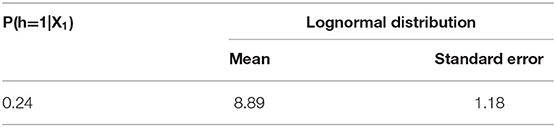
Table 1. The predicted parameters (2016).
Threshold of CHE
Table 2 shows the household cumulative total expense and non-food expense. The average and 99th percentile of household total expense are CNY 42,027.97 and CNY 250,000, respectively. Thus, in the basic approach, the mean value of the household CHE at the 10 and 25% threshold are CNY 4,202.80 and CNY 10,506.99, respectively, and the cap amount of the second layer (TL2) is CNY 500,000. The average and 99th percentile of household non-food expense is CNY 27,305.52 and CNY 210,540, respectively. Accordingly, the mean value of household CHE at the 25 and 40% threshold in the ATP approach are CNY 6,826.38 and CNY 10,922.21, respectively, and TL2 in this approach is CNY 421,080.
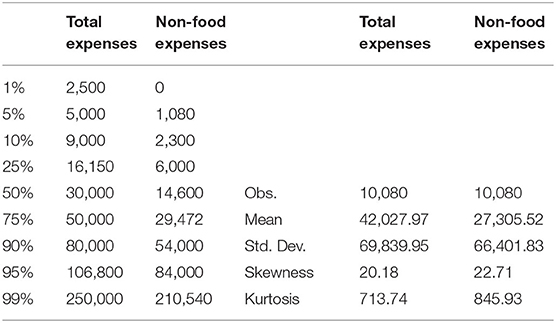
Table 2. Household cumulative total expenses and non-food expenses (2014).
The Basic Approach's Performance
The Indicators
The indicators of the CII models in the basic approach are shown in Table 3 and Figure 3. The two thresholds used in this approach are 10 and 25%. The deductible and the cap amount of the first layer at the 25% threshold are higher than those at the 10% threshold, and the cap amount of the second layer at both the thresholds is CNY 500,000. Accordingly, the compensation ratios (1–β1) and (1–β2), at the 25% threshold, are lower than those at the 10% threshold. Then, the final household cumulative OOP payments under the model can be calculated as shown in Table 4. When cumulative annual inpatient expenses are below TL1, OOP expenses are positively correlated with household total expenses; otherwise, they are negatively correlated.
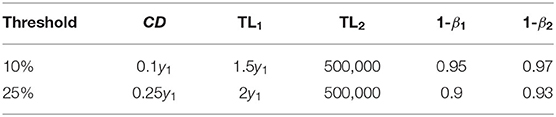
Table 3. Indicators of the CII model in the basic approach.
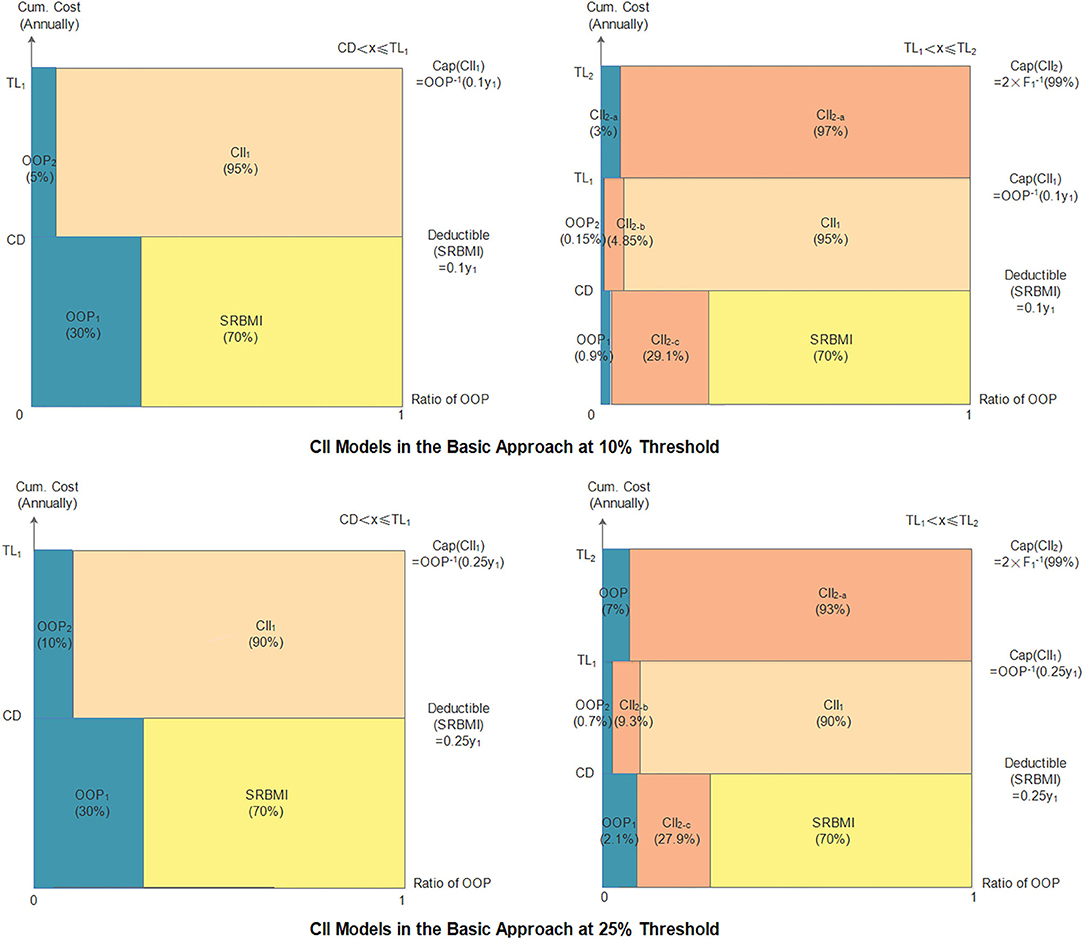
Figure 3. CII models in the basic approach.
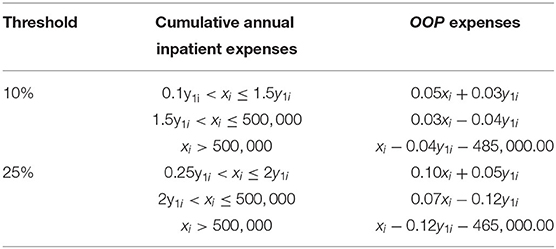
Table 4. Household cumulative OOP expenses in the basic approach.
The Performance Evaluation of the CII Model
As can be seen in Table 5, before any reimbursement, the incidence of CHE at the 10 and 25% thresholds is 23.57 and 15.32%, and the overall severity at the two thresholds is CNY 3,901.82 and CNY 3,068.25, respectively. In the two-layer CII models, the four indicators are all reduced to a much lower level. The incidence, overall severity, average severity, and regional severity at the 10% threshold are 0.85%, CNY 22.16, CNY 5.72, and CNY 2,605.56, respectively, and at the 25% threshold, they are 0.72%, CNY 21.26, CNY 5.49, and CNY 2,941.24, respectively. These results demonstrate that both the two-layer CII models can effectively reduce the incidence and severity of CHE. In addition, it is noticed that all indicators, except for regional severity, at the 10% threshold are higher than those at the 25% threshold; this means that the model at the 10% threshold is more effective in alleviating CHE for households suffering from it.
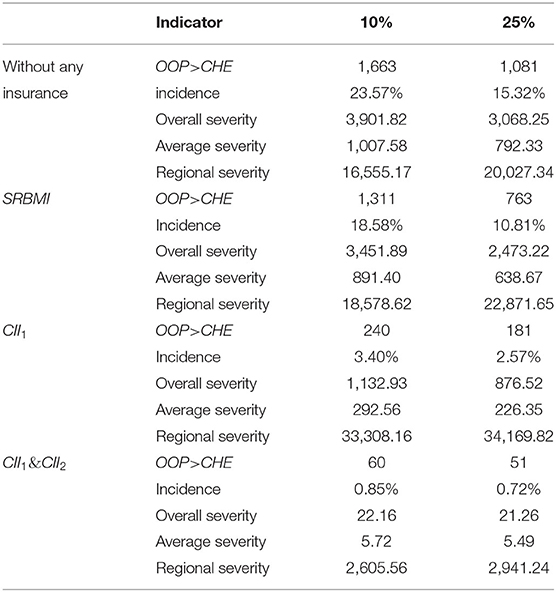
Table 5. Performance evaluation of the CII model in the basic approach.
The Premium Setting in the CII Model
The parameters of the probability distribution function of household total expense in 2012 can be calculated via maximum likelihood estimation (MLE). The scale and shape parameters are 42,985.86 and 1.05, respectively. Given the simplicity of calculation, we assume that household inpatient medical expenses and household total expenses in the previous year are mutually independent. The joint probability density function can be expressed as shown in Equation (22). Then, the pricing of the CII models can be simulated according to the premium calculation formulas of Pricing I and Pricing II. As can be seen in Table 6, both the pure and gross premiums in the two-layer CII models at the 10% threshold are higher than those at the 25% threshold.
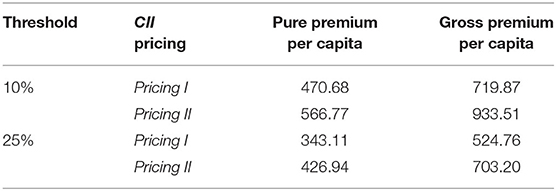
Table 6. The CII pricing simulation in the basic approach.
The Fund Balance in the CII Model
We assume that all residents paid Pricing I or Pricing II in 2014; thus, the number of insured individuals is 37,984. As can be seen in Table 7, regardless of the pricing, the CII fund is fairly balanced and can have a slight surplus. Thus, the pricing of the proposed CII design can achieve the desired financial sustainability.
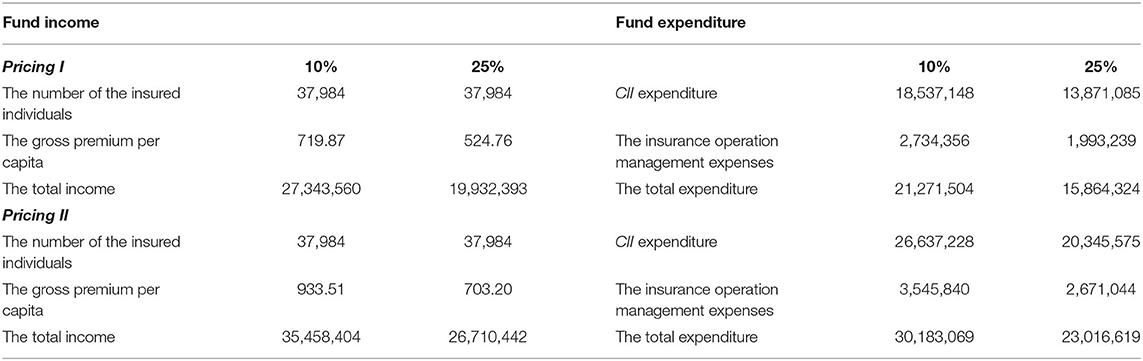
Table 7. The fund balance of the CII in the basic approach.
The ATP Approach's Performance
The Indicators
The indicators of the CII models in the ATP approach are shown in Table 8 and Figure 4. The two thresholds used in this approach are 25 and 40%. As in the basic approach, the deductible and cap amount of the first layer at the 25% threshold are lower than those at 40% threshold, while the compensation ratios (1–β1) and (1–β2), at the 25% threshold are higher than those at the 40% threshold. The cap amount of the second layer CII model at the two thresholds is the same that is, CNY 421,080. Thus, the final household cumulative OOP payments under the model at the two thresholds are calculated in Table 9.
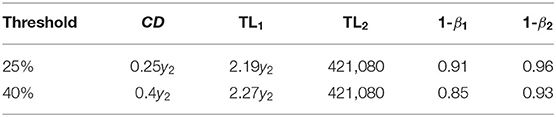
Table 8. Indicators of the CII model in the ATP approach.
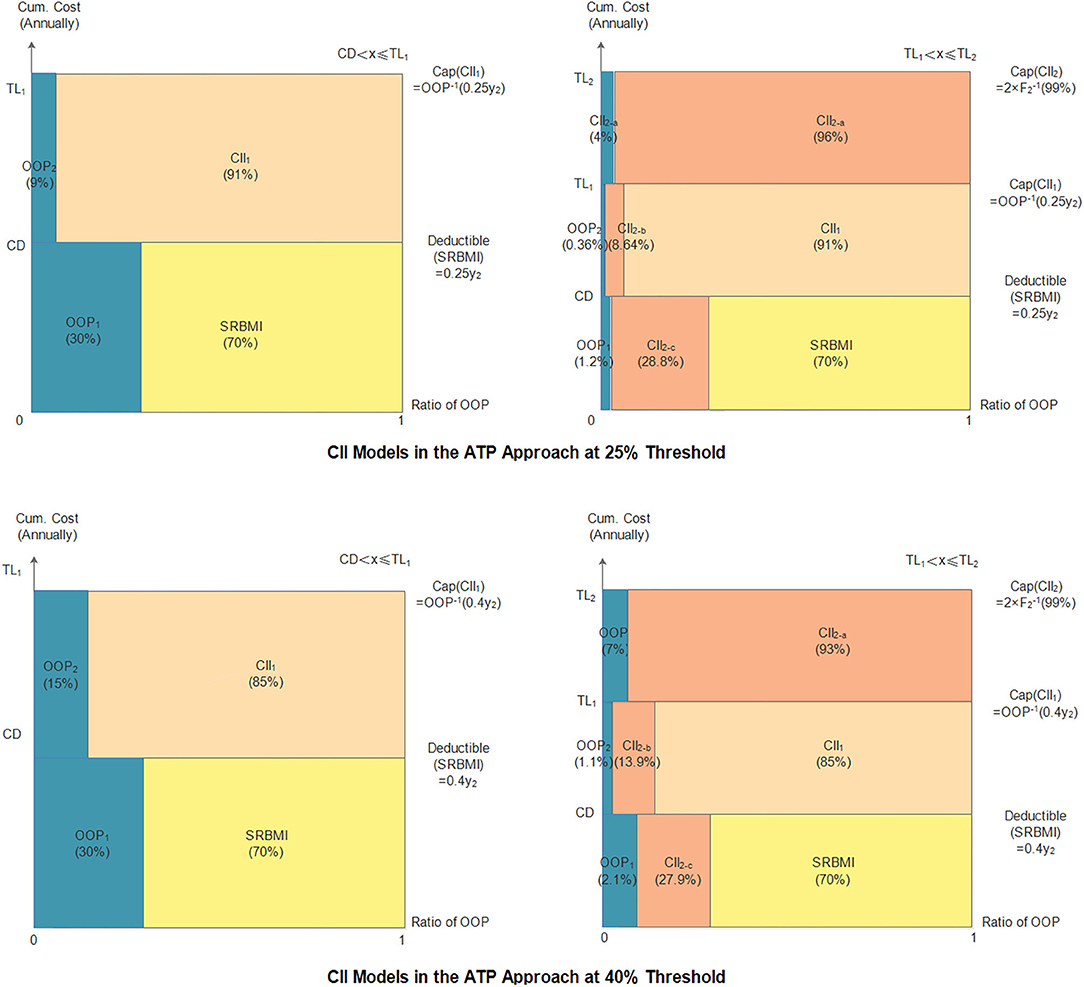
Figure 4. CII models in the ATP approach.
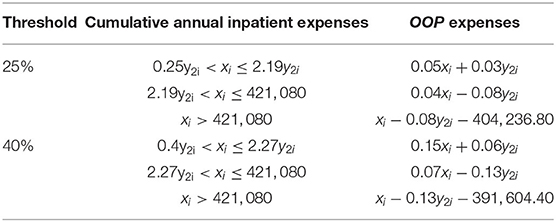
Table 9. Household cumulative OOP expenses in the ATP approach.
Evaluation of the Performance of the CII Model
As can be seen in Table 10, in the case of without any insurance, the incidence of CHE at the 25 and 40% thresholds is 20.48 and 17.05%, and the overall severity values at the two thresholds are CNY 3,637.56 and CNY 3,223.75, respectively. In the two-layer CII models, all four indicators drop significantly at the two thresholds. The incidence, overall severity, average severity, and regional severity at 25% threshold are 2.07%, CNY 36.33, CNY 9.38, and CNY 1,755.88, respectively, and the corresponding values at the 40% threshold are 2.23%, CNY 56.27, CNY 14.53, and CNY 2,528.98, respectively. Further, whether households or households suffering from CHE are insured, the model at the 25% threshold can reduce the incidence and severity of CHE to a lower level.
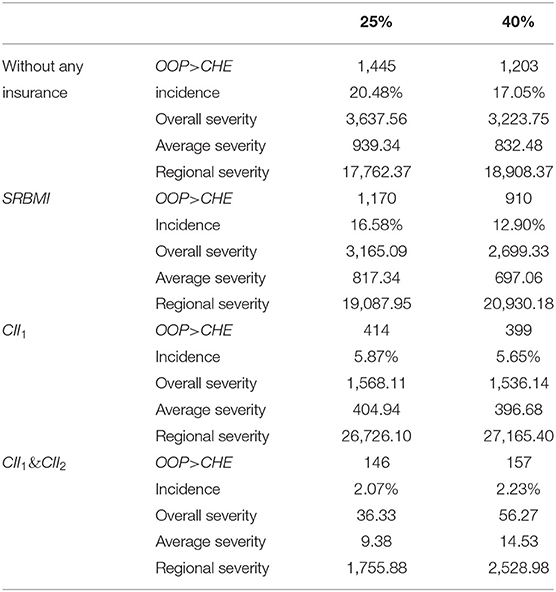
Table 10. Performance evaluation of the CII model in the ATP approach.
The Premium Setting in the CII Model
Through MLE, the scale and shape parameters in the probability distribution function of household non-food expense in 2012 can be calculated, 24,433.57 and 0.83, respectively. The joint probability density function can be expressed as Equation (23). Table 11 presents the premium calculation results.
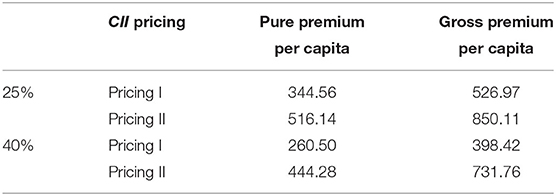
Table 11. The CII pricing simulation in the ATP approach.
The Fund Balance in the CII Model
As shown in Table 12, irrespective of the pricing, the total income of the CII fund is higher than its total expenditure at the two thresholds. Besides, the surplus of the CII fund at the 25% threshold is more than that at the 40% threshold; this means that the 25% threshold can not only ease the households' CHE but also keep the fund in a more stable state.

Table 12. The fund balance of the CII in the ATP approach.
Comparison
The preceding results show that both approaches can reduce the incidence and severity of household's CHE, but the basic approach can alleviate CHE more effectively in the two-layer CII models. On the one hand, the incidence of CHE in the basic approach can be reduced to a low level of 0.85% at the 10% threshold and 0.72% at the 25% threshold; this is clearly <2.07% at the 25% threshold and 2.23% at the 40% threshold in the ATP approach. On the other hand, the average and overall severity in the basic approach are also less than those in the ATP approach; this means that the basic approach is more effective in reducing the loss for all insured households. However, compared with the two severity indicators mentioned above, the two approaches have different performances in regional severity. Regardless of the thresholds used, the regional severity of CHE in the ATP approach is lower than that in the basic approach; this means that the ATP approach can reduce more effectively the severity for households suffering from CHE.
Further, in order to judge the performances of CII models fairly, we compare the model based on the basic approach at 10% threshold with that in the ATP approach at 25% threshold according to the value of CHE; further, we also compare the remaining two models. The conclusions reached about the incidence and severity of the CHE are consistent with those in the previous analysis.
In terms of the premium pricing and fund balance of CII, there are also some distinctions between the two approaches. The premiums in the basic approach at the 10% threshold, including the pure and gross premiums in the first and second layers, are higher than those in the ATP approach at the 25% threshold. The result is similar when the premiums in the basic approach at the 25% threshold are compared with those in the ATP approach at the 40% threshold. Besides, from the perspective of the performance of the CII fund, the CII fund can achieve its financial sustainability irrespective of the threshold used.
Concluding Remarks
The protection of people from CHE has been widely accepted as a desirable objective of global health care financing systems. With the purpose of further reducing CHE, the CII program in China is being implemented for the past 6 years. However, literature that examines whether different measurements of CHE matter in China's CII program is scarce. In order to fill this gap, we compare two-layer CII models built according to the basic and ATP approaches at different thresholds. Exploiting the CFPS (2010–2016), we demonstrate that the basic approach is more effective in alleviating the incidence and severity of CHE for all insured households, but the ATP approach can significantly reduce the severity of CHE for households suffering from CHE. Further, by comparing two thresholds in the basic approach, it is found that the 25% threshold can bring the incidence and severity of CHE for all insured households to a lower level, and the 10% threshold can relieve more effectively the severity of CHE for households suffering from CHE. However, in the ATP approach, the 25% threshold is more effective than the 40% threshold in alleviating the incidence and severity of CHE.
Based on the analysis above, the following implications can be drawn. First, regardless of the measurements of CHE, the CII program can effectively reduce the risk of CHE. Therefore, the program should be promoted widely as a supplement to the current SBMI system. In addition, to improve the effectiveness of the program, China's CII program should be implemented under the basic approach. Further, the threshold used to measure CHE should be determined by the goal pursued by the CII program. More importantly, as the second-largest economy and the most populous country in the world, China has established a CII program that covers a high percentage of CHE. Thus, the choice of CHE measurement in China's CII program can provide valuable guidance for other similar international programs.
However, our research has limitations. First, our two-layer model has been built on China's current healthcare financing system, while its framework prevails around the world. Thus, we believe that possible adjustments are needed according to different countries' circumstance. Second, since China is a large country, different coordination levels are actually adopted based on regional economic and social development. It could be a very interesting direction for our future work.
Data Availability Statement
The original contributions presented in the study are included in the article/supplementary materials, further inquiries can be directed to the corresponding author.
Author Contributions
YZ, JV, and DZ conceived and designed the experiments. YG and DH performed the experiments. All authors contributed to the article and approved the submitted version.
Funding
We gratefully acknowledged the financial support from the fundamental Research Funds for the Central Universities (2242020K40207 and 2242020S30029) and the European Commission.
Conflict of Interest
The authors declare that the research was conducted in the absence of any commercial or financial relationships that could be construed as a potential conflict of interest.
Supplementary Material
The Supplementary Material for this article can be found online at: https://www.frontiersin.org/articles/10.3389/fpubh.2021.646810/full#supplementary-material
Footnotes
1. ^In general, a security surcharge can be set at 10–30% of the pure premium (44). In view of the high medical expense insurance pricing discussed in this paper, we set the ratio at 30%.
2. ^The current average operating expenses ratio set by the PHI is approximately 20% (individual medical insurance business) or 15% (group medical insurance business). Considering that CII involves the URBMI, NRCM, and the PHI as a group business, the additional premium ratio is set at 15%
3. ^The security surcharge of two layers is set to 40% of the pure premium because the coverage is higher, and it is more difficult to obtain medical expenses data that satisfy the actuarial requirements.
4. ^The pure premium per capita equals the pure premium divided by the average household population size, and the gross premium per capita equals the gross premium divided by the average household population size.
5. ^The compensation ratio is based on the policies of the SRBMI in China.
References
1. Dercon S. Income risk, coping strategies and safety nets. World Bank Research Observer. (2002) 17:141–66. doi: 10.1093/wbro/17.2.141
3. Flores G, Krishnakumar O, Doorslaer EV. Coping with health-care costs: implications for the measurement of catastrophic expenditures and poverty. Health Econ. (2008) 17:1393–412. doi: 10.1002/hec.1338
4. Gertler P, Gruber J. Insuring consumption against illness. Am Econ Rev. (2002) 92:51–70. doi: 10.1257/000282802760015603
5. Kim Y, Yang B. Relationship between catastrophic health expenditures and household incomes and expenditure patterns in South Korea. Health Policy. (2011) 100:239–46. doi: 10.1016/j.healthpol.2010.08.008
6. Wagstaff A, Flores G, Smitz, F, Hsu J, Chepynoga K, Eozenou P. Progress on impoverishing health spending in 122 countries: a retrospective observational study. Lancet Global Health. (2018) 6:180–92. doi: 10.1016/S2214-109X(17)30486-2
7. Bijlmakers L, Wientjes M, Mwapasa G, Cornelissen D, Borgstein E, Broekhuizen H, et al. Out-of-pocket payments and catastrophic household expenditure to access essential surgery in Malawi - a cross-sectional patient survey. Ann Med Surg. (2019) 43:85–90. doi: 10.1016/j.amsu.2019.06.003
8. Wagstaff A, Doorslaer EV. Catastrophe and impoverishment in paying for health care: with applications to Vietnam 1993-1998. Health Econ. (2003) 12:921–33. doi: 10.1002/hec.776
9. O'Donnell O, Doorslaer EV, Wagstaff A, Lindelow M. Analyzing health equity using household survey data: a guide to techniques and their implementation. World Bank. (2008) 86:816–6. doi: 10.2471/BLT.08.052357
10. Yap A, Cheung M, Kakembo N, Kisa P, Muzira A, Sekabira J, et al. From procedure to poverty: out-of-pocket and catastrophic expenditure for pediatric surgery in Uganda. J Surg Res. (2018) 232:484–91. doi: 10.1016/j.jss.2018.05.077
11. Xu K, Evans B, Kawabata K, Zeramdini R, Klavus J, Murray J. Household catastrophic health expenditure: a multicountry analysis. Lancet. (2003) 362:111–7. doi: 10.1016/S0140-6736(03)13861-5
12. Hsu J, Flores G, Evans D, Mills A, Hanson K. Measuring financial protection against catastrophic health expenditures: methodological challenges for global monitoring. Int J Equity Health. (2018) 17:69. doi: 10.1186/s12939-018-0749-5
13. National Healthcare Security Administration of People's Republic of China. Medical Security Care Development Statistics Express in 2018 (in Chinese). Beijing (2018).
14. Wu H, Zhou T, Liu T. Progress, problems, and development direction of implementation of major illness insurance in China (in Chinese). Health Econ Res. (2019) 36:18–24.
15. Wang W. Discussion on financing mechanism and reimbursing policy of critical illness insurance: based on the comparison of pilot schemes from 25 provinces of China. J Huazhong Normal Univ. (2014) 55:22–8.
16. Ekman B. Catastrophic health payments and health insurance: some counterintuitive evidence from one low-income country. Health Policy. (2007) 83:304–13. doi: 10.1016/j.healthpol.2007.02.004
17. Shrime G, Dare A, Alkire C, Meara G. A global country-level comparison of the financial burden of surgery. Br J Surg. (2016) 103:1453–61. doi: 10.1002/bjs.10249
18. Nathalie K, Etienne L, Yasmine Y, Martin S, Dan P. Out-of-pocket and catastrophic expenses incurred by seeking pediatric and adult surgical care at a public, Tertiary Care Centre in Uganda. World J Surg. (2018) 42:3520–7. doi: 10.1007/s00268-018-4691-x
19. Tripathy P, Prasad M, Shewade D, Kumar V, Zachariah R, Chadha S, et al. Cost of hospitalisation for non-communicable diseases in India: are we pro-poor? Trop Med Int Health. (2016) 21:1019–28. doi: 10.1111/tmi.12732
20. Anshul K, Mohanty K. Disease-specific out-of-pocket and catastrophic health expenditure on hospitalization in India: do Indian households face distress health financing? PLoS ONE. (2018) 13:e0196106. doi: 10.1371/journal.pone.0196106
21. Shrime G, Dare A, Alkire C, O'Neill K, Meara G. Catastrophic expenditure to pay for surgery worldwide: a modelling study. Lancet Global Health. (2015) 3:S38–44. doi: 10.1016/S2214-109X(15)70085-9
22. Edoka I, Mcpake B, Ensor T, Amara R, Edem-Hotah J. Changes in catastrophic health expenditure in post-conflict Sierra Leone: an oaxaca-blinder decomposition analysis. Int J Equity in Health. (2017) 16:166. doi: 10.1186/s12939-017-0661-4
23. Datta K, Husain J, Asma S. Assessing the relationship between out-of-pocket spending on blood pressure and diabetes medication and household catastrophic health expenditure: evidence from Pakistan. Int J Equity Health. (2019) 18:9. doi: 10.1186/s12939-018-0906-x
24. Doorslaer EV, O'Donnell O, Rannaneliya R, Somanathan A, Adhikari S, Garg C, et al. Catastrophic payments for health care in Asia. Health Econ. (2007) 16:1159–84. doi: 10.1002/hec.1209
25. Cylus J, Thomson S, Evetovits T. Catastrophic health spending in Europe: equity and policy implications of different calculation methods. Bull World Health Org. (2018) 96:599–609. doi: 10.2471/BLT.18.209031
26. Yardim S, Cilingiroglu N, Yardim N. Catastrophic health expenditure and impoverishment in Turkey. Health Policy. (2010) 94:26–33. doi: 10.1016/j.healthpol.2009.08.006
27. Wagstaff A. Measuring catastrophic medical expenditures: reflections on three issues. Health Econ. (2019) 28:765–81. doi: 10.1002/hec.3881
28. Wagstaff A, Flores G, Hsu J, Smitz F, Chepynoga K, Buisman R, et al. Progress on catastrophic health spending in 133 countries: a retrospective observational study. Lancet Global Health. (2018) 6:169–79. doi: 10.1016/S2214-109X(17)30429-1
29. Karan A, Yip W, Mahal A. Extending health insurance to the poor in India: an impact evaluation of Rashtriya Swasthya Bima Yojana on out of pocket spending for healthcare. Soc Sci Med. (2017) 181:83–92. doi: 10.1016/j.socscimed.2017.03.053
30. Piroozi B, Moradi G, Nouri B, Bolbanabad M, Safari H. Catastrophic health expenditure after the implementation of health sector evolution plan: a case study in the west of Iran. Int J Health Policy Manage. (2016) 5:417–23. doi: 10.15171/ijhpm.2016.31
31. Saqib E, Ahmad M, Amezcua-Prieto C. Economic burden of tuberculosis and its coping mechanism at the household level in Pakistan. Soc Sci J. (2018) 55:313–22. doi: 10.1016/j.soscij.2018.01.001
32. Pradhan J, Dwivedi R, Pati S, Rout K. Does spending matters? Re-looking into various covariates associated with out of pocket expenditure (OOPE) and catastrophic spending on accidental injury from NSSO 71st round data. Health Econ Rev. (2017) 7:48. doi: 10.1186/s13561-017-0177-z
33. Wang H, Torres V, Travis P. Financial protection analysis in eight countries in the WHO South-East Asia Region. Bull World Health Org. (2018) 96:610–20. doi: 10.2471/BLT.18.209858
34. Mchenga M, Chirwa C, Chiwaula S. Impoverishing effects of catastrophic health expenditures in Malawi. Int J Equity Health. (2017) 16:25. doi: 10.1186/s12939-017-0515-0
35. Chantzaras E, Yfantopoulos N. Financial protection of households against health shocks in Greece during the economic crisis. Soc Sci Med. (2018) 211:338–51. doi: 10.1016/j.socscimed.2018.06.024
36. Kim H, Cho S, Kim D, Kim D, Jung Y, Jang J, Sung Y. Impact of osteoarthritis on household catastrophic health expenditures in Korea. J Korean Med Sci. (2018) 33:e161. doi: 10.3346/jkms.2018.33.e161
37. Koch F. Catastrophic health payments: does the equivalence scale matter? Health Policy Plann. (2018) 33:966–73. doi: 10.1093/heapol/czy072
38. Dorjdagva J, Batbaatar E, Svensson M, Dorjsuren B, Kauhanen J. Catastrophic health expenditure and impoverishment in Mongolia. Int J Equity Health. (2016) 15:105. doi: 10.1186/s12939-016-0395-8
39. Khan M, Ahmed S, Evans G. Catastrophic healthcare expenditure and poverty related to out-of-pocket payments for healthcare in Bangladesh-an estimation of financial risk protection of universal health coverage. Health Policy Plann. (2017) 32:1102–10. doi: 10.1093/heapol/czx048
40. Ahmed S, Szabo S, Nilsen K. Catastrophic healthcare expenditure and impoverishment in tropical deltas: evidence from the Mekong Delta region. Int J Equity Health. (2018) 17:53. doi: 10.1186/s12939-018-0757-5
41. Zhang Y, Vanneste J, Xu J, Liu X. Critical Illness Insurance to alleviate catastrophic health expenditures: new evidence from China. Int J Health Econ Manage. (2019) 19:193–212. doi: 10.1007/s10754-018-9252-1
42. Zhang Y, Hu D, Guan Y, Vanneste J. Individual vs. household: how do different calculation patterns of catastrophic health expenditure matter? New evidence from China's critical illness insurance programme. Int J Health Plann Manage. (2019) 35:1–22. doi: 10.1002/hpm.2885
Keywords: catastrophic health expenditure, critical illness insurance, basic approach, ability-to-pay approach, China
JEL Classification: I13, I18, G22
Citation: Zhang Y, Guan Y, Hu D, Vanneste J and Zhu D (2021) The Basic vs. Ability-to-Pay Approach: Evidence From China's Critical Illness Insurance on Whether Different Measurements of Catastrophic Health Expenditure Matter. Front. Public Health 9:646810. doi: 10.3389/fpubh.2021.646810
Received: 28 December 2020; Accepted: 28 January 2021;
Published: 18 March 2021.
Edited by:
Chi Wei Su, Qingdao University, ChinaCopyright © 2021 Zhang, Guan, Hu, Vanneste and Zhu. This is an open-access article distributed under the terms of the Creative Commons Attribution License (CC BY). The use, distribution or reproduction in other forums is permitted, provided the original author(s) and the copyright owner(s) are credited and that the original publication in this journal is cited, in accordance with accepted academic practice. No use, distribution or reproduction is permitted which does not comply with these terms.
*Correspondence: Ying Zhang, yingzhang@seu.edu.cn