 S. Andrea Wijtenburg1*
 Min Wang2‡
 Stephanie A. Korenic1
 Shuo Chen1
 Peter B. Barker2,3†
 Laura M. Rowland1†
- 1Department of Psychiatry, Maryland Psychiatric Research Center, University of Maryland School of Medicine, Baltimore, MD, United States
- 2The Russell H. Morgan Department of Radiology and Radiological Science, Johns Hopkins University School of Medicine, Baltimore, MD, United States
- 3FM Kirby Research Center for Functional Brain Imaging, Kennedy Krieger Institute, Baltimore, MD, United States
Proton magnetic resonance spectroscopy (MRS) studies in schizophrenia have shown altered GABAergic, glutamatergic, and bioenergetic pathways, but if these abnormalities are brain region or illness-stage specific is largely unknown. MRS at 7T MR enables reliable quantification of multiple metabolites, including GABA, glutamate (Glu) and glutamine (Gln), from multiple brain regions within the time constraints of a clinical examination. In this study, GABA, Glu, Gln, the ratio Gln/Glu, and lactate (Lac) were quantified using 7T MRS in five brain regions in adults with schizophrenia (N = 40), first-degree relatives (N = 11), and healthy controls (N = 38). Metabolites were analyzed for differences between groups, as well as between subjects with schizophrenia with either short (<5 years, N = 19 or long (>5 years, N = 21) illness duration. For analyses between the three groups, there were significant glutamatergic and GABAergic differences observed in the anterior cingulate, centrum semiovale, and dorsolateral prefrontal cortex. There were also significant relationships between anterior cingulate cortex, centrum semiovale, and dorsolateral prefrontal cortex and cognitive measures. There were also significant glutamatergic, GABAergic, and lactate differences between subjects with long and short illness duration in the anterior cingulate, centrum semiovale, dorsolateral prefrontal cortex, and hippocampus. Finally, negative symptom severity ratings were significantly correlated with both anterior cingulate and centrum semiovale metabolite levels. In summary, 7T MRS shows multi-region differences in GABAergic and glutamatergic metabolites between subjects with schizophrenia, first-degree relatives and healthy controls, suggesting relatively diffuse involvement that evolves with illness duration. Unmedicated first-degree relatives share some of the same metabolic characteristics as patients with a diagnosis of schizophrenia, suggesting that these differences may reflect a genetic vulnerability and are not solely due to the effects of antipsychotic interventions.
Introduction
Recent proton magnetic resonance spectroscopy (MRS) studies in schizophrenia (SZ) have shown altered GABAergic (1–3), glutamatergic (4–7), and more recently, bioenergetic pathways (8) across multiple brain regions and illness durations. Often these studies quantify metabolites from one or two brain regions within a single session, and many have been performed at the standard field strength of 3T. An advantage of higher field strength magnets, such as 7T, is the increased signal to noise ratio (SNR) and improved spectral separation compared to lower field strengths (9–11). This can be used to acquire high quality MRS data in a shorter period of time, or alternatively to improve the measurement precision in similar periods of time. Several 7T MRS studies have reported good reproducibility in difficult to quantify metabolites like glutamate, glutamine, and GABA (12–14). Most previous 7T studies in schizophrenia have focused only on the anterior cingulate (7, 8, 15, 16) while others have expanded to acquisitions from two or three brain regions within a session (3, 17, 18). A recent study used 7T MRS to examine group differences in first episode patients (2 years or less illness duration) and healthy controls in five brain regions (19); however, there has not yet been a study that examined multiple brain regions thought to be involved in the pathophysiology of schizophrenia which also considers illness phase, or genetic risk for schizophrenia by investigating first-degree relatives (FDRs).
In this study, GABA, glutamate (Glu), glutamine (Gln), lactate, and the ratio of Gln/Glu were quantified from five brain regions [anterior cingulate cortex (ACC), dorsolateral prefrontal cortex (DLPFC), centrum semiovale (CSO), thalamus (Thal), and hippocampus (HP)] in each of the three groups: participants with schizophrenia (SZ), first-degree relatives (FDR), and healthy controls (HC). Glu and GABA, the primary excitatory and inhibitory neurotransmitters in the human brain, were included because animal and post-mortem studies have implicated them in the pathophysiology of SZ (20–22). Since 80% of glutamine is involved in glutamatergic neurotransmission (23), is quantifiable at 7T, and shown to be altered in previous SZ studies (24, 25), it was also included as a metabolite of interest. Total glutamate levels measured by MRS cannot differentiate glutamate involved in neurotransmission, GABA synthesis, protein synthesis, etc.; however, the ratio of Gln/Glu has been suggested as an index for glutamatergic neurotransmission (26, 27), so is also reported here. Lactate was included due to its integral role in energy metabolism, recent post-mortem SZ studies showing increased lactate in several brain regions including the DLPFC and hippocampus (28), and our prior work in a smaller sample size that showed elevated lactate levels in adults with SZ were related to reduced cognitive function and functional capacity (8). The five regions of interest (ACC, CSO, DLPFC, HP, and Thal) were chosen due to their implicated role in the pathophysiology of SZ in pre-clinical, post-mortem, and neuroimaging studies. The ACC and hippocampus have been extensively studied in SZ across the illness duration (19, 26, 29–34) so were included. Studies focused on the thalamus, a key node in many functional circuits, showed reduced thalamic volume in adults with SZ (35) and altered glutamatergic metabolites in clinical high risk for psychosis and chronic SZ participants (30, 36, 37). The CSO was included because it is a predominantly white matter region, and white matter is increasingly implicated as altered in SZ (38, 39). The DLPFC was included because reduced GAD67 mRNA expression, leading to reduce GABA synthesis in parvalbumin-expressing subpopulation of GABA neurons has been found in SZ and as noted above elevated Lac levels (20). First-degree relatives were chosen because they may share common, albeit sub-threshold psychopathology, traits as SZ patients. This group is genetically (40, 41), physiologically (42), cognitively (43, 44), and neurochemically (17, 45, 46) similar to adults with SZ, but without exposure to antipsychotic medications. In addition, within the SZ group, metabolite differences between short (<5 years illness duration) and long (>5 years illness duration) were examined as previous studies have suggested an aging effect in SZ (2, 4). Further, MRS studies of SZ suggest that Glu and Gln may change across the course of the illness with elevated glutamatergic metabolite levels being reported in clinical high risk for psychosis (30, 47) and first-episode (19, 48) populations. In contrast, lower glutamatergic metabolite levels have been reported in chronic SZ populations (31, 37). To our knowledge, this will be the first study to examine glutamatergic metabolites in multiple brain regions in SZ participants with short and long illness durations.
Methods
This study was approved by the University of Maryland Baltimore and the Johns Hopkins University School of Medicine Institutional Review Boards, and all participants provided written informed consent prior to study enrollment. Forty adults with SZ [N = 19 with short illness duration (<5 years) and N = 21 with long illness duration (>5 years)], 38 healthy controls (HC), and 11 FDRs participated in this study. Some data from 29 HC and 27 SZ were previously reported (8). Participant demographics are shown in Table 1. The Brief Psychiatric Rating Scale (BPRS) (49) for assessment of positive symptoms and general psychopathology and the Brief Negative Symptom Scale (BNSS) (50) were administered to each participant with SZ. The BPRS evaluates the participant's positive symptoms such as suspiciousness, grandiosity, unusual thought content, and hallucinations. The BNSS contains specific subscales that evaluate the participant's negative symptoms such as anhedonia, asociality, avolition, blunted affect, and alogia. In addition, the Structured Clinical Interview for DSM-IV-TR (SCID), the UCSD Performance-Based Skills Assessment (UPSA) (51), Level of Functioning test (LOF) (52), and the MATRICS battery (53, 54) were administered to all participants. The UPSA assesses a participant's functional capacity in areas of household chores, communication, finance, transportation, and planning recreational activities. The LOF assesses the participant's physical functioning, personal care skills, interpersonal relationships, social acceptability, activities of community living, and work skills. The MATRICS battery evaluates the participant's processing speed, attention, verbal and non-verbal working memory, verbal learning, visual learning, reasoning, and social cognition. For all groups, inclusion criteria were: (1) age range: 18–55 years old; (2) no lifetime substance dependence or abuse in the last 6 months; (3) no contraindication for 7T MRI scanning; (4) not pregnant or nursing; (5) no major medical or neurological illness. HC were included if he/she did not have psychiatric illness, while adults with SZ had a diagnosis of SZ or schizoaffective. FDRs have a first degree relative with SZ, but are not related to anyone in the SZ group. Also, FDRs did not have a DSM-IV psychosis diagnosis or current substance abuse or dependence. 10 out of 11 participants were not taking psychotropic medications.
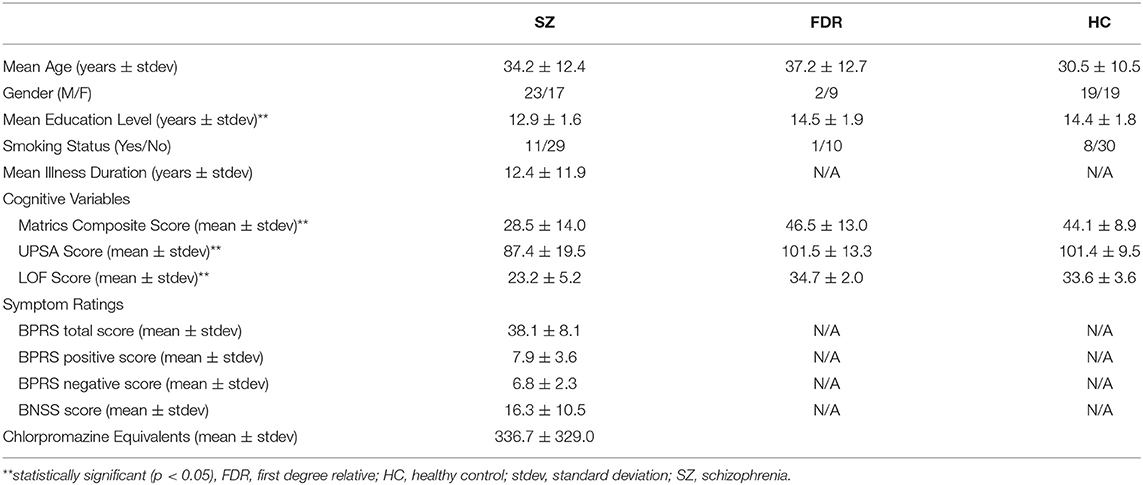
Table 1. Participant demographics.
Imaging Protocol
A 7T Philips Achieva scanner (Best, the Netherlands) equipped with a dual-transmit and 32-channel receive head coil (Nova Medical, Wilmington, MA) was used to scan each participant. Using an isotropic 0.8 mm T1-weighted MPRAGE sequence for guidance, spectroscopic voxels were prescribed in ACC, left CSO, left DLFPC, left hippocampus, and bilateral thalamus (Figure 1). Voxel sizes were 12 (3 × 2 × 2) cm3 in the ACC, 12 (4 × 2 × 1.5) cm3 in the CSO, 10 (2.5 × 2 × 2) cm3 in the DLPFC, ~7.9 (3.5 × 1.5 × 1.5) cm3 in the hippocampus, and 9 (2 × 3 × 1.5) cm3 in the thalamus. Spectroscopic data were acquired using a STEAM sequence with TR/TM/TE = 3,000/33/14 ms, VAPOR (55) water suppression, and 128 excitations for all regions. A spectrum without water suppression (two excitations) was also acquired for phase and eddy current correction, and use as a quantitation reference (scan time 6 min 30 s per region for both suppressed and non-suppressed acquisitions). Prior to acquisition, shimming was applied up to 2nd order using a projection based method (56), and a localized power optimization performed (57) on the region of interest. High-resolution (0.5 × 0.5 × 1.0 mm) multi-slice coronal T2-weighted images were also recorded.
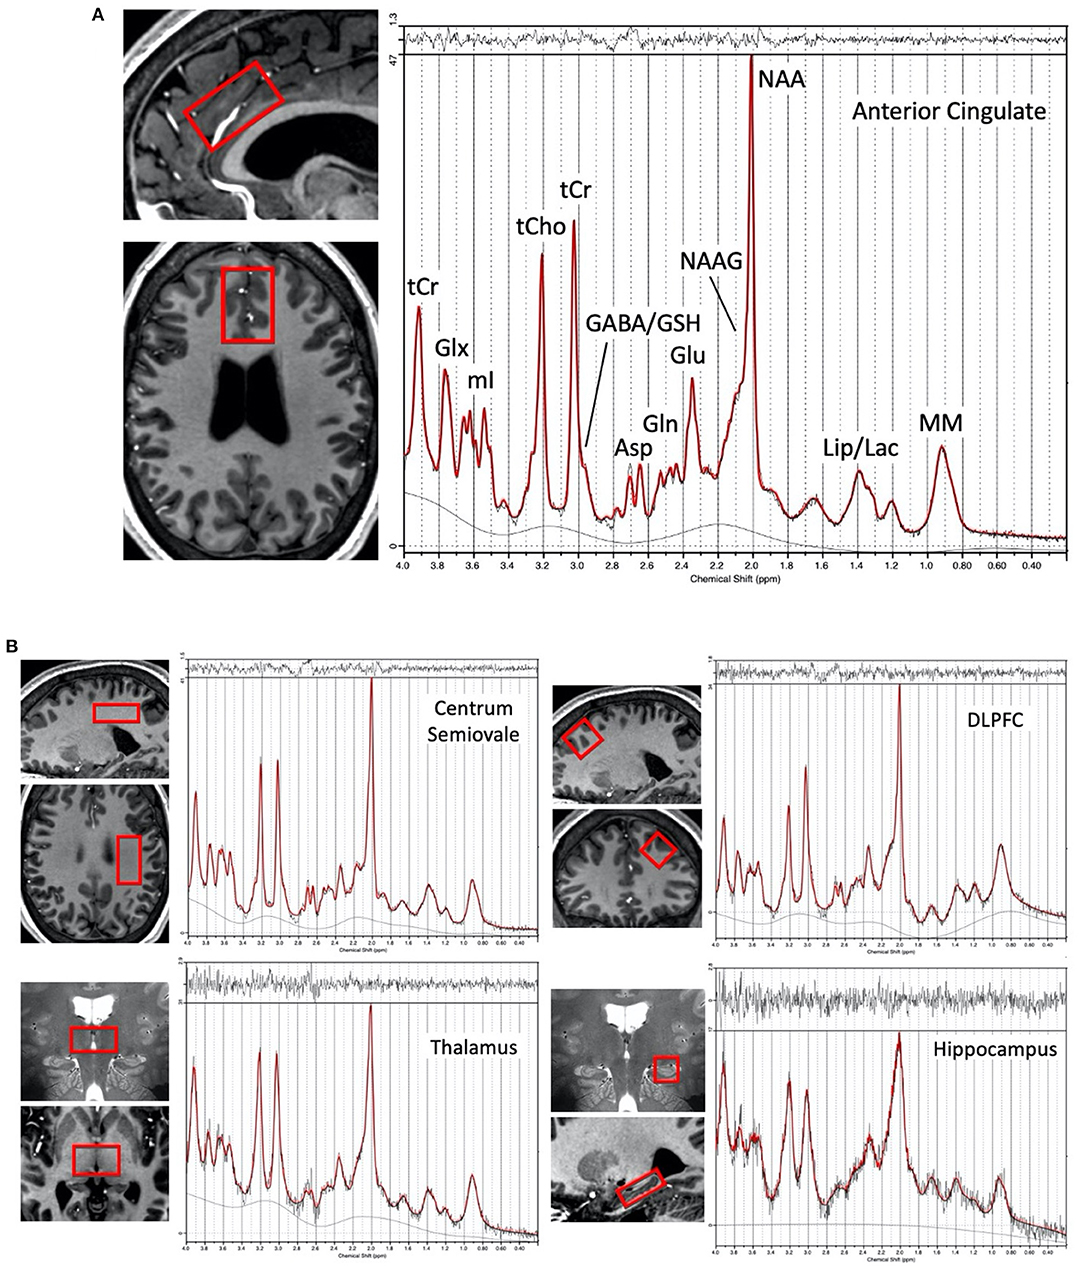
Figure 1. (A) Representative voxel location chosen for the anterior cingulate cortex region in one subject (female, 28 yrs. old) and proton spectrum (LCModel output in red) with peak assignments indicated, (B) Representative voxel locations (overlaid in two planes on T1 or T2-weighted images) from the left centrum semiovale, left dorsolateral prefrontal cortex, bilateral thalamus, and left hippocampus with a corresponding representative spectrum from each region.
Spectra were analyzed using the ‘LCModel' software package version 6.3 (58). A basis set was created using the ‘VESPA' program (59), and chemical shifts and coupling constants from (60) for the following metabolites: alanine (Ala), aspartate (Asp), creatine (Cr), γ-aminobutyric acid (GABA), glutamate (Glu), glutamine (Gln), glutathione (GSH), glycerophosphocholine (GPC), glycine (Gly), lactate (Lac), myo-inositol (mI), N-acetylaspartate (NAA), N-acetylaspartylglutamate (NAAG), phosphocholine (PCh), phosphocreatine (PCr), phosphorylethanolamine (PE), scyllo-inositol (sI), serine (Ser), and taurine (Tau). In the LCModel, a fit range of 0.6–4.0 ppm was used and the baseline spline control parameter (“dkntmn”) set to 0.2 (58). All metabolites except lactate were corrected for the proportion of cerebrospinal fluid (CSF) within the MRS voxel, using [X]corrected = [X]/(1-fCSF) where [X] is the metabolite concentration [expressed in in institutional units (i.u.)] as output by LCModel, and fCSF is the fraction of CSF within the voxel (8). fCSF, as well as the fractions of the gray and white matter within the voxel, were calculated by segmentation of the anatomical T1-weighted images using the “SPM12” program. Lactate was not corrected for the proportion of CSF because this metabolite can be quantified from the CSF using MRS (61, 62). No metabolite relaxation time corrections were performed.
Data were excluded from further analyses if the full-width half maximum (FWHM) > 0.1 ppm for all regions and SNR ≤ 10 for ACC, CSO, DLPFC or SNR ≤ 5 for hippocampus and thalamus (values reported by LCModel). There following datasets were excluded from further analyses: two from the AC (1 HC and 1 SZ), one from the CSO (1 FDR), two from DLPFC (2 SZ), 14 from the hippocampus (7 HC, 6 SZ, and 1 FDR), and none from the thalamus. Metabolites were included in statistical analyses if at least 75% of the possible datasets met the CRLB criteria listed of CRLBs ≤ 20% (Asp, Cr, GABA, Glu, GPC, GSH, mI, NAA, PCh, PCr, PE, sI, Tau, tCho, tNAA, tCr, Glx, mI+Gly) or CRLBs ≤ 30% (Ala, Gln, Gly, Lac, NAAG, Ser). In terms of the main metabolites of interest, Lac analyses were only conducted in the AC and CSO while GABA, Glu, Gln, and Gln/Glu analyses were conducted in all five regions.
Statistics
Due to non-normality, non-parametric tests (Kruskal-Wallis, Mann-Whitney or chi-square) were utilized to assess group differences between HC, SZ, and FDR for demographic variables, voxel composition, spectral quality, and metabolite levels. Based on the stated hypotheses, group differences were examined in each region for GABA, Glu, Gln, Gln/Glu, and Lac with significance set to p < 0.05. False discovery rate correction for multiple comparisons was performed for each metabolite across the five regions (p < 0.05). In addition, non-parametric tests (Mann-Whitney) were utilized to assess group metabolite level differences between patients with short (<5 years illness duration) or long (>5 years illness duration) illness durations. Similar to the three group analyses, group differences were assessed for GABA, Glu, Gln, Lac, and Gln/Glu ratio with significance set to p < 0.05, and false discovery rate correction for multiple comparisons was performed across the five regions (p < 0.05). To examine whether the differences between illness duration groups were a function of illness length or an age effect, non-parametric tests (Mann-Whitney) were conducted to assess metabolite differences between the short illness duration SZ group and an age-matched (within 1 year) subset of HC as well as non-parametric ANCOVAs with age as a covariate to assess metabolite differences between the short and long illness duration groups. Significance was set to p < 0.05.
For the three groups, Spearman's rho correlations were performed for cognitive and function variables (MATRICS total score, UPSA, and LOF) and MRS metabolite levels. Only metabolites that were significantly different between groups were used in the correlation analyses with significance set to p < 0.05. Within the SZ groups, Spearman's rho correlations were performed between symptom severity (BPRS total, BPRS positive, and BNSS) and metabolites that were statistically significant between groups with significance set to p < 0.05.
Results
Participant Demographics
Participant demographics are given in Table 1. Adults with SZ, HC, and FDR did not differ in terms of age (H = 298, p = 0.23), gender (X2 = 3.9, p = 0.14), and smoking status (X2 = 2.0, p = 0.37). There was a significant difference in education level (H = 11.25, p = 0.004) such that adults with SZ had less years of formal education than HC. The FDR's education level was not significantly different from HC or SZ. Adults with SZ had lower total LOF score (H = 57.1, p < 0.001), MATRICS total score (H = 25.5, p < 0.001), and UPSA total score (H = 13.33, p = 0.001) compared to HC and FDR.
Group Differences in Metabolites
Means and standard deviations for the main metabolites for each group are summarized in Figure 2 and Supplementary Table 1. The supplement (Supplementary Table 2) information regarding voxel GM, WM, and CSF percentage differences and quality metrics FWHM and SNR as reported by the LCModel for the three groups. Of the five regions investigated, the SNR was the highest in the ACC followed by the CSO, DLPFC, thalamus, and hippocampus. Similarly, the narrowest FWHM was measured from the ACC, followed by the CSO and DLPFC, then the thalamus and hippocampus. For completeness, mean, standard deviations, N, and statistical significance for other quantifiable metabolites e.g., NAA, mI, tCr, tCho, etc. that may be of interest are summarized in the supplement (Supplementary Table 5).
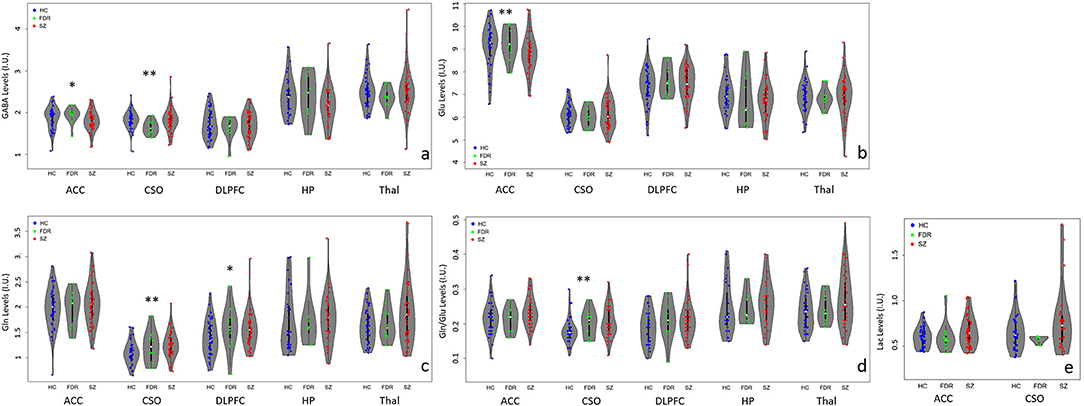
Figure 2. Violin plots with individual data points highlighting metabolite differences between adults with SZ ( ), first-degree relatives (
 ), and healthy controls (
 ) in the anterior cingulate cortex (ACC), left centrum semiovale (CSO), left dorsolateral prefrontal cortex (DLPFC), left hippocampus (HP), and bilateral thalamus (Thal). (a) GABA levels differed significantly between groups in the CSO (**p < 0.05) and at trend level (*p < 0.1) in the ACC. ACC GABA was significantly lower in the SZ compared to the HC and FDR groups. CSO GABA in the FDR group was trend level lower than the SZ or HC groups. (b) Glu levels differed significantly between groups in the ACC only such that adults with SZ had lower Glu levels than HC and FDR. (c) CSO Gln levels were significantly higher in the SZ group compared to HC and FDR while DLPFC Gln levels in the HC group was lower at trend level than the SZ and FDR groups. (d) CSO Gln/Glu ratio was significantly higher in the SZ group compared to the other two groups. (e) There were no significant Lac findings.
In the ACC, Glu levels were significantly different between groups (H = 6.4, p = 0.04) such that adults with SZ had lower Glu levels than HC and FDR.There were no significant group differences for GABA, Gln, Gln/Glu ratio, or Lac. After applying correction for multiple comparisons, there were no significant group differences for the other quantifiable metabolites (p's = 0.168–0.933).
In the CSO, GABA, Gln, and Gln/Glu ratio were significantly different between groups with (H = 6.8, p = 0.034, H = 7.4, p = 0.025, and H = 9.2, p = 0.010), respectively. Gln and Gln/Glu were significantly higher in the SZ group compared to the HC group. The FDR group's Gln and Gln/Glu levels fell in between the other two groups but were not significantly different. GABA levels were similar between SZ and HC but were significantly lower in the FDR group. After applying correction for multiple comparisons, there were no significant group differences for the other quantifiable metabolites (p's = 0.05–0.98).
In the DLPFC, hippocampus, and thalamus, there were no significant differences for GABA, Glu, Gln, and Gln/Glu ratio among the three groups. In addition, there were no other significant group differences for the remaining quantifiable metabolites.
Correlations Between Metabolites and Cognitive Measures
In the ACC, Glu was the only metabolite significantly different between groups. ACC Glu was strongly correlated to UPSA (rho = 0.321, p = 0.004) across groups (Figure 3A). Separating by diagnostic group revealed a trend correlation only in the SZ group (rho = 0.329, p = 0.054), and not in the HC (p = 0.511) or FDR (p = 0.374) groups. ACC Glu was also strongly correlated with LOF (rho = 0.364, p = 0.001) across groups and within the SZ group (rho = 0.360, p = 0.024) (Figure 3B). There were no significant correlations in HC (p = 0.229) or FDR (p = 0.728) groups. Finally, ACC Glu was also significantly correlated with MATRICS total score (rho = 0.383, p < 0.001) across groups, within the FDR group (rho = 0.693, p = 0.026), but not within the HC (p = 0.132) or SZ (p = 0.524) groups (Figure 3C). After correction for multiple comparisons, all three combined group correlations between Glu with UPSA, LOF, and MATRICS total score remained significant.
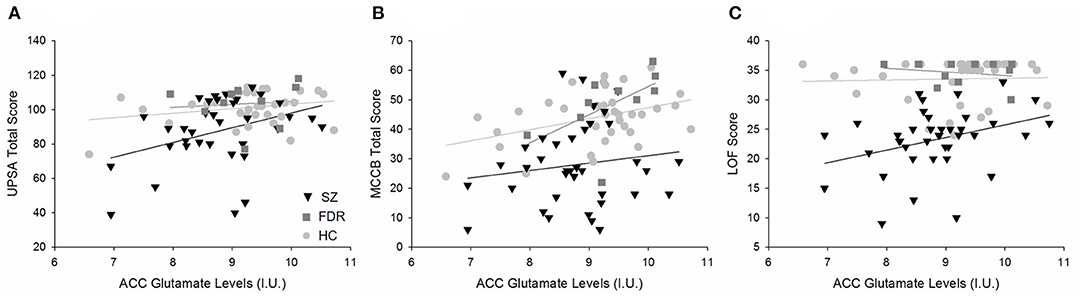
Figure 3. Regression plots of the significant relationships between (A) ACC Glu levels and UPSA total scores, (B) ACC Glu and MATRICS total scores, and (C) ACC Glu levels and LOF scores. (A) Separating by diagnostic group revealed a trend level relationship in only the SZ group (H) and not the HC ( ) or FDR (
 ). (B) ACC Glu levels were significantly correlated to MATRICS total score across diagnostic groups. Further analyses revealed a significant relationship in the FDR group only. (C) Similarly, ACC Glu levels were significantly correlated to LOF scores across diagnostic groups and in the SZ group. There were no significant relationships between HC and FDR. Similarly, ACC Glu levels were significantly correlated to MATRICS total score across diagnostic groups. Further analyses revealed a significant relationship in the FDR group only.
For the CSO, Gln and Gln/Glu were significantly correlated with LOF but not with other measures. Gln/Glu was correlated with LOF across groups (rho = −0301, p = 0.005) and within the SZ group (rho = −0.362, p = 0.023) but not HC (p = 0.671) or FDR (p = 0.377). Similarly, Gln was correlated with LOF (rho = −0.229, p = 0.036) across groups, but did not remain significant at the diagnostic group level (p's = 0.076–0.96). GABA did not correlate with any measure. After correcting for multiple comparisons, none of these correlations remained significant.
Early vs. Later Illness Duration
Participant Demographics
Adults with SZ with shorter (<5 years) and longer (>5 years) illness durations differed significantly with age (U = 21, p < 0.001) such that the shorter illness duration group was younger than the longer illness duration group (Table 2). The two illness groups did not differ on education level (p = 0.49), gender (p = 0.18), smoking status (p = 0.39), and CPZ equivalents (p = 0.73). There were no significant group differences for LOF (p = 0.18), UPSA (p = 0.07) MATRICS total score (p = 0.09), BPRS total (p = 0.71), BPRS positive (p = 0.16), and BNSS (p = 0.32) scores.
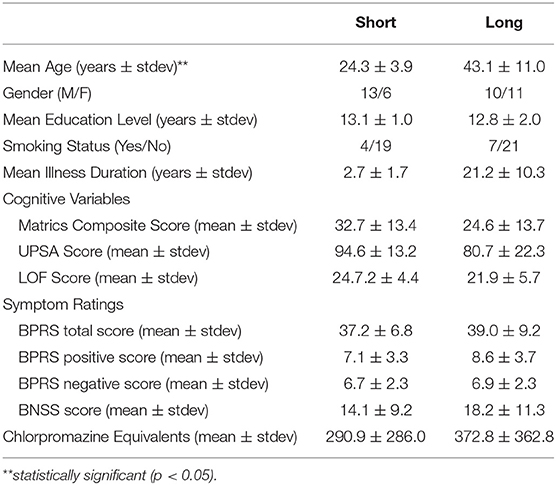
Table 2. Participant demographics for short and long illness duration.
Metabolite Differences Between Short vs. Long Illness Duration
Means and standard deviations for the main metabolite levels for the two groups are summarized in Figure 4 and Supplementary Table 3, and the supplement contains information regarding the voxel GM, WM, and CSF percentage differences and quality metrics (FWHM and SNR as reported by LCModel) for the two groups (Supplementary Table 2). In addition, results from other quantifiable metabolites e.g., NAA, mI, tCr, tCho, etc. are summarized in the supplement (Supplementary Table 6).

Figure 4. Violin plots with individual data points summarizing the significant (**p < 0.05) and trend level (*p < 0.1) differences between adults with SZ with short ( ) and long illness (
 ) durations in the anterior cingulate cortex (ACC), left centrum semiovale (CSO), left dorsolateral prefrontal cortex (DLPFC), left hippocampus (HP), and bilateral thalamus (Thal). (a) There was a trend level difference in GABA in the HP such that GABA was higher in the short illness duration group compared to the long illness duration group. (b) Glu levels were significantly higher in the short illness duration group vs. the long illness duration group in both the ACC and DLPFC. A similar relationship, but at trend level, was observed in the CSO. (c,d) There were no significant relationships between groups across all regions for Gln and Gln/Glu. (e) For Lac, there was a significant difference in the CSO such that the long illness duration group had higher Lac levels compared to the short illness duration group. A similar relationship was observed in the ACC but at trend level.
In the ACC, there were significant group differences for Glu (U = 286, p = 0.006), but not for GABA, Gln, or Gln/Glu. Glu levels were higher in the early illness duration group vs. the later illness duration group. Lac levels between groups were trend level different (U = 96, p = 0.06) such that Lac levels were higher in the longer illness duration vs. the shorter illness duration group. After correcting for multiple comparisons for the other metabolites, Glx was also different between groups (U = 284, p = 0.007) such that higher Glx was observed in the short compared to the longer illness duration group. No other quantifiable metabolites were significantly different between groups.
In the CSO, Lac levels were significantly different between groups (U = 13, p = 0.003) such that the longer illness duration group had higher levels of Lac compared to the shorter illness duration group. However, the sample size for each group, particularly the short illness duration group, for the Lac analyses was much smaller than the sample size for the other metabolites so this finding should be interpreted with caution. There were no Gln, Glx, Gln/Glu, or GABA differences between groups. No other quantifiable metabolites were significantly different between groups.
In the DLPFC, there was a significant difference between groups for Glu (U = 285, p = 0.002) such that the short illness duration group had higher Glu levels than the long illness duration group. There were no significant group differences for Gln, Gln/Glu, or GABA. After correction for multiple comparisons for the other quantifiable metabolites, Glx (U = 279, p = 0.003) was the only metabolite with significant differences between groups. Glx was higher in the shorter illness duration group.
In the hippocampus, there here were no significant group differences for GABA, Glu, Gln, or Gln/Glu ratio. After correcting for multiple comparisons for the other quantifiable metabolites, there were no significant differences between groups.
In the thalamus, there were no significant group differences for GABA, Glu, Gln, or Gln/Glu ratio. After correcting for multiple comparisons for the other quantifiable metabolites, mI (U = 96, p = 0.008) and mI+Gly (U = 92, p = 0.006) were significantly different such that mI and mI+Gly were significantly higher in the long illness duration group vs. the short illness duration group.
Detailed results of the group difference analyses between age-matched short illness duration group and HC group are in the supplement (Supplementary Text and Supplementary Table 7). CSO Lac and ACC Glu were the only two metabolites that were different (significantly for Lac at p = 0.037 and trend level for Glu at p = 0.083) between the short illness duration and HC analyses. Detailed results regarding the illness duration group difference analysis that co-varied for age are in the Supplementary Text. Results from the non-parametric ANCOVA revealed no significant differences between the short and long illness duration groups for any metabolites after controlling for age; however, given the highly correlated nature of age and illness duration, these results should be interpreted with caution.
Correlations Between Metabolites and Clinical Measures
ACC Glu and Glx were significantly different between the three groups (SZ, FDR, HC) or the two patient groups and therefore waere included in correlation analysis. ACC Glu was trend level related to BNSS (rho = −0.290, p = 0.072), and not significantly related to BPRS total or BPRS positive symptom score. Separating by illness duration revealed a significant relationship between ACC Glu and BNSS (rho = −0.445, p = 0.043) for the long illness duration group only. ACC Glx was not significantly related to the symptom ratings in the SZ group as a whole (p's > 0.129) or when broken down by short or long illness duration groups (all p's > 0.146). None of the relationships presented survived multiple comparison correction.
For the CSO, Gln, Gln/Glu, GABA, and Lac were significantly different between the three groups (SZ, FDR, HC) or the two patient groups and therefore were included in the correlation analysis. Gln was significantly associated with BPRS total score (rho = 0.363, p = 0.023) across groups, and a similar relationship was present in the long (rho = 0.433, p = 0.050) both not short (p = 0.335) and illness duration groups. Gln/Glu was significantly associated with BNSS (rho = 0.362, p = 0.023) across groups, and a similar trend relationship was present in the short illness duration group (rho = 0.468, p = 0.05) but not the long (p = 0.479) illness duration group. The other metabolites were not significantly associated with any of the symptom ratings (all p's > 0.07). Similar to ACC, these correlations did not survive correction for multiple comparisons.
DLPFC Glu, and Glx, as well as thalamus mI and mI+Gly were significantly l different between the three groups (SZ, FDR, HC) or the two patient groups and therefore were included in the correlation analysis. There were no significant relationships between symptom rating and these metabolites for the SZ group as a whole (all p's > 0.095), but there was a relationship between thalamus mI+Gly and BPRS total symptoms in the long illness duration group only (rho = 0.472, p = 0.031). This did not survive correction for multiple comparisons.
Discussion
This study examined metabolite differences in five brain regions in adults with SZ, HC, and FDR at 7T. It also compared metabolite differences in adults with SZ earlier in the illness (<5 years) compared to later in the illness (>5 years). The results add to the growing body of literature of glutamatergic and GABAergic differences in the ACC in SZ, and report 7T metabolite differences in the CSO, DLPFC, thalamus, and hippocampus, regions implicated in the pathophysiology of SZ. The ACC and the CSO emerged as key regions for metabolite differences that were related to psychopathology and function in SZ in this study. In terms of metabolic abnormalities, the longer illness group was more severely affected than the short illness group for all brain regions.
This study found lower ACC Glu and GABA in the SZ group and higher ACC lactate in the longer illness group, which are consistent with neuroimaging, post-mortem, and behavioral research implicating ACC abnormalities in SZ (7, 21, 29, 63–67). With respect to 7T MRS studies focused on ACC Glu, results have been mixed. Recent 7T MRS work by Posporelis et al. (16), Brandt et al. (15), Kumar et al. (18), and Taylor et al. (36) observed no differences in ACC Glu when comparing either recent onset SZ or chronic SZ with healthy controls. In contrast, Reid et al. (7) showed ACC Glu was lower in first episode patients (within 2 years of starting treatment) than in healthy controls in the dorsal ACC, and these results were similar to those by Wang et al. (19) showing lower Glu in the ACC in first episode patients (2 years from first psychotic symptoms) compared to healthy controls. The current results are similar to these studies in that lower ACC Glu was observed in the SZ group as a whole, and especially so in the longer illness duration group. ACC Glu levels may have functional relevance in schizophrenia, as lower levels were related to poorer functional capacity, functioning, and greater negative symptoms. These results suggest that ACC Glu may be impacted by illness chronicity and contribute to impaired function and negative symptom severity as indicated by findings in the longer illness group. It is not clear as to the cause of lower ACC Glu in schizophrenia since the MRS Glu signal provides a total tissue level and cannot differentiate between glutamate levels in specific cell types (i.e., neurons and glia), location (i.e., intracellular, extracellular, or synaptic), or function (i.e., neurotransmission, GABA synthesis, glutathione synthesis, and protein synthesis). It is possible that lower ACC Glu reflects reduced number or size of glutamatergic pyramidal neurons, consistent with previous research (68), reduced Glu synthesis, and/or impaired Glu-Gln neurotransmitter cycling (69). Interventions to increase ACC Glu levels, especially later in the illness, may reduce negative symptoms and enhance everyday function.
There was a trend for lower ACC GABA in SZ compared to HC which was related to lower level of function as a whole, and greater negative symptom severity in the longer illness group. Three previous 7T MRS studies that did not report differences between SZ and HC (7, 15, 19) but differences in voxel placement, voxel size, acquisition parameters, and illness duration of the SZ group may contribute to this inconsistency. Lower GABA in SZ likely reflects reduced GABA synthesis, consistent with studies of lower GAD67 in SZ (70), resulting in reduced inhibition as suggested from studies of SZ (71).
Our previous paper showed higher ACC lactate in the SZ group compared to the HC group (8). Here, using an overlapping sample but larger N, we did not observe a significant group difference in the ACC when examining adults with SZ, HC, and FDR; however, ACC lactate levels were trend level higher in the longer illness group. This was consistent with the finding of higher CSO lactate in the longer illness group. In the longer illness group, higher ACC lactate was related to greater negative symptoms. Recent work has suggested that lactate may be altered in schizophrenia, potentially due to a bioenergtic or mitochondrial dysfunction (72, 73). The specificity of this relationship to the chronic phase of SZ (>5 years illness duration), in addition to a recent study that did not observe peripheral mitochondrial dysfunction in a clinical high risk for psychosis group (74), suggests that increased lactate may be a long-term consequence of impaired mitochondrial function. However, longitudinal studies are needed to assess the progression of brain lactate levels over the illness course. Further, while adults in both illness duration groups were predominantly treated with antipsychotics, long term antipsychotic medication exposure in rats does not result in increased frontal cortex lactate (72).
The CSO white matter region also revealed higher Gln/Glu ratio and Gln in SZ, which were related to poorer function across all groups, and greater negative symptom severity (Gln/Glu) and greater psychopathology (Gln) in the SZ group. In addition, CSO Glu was lower in the longer illness group and GABA lower in the FDR group. To our knowledge, there is one other study that has examined the CSO at 7T, and no differences in CSO Glu, Gln, or GABA were observed in first episode patients compared to controls (19). Since similar sequences, voxel placement, and voxel size were used, the significant Gln/Glu and Gln findings in this study may be attributed to the longer illness duration of the SZ group. These findings also lend further support to significant white matter alterations in SZ (39, 75) and the possibility that white matter alterations are related to abnormal glutamatergic function (38). Similar to the ACC, the reason for lower Glu or increased Gln/Glu and Gln in SZ is unclear. Abnormalities in the synthesis, degradation, or Glu-Gln cycling could be explanations. Also, specific neural cell types could be affected such as oligodendrocytes in white matter that play an important role in removing synaptic glutamate and the subsequent conversion to glutamine. It should also be noted that glutamine is synthesized in the brain from glutamate and ammonia; ammonia in blood crosses the blood-brain barrier, and if elevated (e.g., due to liver dysfunction or other factors) is known to drive brain glutamine synthesis (76). Blood ammonia levels were not measured in this study, so it is unknown if this is a significant factor or not in the subjects reported here.
There were no significant differences in metabolites across the three groups for the DLPFC, hippocampus, or thalamus. A trend for higher DLPFC Gln in both SZ and FDR compared to HC was found but this was not related to cognitive or functioning measures. Lower DLPFC Glu, lower hippocampal GABA, and higher thalamic mI were found in the longer compared to the shorter illness group. Only thalamus mI was related to a clinical measure, with greater thalamic mI related to more severe general psychopathology. One 7T MRS study of DLPFC did not find any group differences in first episode patients (19), which is in line with these results showing only a trend Gln difference and that lower Glu is likely associated again with illness duration. To our knowledge, there are no other studies examining the hippocampus at 7T in SZ. Finally, there were no group differences for the metabolites of interest in this study in bilateral thalamus, which was similar to another study (19). Another study at 7T that examined metabolite differences the left thalamus from an early illness SZ cohort and HC found higher Gln in the SZ group compared to the HC group (36). Our results showed higher Gln in the SZ group compared to the HC group for the thalamus, but the difference did not reach statistical significance (p = 0.064).
The FDR group was not distinguishable except for lower CSO GABA compared to HC and SZ and a similar trend as SZ for higher DLPFC Gln compared to HC. Since the FDR sample size is small, these analyses were restricted to non-parametric tests, and the results should be interpreted with caution. One prior study has compared patients with schizophrenia with both healthy siblings and unrelated control subjects using 7T MRS (17); that study found that reduced GABA in occipitalcortex was specific to the patient group only, but that glutamate was reduced in patients and relatives compared to healthy controls. These results suggest that glutamatergic metabolism may be altered both in patients with schizophrenia as well as those who may have genetic risk for schizophrenia.
There are a few limitations that are worth noting. First, the sample size for the FDR group was small compared to the SZ and HC groups. Second, the macromolecule background present in all short TE MRS studies was handled using the built-in capabilities of LCModel. While this methodology has been used previously and shown to be an effective means of handling the background, it remains unclear whether the proteins and lipids that make up the macromolecule spectrum are different in SZ or FDR. It should also be noted that spectral quality (including factors such as linewidth and SNR) vary depending on location within the human brain; this depends on both the size and location of the MRS voxel. For instance, it is well-known that structures such as the hippocampus are somewhat less favorable compared to more superior and/or posterior brain regions, both because of its small size and also proximity to intracranial air spaces that cause magnetic field inhomogeneity. Lower spectral quality implies more variance in the determination of metabolite concentration values, hence it may be more difficult to demonstrate statistically significant findings for regions with lower spectral quality; in the current study, quality metrics were lower for hippocampus and thalamus as compared to the other three, more superior, brain regions.
This study contributes to the building evidence of in-vivo glutamatergic and GABAergic abnormalities and relation to functional and clinical symptoms in schizophrenia. The results emphasize the potential worsening with illness chronicity and indicate the need for future studies focused on the chronic phase of the illness. The study also highlights the importance of lactate and potentially bioenergetic dysfunction in the pathophysiology of SZ, which are likely linked to abnormalities in glutamatergic and GABAergic systems and illness features.
Data Availability Statement
Data are not readily available because anonymized data sharing was not in the consent form for this study. Requests to access the datasets should be directed to awijtenburg@som.umaryland.edu.
Ethics Statement
The studies involving human participants were reviewed and approved by University of Maryland Baltimore and Johns Hopkins University School of Medicine Institutional Review Boards. The patients/participants provided their written informed consent to participate in this study.
Author Contributions
LR and PB had full access to all the data in the study and take responsibility for the integrity of the data and the accuracy of the data analysis, concept and design, obtained funding, and supervision. SW, LR, and PB: drafting of the manuscript. SC: statistical analysis. SW, MW, SK, LR, and PB: administrative, technical, or material support. All authors: acquisition, analysis, or interpretation of data, and critical revision of the manuscript for important intellectual content.
Funding
This work was supported by NIH R01MH096263.
Conflict of Interest
LR received consulting fees from Otsuka America Pharmaceutical, Inc for educational purposes only for the platform PsychU.
The remaining authors declare that the research was conducted in the absence of any commercial or financial relationships that could be construed as a potential conflict of interest.
Supplementary Material
The Supplementary Material for this article can be found online at: https://www.frontiersin.org/articles/10.3389/fpsyt.2021.656459/full#supplementary-material
References
1. Egerton A, Modinos G, Ferrera D, McGuire P. Neuroimaging studies of GABA in schizophrenia: a systematic review with meta-analysis. Transl Psychiatry. (2017) 7:e1147. doi: 10.1038/tp.2017.124
2. Rowland LM, Krause BW, Wijtenburg SA, McMahon RP, Chiappelli J, Nugent KL, et al. Medial frontal GABA is lower in older schizophrenia: a MEGA-PRESS with macromolecule suppression study. Mol Psychiatry. (2016) 21:198–204. doi: 10.1038/mp.2015.34
3. Marsman A, Mandl RC, Klomp DW, Bohlken MM, Boer VO, Andreychenko A, et al. GABA and glutamate in schizophrenia: a 7 T (1)H-MRS study. Neuroimage Clin. (2014) 6:398–407. doi: 10.1016/j.nicl.2014.10.005
4. Marsman A, van den Heuvel MP, Klomp DW, Kahn RS, Luijten PR, Hulshoff Pol HE. Glutamate in schizophrenia: a focused review and meta-analysis of (1)H-MRS studies. Schizophr Bull. (2013) 39:120–9. doi: 10.1093/schbul/sbr069
5. Merritt K, Egerton A, Kempton MJ, Taylor MJ, McGuire PK. Nature of glutamate alterations in schizophrenia: a meta-analysis of proton magnetic resonance spectroscopy studies. JAMA Psychiatry. (2016) 73:665–74. doi: 10.1001/jamapsychiatry.2016.0442
6. Wijtenburg SA, Yang S, Fischer BA, Rowland LM. In vivo assessment of neurotransmitters and modulators with magnetic resonance spectroscopy: application to schizophrenia. Neurosci Biobehav Rev. (2015) 51:276–95. doi: 10.1016/j.neubiorev.2015.01.007
7. Reid MA, Salibi N, White DM, Gawne TJ, Denney TS, Lahti AC. 7T Proton magnetic resonance spectroscopy of the anterior cingulate cortex in first-episode schizophrenia. Schizophr Bull. (2019) 45:180–9. doi: 10.1093/schbul/sbx190
8. Rowland LM, Pradhan S, Korenic S, Wijtenburg SA, Hong LE, Edden RA, et al. Elevated brain lactate in schizophrenia: a 7 T magnetic resonance spectroscopy study. Transl Psychiatry. (2016) 6:e967. doi: 10.1038/tp.2016.239
9. Mekle R, Mlynarik V, Gambarota G, Hergt M, Krueger G, Gruetter R. MR spectroscopy of the human brain with enhanced signal intensity at ultrashort echo times on a clinical platform at 3T and 7T. Magn Reson Med. (2009) 61:1279–85. doi: 10.1002/mrm.21961
10. Tkac I, Oz G, Adriany G, Ugurbil K, Gruetter R. In vivo 1H NMR spectroscopy of the human brain at high magnetic fields: metabolite quantification at 4T vs. 7T. Magn Reson Med. (2009) 62:868–79. doi: 10.1002/mrm.22086
11. Pradhan S, Bonekamp S, Gillen JS, Rowland LM, Wijtenburg SA, Edden RA, et al. Comparison of single voxel brain MRS AT 3T and 7T using 32-channel head coils. Magn Reson Imaging. (2015) 33:1013–8. doi: 10.1016/j.mri.2015.06.003
12. Wijtenburg SA, Rowland LM, Edden RA, Barker PB. Reproducibility of brain spectroscopy at 7T using conventional localization and spectral editing techniques. J Magn Reson Imaging. (2013) 38:460–7. doi: 10.1002/jmri.23997
13. Wijtenburg SA, Rowland LM, Oeltzschner G, Barker PB, Workman CI, Smith GS. Reproducibility of brain MRS in older healthy adults at 7T. NMR Biomed. (2019) 32:e4040. doi: 10.1002/nbm.4040
14. Terpstra M, Cheong I, Lyu T, Deelchand DK, Emir UE, Bednarik P, et al. Test-retest reproducibility of neurochemical profiles with short-echo, single-voxel MR spectroscopy at 3T and 7T. Magn Reson Med. (2016) 76:1083–91. doi: 10.1002/mrm.26022
15. Brandt AS, Unschuld PG, Pradhan S, Lim IA, Churchill G, Harris AD, et al. Age-related changes in anterior cingulate cortex glutamate in schizophrenia: A (1)H MRS Study at 7 Tesla. Schizophr Res. (2016) 172:101–5. doi: 10.1016/j.schres.2016.02.017
16. Posporelis S, Coughlin JM, Marsman A, Pradhan S, Tanaka T, Wang H, et al. Decoupling of brain temperature and glutamate in recent onset of schizophrenia: a 7T proton magnetic resonance spectroscopy study. Biol Psychiatry Cogn Neurosci Neuroimaging. (2018) 3:248–54. doi: 10.1016/j.bpsc.2017.04.003
17. Thakkar KN, Rosler L, Wijnen JP, Boer VO, Klomp DW, Cahn W, et al. 7T Proton magnetic resonance spectroscopy of gamma-aminobutyric acid, glutamate, and glutamine reveals altered concentrations in patients with schizophrenia and healthy siblings. Biol Psychiatry. (2017) 81:525–35. doi: 10.1016/j.biopsych.2016.04.007
18. Kumar J, Liddle EB, Fernandes CC, Palaniyappan L, Hall EL, Robson SE, et al. Glutathione and glutamate in schizophrenia: a 7T MRS study. Mol Psychiatry. (2018) 25:873–82. doi: 10.1038/s41380-018-0104-7
19. Wang AM, Pradhan S, Coughlin JM, Trivedi A, DuBois SL, Crawford JL, et al. Assessing brain metabolism with 7-T proton magnetic resonance spectroscopy in patients with first-episode psychosis. JAMA Psychiatry. (2019) 76:314–23. doi: 10.1001/jamapsychiatry.2018.3637
20. Lewis DA, Hashimoto T, Volk DW. Cortical inhibitory neurons and schizophrenia. Nat Rev Neurosci. (2005) 6:312–24. doi: 10.1038/nrn1648
21. Zavitsanou K, Ward PB, Huang XF. Selective alterations in ionotropic glutamate receptors in the anterior cingulate cortex in schizophrenia. Neuropsychopharmacology. (2002) 27:826–33. doi: 10.1016/S0893-133X(02)00347-0
22. Benes FM, Berretta S. GABAergic interneurons: implications for understanding schizophrenia and bipolar disorder. Neuropsychopharmacology. (2001) 25:1–27. doi: 10.1016/S0893-133X(01)00225-1
23. Magistretti PJ, Pellerin L. Cellular mechanisms of brain energy metabolism and their relevance to functional brain imaging. Philos Trans R Soc Lond B Biol Sci. (1999) 354:1155–63. doi: 10.1098/rstb.1999.0471
24. Theberge J, Williamson KE, Aoyama N, Drost DJ, Manchanda R, Malla AK, et al. Longitudinal grey-matter and glutamatergic losses in first-episode schizophrenia. Br J Psychiatry. (2007) 191:325–34. doi: 10.1192/bjp.bp.106.033670
25. Aoyama N, Theberge J, Drost DJ, Manchanda R, Northcott S, Neufeld RW, et al. Grey matter and social functioning correlates of glutamatergic metabolite loss in schizophrenia. Br J Psychiatry. (2011) 198:448–56. doi: 10.1192/bjp.bp.110.079608
26. Bustillo JR, Rowland LM, Mullins P, Jung R, Chen H, Qualls C, et al. 1H-MRS at 4 tesla in minimally treated early schizophrenia. Mol Psychiatry. (2010) 15:629–36. doi: 10.1038/mp.2009.121
27. Shirayama Y, Obata T, Matsuzawa D, Nonaka H, Kanazawa Y, Yoshitome E, et al. Specific metabolites in the medial prefrontal cortex are associated with the neurocognitive deficits in schizophrenia: a preliminary study. Neuroimage. (2010) 49:2783–90. doi: 10.1016/j.neuroimage.2009.10.031
28. Pruett BS, Meador-Woodruff JH. Evidence for altered energy metabolism, increased lactate, and decreased pH in schizophrenia brain: a focused review and meta-analysis of human postmortem and magnetic resonance spectroscopy studies. Schizophr Res. (2020) 223:29–42. doi: 10.1016/j.schres.2020.09.003
29. Fornito A, Yucel M, Dean B, Wood SJ, Pantelis C. Anatomical abnormalities of the anterior cingulate cortex in schizophrenia: bridging the gap between neuroimaging and neuropathology. Schizophr Bull. (2009) 35:973–93. doi: 10.1093/schbul/sbn025
30. Stone JM, Day F, Tsagaraki H, Valli I, McLean MA, Lythgoe DJ, et al. Glutamate dysfunction in people with prodromal symptoms of psychosis: relationship to gray matter volume. Biol Psychiatry. (2009) 66:533–9. doi: 10.1016/j.biopsych.2009.05.006
31. Tayoshi S, Sumitani S, Taniguchi K, Shibuya-Tayoshi S, Numata S, Iga J, et al. Metabolite changes and gender differences in schizophrenia using 3-Tesla proton magnetic resonance spectroscopy (1H-MRS). Schizophr Res. (2009) 108:69–77. doi: 10.1016/j.schres.2008.11.014
32. Lieberman JA, Girgis RR, Brucato G, Moore H, Provenzano F, Kegeles L, et al. Hippocampal dysfunction in the pathophysiology of schizophrenia: a selective review and hypothesis for early detection and intervention. Mol Psychiatry. (2018) 23:1764–72. doi: 10.1038/mp.2017.249
33. Spieker EA, Astur RS, West JT, Griego JA, Rowland LM. Spatial memory deficits in a virtual reality eight-arm radial maze in schizophrenia. Schizophr Res. (2012) 135:84–9. doi: 10.1016/j.schres.2011.11.014
34. Beneyto M, Kristiansen LV, Oni-Orisan A, McCullumsmith RE, Meador-Woodruff JH. Abnormal glutamate receptor expression in the medial temporal lobe in schizophrenia and mood disorders. Neuropsychopharmacology. (2007) 32:1888–902. doi: 10.1038/sj.npp.1301312
35. Dorph-Petersen KA, Lewis DA. Postmortem structural studies of the thalamus in schizophrenia. Schizophr Res. (2017) 180:28–35. doi: 10.1016/j.schres.2016.08.007
36. Taylor R, Osuch EA, Schaefer B, Rajakumar N, Neufeld RW, Theberge J, et al. Neurometabolic abnormalities in schizophrenia and depression observed with magnetic resonance spectroscopy at 7 T. BJPsych Open. (2017) 3:6–11. doi: 10.1192/bjpo.bp.116.003756
37. Theberge J, Al-Semaan Y, Williamson PC, Menon RS, Neufeld RW, Rajakumar N, et al. Glutamate and glutamine in the anterior cingulate and thalamus of medicated patients with chronic schizophrenia and healthy comparison subjects measured with 4.0-T proton MRS. Am J Psychiatry. (2003) 160:2231–3. doi: 10.1176/appi.ajp.160.12.2231
38. Dias AM. The Integration of the glutamatergic and the white matter hypotheses of schizophrenia's etiology. Curr Neuropharmacol. (2012) 10:2–11. doi: 10.2174/157015912799362742
39. Kochunov P, Chiappelli J, Wright SN, Rowland LM, Patel B, Wijtenburg SA, et al. Multimodal white matter imaging to investigate reduced fractional anisotropy and its age-related decline in schizophrenia. Psychiatry Res. (2014) 223:148–56. doi: 10.1016/j.pscychresns.2014.05.004
40. Pulver AE, Mulle J, Nestadt G, Swartz KL, Blouin JL, Dombroski B, et al. Genetic heterogeneity in schizophrenia: stratification of genome scan data using co-segregating related phenotypes. Mol Psychiatry. (2000) 5:650–3. doi: 10.1038/sj.mp.4000814
41. Chiu YF, McGrath JA, Thornquist MH, Wolyniec PS, Nestadt G, Swartz KL, et al. Genetic heterogeneity in schizophrenia II: conditional analyses of affected schizophrenia sibling pairs provide evidence for an interaction between markers on chromosome 8p and 14q. Mol Psychiatry. (2002) 7:658–64. doi: 10.1038/sj.mp.4001045
42. Thaker GK, Avila M. Schizophrenia, V: risk markers. Am J Psychiatry. (2003) 160:1578. doi: 10.1176/appi.ajp.160.9.1578
43. Snitz BE, Macdonald AW III, Carter CS. Cognitive deficits in unaffected first-degree relatives of schizophrenia patients: a meta-analytic review of putative endophenotypes. Schizophr Bull. (2006) 32:179–94. doi: 10.1093/schbul/sbi048
44. Harave VS, Shivakumar V, Kalmady SV, Narayanaswamy JC, Varambally S, Venkatasubramanian G. Neurocognitive impairments in unaffected first-degree relatives of schizophrenia. Indian J Psychol Med. (2017) 39:250–3. doi: 10.4103/0253-7176.207335
45. Lutkenhoff ES, van Erp TG, Thomas MA, Therman S, Manninen M, Huttunen MO, et al. Proton MRS in twin pairs discordant for schizophrenia. Mol Psychiatry. (2010) 15:308–18. doi: 10.1038/mp.2008.87
46. Tibbo P, Hanstock C, Valiakalayil A, Allen P. 3-T proton MRS investigation of glutamate and glutamine in adolescents at high genetic risk for schizophrenia. Am J Psychiatry. (2004) 161:1116–8. doi: 10.1176/appi.ajp.161.6.1116
47. de la Fuente-Sandoval C, Leon-Ortiz P, Azcarraga M, Favila R, Stephano S, Graff-Guerrero A. Striatal glutamate and the conversion to psychosis: a prospective 1H-MRS imaging study. Int J Neuropsychopharmacol. (2013) 16:471–5. doi: 10.1017/S1461145712000314
48. Theberge J, Bartha R, Drost DJ, Menon RS, Malla A, Takhar J, et al. Glutamate and glutamine measured with 4.0 T proton MRS in never-treated patients with schizophrenia and healthy volunteers. Am J Psychiatry. (2002) 159:1944–6. doi: 10.1176/appi.ajp.159.11.1944
49. Overall JE, Gorham DR. The brief psychiatric rating scale. Psychol Rep. (1962) 10:799–812. doi: 10.2466/pr0.1962.10.3.799
50. Kirkpatrick B, Strauss GP, Nguyen L, Fischer BA, Daniel DG, Cienfuegos A, et al. The brief negative symptom scale: psychometric properties. Schizophr Bull. (2011) 37:300–5. doi: 10.1093/schbul/sbq059
51. Patterson TL, Goldman S, McKibbin CL, Hughs T, Jeste DV. UCSD Performance-Based Skills Assessment: development of a new measure of everyday functioning for severely mentally ill adults. Schizophr Bull. (2001) 27:235–45. doi: 10.1093/oxfordjournals.schbul.a006870
52. Mucci A, Rucci P, Rocca P, Bucci P, Gibertoni D, Merlotti E, et al. The Specific Level of Functioning Scale: construct validity, internal consistency and factor structure in a large Italian sample of people with schizophrenia living in the community. Schizophr Res. (2014) 159:144–50. doi: 10.1016/j.schres.2014.07.044
53. Nuechterlein KH, Green MF, Kern RS, Baade LE, Barch DM, Cohen JD, et al. The MATRICS Consensus Cognitive Battery, part 1: test selection, reliability, and validity. Am J Psychiatry. (2008) 165:203–13. doi: 10.1176/appi.ajp.2007.07010042
54. Kern RS, Nuechterlein KH, Green MF, Baade LE, Fenton WS, Gold JM, et al. The MATRICS Consensus Cognitive Battery, part 2: co-norming and standardization. Am J Psychiatry. (2008) 165:214–20. doi: 10.1176/appi.ajp.2007.07010043
55. Tkac I, Starcuk Z, Choi IY, Gruetter R. In vivo 1H NMR spectroscopy of rat brain at 1 ms echo time. Magn Reson Med. (1999) 41:649–56
56. Gruetter R. Automatic, localized in vivo adjustment of all first- and second-order shim coils. Magn Reson Med. (1993) 29:804–11. doi: 10.1002/mrm.1910290613
57. Versluis MJ, Kan HE, van Buchem MA, Webb AG. Improved signal to noise in proton spectroscopy of the human calf muscle at 7 T using localized B1 calibration. Magn Reson Med. (2010) 63:207–11. doi: 10.1002/mrm.22195
58. Provencher SW. Estimation of metabolite concentrations from localized in vivo proton NMR spectra. Magn Reson Med. (1993) 30:672–9. doi: 10.1002/mrm.1910300604
59. Soher BJ, Young K, Bernstein A, Aygula Z, Maudsley AA. GAVA: spectral simulation for in vivo MRS applications. J Magn Reson. (2007) 185:291–9. doi: 10.1016/j.jmr.2007.01.005
60. Govindaraju V, Young K, Maudsley AA. Proton NMR chemical shifts and coupling constants for brain metabolites. NMR Biomed. (2000) 13:129–53. doi: 10.1002/1099-1492(200005)13:3<129::aid-nbm619>3.0.co;2-v
61. Murrough JW, Mao X, Collins KA, Kelly C, Andrade G, Nestadt P, et al. Increased ventricular lactate in chronic fatigue syndrome measured by 1H MRS imaging at 3.0 T. II: comparison with major depressive disorder. NMR Biomed. (2010) 23:643–50. doi: 10.1002/nbm.1512
62. Nagae-Poetscher LM, McMahon M, Braverman N, Lawrie WT Jr, Fatemi A, Degaonkar M, et al. Metabolites in ventricular cerebrospinal fluid detected by proton magnetic resonance spectroscopic imaging. J Magn Reson Imaging. (2004) 20:496–500. doi: 10.1002/jmri.20128
63. Kristiansen LV, Beneyto M, Haroutunian V, Meador-Woodruff JH. Changes in NMDA receptor subunits and interacting PSD proteins in dorsolateral prefrontal and anterior cingulate cortex indicate abnormal regional expression in schizophrenia. Mol Psychiatry. (2006) 11:737–47. doi: 10.1038/sj.mp.4001844
64. Wijtenburg SA, Wright SN, Korenic SA, Gaston FE, Ndubuizu N, Chiappelli J, et al. Altered glutamate and regional cerebral blood flow levels in schizophrenia: A (1)H-MRS and pCASL study. Neuropsychopharmacology. (2017) 42:562–71. doi: 10.1038/npp.2016.172
65. Baiano M, David A, Versace A, Churchill R, Balestrieri M, Brambilla P. Anterior cingulate volumes in schizophrenia: a systematic review and a meta-analysis of MRI studies. Schizophr Res. (2007) 93:1–12. doi: 10.1016/j.schres.2007.02.012
66. Quintana J, Wong T, Ortiz-Portillo E, Marder SR, Mazziotta JC. Anterior cingulate dysfunction during choice anticipation in schizophrenia. Psychiatry Res. (2004) 132:117–30. doi: 10.1016/j.pscychresns.2004.06.005
67. Kerns JG, Cohen JD, MacDonald AW III, Johnson MK, Stenger VA, Aizenstein H, et al. Decreased conflict- and error-related activity in the anterior cingulate cortex in subjects with schizophrenia. Am J Psychiatry. (2005) 162:1833–9. doi: 10.1176/appi.ajp.162.10.1833
68. Lewis DA, Glantz LA, Pierri JN, Sweet RA. Altered cortical glutamate neurotransmission in schizophrenia: evidence from morphological studies of pyramidal neurons. Ann N Y Acad Sci. (2003) 1003:102–12. doi: 10.1196/annals.1300.007
69. Bustillo JR, Chen H, Jones T, Lemke N, Abbott C, Qualls C, et al. Increased glutamine in patients undergoing long-term treatment for schizophrenia: a proton magnetic resonance spectroscopy study at 3 T. JAMA Psychiatry. (2014) 71:265–72. doi: 10.1001/jamapsychiatry.2013.3939
70. de Jonge JC, Vinkers CH, Hulshoff Pol HE, Marsman A. GABAergic Mechanisms in schizophrenia: linking postmortem and in vivo studies. Front Psychiatry. (2017) 8:118. doi: 10.3389/fpsyt.2017.00118
71. Beech A, Powell T, McWilliam J, Claridge G. Evidence of reduced 'cognitive inhibition' in schizophrenia. Br J Clin Psychol. (1989) 28:109–16. doi: 10.1111/j.2044-8260.1989.tb00821.x
72. Sullivan CR, Mielnik CA, Funk A, O'Donovan SM, Bentea E, Pletnikov M, et al. Measurement of lactate levels in postmortem brain, iPSCs, and animal models of schizophrenia. Sci Rep. (2019) 9:5087. doi: 10.1038/s41598-019-41572-9
73. Fukushima T, Iizuka H, Yokota A, Suzuki T, Ohno C, Kono Y, et al. Quantitative analyses of schizophrenia-associated metabolites in serum: serum D-lactate levels are negatively correlated with gamma-glutamylcysteine in medicated schizophrenia patients. PLoS ONE. (2014) 9:e101652. doi: 10.1371/journal.pone.0101652
74. Da Silva T, Wu A, Laksono I, Prce I, Maheandiran M, Kiang M, et al. Mitochondrial function in individuals at clinical high risk for psychosis. Sci Rep. (2018) 8:6216. doi: 10.1038/s41598-018-24355-6
75. Wu CH, Hwang TJ, Chen YJ, Hsu YC, Lo YC, Liu CM, et al. Primary and secondary alterations of white matter connectivity in schizophrenia: a study on first-episode and chronic patients using whole-brain tractography-based analysis. Schizophr Res. (2015) 169:54–61. doi: 10.1016/j.schres.2015.09.023
Keywords: 7T MRS, schizophrenia, first degree relatives, brain, metabolism, glutamate, glutamine, GABA
Citation: Wijtenburg SA, Wang M, Korenic SA, Chen S, Barker PB and Rowland LM (2021) Metabolite Alterations in Adults With Schizophrenia, First Degree Relatives, and Healthy Controls: A Multi-Region 7T MRS Study. Front. Psychiatry 12:656459. doi: 10.3389/fpsyt.2021.656459
Received: 20 January 2021; Accepted: 06 April 2021;
Published: 19 May 2021.
Edited by:
Maria Concepcion Garcia Otaduy, University of São Paulo, BrazilReviewed by:
Gabriele Ende, University of Heidelberg, GermanyKatharine Thakkar, Michigan State University, United States
James Stone, University of Brighton, United Kingdom
Copyright © 2021 Wijtenburg, Wang, Korenic, Chen, Barker and Rowland. This is an open-access article distributed under the terms of the Creative Commons Attribution License (CC BY). The use, distribution or reproduction in other forums is permitted, provided the original author(s) and the copyright owner(s) are credited and that the original publication in this journal is cited, in accordance with accepted academic practice. No use, distribution or reproduction is permitted which does not comply with these terms.
*Correspondence: S. Andrea Wijtenburg, awijtenburg@som.umaryland.edu
†These authors share senior authorship
‡Present address: Min Wang, Department of Biomedical Engineering, College of Biomedical Engineering and Instrument Science, Zhejiang University, Hangzhou, China