 Kathryn L. Mills1,2* Deepti Bathula3,4 Taciana G. Costa Dias1,3 Swathi P. Iyer1 Michelle C. Fenesy3 Erica D. Musser3 Corinne A. Stevens1 Bria L. Thurlow1 Samuel D. Carpenter1 Bonnie J. Nagel1,3 Joel T. Nigg1,3 Damien A. Fair1,3,5*
- 1 Department of Behavioral Neuroscience, Oregon Health and Science University, Portland, OR, USA
- 2 Child Psychiatry Branch, National Institute of Mental Health, Bethesda, MD, USA
- 3 Department of Psychiatry, Oregon Health and Science University, Portland, OR, USA
- 4 Indian Institute of Technology, Ropar, India
- 5 Advanced Imaging Research Center, Oregon Health and Science University, Portland, OR, USA
Introduction: Attention deficit hyperactivity disorder (ADHD) captures a heterogeneous group of children, who are characterized by a range of cognitive and behavioral symptoms. Previous resting-state functional connectivity MRI (rs-fcMRI) studies have sought to understand the neural correlates of ADHD by comparing connectivity measurements between those with and without the disorder, focusing primarily on cortical–striatal circuits mediated by the thalamus. To integrate the multiple phenotypic features associated with ADHD and help resolve its heterogeneity, it is helpful to determine how specific circuits relate to unique cognitive domains of the ADHD syndrome. Spatial working memory has been proposed as a key mechanism in the pathophysiology of ADHD. Methods: We correlated the rs-fcMRI of five thalamic regions of interest (ROIs) with spatial span working memory scores in a sample of 67 children aged 7–11 years [ADHD and typically developing children (TDC)]. In an independent dataset, we then examined group differences in thalamo-striatal functional connectivity between 70 ADHD and 89 TDC (7–11 years) from the ADHD-200 dataset. Thalamic ROIs were created based on previous methods that utilize known thalamo-cortical loops and rs-fcMRI to identify functional boundaries in the thalamus. Results/Conclusion: Using these thalamic regions, we found atypical rs-fcMRI between specific thalamic groupings with the basal ganglia. To identify the thalamic connections that relate to spatial working memory in ADHD, only connections identified in both the correlational and comparative analyses were considered. Multiple connections between the thalamus and basal ganglia, particularly between medial and anterior dorsal thalamus and the putamen, were related to spatial working memory and also altered in ADHD. These thalamo-striatal disruptions may be one of multiple atypical neural and cognitive mechanisms that relate to the ADHD clinical phenotype.
Introduction
Brain imaging studies of attention deficit hyperactivity disorder (ADHD), including resting-state functional connectivity MRI (rs-fcMRI) studies, typically compare a group of children with the disorder to a typically developing control population (for a recent review, see Liston et al., 2011). In these studies, statistical differences between groups are used to inform current models of the disorder. However, with regard to resting connectivity in ADHD, the literature has generally not yet related group effects to specific behavioral symptoms or cognitive deficits, which are likely to vary across individuals with the disorder (Nigg, 2005). It is crucial to a comprehensive understanding of ADHD that the established cognitive correlates of the disorder are integrated with both clinical presentation and with contemporary, systemic analysis of brain function.
One approach to relating behavioral phenotypes to functional connectivity signatures of the disorder might be to first perform a traditional two-group analysis in a large sample to identify differences that are on average found in the test population. In conjunction, one would then apply a dimensional method in the same or, preferably, an independent sample to identify how atypical circuits relate to cognitive domains, even if they are not atypical in all participants with the disorder (Insel et al., 2010). This approach would extend our understanding of how differences in brain connectivity observed in children with ADHD relate to specific observed deficits in cognition and behavior, and potentially set the stage for refined diagnostics or refined phenotyping/subtyping based on brain physiology (Insel et al., 2010).
To this end, we begin our efforts examining the neurophysiology of ADHD and its relationship to spatial working memory. Deficits in spatial working memory have been proposed as a core mechanism in ADHD (Castellanos and Tannock, 2002; Westerberg et al., 2004; Nigg, 2005), are extensively studied, and appear to yield among the largest effect sizes of any cognitive measure in ADHD (Nigg, 2005; Willcutt et al., 2005; Brown et al., 2011; Finke et al., 2011; Rhodes et al., 2012; Tillman et al., 2011). Typical measures of spatial span working memory ask the child to remember the sequence of a series of locations, and then to recall the sequence in order or in reverse. The latter task not only tests the child’s ability to hold visual–spatial information in mind, but to also manipulate the information further in order to recall the sequence in the reverse order, presumably recruiting more central executive processes (Baddeley, 1996). Children with ADHD, as well as unaffected siblings of children with ADHD, successfully recall significantly shorter spatial span sequences than typically developing children (TDC) (Gau and Shang, 2010), making spatial working memory a viable candidate endophenotype for ADHD (Doyle et al., 2005).
Multiple neural pathways have been proposed as being involved in ADHD, many emphasizing subcortical–cortical circuits and dopaminergic projection pathways (Castellanos, 1997; Giedd et al., 2001; Nigg and Casey, 2005). While much attention has been given to the frontal–striatal aspect of these circuits, the role of the thalamus in ADHD has largely been unexplored. While a previous investigation of thalamic morphology in youths with ADHD revealed no overall difference in total thalamic volume, some region specific thalamic volumes were atypical in youths with ADHD, and were related to symptom dimensions of the disorder (Ivanov et al., 2010). Given the importance of the thalamus as a potential integration site of networks supporting the ability to modulate behavior (Haber and Calzavara, 2009), and its mediating role in cortico-striatal circuits, disrupted connections between the thalamus and other subcortical structures (i.e., basal ganglia) may correlate with certain behavioral components of ADHD. However, thalamic structures have traditionally been difficult to visualize in vivo in children, perhaps accounting for this gap in knowledge.
This problem may be overcome with resting state functional connectivity. Resting-state functional connectivity (rs-fcMRI) has been proposed as a method to study functional relationships between brain regions by examining spontaneous slow-wave (less than 0.1 Hz) oscillations in the blood–oxygen level dependent (BOLD) signal (Biswal et al., 1995). These functional connections are thought to reflect a history of co-activation between populations of neurons, and thus allow neuroimaging investigations the ability to examine the intrinsic functional architecture of the human brain (Bi and Poo, 1999; Dosenbach et al., 2007; Fair et al., 2007a). Previous studies have utilized rs-fcMRI to characterize atypical connections in ADHD (Zang et al., 2007; Castellanos et al., 2008; Uddin et al., 2008; Wang et al., 2009; Fair et al., 2010b), but tended to focus on cortical connections. To this date, rs-fcMRI investigations of subcortical–cortical interactions in children with ADHD remain scarce.
A recent technique that utilizes rs-fcMRI to examine functional relationships between the thalamus and cortex has created an opportunity for in vivo investigations of thalamo-cortical connectivity (Zhang et al., 2008, 2009). This technique has since been used to characterize thalamo-cortical connectivity across development (Fair et al., 2010a). Using this approach, it is possible to create functionally defined regions within the thalamus, and use these thalamic regions to examine interactions between the thalamus, basal ganglia, and cortex.
Drawing on subcortical–cortical models of ADHD (Nigg and Casey, 2005), we examined the functional connectivity between five thalamic regions of interest (ROI) and the basal ganglia. Taking advantage of recent techniques that allow functional parcellation of the thalamus (Zhang et al., 2008, 2009; Fair et al., 2010a), we correlated thalamic connection strength with spatial span backward scores in a sample of 67 children with and without ADHD. We then performed a comparative analysis of thalamic connection strength between children with and without ADHD-combined subtype (ADHD-C) in a matched independent sample comprising data collected across five institutions (see ADHD-200; http://fcon_1000.projects.nitrc.org/indi/adhd200). By examining connections that were both (a) related to spatial span working memory performance, and (b) associated with ADHD, we are able to distinguish how specific circuits relate to specific cognitive deficits that represent components of the ADHD syndrome.
Materials and Methods
Participants
Data from Oregon Health and Science University, Brown University, Beijing Normal University, Kennedy Krieger Institute, and NYU Child Study Center were collected for youth aged 7–11 years (N = 132 TDC; N = 94 ADHD). Informed written consent or assent was obtained for all participants, and all procedures complied with the Human Investigation Review Board at respective universities. Due to differences in procedures across institutions, details on diagnostic criteria, data acquisition, and data processing are included in the Appendix.
This large dataset was divided into two subgroups for the analyses. The first subgroup comprised 67 children with and without ADHD (all subtypes included) from the Oregon Health and Science University site, for a correlational analysis (see Table 1). The second subgroup comprised 89 TDC and 70 children with ADHD-C, matched for age, gender, and motion for a comparative analysis (see Table 1).
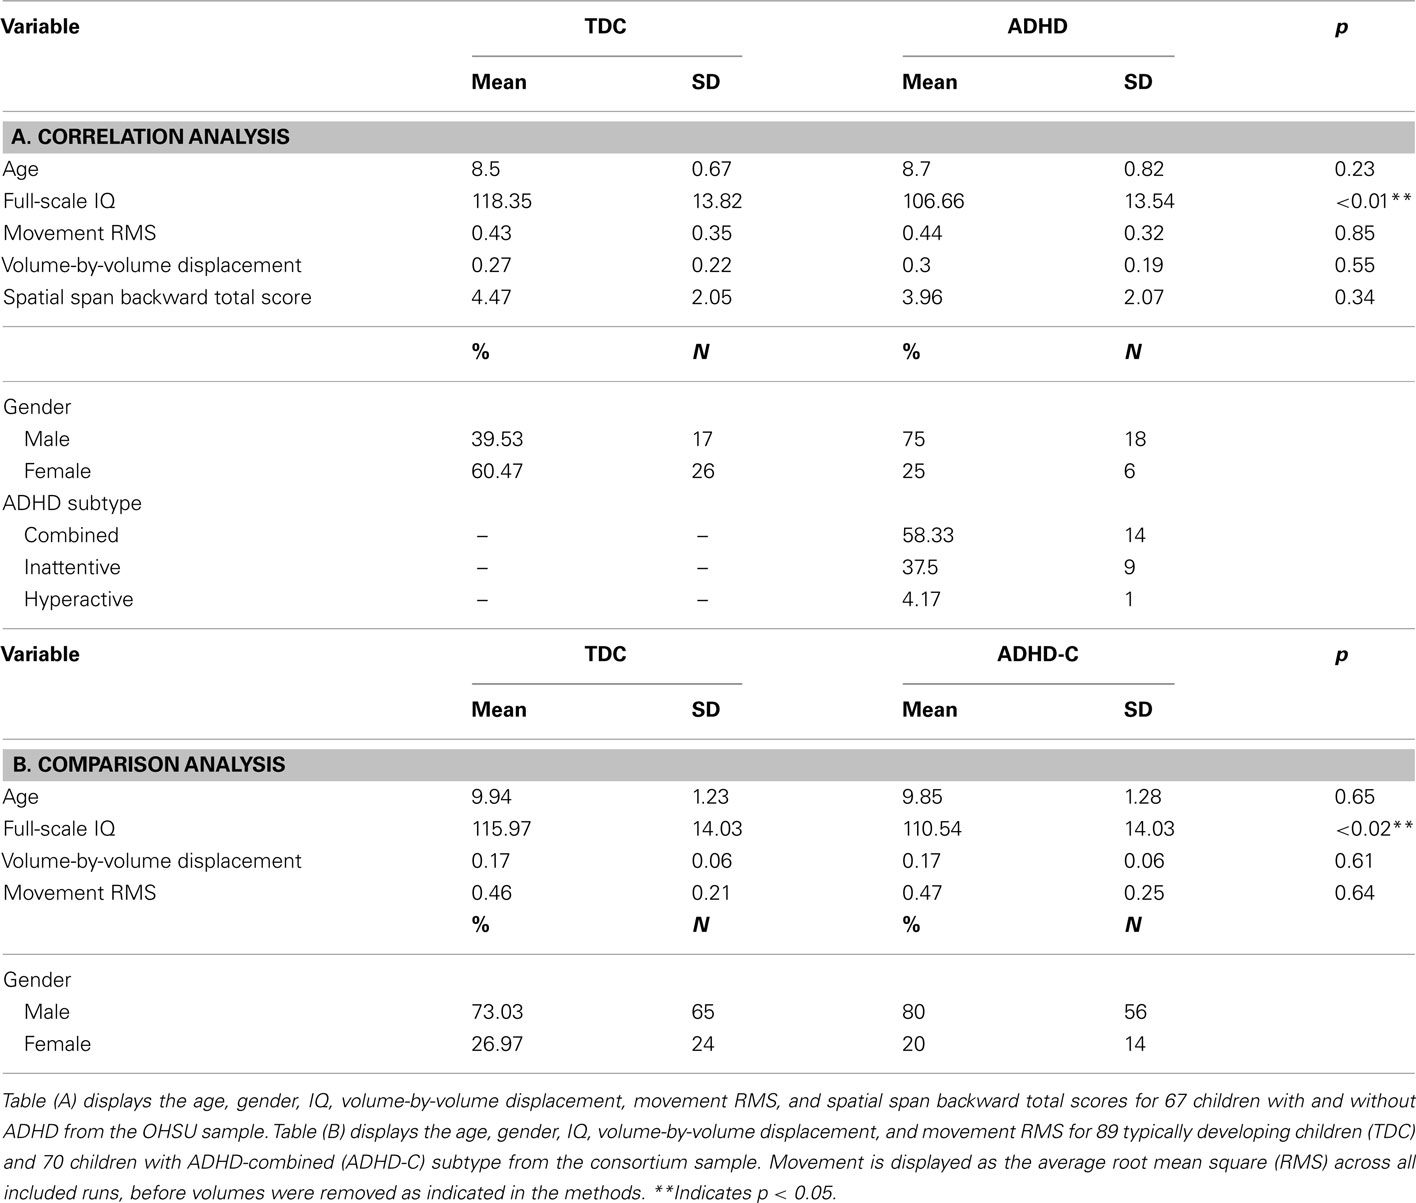
Table 1. Participant characteristics.
Behavioral Measure
Spatial span working memory was assessed on the first subgroup of participants in this study (see Table 1). These participants received the spatial span subtest of the Cambridge Neuropsychological Test Battery (CANTAB; CeNeS, 1998). The spatial span task is a computer-based task modeled on the Corsi Block Tapping Test (Milner, 1971). All children were presented a screen with indiscriminately placed boxes, and instructed to watch for the boxes that change. For this particular version of the task, boxes changed through the appearance of a green smiley-face within the box. After each sequence, children were asked to respond by clicking on the appropriate boxes after a 500 ms delay. Children were instructed to click on the boxes that changed in the same order for the spatial span forward task, or else they were instructed to click on the boxes that changed in reverse order for the spatial span backward task. The total span length and accuracy were recorded for each task. For the purposes of this study, we examined the spatial span backward total score for each child, which is the product of the total span length and mean accuracy across the spatial span backward task.
Data Acquisition and Processing
Participants were scanned on 3.0 Tesla scanners using standard resting-fMRI T2*-weighted echo-planar imaging. Due to the collaborative nature of this project (multiple sites of data collection), specific details regarding data acquisition, including scanning protocol and scanner details, are described in the Appendix to conserve space. All functional images were preprocessed to reduce artifacts (Miezin et al., 2000; see Appendix Text). Connectivity preprocessing followed prior methods (Fox et al., 2005; Fair et al., 2007a,b, 2008, 2009, 2010a) to reduce spurious variance unlikely to reflect neuronal activity (Fox and Raichle, 2007). These steps included: (i) a temporal band-pass filter (0.009 Hz < f < 0.08 Hz), (ii) regression of six parameters obtained by rigid body head motion correction, (iii) regression of the whole brain signal averaged over the whole brain, (iv) regression of ventricular signal averaged from ventricular region of interest (ROI), and (v) regression of white matter signal averaged from white matter ROI. Regression of first order derivative terms for the whole brain, ventricular, and white matter signals were also included in the correlation preprocessing. These preprocessing steps are, in part, intended to remove any developmental changes in connectivity driven by changes in respiration and heart rate over age. Motion was corrected and quantified using an analysis of head position based on rigid body translation and rotation. The data derived from these adjustments needed to realign head movement on a volume-by-volume basis were calculated as root mean square (RMS) values for translation and rotation in the x, y, and z planes in millimeters. Participant’s BOLD runs with movement exceeding 1.5 mm RMS were removed. Overall movement was low across all participants (Table 1).
With that said, we were particularly sensitive to potential movement confounds. As such, we also evaluated the similarity between each BOLD volume and the preceding volume to exclude volumes with excessive movement (Smyser et al., 2010; Shannon et al., 2011). Movement generally results in high variance in measured functional MRI signal. Thus, the algorithm used here excludes volumes whose signal change was >3 SD above the mean (Smyser et al., 2010; Shannon et al., 2011). Signal change is computed at each voxel by backward differences. The global measure of signal change then is
where Ii( ) is image intensity at locus
  on time point i and angle brackets denote the spatial average over the whole brain. For the remaining volumes we also limited our sample to ensure that mean volume-by-volume displacement was not related to our outcome measures (Power et al., 2012; Van Dijk et al., 2011). Volume-by-volume displacement (VD) – or frame-to-frame displacement (FD; Power et al., 2012) – was calculated as a scalar quantity using the formula, VDi = | Δ dix| + | Δ diy| + | Δ diz| + | Δ αi| + | Δ βi| + | Δ γi|, where Δ dix = d(i − 1)x − dix, and similarly for the other five rigid body parameters (Power et al., 2012). This formula sums the absolute values of volume-by-volume changes in the six rigid body parameters. There was no relationship between mean volume-by-volume displacement (for the remaining volumes) and spatial span backward total scores (p > 0.19). We also matched our participants, such that there was no difference in mean volume-by-volume displacement (for remaining volumes) between children with ADHD and TDC in our sample (p > 0.80).
Thalamic ROI Definition Using “Winner Take all” Strategy
Thalamic ROIs were defined using the “winner take all” strategy for all 226 participants in order limit group bias during ROI creation (Zhang et al., 2008, 2009; Fair et al., 2010a). The “winner take all” strategy assigns each voxel in the thalamus a value corresponding to the cortical subdivision to which it is most strongly correlated. Cortical subdivisions were defined as in Zhang et al. (2008). The anatomical image from a normal young adult volunteer was segmented along the gray/white boundary and deformed to the population-average, landmark, and surface-based (PALS)-B12 atlas (Van Essen, 2005) using SureFit and Caret software (Van Essen and Drury, 1997; Van Essen et al., 2001). Partition boundaries were manually drawn based on major sulcal landmarks, following work by Behrens et al. (2003). Five broad cortical ROIs were defined: (1) frontopolar and frontal cortex including the orbital surface and anterior cingulate; (2) motor and premotor cortex (Brodmann areas 6 and 4 – excluding adjacent portions of cingulate cortex); (3) somatosensory cortex (Brodmann areas 3, 1, 2, 5, and parts of 40); (4) parietal and occipital cortex including posterior cingulate and lingual gyrus; (5) temporal cortex including the lateral surface, temporal pole, and parahippocampal areas. These five surface partitions were assigned a thickness of 3 mm, 1.5 mm above and below the fiducial surface (corresponding to “layer IV”), and were then rendered into volume space.
For each of the cortical ROIs, volumetric correlation maps were generated for each subject (Fox et al., 2005). To calculate statistical significance, we converted correlation coefficients (r) to a normal distribution using Fisher’s z transformation. z-transformed maps were then combined across participants using a random effects analysis. Results presented here are restricted to the thalamus, whose boundaries were created by manual tracing of the atlas template (Zhang et al., 2008). Finally, the “winner take all” strategy, as established in previous work (Zhang et al., 2008), was applied to subdivide the thalamus. For the five cortical subdivisions, an average resting-state time series was extracted and correlated with each voxel in the thalamus for each individual. These data were analyzed with a total correlation procedure, which included whole brain signal regression in the initial preprocessing steps. Shared variance among the five cortical subdivisions is accounted for in this instance with the initial whole brain signal regression, similar to the total correlation procedure used in Zhang et al. (2008).
This analysis allowed us to create functionally defined thalamic ROI. Five thalamic ROIs were created based on the correlations between the five cortical ROIs and each voxel in the thalamus. Given that functional connectivity between the thalamus and cortex changes across developmental periods (Fair et al., 2010a), we used this method to create functionally defined ROIs within the thalamus for our sample of 226 children aged 7–11 years, a relatively restricted development window. These five thalamic ROIs were then used to generate volumetric correlation maps for each subject, which were then normalized through the same procedure detailed above. All remaining analyses were performed on these Fisher z-transformed correlation maps.
Analysis 1: Correlational Analysis with Spatial Span Backward Total Scores
To test significant relationships between thalamic connectivity and spatial span backward total scores, we performed a voxelwise correlational analysis in the first subgroup of 67 children (Table 1). Correlations between all voxels and each thalamic ROI were calculated for each participant (random effects analysis assuming unequal variance; p ≤ 0.05), and these correlation values were then correlated (r) with the spatial span backward total score for each participant. For the voxelwise, random effects maps, we implemented a Monte Carlo simulation procedure (Forman et al., 1995). To obtain multiple comparisons corrected, p < 0.05 voxel clusters, a threshold of 53 contiguous voxels with a z-value >2.25 was used.
Analysis 2: Comparative Analysis between Children with ADHD-C and Typically Developing Children
To test significant differences in thalamic connectivity between 70 children with ADHD-C and 89 matched TDC (Table 1), direct comparisons between the two groups were performed. We performed two-sample, two-tailed t-tests (random effects analysis assuming unequal variance; p ≤ 0.05) for each thalamic ROI. For the voxelwise, random effects maps, we implemented a Monte Carlo simulation procedure (Forman et al., 1995). To obtain multiple comparisons corrected, p < 0.05 voxel clusters, a threshold of 53 contiguous voxels with a z-value >2.25 was used. To examine the functional connectivity maps for each group, we generated separate z-score maps across all participants in each group using a random effects analysis.
Conjunction Analysis
For each thalamic ROI, results of the comparative analysis were masked by results of the correlational analysis to identify areas that are both significantly different in children with ADHD as compared to TDC, and related to spatial span backward performance. This process was conducted on the Monte Carlo multiple comparisons corrected voxelwise maps generated from each of the previous analyses. This conjunction analysis produced ROIs preblurred 4 mm FWHM, with peaks within 10 mm consolidated, and only voxels with z values >2.25 or <2.25 considered. The peaks generated from the comparative analysis were masked with the results of the correlation analysis. Time courses for each ROI were extracted. Correlations between these newly produced ROIs and the five thalamic ROIs were generated to characterize the relationship between spatial span backward scores that have been adjusted for age, and the connectivity strength between the thalamic ROI and the ROIs generated from the conjunction analysis.
Results
Functional Connectivity of Cortical Subdivisions within the Thalamus
Five thalamic ROIs were created by subdividing the thalamus with the “winner take all” strategy in all 226 participants, displayed in Figure 1. These thalamic ROIs showed bilateral symmetry, and visually correspond to known human thalamic nuclear groupings (Jones, 2007). It should be noted that the subdivision of the thalamus in the current sample of children (7–11 years) most closely resembles the subdivision of the thalamus of an adolescent group (11–16 years) as opposed to the 7–9 year olds in prior work (Fair et al., 2010a). This pattern may reflect the demographic characteristics of our sample, which has a slightly greater number of older children than the prior study (mean age = 9.50 years), or might relate to increased sample size and additional movement correction procedures performed here (Smyser et al., 2010; Power et al., 2012; Shannon et al., 2011; Van Dijk et al., 2011). Nevertheless, the thalamic subdivisions generated in the current analysis resemble known nuclear groupings, supporting our use of these subdivisions as functionally defined thalamic ROIs. The prefrontal cortical subdivision showed strongest interactions with the anterior portion of the thalamus, potentially corresponding with the ventral anterior nuclei and anterior group. The temporal cortical subdivision showed strongest interactions with the medial posterior, inferior, and midline areas of the thalamus, potentially corresponding to the medial pulvinar, medial geniculate, and medial dorsal nucleus. The parietal–occipital cortical subdivision showed strongest interactions with the lateral and posterior portions of the thalamus, potentially corresponding to the lateral pulvinar and lateral geniculate. The somatosensory cortical areas strongly correlated with ventral, lateral, and posterior thalamic regions, potentially corresponding to ventral posterolateral and posteromedial nuclei. The premotor–motor cortical subdivision correlated strongly with lateral and ventral thalamic areas that presumptively correspond to ventral lateral and ventral lateral posterior nuclei. Thus, these patterns strongly suggest valid detection of actual thalamo-cortical loops by our method.
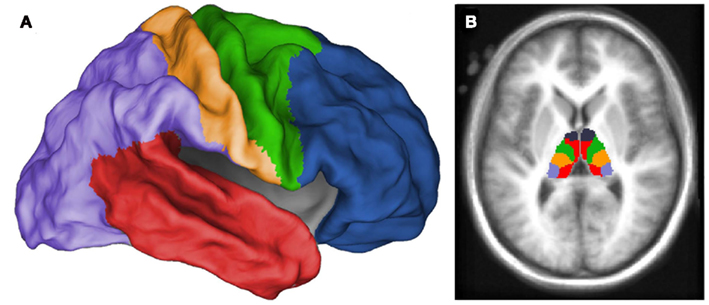
Figure 1. Thalamic regions of interest generated from “winner take all” procedure (Zhang et al., 2008, 2009; Fair et al., 2010a) in all 226 children. Each voxel in the thalamus was assigned a value (designated by color in figure) corresponding to the cortical subdivision with which it was most strongly correlated. Cortical subdivisions are illustrated in (A), and the thalamic subdivision is illustrated in (B). Thalamic ROIs were generated from this subdivision to analyze the functional connectivity of distinct thalamic regions.
Analysis 1: Thalamic Connectivity with the Basal Ganglia Relates to Spatial Span Working Memory Performance
In our initial set of 67 children, correlational analyses revealed significant relationships between spatial span backward total scores and thalamic functional connections with the basal ganglia. Significant relationships were observed for four of our five thalamic ROIs, as illustrated in Figure 2. Spatial span backward total scores were negatively correlated with connectivity strength between the prefrontal thalamic ROI and bilateral putamen and bilateral globus pallidus. Similarly, spatial span backward total scores were negatively correlated with connectivity strength between the premotor–motor thalamic ROI and bilateral putamen. Lateralized relationships were observed between spatial span backward total scores and connectivity between the temporal thalamic ROI and basal ganglia, as well as the somatosensory thalamic ROI and basal ganglia. Connectivity strength between the temporal thalamic ROI and primarily the left lateral globus pallidus was negatively correlated with spatial span backward total scores, whereas connectivity strength between the somatosensory thalamic ROI and primarily the right posterior putamen was negatively correlated with spatial span backward total scores.
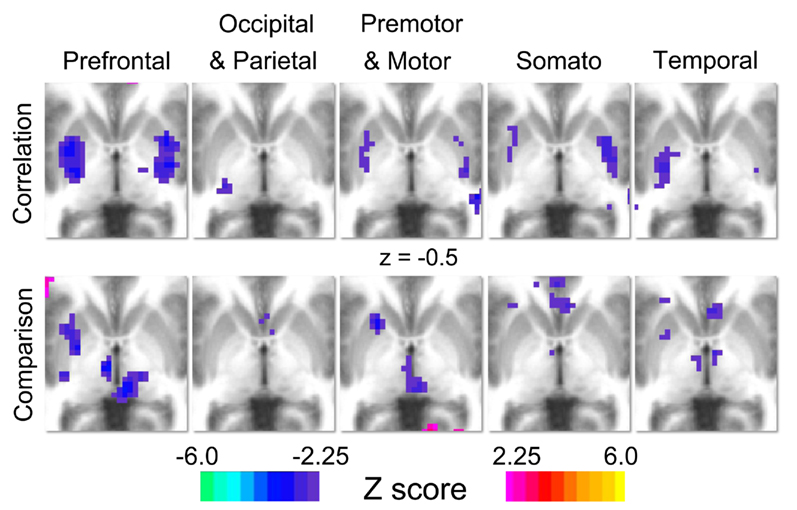
Figure 2. Results for the correlation and comparison analyses. Each column represents the results for each of thalamic regions of interest (prefrontal, occipital–parietal, premotor–motor, somatosensory, and temporal). For the correlation analysis (row 1), warm colors indicate areas where connection strength positively correlates with spatial span backward total scores, and cool colors indicate areas where connection strength is negatively correlated with spatial span backward total scores. For the comparison analysis (row 2), warm colors (positive z-scores) indicate areas where connection strength is greater in typically developing control population, and cool colors (negative z-scores) indicate areas where connection strength is greater in the ADHD-C population.
Analysis 2: Thalamic Connectivity with the Basal Ganglia is Atypical in Children with ADHD
Direct comparisons between 70 children diagnosed with ADHD-C and 89 TDC reveal significant differences in connectivity between the thalamus and basal ganglia portrayed in Figure 2. Specifically, robust differences in connectivity were found between the prefrontal thalamic ROI and the left putamen, reflecting different subcortical connectivity patterns between groups. Examination of functional connectivity patterns at the group level reveals connections between the prefrontal thalamic ROI and the putamen in the ADHD-C group that are absent altogether in the TDC group (Figure A1 in Appendix). Children with ADHD-C also showed significantly greater connectivity strength between the occipital–parietal thalamic ROI and the left putamen and right caudate head than TDC. Connectivity differences and group level patterns between the basal ganglia and the premotor–motor thalamic ROI, somatosensory thalamic ROI, and temporal thalamic ROI were observed, although at a smaller scale. The connectivity differences observed for these three seed regions were similarly located in the putamen, with small differences observed in portions of the globus pallidus and caudate body. Children with ADHD-C showed significantly greater connectivity strength between these thalamic regions and basal ganglia than TDC.
Atypical Thalamic Connectivity with the Basal Ganglia Relates to Spatial Span Working Memory Performance as Revealed by Conjunction Analysis
Results of the conjunction analysis reveal distinct and overlapping relationships between four of our thalamic ROIs and the basal ganglia, specifically the putamen and globus pallidus (Figure 3). Connections between the prefrontal thalamic ROI and the left putamen (−27, 6, 4; −25, −7, −1; −30, −22, −1) are both significantly related to spatial span backward total scores and significantly different in children with ADHD-C as compared to TDC. Similarly, connections between the premotor–motor thalamic ROI and the left putamen (−20, 13, −1), as well as connections between the temporal thalamic ROI and left putamen (−21, 2, 1), are significantly related to spatial span backward total scores and significantly different in children with ADHD-C as compared to TDC. Connections between the somatosensory thalamic RO I and the right putamen (18, −33, −14), and right lateral medial pallidus (15, −6, −5) display significant overlapping relationships in the comparative and correlational analyses (see Table 2 for all coordinates). No connections between the occipital–parietal thalamic ROI and the basal ganglia passed the conjunction analysis. Connections to portions of the left putamen overlap across the different thalamic ROIs (Figure 3C). The relationship between adjusted spatial span backward total scores and connection strength between the prefrontal thalamic ROI and the left putamen (−25, −7, −1) was plotted to reveal the nature of the relationship in a post hoc analysis (Figure 4).
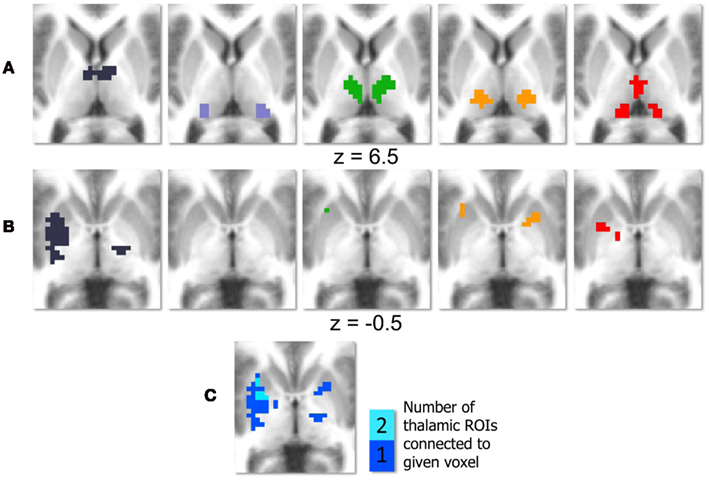
Figure 3. Conjunction analysis with basal ganglia. Thalamic regions of interest (ROI) are displayed in (A); deep purple corresponds to the prefrontal thalamic ROI, light purple corresponds to the occipital–parietal thalamic ROI, green corresponds to the premotor–motor thalamic ROI, orange–yellow corresponds to the somatosensory thalamic ROI, and red corresponds to the temporal thalamic ROI. Regions of the basal ganglia that survive the conjunction analysis are displayed in row (B), with each column corresponding to one thalamic ROI. The colors in (C) indicate how many thalamic ROIs show significant connections that pass the conjunction analysis with a given area of the basal ganglia.
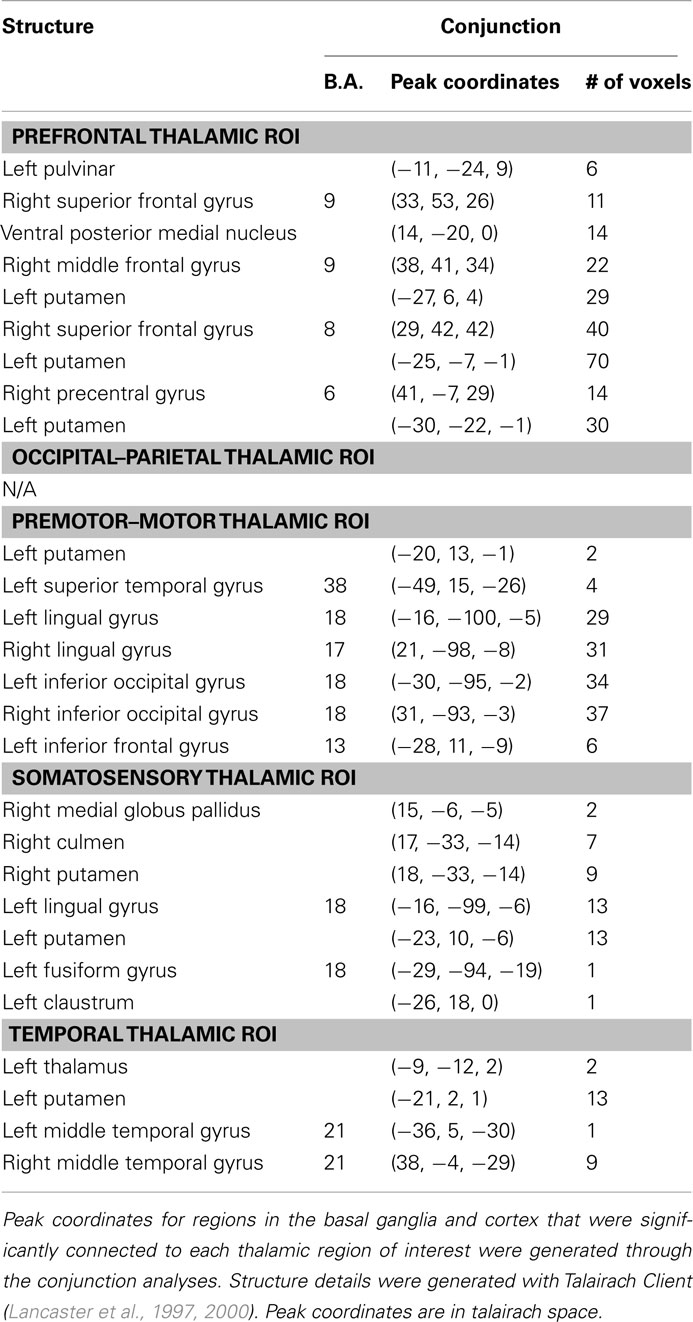
Table 2. Peak coordinate for the conjunction analysis.
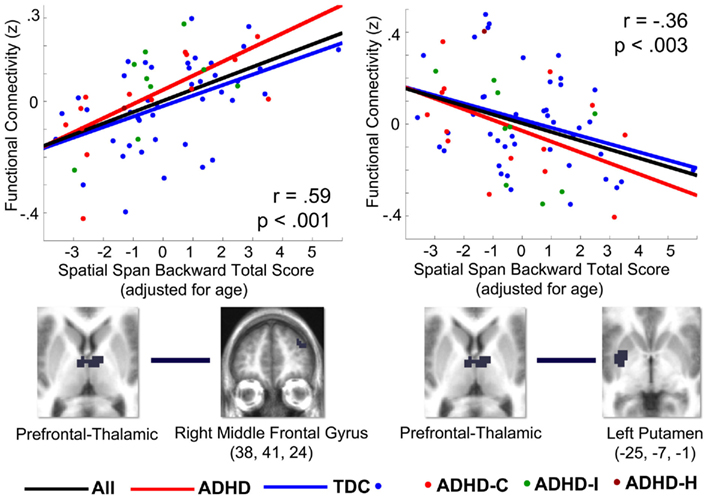
Figure 4. Correlations (r) between select thalamo-striatal and thalamo-cortical connections and spatial span working memory performance in 67 children in the OHSU cohort, from post hoc analysis. Graphs plot z-transformed functional connectivity values on the y-axis with adjusted spatial span backward total scores on the x-axis. Spatial span backward total scores were covaried for age. The Pearson correlation coefficient (r) and significance are displayed for each graph. The ROIs used to generate the correlation are visualized below each graph. The left graph plots connectivity between the prefrontal thalamic ROI and the right middle frontal gyrus (38, 41, 24) with spatial span working memory performance. The right graph plots connectivity between the prefrontal thalamic ROI and the left putamen (−25, −7, −1) with spatial span working memory performance. The black line is the fitted line for all children, the blue line is the fitted line for all TDC children, and the red line is the fitted line for all children with ADHD. The dots indicate the diagnostic category for each participant: blue for TDC, red for ADHD-combined subtype, green for ADHD-inattentive subtype, and dark red for ADHD-hyperactive subtype. The choices for connections plotted in this graph were generated from the conjunction analysis, and therefore these graphs are only to illustrate the relationship between thalamo-striatal and thalamo-cortical functional connections and the adjusted spatial span behavioral measure.
Atypical Thalamic Connectivity with Cortical Structures in Children with ADHD Relates to Spatial Span Working Memory Performance
While the focus of the current investigation was directed toward subcortical structures, connections between four of the thalamic ROIs and multiple areas of the cortex were also found to be significantly different in children with ADHD-C as compared to TDC children, and related to spatial span backward total scores (Figure 5). We describe the cortical results of the conjunction analysis for each thalamic ROI below. In addition, we have included details as to how these connections relate to spatial span working memory performance and differ between children with ADHD-C and TDC, illustrated in Figures A2–A6 in Appendix.
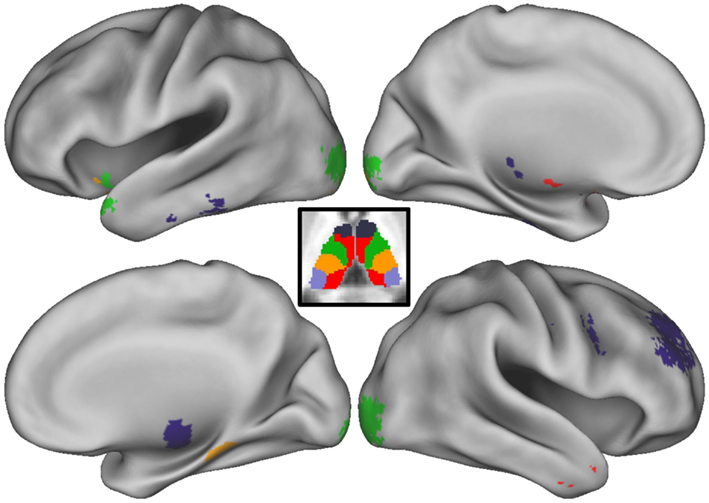
Figure 5. Conjunction analysis with cortex. Thalamo-cortical connections that survive the conjunction analysis are projected onto the medial and lateral surfaces of each hemisphere. Colors correspond to which thalamic regions of interest (ROI) the cortical area is connected. The thalamic parcellation is displayed in the center of the figure as a reference. Deep purple corresponds to the prefrontal thalamic ROI, light purple corresponds to the occipital–parietal thalamic ROI, green corresponds to the premotor–motor thalamic ROI, orange–yellow corresponds to the somatosensory thalamic ROI, and red corresponds to the temporal thalamic ROI.
Prefrontal thalamic ROI
Connectivity strength between the prefrontal thalamic ROI and the right superior frontal gyrus, right middle frontal gyrus, right superior frontal gyrus, was greater in children with ADHD and related to better spatial span working memory performance. Connectivity strength between the prefrontal thalamic ROI and the right precentral gyrus was greater in TDC and related to worse spatial span working memory performance. The relationship between adjusted spatial span backward total scores and connection strength between the right middle frontal gyrus (38, 41, 24) and prefrontal thalamic ROI was plotted to reveal the nature of the relationship in a post hoc analysis (Figure 4).
Premotor–motor thalamic ROI
Connectivity strength between the premotor–motor thalamic ROI and the left lingual gyrus, right lingual gyrus, left inferior occipital gyrus, and right inferior occipital gyrus was greater in TDC and related to better spatial span working memory performance. Connectivity strength between the premotor–motor thalamic ROI and the left inferior frontal gyrus and left superior temporal gyrus is greater in children with ADHD and related to worse spatial span working memory performance.
Somatosensory thalamic ROI
Connectivity strength between the somatosensory thalamic ROI and the fusiform gyrus and left lingual gyrus was greater in TDC and related to better spatial span working memory performance.
Temporal thalamic ROI
Connectivity strength between the temporal thalamic ROI and the left middle temporal gyrus and right middle temporal gyrus was greater in children with ADHD and related to worse spatial span working memory performance.
Discussion
Children with ADHD show disruptions in brain circuits related to cognitive impairments associated with the disorder. ADHD is widely theorized to involve disruptions in cortico-striatal–thalamic neural circuits, but until now neuroimaging investigations have been largely restricted to examining the cortex and striatum in ADHD, leaving a crucial gap with regard to evidence of thalamic involvement. The present study reveals that thalamic connections to these regions are involved in ADHD and in its associated executive cognitive problems. Our findings suggest that on average, relative to the control population, there are altered thalamo-striatal and thalamo-cortical interactions in children with ADHD. These findings appear to relate to at least one behavioral component of ADHD – the ability to manipulate information in mind, which is atypical in ADHD (although probably only in a portion of the population (Nigg, 2005) as we discuss below).
Accounting for Heterogeneity within ADHD
The heterogeneity of cognitive and behavioral impairments present in ADHD presents a challenge for neuroimaging studies attempting to characterize atypical brain pathways associated with the disorder. By examining a dimensional neuropsychological aspect of the disorder in conjunction with a comparison analysis in a large sample of participants with and without ADHD, we are able to identify atypical cortico-striatal–thalamic pathways related to spatial working memory. However, it is important to consider that these probably are present or clinically meaningful in only a subset of children with the disorder. Future work differentiating individual variability in behavioral components of ADHD and how they are associated with underlying disruptions in brain circuitry might facilitate improved empirical and biologically based subtyping within the disorder. In this sense, while our focus here was on working memory deficits, future efforts would be needed to identify atypical brain circuits involved in other aspects of behavioral regulation thought to be disrupted in ADHD (e.g., reward processing, thought to involve pathways between the ventral striatum and prefrontal cortex; Nigg and Casey, 2005; Sonuga-Barke, 2005). Multiple ADHD related features identified in this way could then be used to sub-classify individuals based on their own unique brain–behavior relationships.
Atypical Connections between the Basal Ganglia and Anterior Thalamus in ADHD Are Related to Spatial Working Memory
Using functionally defined thalamic ROIs, we were able to examine functional connections between distinct areas of the thalamus and the basal ganglia. Given the distinct anatomical connectivity patterns of individual thalamic nuclei (Jones, 2007), this approach provided some specificity to our findings. Connectivity between the putamen and our prefrontal thalamic ROI, which encompasses the anterior portion of the thalamus, relate to spatial span working memory in TDC and in children with ADHD. Stronger thalamic–putamen connectivity correlated with lower spatial span backward total scores. In a separate comparative analysis, we found that these same connections between the prefrontal thalamic ROI and putamen were atypical in children with ADHD-C. Children with ADHD-C displayed stronger connectivity between our prefrontal thalamic ROI and putamen than in a matched control group (Figure A1 in Appendix), suggesting that these connections may be of unique importance in the cortico-striatal–thalamic circuitry underlying working memory and the ADHD clinical phenotype. This work fits nicely with previous models of ADHD (see below) and also with findings highlighting the role of the anterior thalamic nuclei in spatial working memory (Aggleton et al., 1996; Jones, 2007). In addition, the specificity of our findings coincides with known anatomical striatal-thalamo links (Parent and Hazrati, 1995; Jones, 2007).
Other thalamic ROIs generated in this study, specifically the premotor–motor thalamic ROI, somatosensory thalamic ROI, and temporal thalamic ROI, similarly show greater connectivity strength with areas of the basal ganglia in children with ADHD-C relative to TDC, but to a lesser extent. The strength of these same thalamo-striatal connections are related to lower spatial span backward total scores. While the connections between these three thalamic ROIs and the basal ganglia are not as a robust as with the prefrontal thalamic ROI, they appear in similar areas of the putamen. Portions of the left putamen show atypical connections with multiple thalamic ROIs (Figure 3C), suggesting that functional associations between the thalamus and putamen may underlie some of the behavioral impairments in children with ADHD.
These Findings Support Cortico-Striatal–Thalamic Pathway Models of ADHD
Cortico-thalamic circuits, in particular fronto-striatal and fronto-cerebellar circuits mediated by the thalamus, have been suggested as being impaired in children with ADHD (Castellanos, 1997; Giedd et al., 2001; Nigg and Casey, 2005; Casey et al., 2007). Traditional fMRI studies have repeatedly shown frontal and striatal areas as having atypical brain activity in children with ADHD; however, functional connections between these structures have received less attention (Dickstein et al., 2006; Liston et al., 2011).
The present study highlights the role of thalamic functional connections with the putamen, and, to a lesser extent, the caudate and globus pallidus. While structural brain imaging studies have reported inconsistent findings on putamen volume in individuals with ADHD (Casey et al., 1997; Castellanos et al., 2002; Ellison-Wright et al., 2008; Qiu et al., 2009), functional neuroimaging studies have found differences in putamen blood volume (Teicher et al., 2000), activation (Konrad et al., 2006) and functional connectivity in youth with ADHD (Cao et al., 2009). The caudate nucleus and lateral globus pallidus have held a substantial role in brain investigations of ADHD showing altered structure, function, and connectivity in individuals with the disorder (Castellanos et al., 1994, 2002; Durston et al., 2003; Booth et al., 2005; Silk et al., 2009). Our results suggest that interactions between these regions are similarly atypical in the present sample.
It is likely that a balanced relationship between these structures facilitates effective behavioral modulation to environmental contexts. Indeed, the maturation of cognitive control and voluntary planning of behavior that is seen across child and adolescent development has been proposed to reflect the underlying maturation of fronto-striatal–thalamic loops (Nigg and Casey, 2005). The thalamus plays an important role as a mediating structure in cortico-striatal circuits, as well as a potential integration site for networks that support the ability to modulate behavior (Haber and Calzavara, 2009). Alterations in functional connectivity between the thalamus and basal ganglia may reflect irregular signaling between these structures that may, in turn, alter afferent signaling from the thalamus to the cortex. The results of this study support models of ADHD in which atypical cortico-striatal–thalamic pathways underlie the breakdowns in cognitive control and behavioral adjustment observed in children with ADHD (Nigg and Casey, 2005).
Atypical Connections between the Thalamus and Cortical Regions in ADHD Are Related to Spatial Working Memory
It is important to note that the results of this study were not limited to thalamo-striatal connections. Four of our five thalamic ROIs displayed connectivity differences between groups across areas of the cortex that also related to spatial span working memory. Connections between our prefrontal thalamic ROI, which encompasses the anterior dorsal midline areas of the thalamus, and the superior frontal and middle frontal gyri, were significantly different between groups and related to spatial span working memory. Given the role of the dorsolateral prefrontal cortex in adaptive online task control (Dosenbach et al., 2006, 2007), disruptions in subcortical connections to this region of the cortex may contribute to performance deficits in task-level control. Such a finding would suggest that this particular atypical behavior related to this circuit would expand beyond working memory, and relate to many tasks. Further exploration of connectivity differences between the striatum and cortical networks involved in task control may prove illuminative of connections that are atypical in these cortico-striatal–thalamic circuits.
Conclusion
As brain imaging research continues to uncover objective biological markers of psychiatric disorders, such as ADHD, the hope is for these techniques to assist in the diagnosis, sub-classification, and therapy development for affected individuals. The large, multi-site dataset leveraged for our secondary analysis (http://fcon_1000.projects.nitrc.org/indi/adhd200/) in this study demonstrates the utility of rs-fcMRI in detecting atypical brain patterns in children diagnosed with ADHD. Moreover, we were able to relate these atypical brain patterns to a specific neuropsychological dimension of the disorder. It would be of further interest to investigate the effects of different treatment modalities (e.g., cognitive training, stimulant medication) on connectivity strength between regions identified in this study. Together with structural brain imaging methods, examinations of the brain’s functional architecture may provide a viable clinical purpose in detecting, classifying, and treating developmental neuropsychiatric disorders.
Conflict of Interest Statement
The authors declare that the research was conducted in the absence of any commercial or financial relationships that could be construed as a potential conflict of interest.
Acknowledgments
We would like to extend special thanks to the ADHD-200 Consortium (http://fcon_1000.projects.nitrc.org/indi/adhd200/) for their generosity in contributing data to this open source forum: Daniel P. Dickstein, Pediatric Mood, Imaging, and Neurodevelopment Program, Brown University; Stewart K. Mostofsky, Kennedy Krieger Institute, Johns Hopkins University; Jan K. Buitelaar, Radboud University Nijmegen Medical Centre, Nijmegen, The Netherlands; F. Xavier Castellanos and Michael P. Milham, Phyllis Green, and Randolph Cowen Institute for Pediatric Neuroscience at the Child Study Center, New York University Langone Medical Center, New York, New York, Nathan Kline Institute for Psychiatric Research, Orangeburg, NY, USA; Yu-feng Wang, Institute of Mental Health, Peking University; Yu-feng Zang, National Key Laboratory of Cognitive Neuroscience and Learning, Beijing University; Beatriz Luna, Laboratory of Neurocognitive Development, University of Pittsburgh; and Bradley L. Schlaggar and Steve Petersen, Washington University School of Medicine, St. Louis Children’s Hospital. We also thank all of the families and children who participated in the study. Research was supported by the Oregon Clinical and Translational Research Institute (Fair), Medical Research Foundation (Fair), UNCF Merck (Fair), Ford Foundation (Fair), K99/R00 MH091238 (Fair), R01 MH086654 (Nigg), R01 MH59105 (Nigg), and OHSU Foundation (Nigg).
References
Aggleton, J. P., Hunt, P. R., Nagle, S., and Neave, N. (1996). The effects of selective lesions within the anterior thalamic nuclei on spatial memory in the rat. Behav. Brain Res. 81, 189–198.
Baddeley, A. (1996). The fractionation of working memory. Proc. Natl. Acad. Sci. U.S.A. 93, 13468–13472.
Behrens, T. E., Johansen-Berg, H., Woolrich, M. W., Smith, S. M., Wheeler-Kingshott, C. A., Boulby, P. A., Barker, G. J., Sillery, E. L., Sheehan, K., Ciccarelli, O., Thompson, A. J., Brady, J. M., and Matthews, P. M. (2003). Non-invasive mapping of connections between human thalamus and cortex using diffusion imaging. Nat. Neurosci. 6, 750–757.
Bi, G., and Poo, M. (1999). Distributed synaptic modification in neural networks induced by patterned stimulation. Nature 401, 792–796.
Biswal, B., Yetkin, F. Z., Haughton, V. M., and Hyde, J. S. (1995). Functional connectivity in the motor cortex of resting human brain using echo-planar MRI. Magn. Reson. Med. 34, 537–541.
Booth, J. R., Burman, D. D., Meyer, J. R., Lei, Z., Trommer, B. L., Davenport, N. D., Li, W., Parrish, T. B., Gitelman, D. R., and Mesulam, M. M. (2005). Larger deficits in brain networks for response inhibition than for visual selective attention in attention deficit hyperactivity disorder (ADHD). J. Child Psychol. Psychiatry 46, 94–111.
Brown, A. B., Biederman, J., Valera, E., Makris, N., Doyle, A., Whitfield-Gabrieli, S., Mick, E., Spencer, T., Faraone, S., and Seidman, L. (2011). Relationship of DAT1 and adult ADHD to task-positive and task-negative working memory networks. Psychiatry Res. 193, 7–16.
Cao, X., Cao, Q., Long, X., Sun, L., Sui, M., Zhu, C., Zuo, X., Zang, Y., and Wang, Y. (2009). Abnormal resting-state functional connectivity patterns of the putamen in medication-naïve children with attention deficit hyperactivity disorder. Brain Res. 1303, 195–206.
Casey, B. J., Castellanos, F. X., Giedd, J. N., Marsh, W. L., Hamburger, S. D., Schubert, A. B., Vauss, Y. C., Vaituzis, A. C., Dickstein, D. P., Sarfatti, S. E., and Rapoport, J. L. (1997). Implication of right frontostriatal circuitry in response inhibition and attention-deficit/hyperactivity disorder. J. Am. Acad. Child Adolesc. Psychiatry 36, 374–383.
Casey, B. J., Nigg, J. T., and Durston, S. (2007). New potential leads in the biology and treatment of attention deficit-hyperactivity disorder. Curr. Opin. Neurol. 20, 119–124.
Castellanos, F. X. (1997). Toward a pathophysiology of attention-deficit/hyperactivity disorder. Clin. Pediatr. (Phila). 36, 381–393.
Castellanos, F. X., Giedd, J. N., Eckburg, P., Marsh, W. L., Vaituzis, A. C., Kaysen, D., Hamburger, S. D., and Rapoport, J. L. (1994). Quantitative morphology of the caudate nucleus in attention deficit hyperactivity disorder. Am. J. Psychiatry 151, 1791–1796.
Castellanos, F. X., Lee, P. P., Sharp, W., Jeffries, N. O., Greenstein, D. K., Clasen, L. S., Blumenthal, J. D., James, R. S., Ebens, C. L., Walter, J. M., Zijdenbos, A., Evans, A. C., Giedd, J. N., and Rapoport, J. L. (2002). Developmental trajectories of brain volume abnormalities in children and adolescents with attention-deficit/hyperactivity disorder. JAMA 288, 1740–1748
Castellanos, F. X., Margulies, D. S., Kelly, C., Uddin, L. Q., Ghaffari, M., Kirsch, A., Shaw, D., Shehzad, Z., Di Martino, A., Biswal, B., Sonuga-Barke, E. J., Rotrosen, J., Adler, L. A., and Milham, M. P. (2008). Cingulate-precuneus interactions: a new locus of dysfunction in adult attention-deficit/hyperactivity disorder. Biol. Psychiatry 63, 332–337.
Castellanos, F. X., and Tannock, R. (2002). Neuroscience of attention-deficit/hyperactivity disorder: the search for endophenotypes. Nat. Rev. Neurosci. 3, 617–628.
CeNeS. (1998). Cambridge Neuropsychological Test Automated Battery (Version 2.35). Cambridge: CeNeS Cognition.
Dickstein, S. G., Bannon, K., Castellanos, F. X., and Milham, M. P. (2006). The neural correlates of attention deficit hyperactivity disorder: an ALE meta-analysis. J. Child Psychol. Psychiatry 47, 1051–1062.
Dosenbach, N. U., Fair, D. A., Miezin, F. M., Cohen, A. L., Wenger, K. K., Dosenbach, R. A. T., Fox, M. D., Snyder, A. Z., Vincent, J. L., Raichle, M. E., Schlaggar, B. L., and Petersen, S. E. (2007). Distinct brain networks for adaptive and stable task control in humans. Proc. Natl. Acad. Sci. U.S.A. 104, 11073–11078.
Dosenbach, N. U., Visscher, K. M., Palmer, E. D., Miezin, F. M., Wenger, K. K., Kang, H. C., Burgund, E. D., Grimes, A. L., Schlaggar, B. L., and Petersen, S. E. (2006). A core system for the implementation of task sets. Neuron 50, 799–812.
Doyle, A. E., Faraone, S. V., Seidman, L. J., Willcutt, E. G., Nigg, J. T., Waldman, I. D., Pennington, B. F., Peart, J., and Biederman, J. (2005). Are endophenotypes based on measures of executive functions useful for molecular genetic studies of ADHD? J. Child Psychol. Psychiatry 46, 774–803.
Durston, S., Tottenham, N. T., Thomas, K. M., Davidson, M. C., Eigsti, I. M., Yang, Y., Ulug, A. M., and Casey, B. J. (2003). Differential patterns of striatal activation in young children with and without ADHD. Biol. Psychiatry 53, 871–878.
Ellison-Wright, I., Ellison-Wright, Z., and Bullmore, E. (2008). Structural brain change in attention deficit hyperactivity disorder identified by metaanalysis. BMC Psychiatry 8, 51. doi: 10.1186/1471-244X-8-51
Fair, D. A., Bathula, D., Mills, K. L., Dias, T. G., Blythe, M. S., Zhang, D., Snyder, A. Z., Raichle, M. E., Stevens, A. A., Nigg, J. T., and Nagel, B. J. (2010a). Maturing thalamocortical functional connectivity across development. Front. Syst. Neurosci. 4:10. doi: 10.3389/fnsys.2010.00010
Fair, D. A., Posner, J., Nagel, B. J., Bathula, D., Dias, T. G., Mills, K. L., Blythe, M. S., Giwa, A., Schmitt, C. F., and Nigg, J. T. (2010b). Atypical default network connectivity in youth with attention-deficit/hyperactivity disorder. Biol. Psychiatry 68, 1084–1091.
Fair, D. A., Cohen, A. L., Dosenbach, N. U., Church, J. A., Miezin, F. M., Barch, D. M., Raichle, M. E., Petersen, S. E., and Schlaggar, B. L. (2008). The maturing architecture of the brain’s default network. Proc. Natl. Acad. Sci. U.S.A. 105, 4028–4032.
Fair, D. A., Cohen, A. L., Power, J. D., Dosenbach, N. U., Church, J. A., Miezin, F. M., Schlaggar, B. L., and Petersen, S. E. (2009). Functional brain networks develop from a “local to distributed” organization. PLoS Comput. Biol. 5, e1000381. doi: 10.1371/journal.pcbi.1000381
Fair, D. A., Dosenbach, N. U., Church, J. A., Cohen, A. L., Brahmbhatt, S., Miezin, F. M., Barch, D. M., Raichle, M. E., Petersen, S. E., and Schlaggar, B. L. (2007a). Development of distinct control networks through segregation and integration. Proc. Natl. Acad. Sci. U.S.A. 104, 13507–13512.
Fair, D. A., Schlaggar, B. L., Cohen, A. L., Miezin, F. M., Dosenbach, N. U., Wenger, K. K., Fox, M. D., Snyder, A. Z., Raichle, M. E., and Petersen, S. E. (2007b). A method for using blocked and event-related fMRI data to study “resting state” functional connectivity. Neuroimage 35, 396–405.
Finke, K., Schwarzkopf, W., Müller, U., Frodl, T., Müller, H. J., Schneider, W. X., Engel, R. R., Riedel, M., Möller, H. J., and Hennig-Fast, K. (2011). Disentangling the adult attention-deficit hyperactivity disorder endophenotype: parametric measurement of attention. J. Abnorm. Psychol. 120, 890–901.
Forman, S. D., Cohen, J. D., Fitzgerald, M., Eddy, W. F., Mintun, M. A., and Noll, D. C. (1995). Improved assessment of significant activation in functional magnetic resonance imaging (fMRI): use of a cluster-size threshold. Magn. Reson. Med. 33, 636–647.
Fox, M. D., and Raichle, M. E. (2007). Spontaneous fluctuations in brain activity observed with functional magnetic resonance imaging. Nat. Rev. Neurosci. 8, 700–711.
Fox, M. D., Snyder, A. Z., Vincent, J. L., Corbetta, M., Van Essen, D. C., and Raichle, M. E. (2005). The human brain is intrinsically organized into dynamic, anticorrelated functional networks. Proc. Natl. Acad. Sci. U.S.A. 102, 9673–9678.
Gau, S. S., and Shang, C. Y. (2010). Executive functions as endophenotypes in ADHD: evidence from the Cambridge Neuropsychological Test Battery (CANTAB). J. Child Psychol. Psychiatry 51, 838–849.
Giedd, J. N., Blumenthal, J., Molloy, E., and Castellanos, F. X. (2001). Brain imaging of attention deficit/hyperactivity disorder. Ann. N. Y. Acad. Sci. 931, 33–49.
Haber, S. N., and Calzavara, R. (2009). The cortico-basal ganglia integrative network: the role of the thalamus. Brain Res. Bull. 78, 69–74.
Insel, T., Cuthbert, B., Garvey, M., Heinssen, R., Pine, D. S., Quinn, K., Sanislow, C., and Wang, P. (2010). Research domain criteria (RDoC): toward a new classification framework for research on mental disorders. Am. J. Psychiatry 167, 748–751.
Ivanov, I., Bansal, R., Hao, X., Zhu, H., Kellendonk, C., Miller, L., Sanchez-Pena, J., Miller, A. M., Chakravarty, M. M., Klahr, K., Durkin, K., Greenhill, L. L., and Peterson, B. S. (2010). Morphological abnormalities of the thalamus in youths with attention deficit hyperactivity disorder. Am. J. Psychiatry 167, 397–408.
Konrad, K., Neufang, S., Hanisch, C., Fink, G. R., and Herpertz-Dahlmann, B. (2006). Dysfunctional attentional networks in children with attention deficit/hyperactivity disorder: evidence from an event-related functional magnetic resonance imaging study. Biol. Psychiatry 59, 643–651.
Lancaster, J. L., Rainey, L. H., Summerlin, J. L., Freitas, C. S., Fox, P. T., Evans, A. C., Toga, A. W., and Mazziotta, J. C. (1997). Automated labeling of the human brain: a preliminary report on the development and evaluation of a forward-transform method. Hum. Brain Mapp. 5, 238–242.
Lancaster, J. L., Woldorff, M. G., Parsons, L. M., Liotti, M., Freitas, C. S., Rainey, L., Kochunov, P. V., Nickerson, D., Mikiten, S. A., and Fox, P. T. (2000). Automated Talairach Atlas labels for functional brain mapping. Hum. Brain Mapp. 10, 120–131.
Liston, C., Cohen, M. M., Teslovich, T., Levenson, D., and Casey, B. J. (2011). Atypical prefrontal connectivity in attention-deficit/hyperactivity disorder: pathway to disease or pathological end point? Biol. Psychiatry 69, 1168–1177.
Miezin, F. M., Maccotta, L., Ollinger, J. M., Petersen, S. E., and Buckner, R. L. (2000). Characterizing the hemodynamic response: effects of presentation rate, sampling procedure, and the possibility of ordering brain activity based on relative timing. Neuroimage 11, 735–759.
Milner, B. (1971). Interhemispheric differences in the localization of psychological processes in man. Br. Med. Bull. 27, 272–277.
Nigg, J. T. (2005). Neuropsychologic theory and findings in attention-deficit/hyperactivity disorder: the state of the field and salient challenges for the coming decade. Biol. Psychiatry 57, 1424–1435.
Nigg, J. T., and Casey, B. J. (2005). An integrative theory of attention-deficit/hyperactivity disorder based on the cognitive and affective neurosciences. Dev. Psychopathol. 17, 785–806.
Parent, A., and Hazrati, L. N. (1995). Functional anatomy of the basal ganglia I. The cortico-basal ganglia-thalamo-cortical loop. Brain Res. Brain Res. Rev. 20, 91–127.
Power, J. D., Barnes, K. A., Snyder, A. Z., Schlaggar, B. L., and Petersen, S. E. (2012). Spurious but systematic correlations in functional connectivity MRI networks arise from subject motion. Neuroimage 59, 2142–2154.
Rhodes, S. M., Park, J., Seth, S., and Coghill, D. R. (2012). A comprehensive investigation of memory impairment in attention deficit hyperactivity disorder and oppositional defiant disorder. J. Child Psychol. Psychiatry 53, 128–137.
Shannon, B. J., Raichle, M. E., Snyder, A. Z., Fair, D. A., Mills, K. L., Zhang, D., Bache, K., Calhoun, V. D., Nigg, J. T., Nagel, B. J., Stevens, A. A., and Kiehl, K. A. (2011). Premotor functional connectivity predicts impulsivity in juvenile offenders. Proc. Natl. Acad. Sci. U.S.A. 108, 11241–11245.
Silk, T. J., Vance, A., Rinehart, N., Bradshaw, J. L., and Cunnington, R. (2009). Structural development of the basal ganglia in attention deficit hyperactivity disorder: a diffusion tensor imaging study. Psychiatry Res. 172, 220–225.
Smyser, C. D., Inder, T. E., Shimony, J. S., Hill, J. E., Degnan, A. J., Snyder, A. Z., and Neil, J. J. (2010). Longitudinal analysis of neural network development in preterm infants. Cereb. Cortex 20, 2852–2862.
Sonuga-Barke, E. J. (2005). Causal models of attention-deficit/hyperactivity disorder: from common simple deficits to multiple developmental pathways. Biol. Psychiatry 57, 1231–1238.
Talairach, J., and Tournoux, P. (1988). Co-Planar Stereotaxic Atlas of the Human Brain. New York: Thieme Medical Publishers, Inc.
Teicher, M. H., Anderson, C. M., Polcari, A., Glod, C. A., Maas, L. C., and Renshaw, P. F. (2000). Functional deficits in basal ganglia of children with attention-deficit/hyperactivity disorder shown with functional magnetic resonance imaging relaxometry. Nat. Med. 6, 470–473.
Tillman, C., Eninger, L., Forssman, L., and Bohlin, G. (2011). The relation between working memory components and ADHD symptoms from a developmental perspective. Dev. Neuropsychol. 36, 181–198.
Uddin, L. Q., Kelly, A. M., Biswal, B. B., Margulies, D. S., Shehzad, Z., Shaw, D., Ghaffari, M., Rotrosen, J., Adler, L. A., Castellanos, F. X., and Milham, M. P. (2008). Network homogeneity reveals decreased integrity of default-mode network in ADHD. J. Neurosci. Methods 169, 249–254.
Van Dijk, K. R., Sabuncu, M. R., and Buckner, R. L. (2011). The influence of head motion on intrinsic functional connectivity MRI. Neuroimage 59, 431–438.
Van Essen, D. C. (2005). A population-average, landmark- and surface-based (PALS) atlas of human cerebral cortex. Neuroimage 28, 635–662.
Van Essen, D. C., Dickson, J., Harwell, J., Hanlon, D., Anderson, C. H., and Drury, H. A. (2001). An integrated software suite for surface-based analyses of cerebral cortex. J. Am. Med. Inform. Assoc. 41, 1359–1378.
Van Essen, D. C., and Drury, H. A. (1997). Structural and functional analyses of human cerebral cortex using a surface-based atlas. J. Neurosci. 17, 7079–7102.
Wang, L., Zhu, C., He, Y., Zang, Y., Cao, Q., Zhang, H., Zhong, Q., and Wang, Y. (2009). Altered small-world brain functional networks in children with attention-deficit/hyperactivity disorder. Hum. Brain Mapp. 30, 638–649.
Westerberg, H., Hirvikoski, T., Forssberg, H., and Klingberg, T. (2004). Visuo-spatial working memory span: a sensitive measure of cognitive deficits in children with ADHD. Child Neuropsychol. 10, 155–161.
Willcutt, E. G., Doyle, A. E., Nigg, J. T., Faraone, S. V., and Pennington, B. F. (2005). Validity of the executive function theory of attention-deficit/hyperactivity disorder: a meta-analytic review. Biol. Psychiatry 57, 1336–1346.
Zang, Y. F., He, Y., Zhu, C. Z., Cao, Q. J., Sui, M. Q., Liang, M., Tian, L. X., Jiang, T. Z., and Wang, Y. F. (2007). Altered baseline brain activity in children with ADHD revealed by resting-state functional MRI. Brain Dev. 29, 83–91.
Zhang, D., Snyder, A. Z., Fox, M. D., Sansbury, M. W., Shimony, J. S., and Raichle, M. E. (2008). Intrinsic functional relations between human cerebral cortex and thalamus. J. Neurophysiol. 100, 1740–1748.
Zhang, D., Snyder, A. Z., Shimony, J. S., Fox, M. D., and Raichle, M. E. (2009). Noninvasive functional and structural connectivity mapping of the human thalamocortical system. Cereb. Cortex 20, 1187–1194.
Appendix
Participants and Measures
Data from Oregon Health and Science University, Brown University, Beijing Normal University, Kennedy Krieger Institute, and NYU Child Study Center were collected for children aged 7–11 years. Together, the total dataset comprised of 132 typically developing children (TDC) and 94 participants with ADHD. This larger dataset was then separated into two subsets for two different analyses. The first dataset included 67 children with and without ADHD diagnoses (all subtypes included), all aged 7–11 years, and from Oregon Health and Science University. Children in the first dataset were not matched on age or gender, as this group was involved in a correlational analysis that included all participants. The sample consisted of 43 TDC, 14 ADHD-C, 9 ADHD-inattentive subtype, and 1 ADHD-hyperactive only subtype children. Although this group was not matched for age, there were no significant differences in ages between children with ADHD and TDC (ADHD mean age: 8.70 years, SD: 0.82; TDC mean age: 8.50 years, SD: 0.67; p = 0.23). IQ was significantly different between children with ADHD and TDC (ADHD mean IQ: 106.66, SD: 13.54; TDC mean IQ: 118.35, SD: 13.82; p < 0.01). Movement was low across all participants (ADHD mean movement:0.44, SD:0.32; TDC mean movement:0.43, SD:0.35; p = 0.85). The average pairwise functional volume displacement after removing frames was also low and not significant (ADHD mean volume displacement:0.30, SD:0.19; TDC mean volume displacement:0.27, SD:0.22; p = 0.55).
The second dataset included 70 children diagnosed with ADHD-combined type (ADHD-C), and 89 TDC children, all aged 7–11 years, and drawn from Brown University, Beijing Normal University, Kennedy Krieger Institute, and NYU Child Study Center. Children in the second dataset were matched on age, gender, and pairwise functional volume displacement for a comparative analysis (ADHD-C mean age: 9.85 years, SD: 1.28, 20% female; TDC mean age: 9.94 years, SD: 1.23, 26.97% female; p = 0.65), and showed significant differences in IQ (ADHD-C mean IQ: 110.54, SD: 14.03; TDC mean IQ: 115.97, SD: 14.03; p < 0.02). Movement was low across both groups (ADHD-C mean movement:0.47, SD:0.25; TDC mean movement:0.45, SD:0.21; p = 0.64). The average pairwise functional volume displacement after removing frames was also low and not significant (ADHD-C mean volume displacement:0.17, SD:0.06; TDC mean volume displacement:0.46, SD:0.21; p = 0.61).
Informed written consent or assent was obtained for all participants, and procedures complied with the Human Investigation Review Board at respective universities. As data were aggregated from a larger collaborative effort (ADHD-200 dataset, see: http://fcon_1000.projects.nitrc.org/indi/adhd200), assessment protocols varied across institutions. The procedures used for each institution are detailed below.
Data Preprocessing
All functional images were preprocessed in the same manner to reduce artifacts (Miezin et al., 2000). These steps included: (i) removal of a central spike caused by MR signal offset, (ii) correction of odd vs. even slice intensity differences attributable to interleaved acquisition without gaps, (iii) correction for head movement within and across runs, and (iv) within-run intensity normalization to a whole brain mode value of 1,000. Atlas transformation of the functional data was computed for each individual via the MPRAGE scan. The fMRI data then were resampled to 3 mm cubic voxels in Talairach atlas space (Talairach and Tournoux, 1988) as defined by the spatial normalization procedure (Lancaster et al., 1995). This resampling combined movement correction and atlas transformation in one interpolation. All subsequent operations were performed on the atlas-transformed volumetric time series. Participant head motion was measured and corrected using rigid body translation and rotation. Summary statistics were calculated as root mean square (RMS) values for translation and rotation about the x, y, and z-axes. Motion was corrected and quantified using an analysis of head position based on rigid body translation and rotation.
Oregon Health and Science University
Psychiatric diagnoses were based on evaluations with the kiddie schedule for affective disorders and schizophrenia (KSADS-I; Puig-Antich and Ryan, 1986) administered to a parent; parent and teacher Conners’ Rating Scale-3rd Edition (Conners, 2008); and a clinical review by a child psychiatrist and neuropsychologist who had to agree on the diagnosis. Intelligence was evaluated with a three-subtest short form (block design, vocabulary, and information) of the Wechsler Intelligence Scale for Children, 4th Edition (Wechsler, 2003). Children were excluded if they did not meet criteria for ADHD or non-ADHD groups. Children were also excluded if a history of neurological illness, chronic medical problems, sensorimotor handicap, autistic disorder, mental retardation, or significant head trauma (with loss of consciousness) was identified by parent report, or if they had evidence of psychotic disorder or bipolar disorder on the structured parent psychiatric interview. Children prescribed short-acting stimulant medications were scanned after a minimum washout of five half-lives (i.e., 24–48 h depending on the preparation). Typically developing children were excluded for presence of conduct disorder, major depressive disorder, or history of psychotic disorder, as well as for presence of ADHD.
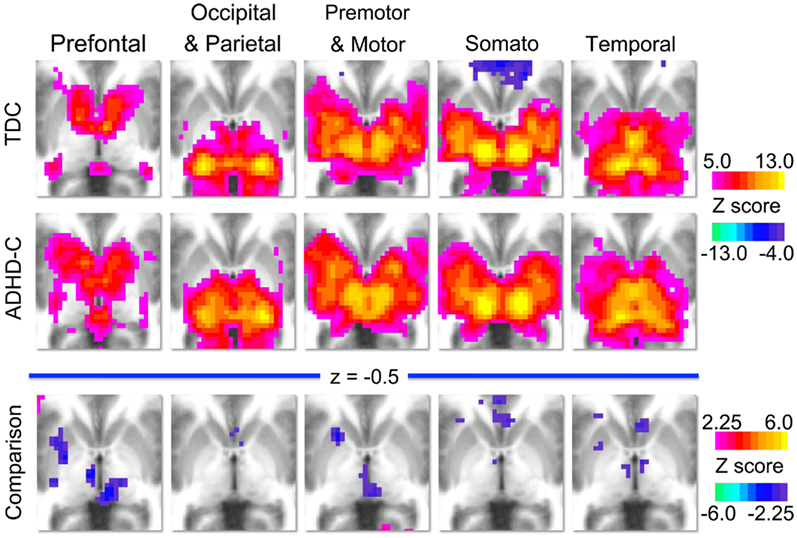
Figure A1. Group level voxelwise maps. This figure displays the voxelwise connectivity maps of each thalamic ROI (prefrontal, occipital–parietal, premotor–motor, somatosensory, and temporal) for the groups analyzed in the comparative analysis. The first row illustrates the group maps for 89 typically developing children (TDC) and the second row illustrates the group maps for 70 children with ADHD-combined subtype (ADHD-C). The third row illustrates the voxelwise maps for the comparison analysis, where warm colors (positive z-scores) indicate areas where connection strength is greater in TDC, and cool colors (negative z-scores) indicate areas where connection strength is greater in the ADHD-C population.
Participants were scanned using a 3.0 Tesla Siemens Magnetom Tim Trio scanner with a 12-channel head coil at the OHSU Advanced Imaging Research Center. One high resolution T1-weighted MPRAGE sequence lasting 9 min and 14 s (TR = 2300 ms, TE = 3.58 ms, orientation = sagittal, 256 × 256 matrix, resolution = 13 mm) was collected. Blood–oxygen level dependent (BOLD)-weighted functional imaging data were collected in an oblique plane (parallel to the ACPC) using T2*-weighted echo-planar imaging (TR = 2500 ms, TE = 30 ms, flip angle = 90°, FOV = 240 mm, 36 slices covering the whole brain, slice thickness = 3.8 mm, in-plane resolution = 3.8 mm × 3.8 mm). Steady state magnetization was assumed after five frames (∼10 s). Three runs of 3.5 min each were obtained. During rest periods, participants were instructed to stay still, and fixate on a standard fixation-cross in the center of the display.
ADHD-Consortium Data
Kennedy Krieger Institute
Psychiatric diagnoses were based on evaluations with the Diagnostic Interview for Children and Adolescents, 4th Edition (DICA-IV; Reich et al., 1997), a structured parent interview based on DSM-IV criteria; the Conners’ Parent Rating Scale-Revised, Long Form (CPRS-R; Epstein et al., 1997), and the DuPaul ADHD Rating Scale IV; DuPaul et al., 1998). Intelligence was evaluated with the Wechsler Intelligence Scale for Children-4th Edition (WISC-IV; Wechsler, 2003) and academic achievement was assessed with the Wechsler Individual Achievement Test-II.
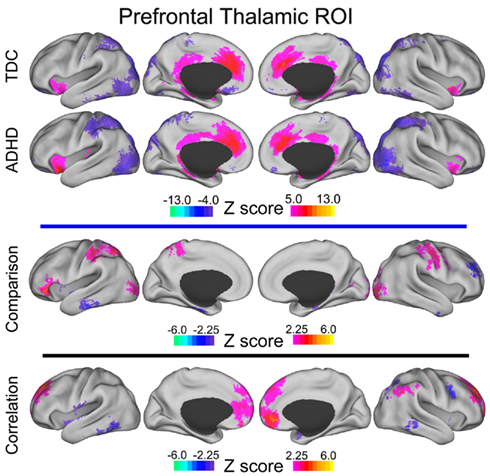
Figure A2. Prefrontal thalamic voxelwise maps projected onto cortical surfaces. Each row displays the cortical surface for each voxelwise map generated from the prefrontal thalamic ROI: group maps for TDC, group maps for ADHD-C, maps from the comparative analysis (TDC vs. ADHD-C), and maps from the correlation analysis. Cortical surface projection was performed with the (PALS)-B12 atlas (Van Essen, 2005) and the software Caret (Van Essen et al., 2001).
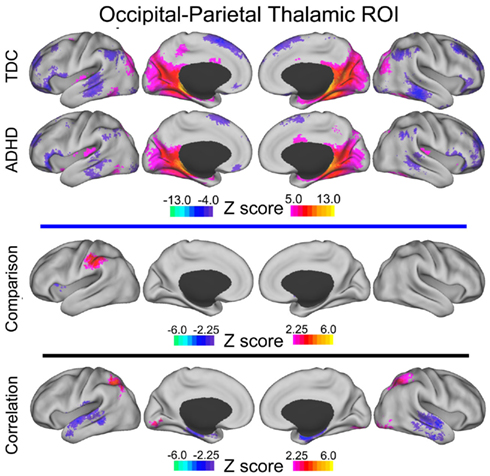
Figure A3. Occipital–parietal thalamic voxelwise maps projected onto cortical surfaces. Each row displays the cortical surface for each voxelwise map generated from the occipital–parietal thalamic ROI: group maps for TDC, group maps for ADHD-C, maps from the comparative analysis (TDC vs. ADHD-C), and maps from the correlation analysis. Cortical surface projection was performed with the (PALS)-B12 atlas (Van Essen, 2005) and the software Caret (Van Essen et al., 2001).
All study participants were between 8.0 and 11.0 years, and had a Full-Scale IQ of 80 or higher. They had no history of language disorder or a Reading Disability (RD) either screened out before a visit or based on school assessment completed within 1 year of participation. RD was based on a statistically significant discrepancy between a child’s FSIQ score and his/her Word Reading subtest score from the Wechsler Individual Achievement Test-IIa, or a standard score below 85 on the Word Reading subtest, regardless of IQ score. Participants with visual or hearing impairment, or history of other neurological or psychiatric disorder were excluded.
Children assigned to the ADHD group met criteria for ADHD on the DICA-IV and either had a T-score of 65 or greater on the CPRS-R Long Form (DSM-IV inattentive) and/or M (DSM-IV hyperactive/impulsive) or met criteria on the DuPaul ADHD Rating Scale IV (six out of nine items scored 2 or 3 from inattention items and/or six out of nine scored 2 or 3 from the hyperactivity/impulsivity items). Children with DSM-IV diagnoses other than oppositional defiant disorder or specific phobias were excluded. DSM-IV criteria and the aforementioned rating scales were also used to evaluate the three ADHD subtypes (inattentive: ADHD-I; hyperactive/impulsive: ADHD-HI; combined: ADHD-C). Children with ADHD were assigned to the ADHD-I group if they met criteria for inattentiveness but not hyperactivity/impulsivity on the DICA-IV, and had a T-score of 65 or greater on the CPRS Scale L, and a T-score of 60 or less on the CPRS Scale, or had a rating of 2 or 3 on six out of nine inattention items on the ADHD Rating Scale IV and a rating of 2 or 3 on four or fewer items on the hyperactivity/impulsivity scale. Children were assigned to the ADHD-HI if they met criteria for hyperactivity/impulsivity but not inattention on the DICA-IV, and a T-score of 65 or greater on the CPRS Scale M and a T-score of 60 or less on the CPRS Scale L, or had a rating of 2 or 3 on six out of nine hyperactivity/impulsivity items on the ADHD Rating Scale IV and a rating of 2 or 3 on four or fewer items on the inattention scale. All other children who met criteria for ADHD were assigned to the ADHD-C (combined subtype) group. Children with ADHD taking psychoactive medications other than stimulants were excluded. Children who were taking stimulant medication were removed from these medications the day before and the day of testing. TDC were required to have T-scores of 60 or below on the DSM-IV inattention (L) and DSM-IV hyperactivity (M) subscales of CPRS-R and no history of behavioral, emotional, or serious medical problems. Additionally, TDC were not included if there was a history of school-based intervention services as established by parent interview, or if they met DSM-IV psychiatric disorder except specific phobia as reported on the DICA-IV.
Participants were scanned using a 3.0 Tesla Philips scanner with an eight-channel head coil. One high resolution T1-weighted MPRAGE sequence (TR = 7.99 ms, TE = 3.76 ms, flip angle = 8°) was collected. Blood–oxygen level dependent (BOLD)-weighted functional imaging data were collected using T2*-weighted echo-planar imaging (TR = 2500 ms, TE = 30 ms, flip angle = 75°, 2D-SENSE EPI). The run lasted either 5 min 20 s or 6 min 30 s. During rest participants were instructed to relax, stay as still as possible, keep eyes open, and fixate on a center cross.
New York University
Psychiatric diagnoses were based on evaluations with the Schedule of Affective Disorders and Schizophrenia for Children – Present and Lifetime Version (KSADS-PL) administered to parents and children and the Conners’ Parent Rating Scale-Revised, Long version (CPRS-LV; Epstein et al., 1997). Intelligence was evaluated with the Wechsler Abbreviated Scale of Intelligence (WASI; Wechsler, 1999). Inclusion in the ADHD group required a diagnosis of ADHD based on parent and child responses to the KSADS-PL as well as on a T-score greater than or equal to 60 on at least one ADHD related index of the CPRS-R: LV. Psychostimulant drugs were withheld at least 24 h before scanning. Inclusion criteria for TDC required absence of any Axis-I psychiatric diagnoses per parent and child KSADS-PL interview, as well as T-scores below 60 for all the CPRS-R: LV ADHD summary scales. Estimates of FSIQ above 80, right-handedness and absence of other chronic medical conditions were required for all children.
Participants were scanned using a Siemens Allegra 3.0 Tesla scanner at the NYU Center for Brain Imaging. For each participant a T1-weighted MPRAGE sequence was acquired using a magnetization prepared gradient echo sequence (TR = 2530 ms; TE = 3.25 ms; TI = 1100 ms; flip angle = 7°; 128 slices; FOV = 256 mm; acquisition voxel size = 1.31 mm × 1.3 mm). A 6-min resting scan comprising 180 contiguous whole brain functional volumes was also acquired for each participant using a multi-echo echo-planar imaging sequence (TR = 2000 ms; flip angle = 90°; 33 slices; voxel size = 3 mm × 3 mm × 4 mm; effective TE = 30 ms, FOV = 240 mm × 192 mm). During rest periods participants were instructed to lie still and relax with their eyes open, while a standard fixation-cross was presented in the center of the display.
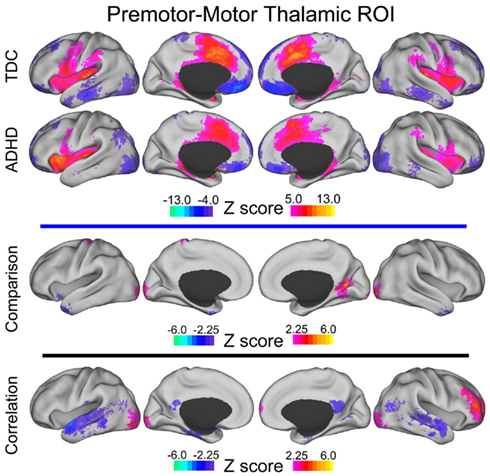
Figure A4. Premotor–motor thalamic voxelwise maps projected onto cortical surfaces. Each row displays the cortical surface for each voxelwise map generated from the premotor–motor thalamic ROI: group maps for TDC, group maps for ADHD-C, maps from the comparative analysis (TDC vs. ADHD-C), and maps from the correlation analysis. Cortical surface projection was performed with the (PALS)-B12 atlas (Van Essen, 2005) and the software Caret (Van Essen et al., 2001).
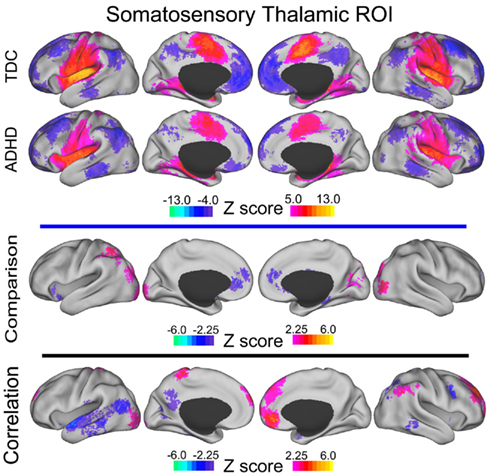
Figure A5. Somatosensory thalamic voxelwise maps projected onto cortical surfaces. Each row displays the cortical surface for each voxelwise map generated from the somatosensory thalamic ROI: group maps for TDC, group maps for ADHD-C, maps from the comparative analysis (TDC vs. ADHD-C), and maps from the correlation analysis. Cortical surface projection was performed with the (PALS)-B12 atlas (Van Essen, 2005) and the software Caret (Van Essen et al., 2001).
Beijing Normal University
Study participants with the diagnosis of ADHD were initially identified using the Computerized Diagnostic Interview Schedule IV (C-DIS-IV). Upon referral for participation to the study participation, all participants (ADHD and TDC) were evaluated with the Schedule of Affective Disorders and Schizophrenia for Children – Present and Lifetime Version (KSADS-PL) with one parent for the establishment of the diagnosis for study inclusion. Additional inclusion included: (i) right-handedness, (ii) no history of neurological disease and no diagnosis of either schizophrenia, affective disorder, or pervasive development disorder and (iii) full-scale Wechsler Intelligence Scale for Chinese Children-Revised (WISCC-R) score of greater than 80. Psychostimulant medications were withheld at least 48 h prior to scanning. All research was approved by the Research Ethics Review Board of Institute of Mental Health, Peking University. Informed consent was also obtained from the parent of each subject and all of the children agreed to participate in the study.
Dataset #1
Images were acquired using a Siemens Trio 3.0 Tesla scanner (Siemens, Erlangen, Germany) in National Key Laboratory of Cognitive Neuroscience and Learning, Beijing Normal University. For each participant, a high resolution T1-weighted anatomical image was acquired (128 sagittal slices, slice thickness/gap = 1.33/0 mm, in-plane resolution = 256 × 192, TR = 2530 ms, TE = 3.39 ms, inversion time (TI) = 1100 ms, flip angle = 7°, FOV = 256 mm × 256 mm). A resting-state scan was obtained for each participant (33 axial slices, TR = 2000 ms, TE = 30 ms, flip angle = 90°, thickness/gap = 3.5/0.7 mm, FOV = 200 mm × 200 mm, matrix = 64 × 64, 240 volumes), as well as diffusion tensor imaging.
Dataset #2
Images were acquired using a Siemens Trio 3.0 Tesla scanner (Siemens, Erlangen, Germany) in National Key Laboratory of Cognitive Neuroscience and Learning, Beijing Normal University. All of the resting-state functional data were acquired using an echo-planar imaging (EPI) sequence with the following parameters: 33 axial slices, TR = 2000 ms, TE = 30 ms, flip angle = 90°, slice thickness/skip = 3.0/0.6 mm, FOV = 200 mm × 20 mm, in-plane resolution = 64 × 64, 240 volumes. For each patient, T1-weighted structural images were acquired using a spoiled gradient-recalled sequence covering the whole brain and used for the purpose of image registration (see Data Preprocessing). Here are the parameters of T1-weighted structural images: 176 sagittal slices, TR = 2530 ms, TE = 3.45 ms, flip angle = 7°, slice thickness/skip = 1.0/0 mm, FOV = 256 mm × 256 mm, in-plane resolution = 256 × 256.
Children with ADHD were scanned twice, in a double-blinded, randomized, counterbalanced way. The two scans were at least 2 days apart, and each scan was taken 1 h after either 10 mg MPH administration or placebo (Vitamin B6, 10 mg). All the patients had not received stimulant treatment for at least 2 days before the first scan, and were asked not to take any stimulant between two scans. The control boys were scanned once without MPH or placebo taken for ethical reasons. Only placebo scans were used for the present study.
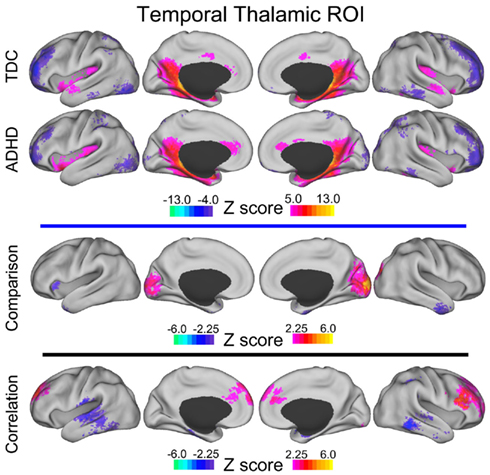
Figure A6. Temporal thalamic voxelwise maps projected onto cortical surfaces. Each row displays the cortical surface for each voxelwise map generated from the temporal thalamic ROI: group maps for TDC, group maps for ADHD-C, maps from the comparative analysis (TDC vs. ADHD-C), and maps from the correlation analysis. Cortical surface projection was performed with the (PALS)-B12 atlas (Van Essen, 2005) and the software Caret (Van Essen et al., 2001).
Dataset #3
Images were acquired using a Siemens Trio 3.0 Tesla scanner (Siemens, Erlangen, Germany) in the Institute of Biophysics, Chinese Academy of Sciences. Rest scans were acquired using an echo-planar imaging (EPI) sequence with the following parameters: 30 axial slices, TR = 2000 ms, TE = 30 ms, flip angle = 90°, thickness/skip = 4.5/0 mm, FOV = 220 mm × 220 mm, matrix = 64 × 64, 240 volumes. Participants were asked simply to remain still, close their eyes, think of nothing systematically and not fall asleep. Additionally, for each participant, a high resolution T1-weighted anatomical image using a spoiled gradient-recalled sequence covering the whole brain was acquired. The data were collected in a period of about 2 years and some modifications were made in the sequence of the structural images. Most of the participants were scanned with one of the following two kinds of parameters: (1) 192 slices, TR = 2000 ms, TE = 3.67 ms, inversion time = 1100 ms, flip angle = 12°, FOV = 240 mm × 240 mm, matrix = 256 × 256, used in 8 patients and 12 controls; (2) 176 slices, TR = 1770 ms, TE = 3.92 ms, inversion time = 1100 ms, flip angle = 12°, FOV = 256 mm × 256 mm, matrix = 512 × 512, used in 9 patients and 11 controls. Other scanning sessions, which have no relation to the present study, are not described here.
Brown University and Bradley Hospital
Psychiatric diagnoses were based on evaluation by the same board-certified child/adolescent psychiatrist (DPD) for all participants, using the Child Schedule for Affective Disorders Present and Lifetime version (KSADS-PL) administered to parents and children separately (Puig-Antich and Ryan, 1986). All participants completed the Wechsler Abbreviated Scale of Intelligence (WASI) as an overall measure of cognitive ability (Wechsler, 1999). Children in the ADHD group had to meet Diagnostic and Statistical Manual 4th Edition Text Revision (DSM-IV-TR) criteria for ADHD, as determined by parent and child answers to the KSADS-PL and were required to have ongoing psychiatric treatment. Exclusion criteria were comorbid mood or anxiety disorders, autistic or Asperger’s disorder, medical illness that was unstable or could cause psychiatric symptoms, or substance abuse within <2 months of participation. All ADHD participants taking psychostimulant medications (i.e., derivatives of methylphenidate or dextroamphetamine) were scanned when medication-free for five drug half-lives. TDC inclusion criteria were a negative history of psychiatric illness in the participant and their first-degree relatives. Exclusion criteria were pregnancy, ongoing medical, or neurological illness or past/present psychiatric or substance disorder. All participants had an IQ greater than 70.
Scans were acquired on a Siemens Tim Trio 3.0 Tesla scanner with a 12-channel head coil. A high resolution T1-weighted MPRAGE anatomical image was acquired for normalization and localization (TR = 2250 ms, TE = 2.98 ms, T1 = 900 ms, flip angle = 9°, slices = 160, FOV = 256 mm, voxels = 1 mm × 1 mm × 1 mm). This scan lasted 7 min and 36 s. The resting-state functional connectivity scan contained 256 continuous blood–oxygen level dependent (BOLD) volumes (TR = 2000 ms, TE = 25 ms, flip angle = 90°, slices = 35, FOV = 192 mm, voxels = 3 mm × 3 mm × 3 mm). The scan lasted for 8 min and 36 s. During the scan, participants were instructed to rest with their eyes open while the word “relax” was back-projected via LCD projector.
References
DuPaul, G., Power, T., Anastopoulos, A., and Reid, R. (1998). ADHD Rating Scales-IV: Checklists, Norms and Clinical Interpretation. New York: Guilford Press.
Epstein, J. N., Conners, C. K., Erhardt, D., March, J. S., and Swanson, J. M. (1997). Asymmetrical hemispheric control of visual-spatial attention in adults with attention deficit hyperactivity disorder. Neuropsychology 11, 467–473.
Lancaster, J. L., Glass, T. G., Lankipalli, B. R., Downs, H., Mayberg, H., and Fox, P. T. (1995). A modality-independent approach to spatial normalization of tomographic images of the human brain. Hum. Brain Mapp. 3, 209–223.
Puig-Antich, J., and Ryan, N. (1986). The Schedule for Affective Disorders and Schizophrenia for School-Age Children. Pittsburgh: Western Psychiatric Institute and Clinic.
Reich, W., Welner, Z., and andHerjanic, B. (1997). Diagnostic Interview for Children and Adolescents-IV (DICA-IV). North Tonawanda: Multi-Health Systems, Inc.
Keywords: ADHD, fMRI, connectivity, working memory, thalamus, striatum
Citation: Mills KL, Bathula D, Dias TGC, Iyer SP, Fenesy MC, Musser ED, Stevens CA, Thurlow BL, Carpenter SD, Nagel BJ, Nigg JT and Fair DA (2012) Altered cortico-striatal–thalamic connectivity in relation to spatial working memory capacity in children with ADHD. Front. Psychiatry 3:2. doi: 10.3389/fpsyt.2012.00002
Received: 27 October 2011; Accepted: 08 January 2012;
Published online: 25 January 2012.
Edited by:
Alex Fornito, University of Melbourne, AustraliaReviewed by:
Christopher A. Wall, Mayo Clinic, USARichard Bruce Bolster, University of Winnipeg, Canada
Copyright: © 2012 Mills, Bathula, Dias, Iyer, Fenesy, Musser, Stevens, Thurlow, Carpenter, Nagel, Nigg and Fair. This is an open-access article distributed under the terms of the Creative Commons Attribution Non Commercial License, which permits non-commercial use, distribution, and reproduction in other forums, provided the original authors and source are credited.
*Correspondence: Kathryn L. Mills, Child Psychiatry Branch, National Institute of Mental Health, 10 Center Drive, MSC 1367, Building 10, Room 4C432B, Bethesda, MD 20892, USA. e-mail: millskl@mail.nih.gov; Damien A. Fair, Psychiatry Department, Oregon Health and Science University, 3181 SW Sam Jackson Park Road UHN88, Portland, OR 97239, USA. e-mail: faird@ohsu.edu