 Wenhua Yan
 Weidong Ji
 Chen Su
 Yunhan Yu
 Xiaoman Yu
 Liangliang Chen
- 1Shanghai Key Laboratory of Mental Health and Psychological Crisis Intervention, School of Psychology and Cognitive Science, East China Normal University, Shanghai, China
- 2Affiliate Mental Health Center, East China Normal University, Shanghai, China
- 3Shanghai Changning Mental Health Center, Shanghai, China
- 4The School of Psychology and Cognitive Science, East China Normal University, Shanghai, China
Differences in emotion experience and emotion expression between patients with schizophrenia and the healthy population have long been the focus of research and clinical attention. However, few empirical studies have addressed this topic using art-making as a tool of emotion expression. This study explores the differences in brain mechanism during the process of expressing anger between patients with schizophrenia and healthy participants using pictographic psychological techniques. We used functional near-infrared spectroscopy to fully detect changes in frontal cortex activity among participants in two groups—schizophrenia and healthy—during the process of experiencing and expressing anger. The results showed that there were no differences in the experience of anger between the two groups. In the process of anger expression, the dorsolateral prefrontal cortex, frontal pole, and other regions showed significant negative activation among patients with schizophrenia, which was significantly different from that of the healthy group. There were significant differences between patients with schizophrenia and the healthy group in the drawing features, drawing contents, and the ability to describe the contents of their drawings. Moreover, the effect size of the latter was greater than those of the former two. In terms of emotion expression, the drawing data and brain activation data were significantly correlated in each group; however, the correlation patterns differed between groups.
Introduction
Emotion Experience and Emotion Expression in Schizophrenia
Schizophrenia is a mental illness that impairs mental and social functions. Its pathological characteristics include delusions, hallucinations, disorders of thought, language, and behavior, as well as negative symptoms (American Psychiatric Association, 2013). Negative symptoms include apathy, loss of motivation, and social withdrawal (Van Os and Kapur, 2009). Schizophrenia affects patients’ thoughts, cognition, language, feelings, and behavior (Schultz et al., 2007; Van Os and Kapur, 2009). As emotion plays an important role in social interactions (Kring and Moran, 2008), mood disorders can affect patients’ personal and interpersonal abilities as well as their social functions. Therefore, the problem of mood disorders in patients with schizophrenia has long been the focus of research (Kring and Caponigro, 2010).
Research on mood disorders in schizophrenia has focused primarily on emotion experience, emotion expression, and emotion recognition (Trémeau, 2006), of which this study focuses on the first two. In recent years, a number of meta-analyses have shown that compared to the normal population, patients with schizophrenia have no difficulty in experiencing “in-the-moment” emotions (Kring and Moran, 2008; Kring and Caponigro, 2010; Yan et al., 2012; Ni et al., 2017). However, a meta-analysis revealed that although patients with schizophrenia had no defects in experiencing pleasant emotions, they experienced increased levels of negative emotions (Cohen and Minor, 2010). Other studies have demonstrated that most patients with schizophrenia experience emotions similarly to healthy people, although some subtypes of patients differ in this regard (Strauss and Herbener, 2011; Oorschot et al., 2013).
Many studies have shown that patients with schizophrenia have disorders of emotion expression—a condition known as alexithymia. This causes problems in identifying and describing their emotional state and makes it difficult for individuals to identify, process, and regulate emotions (Kring and Moran, 2008; Ni et al., 2017). Emotion expression usually involves the following aspects: it is expressed through observable external mechanisms such as language, facial expression, posture, or behavior; is associated with internal emotion experiences; and tends to be associated with the social meanings they transmit (Zhu, 2013; Keltner et al., 2019; Olderbak et al., 2021). Research on alexithymia in patients with schizophrenia has focused on the first aspect, as expressed through facial (Berenbaum and Oltmanns, 1992; Aghevli et al., 2003; Gaebel and Wölwer, 2004) and vocal expressions (Levin et al., 1985; Alpert et al., 2002; Trémeau, 2006) in particular.
Expressing Emotion Through Art-Making
Art-making not only allows expression of the inner experience of emotion but also enables individuals to give symbolic meaning to the works they create, thus making the art they generate socially significant. Therefore, art-making can be a useful tool for the study of emotion expression. Surprisingly, although drawing techniques in art-making are inherently self-expressive (King and Kaimal, 2019), and the process of drawing enables the creators to express their own emotions (Guseva, 2018; Reyna-Martinez et al., 2019), few studies have used the drawing task to explore the characteristics of emotion expression in patients with schizophrenia. Previous studies using drawing tasks have mainly used the clock drawing task and tree drawing test to explore cognitive function and motor ability in patients with schizophrenia (Bozikas et al., 2004). Moreover, the house-tree-person test has been used to study depression, anxiety, and other related mental health states in schizophrenia patients during the convalescent period (Ma et al., 2013). Many studies have also used art therapy to intervene and alleviate some symptoms in patients with schizophrenia (Gühne et al., 2012; Qiu et al., 2017; Lee et al., 2019; Tong et al., 2021). However, there are few empirical studies on the connection between drawing and its internal emotion experience, emotion expression, and the social meaning it transits, or how these are connected to brain nerves. This study focuses on identifying the differences in emotion expression through the drawing task between patients with schizophrenia and a healthy population using brain neurotechnology techniques. The expressive therapies continuum (ETC) model comprehensively and systematically explains the mechanisms underpinning information processing and image formation in interactions between individuals and media, combining information processing with the creation of art. It thus provides a framework for understanding artistic creation in different groups, including healthy people and patients with schizophrenia (Kagin and Lusebrink, 1978; Hinz, 2018; Lusebrink and Hinz, 2020).
Research on Experiencing and Expressing Anger
Previous studies on mood disorder in patients with schizophrenia have mainly focused on either positive emotions or negative emotions such as sadness and fear. However, fewer studies have focused on anger. Anger is a negative emotion that people often experience in daily life. In order to quickly deal with threats and obstacles, anger modulates cognitive processes that detect danger quickly and respond to it (Izard, 2007). In contrast to other negative emotions that are characterized by low arousal and low pleasure, anger has high arousal and low pleasure (Russell and Barrett, 1999). Studying anger is important for schizophrenia because this disease is often associated with angry and hostile behavior (Volavka, 1999). Externalized anger in patients can lead to an increase in violent behavior (Brennan et al., 2000) and influence the prognostic process (Fassino et al., 2009). Therefore, this study focuses on anger experience and expression in patients with schizophrenia.
Using fNIRS to Monitor Brain Activity in Emotion Experience and Expression
Emotions, including anger, are closely associated with the frontal cortex of the brain. The prefrontal cortex (PFC) is an important region for understanding and interpreting stimuli and their emotional meaning. Emotional stimuli activate the amygdala, but how emotions are expressed depends on the PFC. Anger can narrow the cognitive range and inhibit irrelevant information, impulses, and other emotional characteristics. Impulsiveness is based on damage to the PFC, and people with such damage show deficits in inhibiting emotion expression. Emotional euphoria and non-emotional responses are both associated with damage to the PFC (Meng, 2005). Studies have shown that the PFC is involved in emotion expression and feeling, and that patients with PFC impairment have significantly reduced emotion expression ability (Stuss et al., 1992). As such, in this study, we used functional near-infrared spectroscopy (fNIRS) to monitor the PFC activity of participants in the schizophrenia and healthy groups during emotion experience and expression.
fNIRS has been widely used in the evaluation of patients with schizophrenia in recent years (Balconi et al., 2015; Kumar et al., 2017; Chou et al., 2020). Compared with functional magnetic resonance imaging (fMRI) and electroencephalography, fNIRS has higher head movement tolerance, moderate time resolution and moderate spatial resolution, and a high ecological effect suitable for experiments carried out in more natural conditions (Ferrari and Quaresima, 2012; Pinti et al., 2020). In this study, given the uniqueness of the patient cohort consisting of individuals with schizophrenia, there were more random actions during the experiment, and the movement range of the participants in the drawing process was relatively large. Thus, fNIRS monitoring was more appropriate for this study as it could minimize the interference effect of these influencing factors.
Functional imaging has previously been used to explore the brain activity of study participants while they draw. Kaimal et al. (2017) used fNIRS to study the drawing process of study participants and found that the medial prefrontal cortex (mPFC) was activated during the drawing process compared to the resting state. The study also found that the activation of mPFC was strongest during doodling. Nakano et al. (2018) used fNIRS to assess and compare the activation of the PFC in patients with schizophrenia to that of healthy participants during the tree drawing test. The results showed that the blood oxygen level of the schizophrenia patients was significantly lower than that of the healthy participants during the tree drawing task. This study confirmed that differences in the tree drawing task may be related to brain dysfunction. Yan et al. (2021) used fNIRS to explore the role of drawing in regulating anger and sadness. The results showed that when drawing regulated sadness, the frontopolar area and left dorsolateral prefrontal cortex showed significant deactivations. These studies showed that fNIRS is an effective instrument to detect relative brain function.
Research Questions and Hypothesis
In previous studies on anger, the following ways of priming emotions have been used: participants were asked to recall an experience that made them very angry (Small and Lerner, 2008); text, audio, video, and other external stimuli were presented to the participants (Carver, 2004; Barazzone and Davey, 2009); and emotional situational elicitation (Zheng et al., 2012) was used, where participants were asked to complete certain tasks and then given negative feedback to arouse anger (van’t Wout et al., 2010).
This study sought to assess the differences in ways and brain mechanisms of anger experience and expression through drawing between patients with schizophrenia and the healthy participants. Thus, a film was used as the activation material and a drawing task was used as the emotion expression tool. fNIRS was used to record brain activation so as to explore the similarities and differences between participants in the schizophrenia and healthy groups during the experience of anger and while using drawing to express emotions. In this study, we used a film clip to initiate anger, rather than recalling an angry experience (Small and Lerner, 2008), or emotional situational elicitation (van’t Wout et al., 2010), based primarily on the following considerations: the priming material should be sufficient and have group generality such as to allow the participants to fully experience anger and express the emotions they have experienced through drawing. The viewing time of the film clip is longer than that of pictures, and is episodic and therefore easier for people with schizophrenia to understand. Moreover, films combining both visual and auditory modalities are multi-modality eliciting materials, which are associated with better starting effects than single-modality eliciting materials (Gross and Levenson, 1995; Zheng et al., 2012). The main hypotheses of this study were associated with emotion experience and emotion expression, and were grouped as follows: (1) There are no significant differences in the experience of anger between participants in the schizophrenia and healthy groups; (1a) after experiencing anger, there are no significant differences between the two groups in the subjective ratings of emotion arousal and pleasantness; (1b) during the experience of anger, the activation levels of the PFC are significantly different between the two groups; (2) there are significant differences in the expression of anger between participants in the two groups, possibly because patients with schizophrenia have problems in expressing anger due to frontal lobe damage, express less emotion, and may exhibit weakened brain activation while drawing to express anger; (2a) there are significant differences in brain activation data between the two groups during the drawing process; (2b) there are significant differences between the two groups in terms of drawing features (e.g., line quality) and drawing content (e.g., the richness of the drawing); (2c) the ability of patients with schizophrenia to interpret the content of the drawing in words—i.e., their ability to relate the emotion expression of the drawing with the social meaning conveyed—is significantly different from that of healthy participants; (3) since drawing is a way for the participants to express their emotions, and the brain activation data during the drawing process are also recorded, there are correlations between the behavioral data and the brain activation data; (4) the drawing data and brain activation data during emotion expression are significantly correlated with each other, but the correlation patterns are different between participants in the schizophrenia and healthy groups.
According to the affective development model proposed by Halberstadt et al. (2001), emotions can be divided into different aspects—the ability to send affective messages, receive affective messages, and experience affect—that influence each other. There is a certain relationship between emotion experience and emotion expression. All of these factors can be used to derive Hypothesis (5): the drawing coding results and the arousal and valence being experienced are correlated significantly within each group.
Materials and Methods
Participants
This study has been approved by the University Committee on Human Research Protection of East China Normal University and the Ethics Committee of Shanghai Changning District Mental Health Center. The chief investigator informed the resident doctors in the mental health center of the screening conditions before the experiment, and the residents were asked to select those patients with schizophrenia who had been in the hospital for a long time. The residents determined the final list of patients who were to be included by communicating with the family members of the selected patients and obtaining their informed consent. Patients with schizophrenia in the convalescent period—i.e., hospitalized patients undergoing treatment who had their condition under control and were in a stable period after evaluation by psychiatrists—were enrolled using the following screening criteria: (1) patients who were right-handed, in good physical condition, and native Chinese speakers; (2) patients who had self-control and self-knowledge and could give independent informed consent; and (3) patients who possessed basic cognitive and communication functions and were able to understand instructions and cooperate with the completion of experimental tasks in the experiment. Patients were excluded if they met any of the following criteria: other serious physical illnesses such as diseases of the heart, liver, or kidney; intellectual disability or brain organic diseases; severe recession; impulsive and uncooperative; pregnant or lactating; and majored in art. A total of 25 participants were recruited in the study, but 8 were excluded due to data non-compliance (see section “fNIRS Data Analysis” for specific requirements). A total of 17 participants, including 8 males and 9 females, were finally included in the analysis (Table 1, see section “Positive and Negative Syndrome Scale” for details about PNASS scale and three subscales).
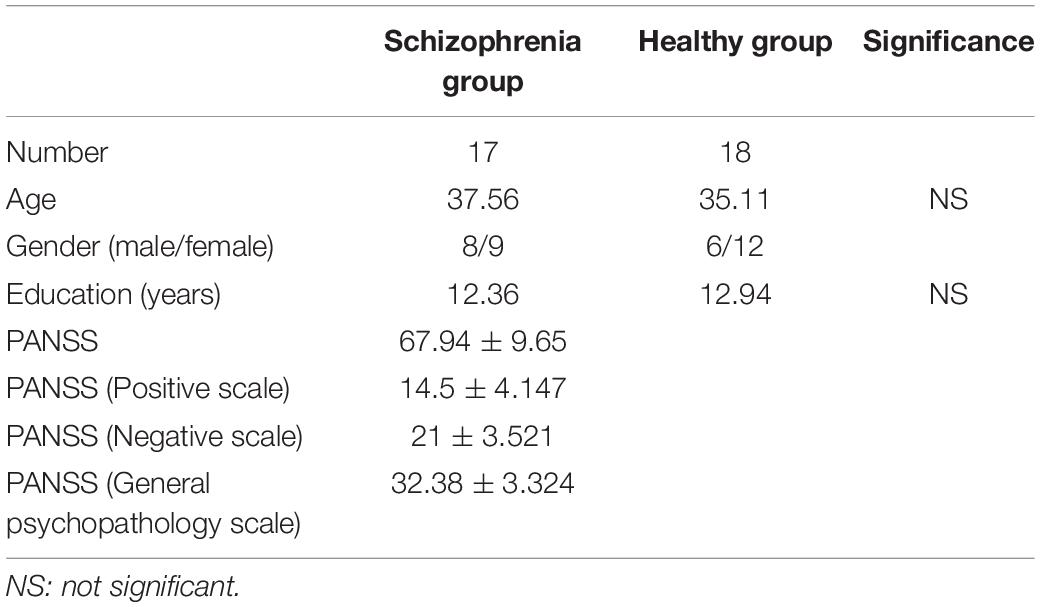
Table 1. Basic features of the two participant groups.
The control group was recruited through advertisements. Inclusion criteria were as follows: (1) healthy participants with no history of mental illness, cardiovascular disease, brain injury, or substance abuse; (2) right-handed, in good physical condition, native Chinese speaker; (3) exclude participants majoring in art. A total of 24 control participants were recruited in this study, and 6 were excluded due to data non-compliance (see section “fNIRS Data Analysis” for specific requirements). A total of 18 participants were finally included in the analysis, including 6 males and 12 females (Table 1).
Materials
Anger-Eliciting Material
The film clip The Tokyo Trial, with a runtime of 3 min and 51 s, was used as the anger-inducing material (see Supplementary Material Video for the film clip). The plot revolves around the Class-A war criminal, Hideki Tojo, who says during a trial that the massacre of the Chinese people was self-deserved. Several previous studies have reported that the experience of anger increased significantly in participants after watching the film clip (Ding et al., 2014; Shi et al., 2015; Shi, 2017).
The Affect Grid Scale
This scale is a self-reported single-item scale developed by Russell et al. (1989). Due to its simple and rapid scoring, it is mainly used for rapid and repeatable measurement of transient emotion states. The scale evaluates two dimensions of emotion: pleasure (valency) and arousal (arousal–sleepiness). Anger has high arousal and low pleasure on the scale.
This scale is a simple measurement method with good reliability and validity (Russell et al., 1989; Feldman Barrett and Russell, 1998), and has been used in many studies (Dalebroux et al., 2008; Diliberto-Macaluso and Stubblefield, 2015). However, due to the complexity of using this scale, a study prepared a video tutorial to teach participants how to use the scale (Askim and Knardahl, 2021). Another study has shown that the original single-response scale layout has no advantages compared to the scoring scale (Jaeger et al., 2021). In this study, in order to improve patient comprehension, the grid form was changed into a nine-point scale, and pleasure and arousal were split into two independent nine-point scores, providing multiple scoring options for each question (1: Displeasure, 9: Pleasure; 1: Sleepiness, 9: Arousal). The participants did not need to consider the binding relationship between the two.
Drawing Materials
The drawing materials consisted of an A4-sized white paper and oil drawing sticks in 24 colors. These materials were selected based on the relationship between materials and emotion expression in the ETC model (Hinz, 2018). According to this model, the properties of media are related to two continuums: emotion–cognitive experience and fluid–resistant medium. The oil drawing stick is closer to the cognitive end, and more appropriate for expressing emotions when participants are not completely immersed in emotions. Considering the hand-eye coordination and fine motor operation in schizophrenia and the age of the participants (mid-30s), the oil drawing stick was considered easier to handle and control than colored pencils and other fluid media. The text instructions were as follows: “Please express the emotions you just experienced when you watched the film. You can use any color you want and draw any pattern you want, as long as it reflects your emotions. The drawing time is 5 min, we will remind you when the time is up, please try not to stop during the drawing.”
Drawing Open-Ended Self-Reflection Questionnaire
A self-report questionnaire was provided, containing five open-ended questions about the following aspects of the drawing: “What are your emotions when you draw? Use 3–5 adjectives to describe it,” “What did you draw?” “What do you think of when you look at the picture after you finish drawing it?” “Is there any connection between the state presented in the picture and your reality?” and “Give the picture a name.” The fourth question tested whether the participants could relate the emotional expression of the drawing with the social meaning it conveyed.
Positive and Negative Syndrome Scale
The positive and negative syndrome scale (PANSS) (Kay et al., 1987) is a 30-item scale that assesses the symptoms of schizophrenia and each item is rated on a 7-point scale (1: absent, 7: extreme). It includes three subscales: the positive scale (7 items, total scores from 7 to 49), the negative scale (7 items, total scores from 7 to 49) and the general psychopathology scale (16 items, total scores from 16 to 112). Thus, the PANSS total score ranges from 30 to 210. Additionally, “mildly ill” corresponds to a PANSS total score of 58, “moderately ill” to a PANSS score of 75, “markedly ill” to a PANSS score of 95, and severely ill to a PANSS score of 116 (Leucht et al., 2005).
fNIRS Apparatus
A 16-channel portable fNIRS system WOT-100 (Hitachi Medical Co., Ltd., Japan) was used to collect cerebral blood flow data. The instrument emits and absorbs near-infrared light at two wavelengths, 705 nm and 830 nm, with a sampling rate of 5 Hz. The system consists of 6 light-transmitting probes and 6 receiving probes with a total of 16 channels covering the PFC (Figure 1), and the anatomical position of each channel is listed in Table 2.
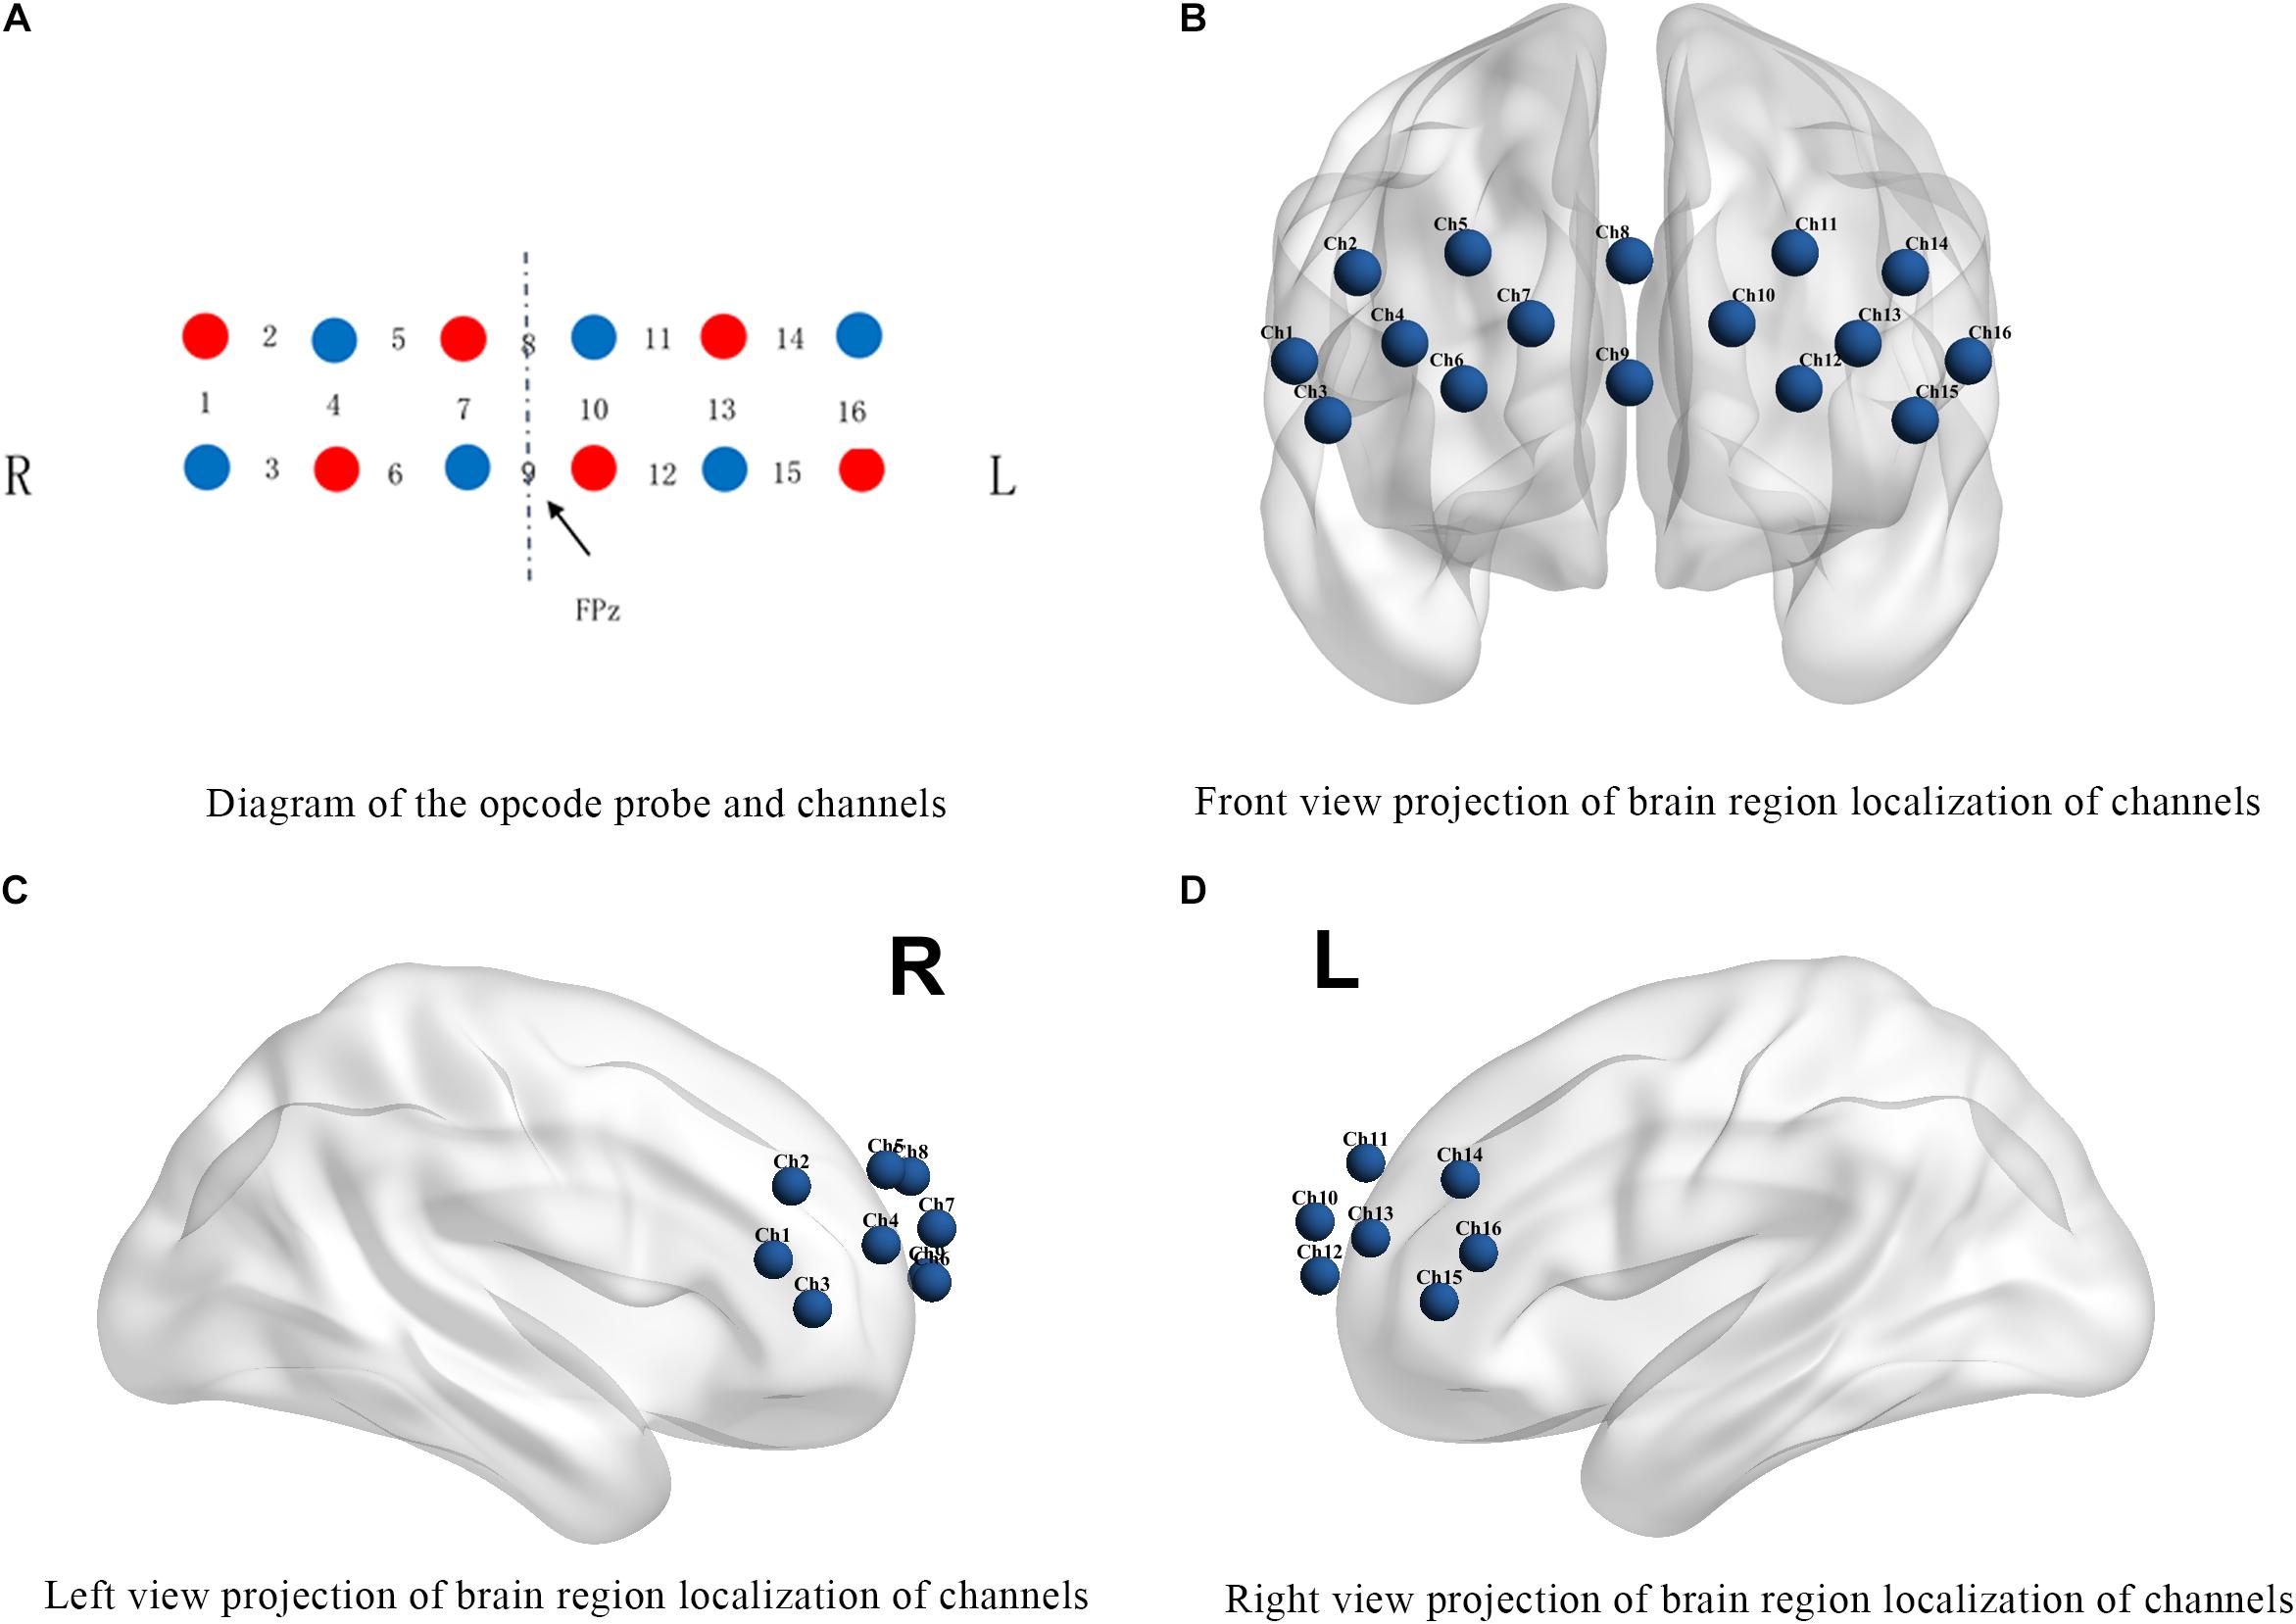
Figure 1. Channel positions. (A) The red circles represent the light transmitting probes and the blue circles represent the light receiving probes. The numbers between probes indicate the signal channel numbers. R: right brain region; L: left brain region. (B–D) Show the projections of brain region localization of channels.
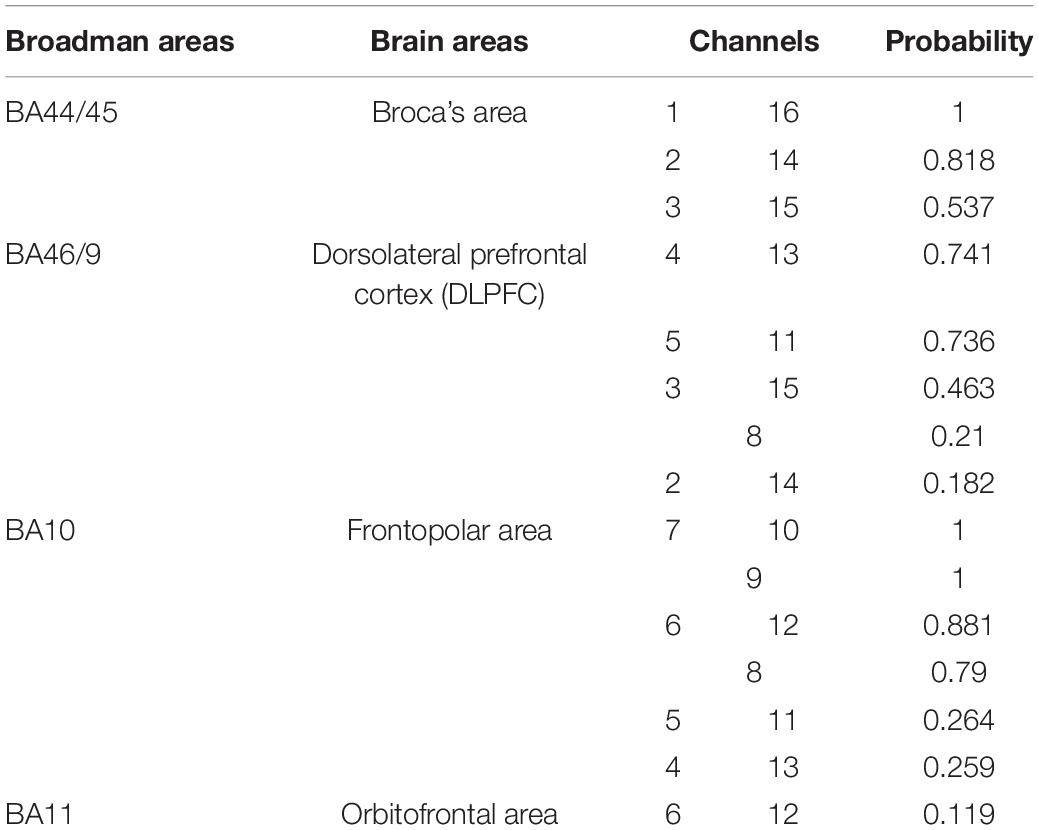
Table 2. Broadman areas, brain regions, and the probability of corresponding fNIRS channels.
Study Procedure
One week prior to the experiment, resident doctors assessed the mental status of the experimental group using PANSS. When participants entered the laboratory at the beginning of the formal experiment, the principal experimenter introduced himself to the participants, explained the whole study, and obtained written informed consent from the participants. Next, the experimenter explained the specific content and process of the experiment and introduced the use of the art medium and emotion grid scale. After ensuring that the participants understood all the information, they were equipped with portable near-infrared devices. Following the successful debugging of all channels, the experiment was formally initiated. The experimental procedure (Figure 2) was as follows: first, the participants closed their eyes and rested for 3 min. Then they watched the anger-inducing film clip. After the film clip had ended, the participants filled out the paper version of the affect grid scale with a pen, and then drew with oil drawing sticks for 5 min, then answered the paper version of the open-ended self-reflection questionnaire with a pen. All the writing materials (the affect grid scale, paper for drawing, and the drawing introspection scale) were clamped onto an A4-sized board and presented in vertical orientation to the participants at the beginning of the experiment. The instructions were all timed by the computer.
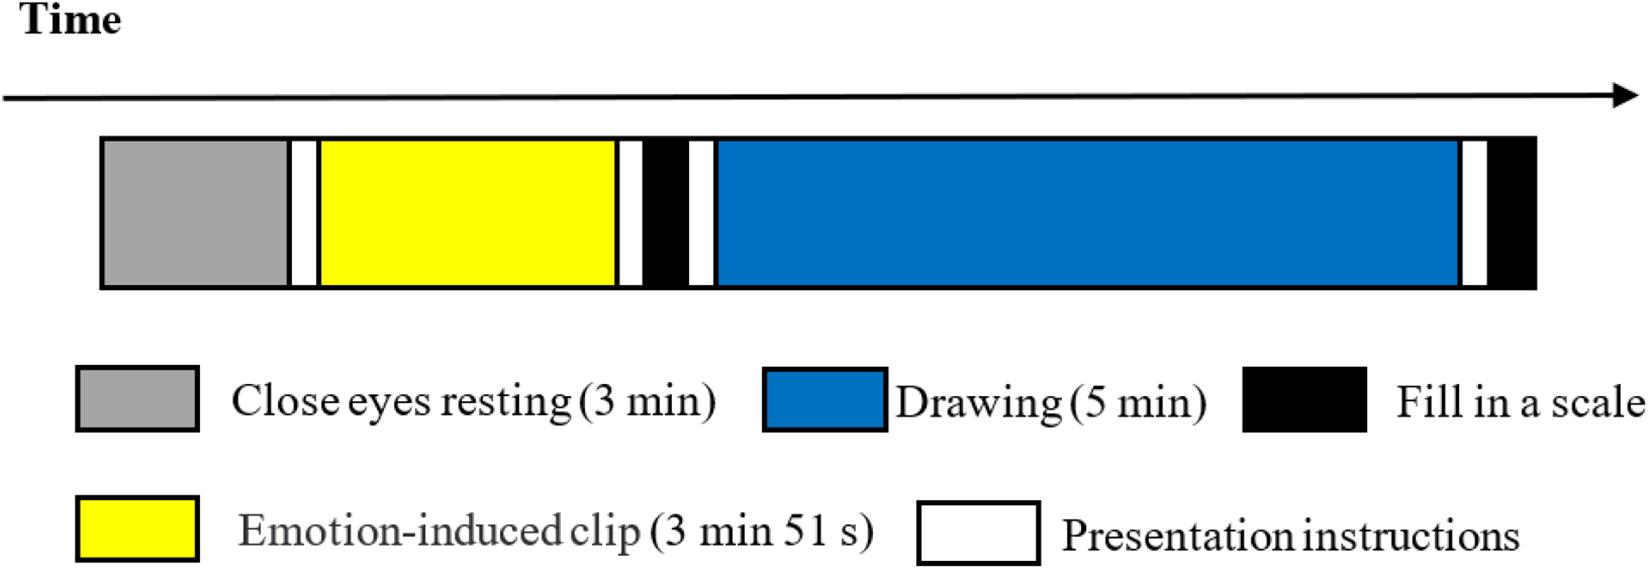
Figure 2. Experimental procedure.
Triangulation in Research Design, Implementation, and Data Analysis
According to the triangulation method proposed by Denzin (2017), combining multiple methods, empirical viewpoints, experimental hypotheses, and researchers in a single study can increase the rigor, depth, and breadth of the study. Following the classification suggested by Denzin (2017), this study adopted a triangulation strategy in several aspects: theoretical triangulation using multiple professional perspectives to interpret a single set of data or information (e.g., both brain activation data and behavioral data were used to interpret the hypotheses); methodological triangulation, including inter-method triangulation by adopting quantitative and qualitative methods simultaneously, and intra-method triangulation by using two or more similar methods to measure the same variable (e.g., the analysis of drawing contents and answers to reflection question); data triangulation, in which data were collected from multiple sources and each hypothesis was tested by brain activation data and behavioral indicators; and investigator triangulation, i.e., joint research by more than one skilled investigator without prior discussion or cooperation. In this study, both brain and drawing data were analyzed by different researchers and the drawing data were coded independently by two researchers.
Data Analysis
Data Analysis of Emotional Changes
The affect grid scale was used to measure the subjective emotional feelings of the participants at the end of the emotion-inducing film. A one-sample t-test with a test value of 5 (mid-point of scale) was used to analyze the changes in emotion—pleasure and arousal—among the two groups of participants. The two-sample t-test was used to compare the differences of pleasure and arousal between the two groups.
fNIRS Data Analysis
The fNIRS data were preprocessed using the NIRS_SPM kit (Ye et al., 2009) based on MATLAB. Oxygenated hemoglobin (HbO) is the most sensitive marker of changes in blood flow in the brain (Hoshi et al., 2001) with high signal-to-noise ratio (Zhang et al., 2018). Therefore, HbO concentration was selected for analysis in this study. Prior to preprocessing, signal-free and noise channels (correlation coefficient of HbO and HbR higher than 0.5) were eliminated. If the number of channels removed accounted for more than 25% of the total number of channels (i.e., 4 or more of the 16 channels in this study), the participant was removed from the analysis (McDonald et al., 2019). Correlation-based signal improvement (Cui et al., 2010) was used to correct artifacts caused by head movement. The wavelet-minimum description length and hemodynamic response functions methods were used to remove the signal drift caused by physiological and machine noises (Jang et al., 2009; Tak and Ye, 2014).
For each individual participant, the average HbO concentration change of 16 channels during the task period, including the 3-min closed-eye rest, 3-min-and-51-s emotion-inducing film task, and 5-min drawing task, was extracted. The 3-min closed-eye rest before the experiment was used as the baseline (Jiang et al., 2012; Shin et al., 2016), and the HbO concentration values during the tasks minus baseline value were used as indicators of brain activation patterns. A one-sample t-test with a test value of 0 was used to analyze the activation patterns of the PFC during the emotion-inducing film task and drawing task (Baker et al., 2016). Following this, a two-sample t-test was conducted to analyze the differences in brain activation patterns between the two groups of participants. To analyze the dynamic changes in differences between the two groups in the emotional induction stage, a two-sample t-test was also conducted on the degree of brain activation per second in the emotional induction stage. Data were visualized using the xjview1 software and the BrainNet Viewer toolbox2 (Xia et al., 2013). The false discovery rate (FDR) was used to correct the p values of multiple tests (Singh and Dan, 2006).
Drawing Coding Indicator Analysis
The coding process was a round-trip iteration. According to the research objectives, a researcher determined the drawing coding indicators: drawing layout, color characteristics, line and stroke characteristics, drawing content, and text description of the drawing. The first four coded the features and content of the drawing, and the last indicator represented the process of the participants interpreting the drawing. The researchers identified 17 codes based on these coding indicators. After defining the operation, two researchers independently coded all the drawings. The final coding manual is shown in Supplementary Table 1. Apart from the completely consistent coding indicator, paper orientation, Intraclass Correlation Coefficients (ICC) analysis was conducted to test the consistency between raters for the remaining 16 ordered polytomous coding indexes, and internal consistency analysis was performed for all coding of each rater. A high level of consistency was seen among the raters for all drawing coding indicators (0.766 ≤ α ≤ 1.000) in both groups (Table 3), as well as for the responses given by the individual subjects (α = 0.823, 0.845, respectively). Data were analyzed using the means of drawing coding indicators rated by two distinct raters.
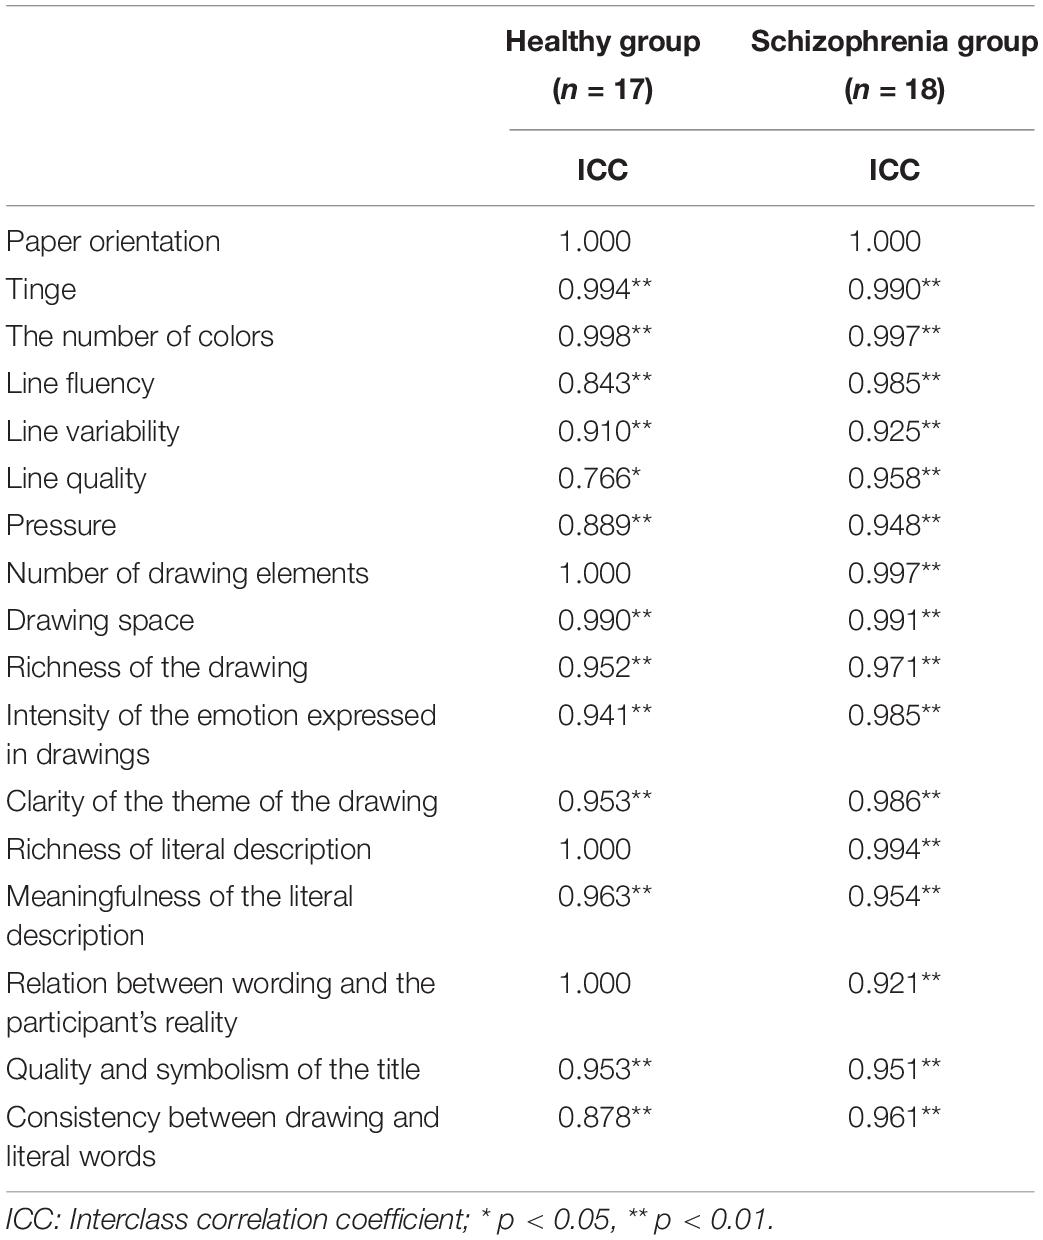
Table 3. Consistency of ratings for drawing coding indicators.
Results
Emotion Experience
Emotion Induced
The one-sample t-test on the affect grid scale scores of the two groups revealed that all the participants experienced a higher degree of arousal (M = 6.43, p < 0.01) and a lower degree of pleasure (M = 3.34, p < 0.01), indicating that the effect of the film clip on anger was significant. The affect grid scale scores of the two groups were further analyzed and compared. The two-sample t-test results showed that there was no significant difference between the two groups in the scores for arousal and pleasure (Table 4). Based on these results, Hypothesis 1a was verified.
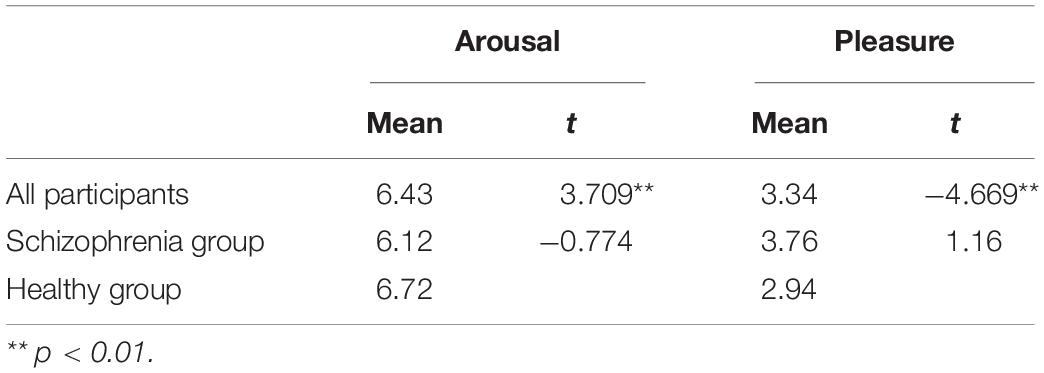
Table 4. Emotions induced.
Activation of Brain Regions During Emotion Experience
The normality test of brain activation data showed that most of the data did not follow normal distribution (for more details, see Supplementary Table 2); therefore, bootstrap sampling was conducted 5000 times (Preacher and Hayes, 2008) before analysis. A one-sample t-test was conducted for HbO concentrations of the two groups of participants while they were being shown the film (Supplementary Table 3). Participants in the experimental group had significantly negative activation in all recorded brain regions, except in a part of the left Broca’s area (Ch16). Participants in the control group had significantly negative activation in the Broca’s area, DLPFC and frontopolar area (Ch2, Ch4, Ch5, Ch7, Ch9, Ch10, Ch11, Ch12, Ch13, and Ch15). These results indicated that both groups reacted to the movie clips. A two-sample t-test was conducted to compare HbO concentrations of the two groups at this stage. There were no significant differences in any channels between the experimental group and the control group, indicating that patients with schizophrenia could experience anger normally. Thus, Hypothesis 1b was verified.
The brain activation data of the two groups for the entire duration of watching the film were further compared. The results showed significant differences between the groups in some channels during this period, and significant differences in the frontopolar area, DLPFC and right Broca’s area (Ch2, Ch6, Ch8, Ch10, and Ch11) at partial time points (Figure 3). This result supplements Hypothesis 1b. Although there were no significant differences in average brain activation between the two groups for the entire duration of the emotion experience stage, there were significant differences during some periods.
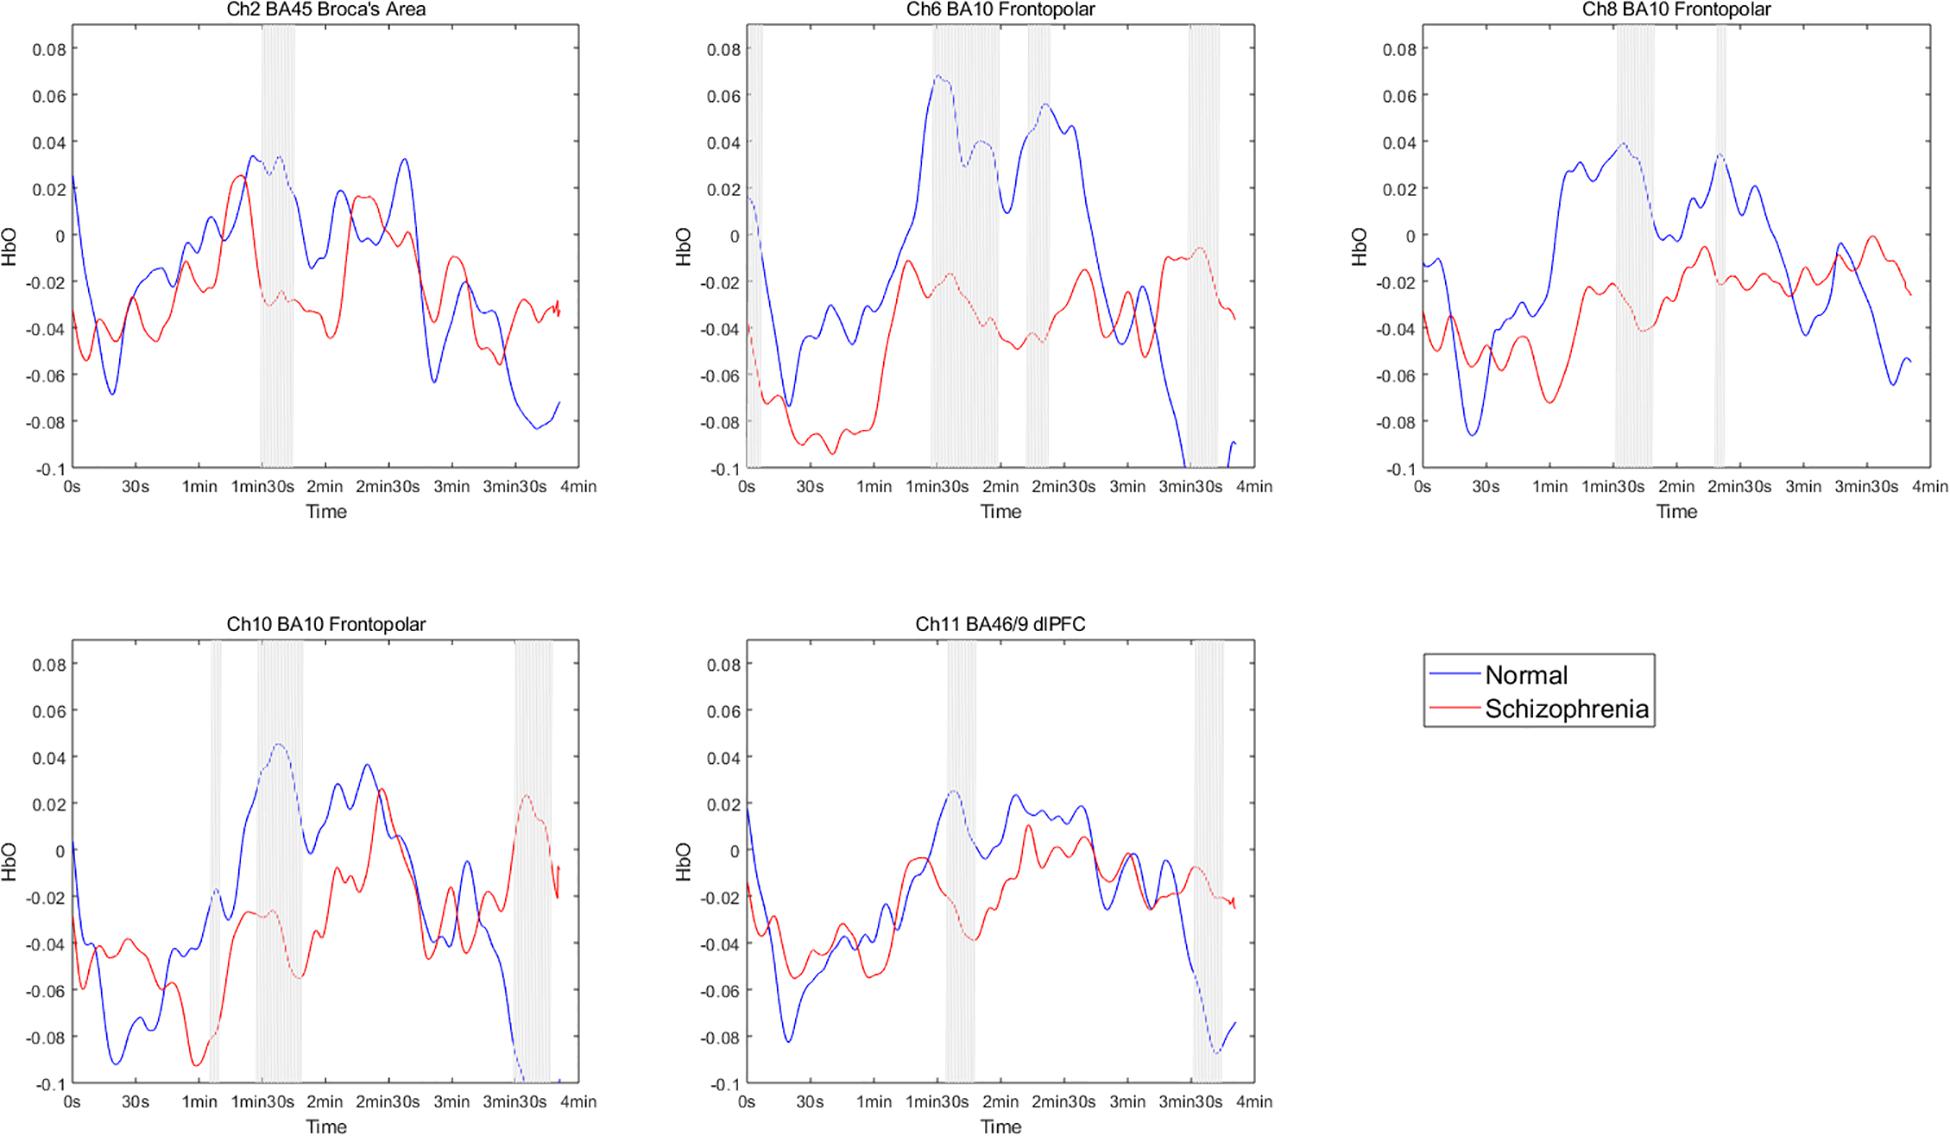
Figure 3. HbO concentration per second changes in participants while watching the emotion-inducing film. The segments with a gray line represent significant differences between the two groups.
Emotion Expression
Activation of Brain Regions During Emotion Expression
HbO concentrations during the stage of emotion expression were analyzed for participants in the two study groups (Figure 4 and Supplementary Table 4). Participants in the experimental group had significant negative activation in the Broca’s area, DLPFC, and frontopolar and orbitofrontal areas (Ch1, Ch3, Ch4, Ch6, Ch8, Ch9, Ch10, Ch11, Ch12, and Ch14), whereas those in the control group had no significant activation area. A two-sample t-test revealed significant differences between the groups in the frontopolar, orbitofrontal, and right Broca’s areas and in the right DLPFC (Ch1, Ch3, Ch4, Ch6, and Ch12). Based on these results (Table 5 and Figure 5), Hypothesis 2a was verified.
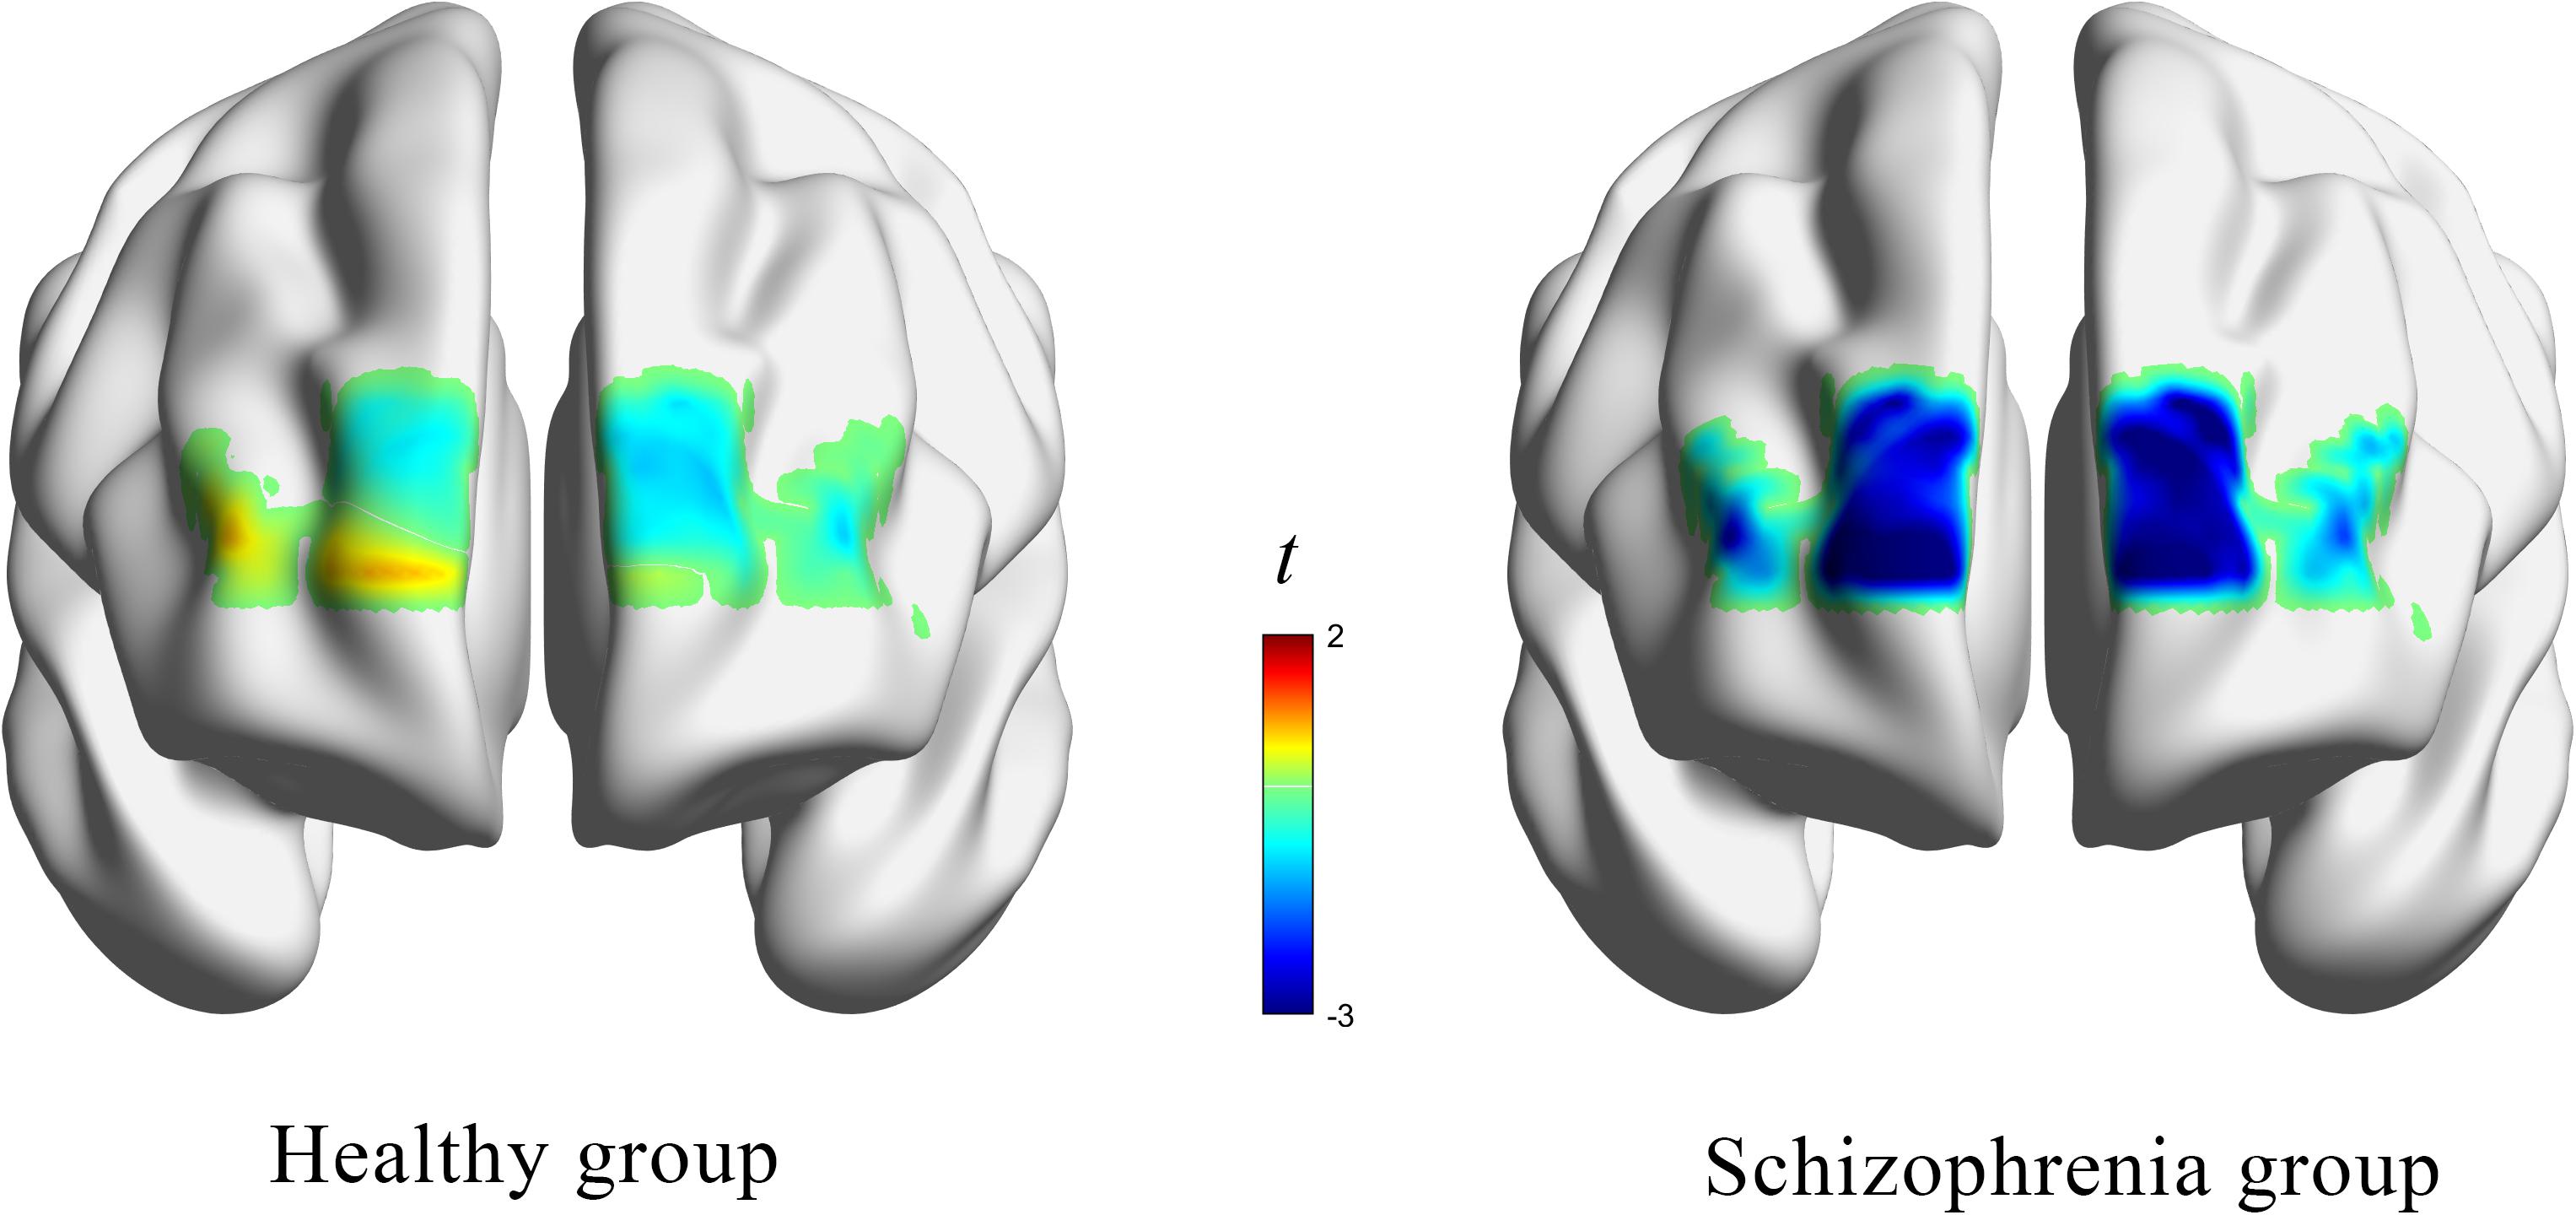
Figure 4. The t value (compared to 0) of brain activation in participants during emotion expression through drawing.

Table 5. Two-sample t-test results for the comparison of brain activation patterns in each channel during emotional expression between the two participant groups.
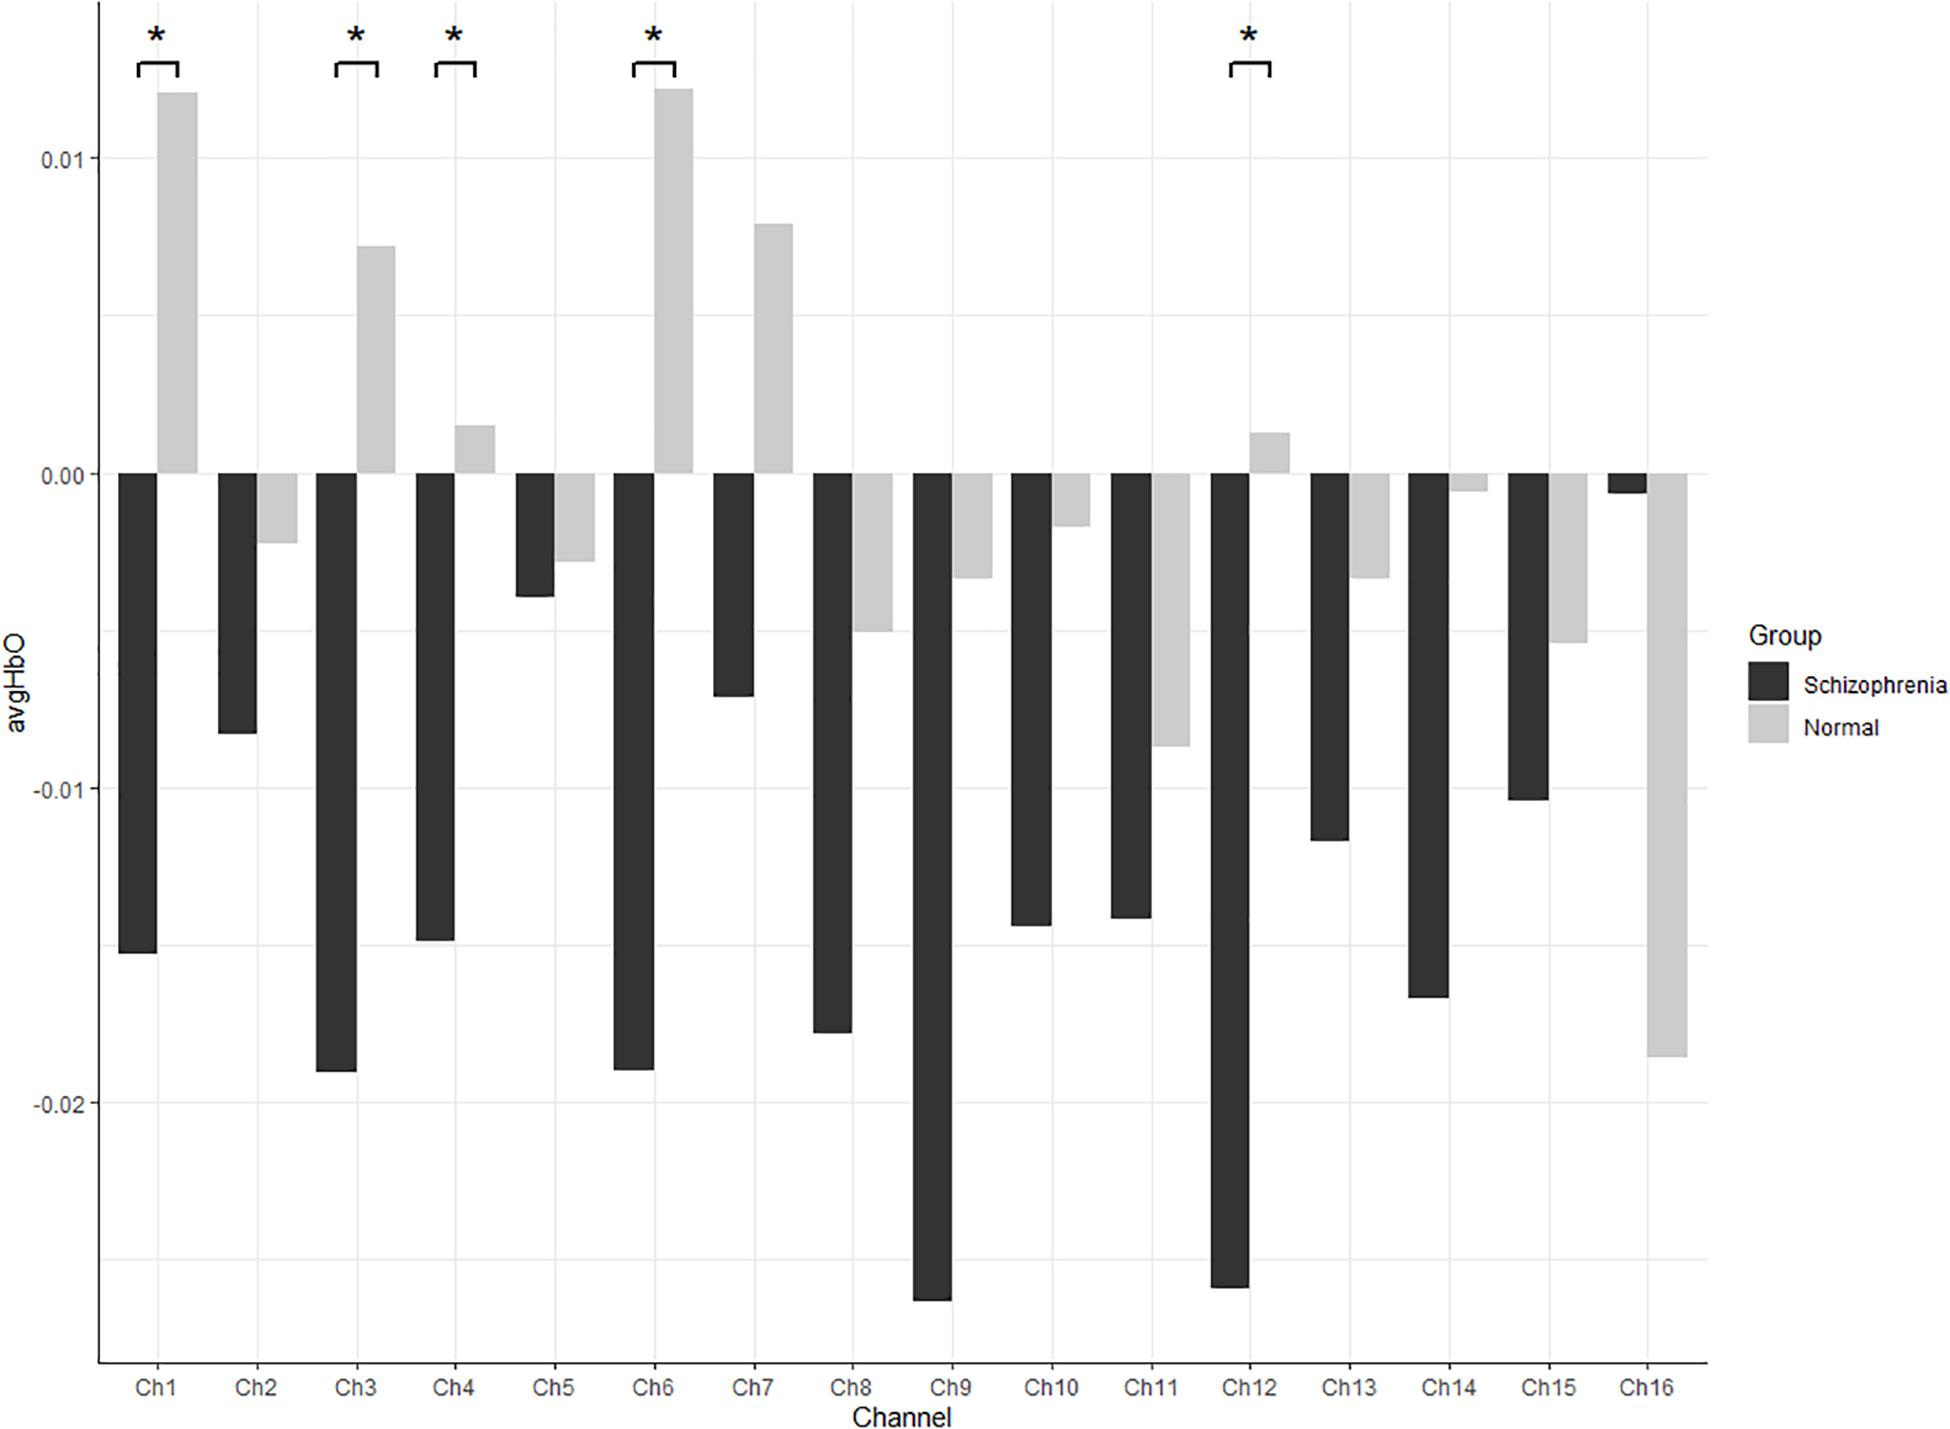
Figure 5. All channels HbO concentrations in participants during emotion expression through drawing (* refer significant difference between two groups p < 0.05).
Emotion Expression Through Drawing
Group differences in drawing coding indicators
To assess differences in the coding of drawings between the two groups, the chi-squared test was carried out using group as an independent variable and paper direction as a dependent variable. More than two-thirds of the participants drew vertically, and there was no significant group difference in the orientation of the paper. This may have been because the paper was handed to the participants in the vertical orientation. The normality test of other picture coding data showed that most of the data did not follow normal distribution (for more details, see Supplementary Material); therefore, bootstrap sampling was conducted 5000 times (Preacher and Hayes, 2008) before analysis. We further used different groups as independent variables and drawing coding indicators as dependent variables for a t-test. Results demonstrated that except for the tinge, color number, stroke weight, and a marginal significance of drawing size, there were significant differences in other drawing features. The line change, number of elements in the drawing, drawing content richness, emotional intensity expressed by the drawing, and the clarity of drawing theme were significantly different between the two groups. Hypothesis 2b was thus partially confirmed. In addition to the marginal significance of the richness of the text description, there were significant group differences in the text description, the connection between the text description and the artist’s reality, the quality and symbolism of the title, and consistency between the drawing and text. Hypothesis 2c was partially verified (Table 6). Figure 6 shows specific examples of drawings from participants in the two groups.
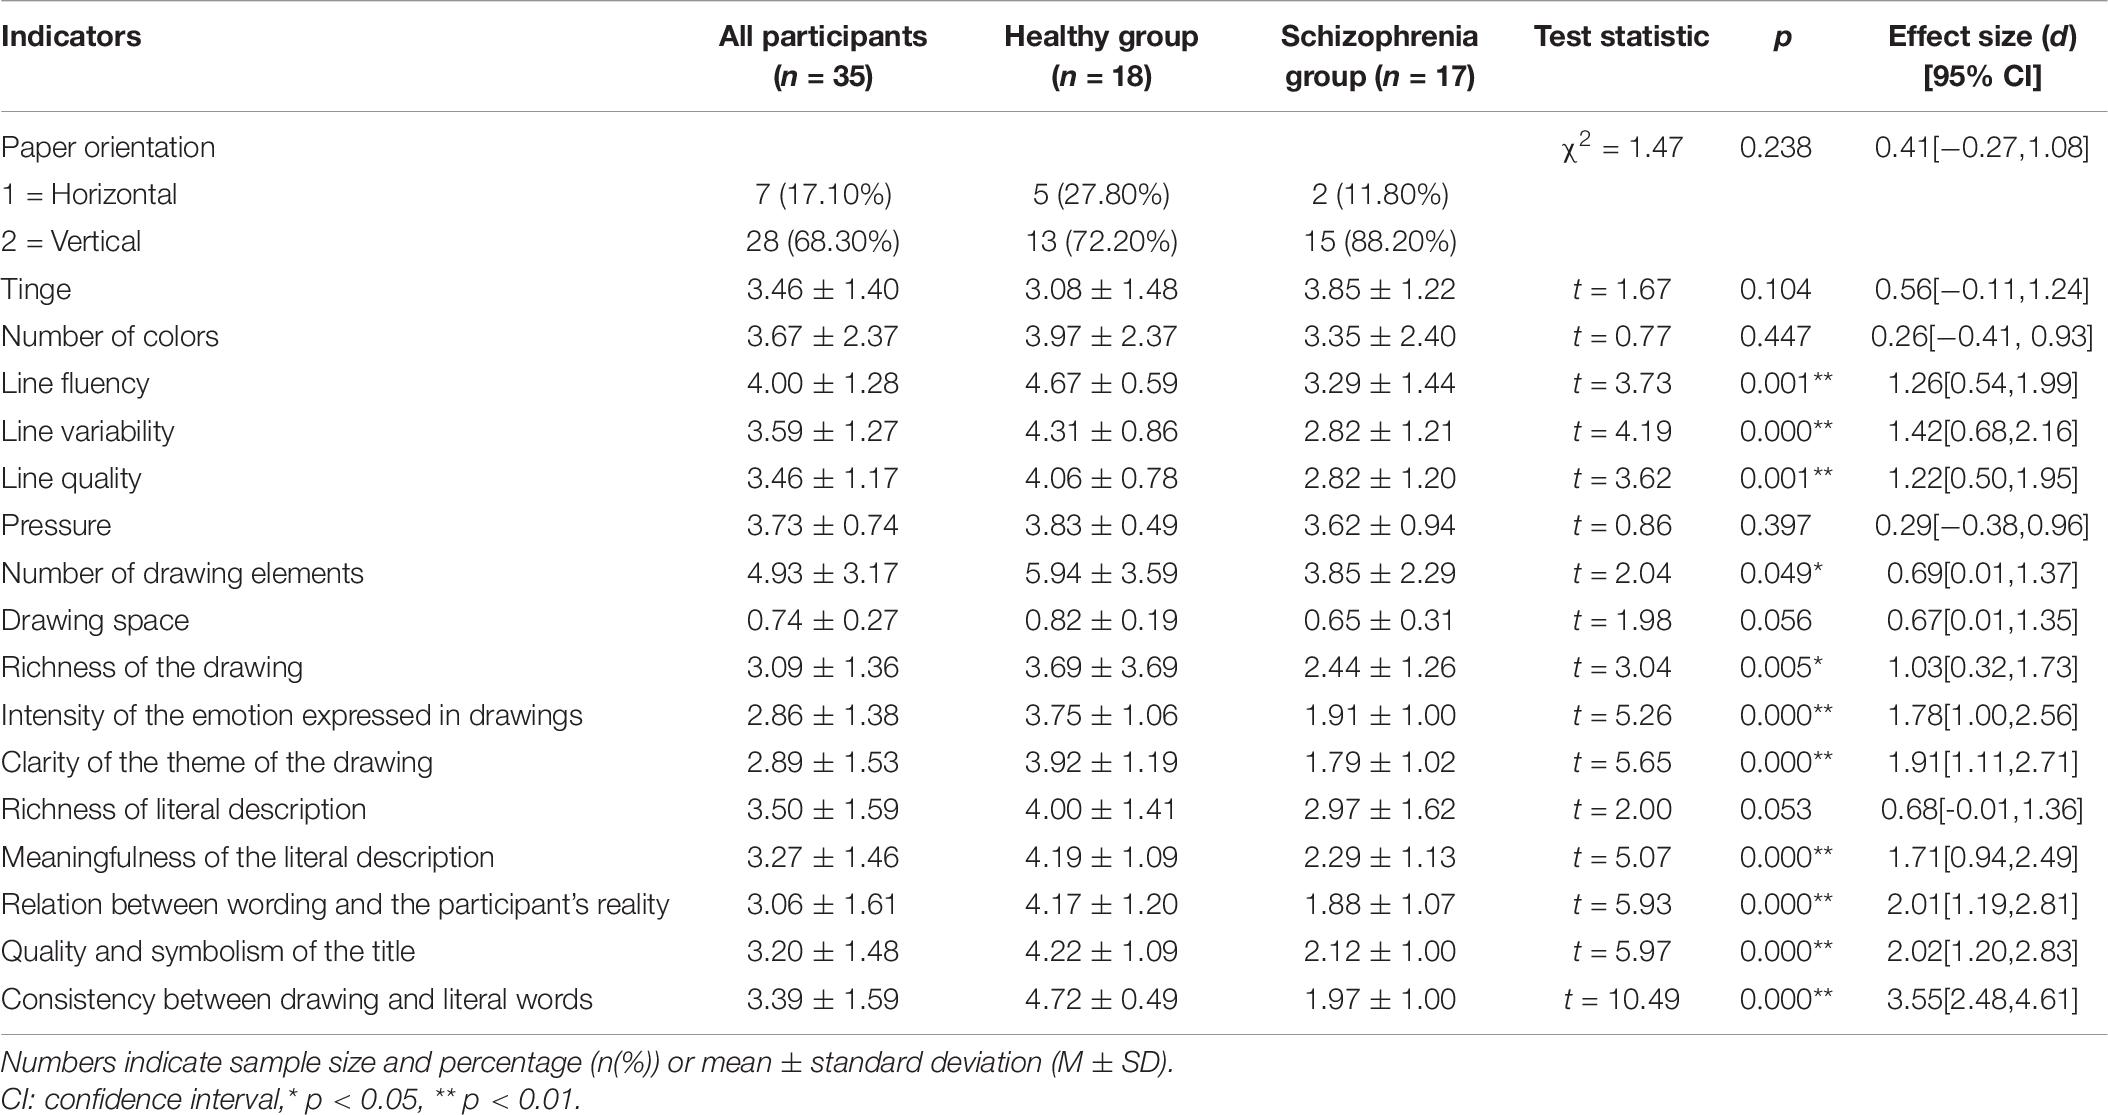
Table 6. Comparison of drawing coding results among different groups.
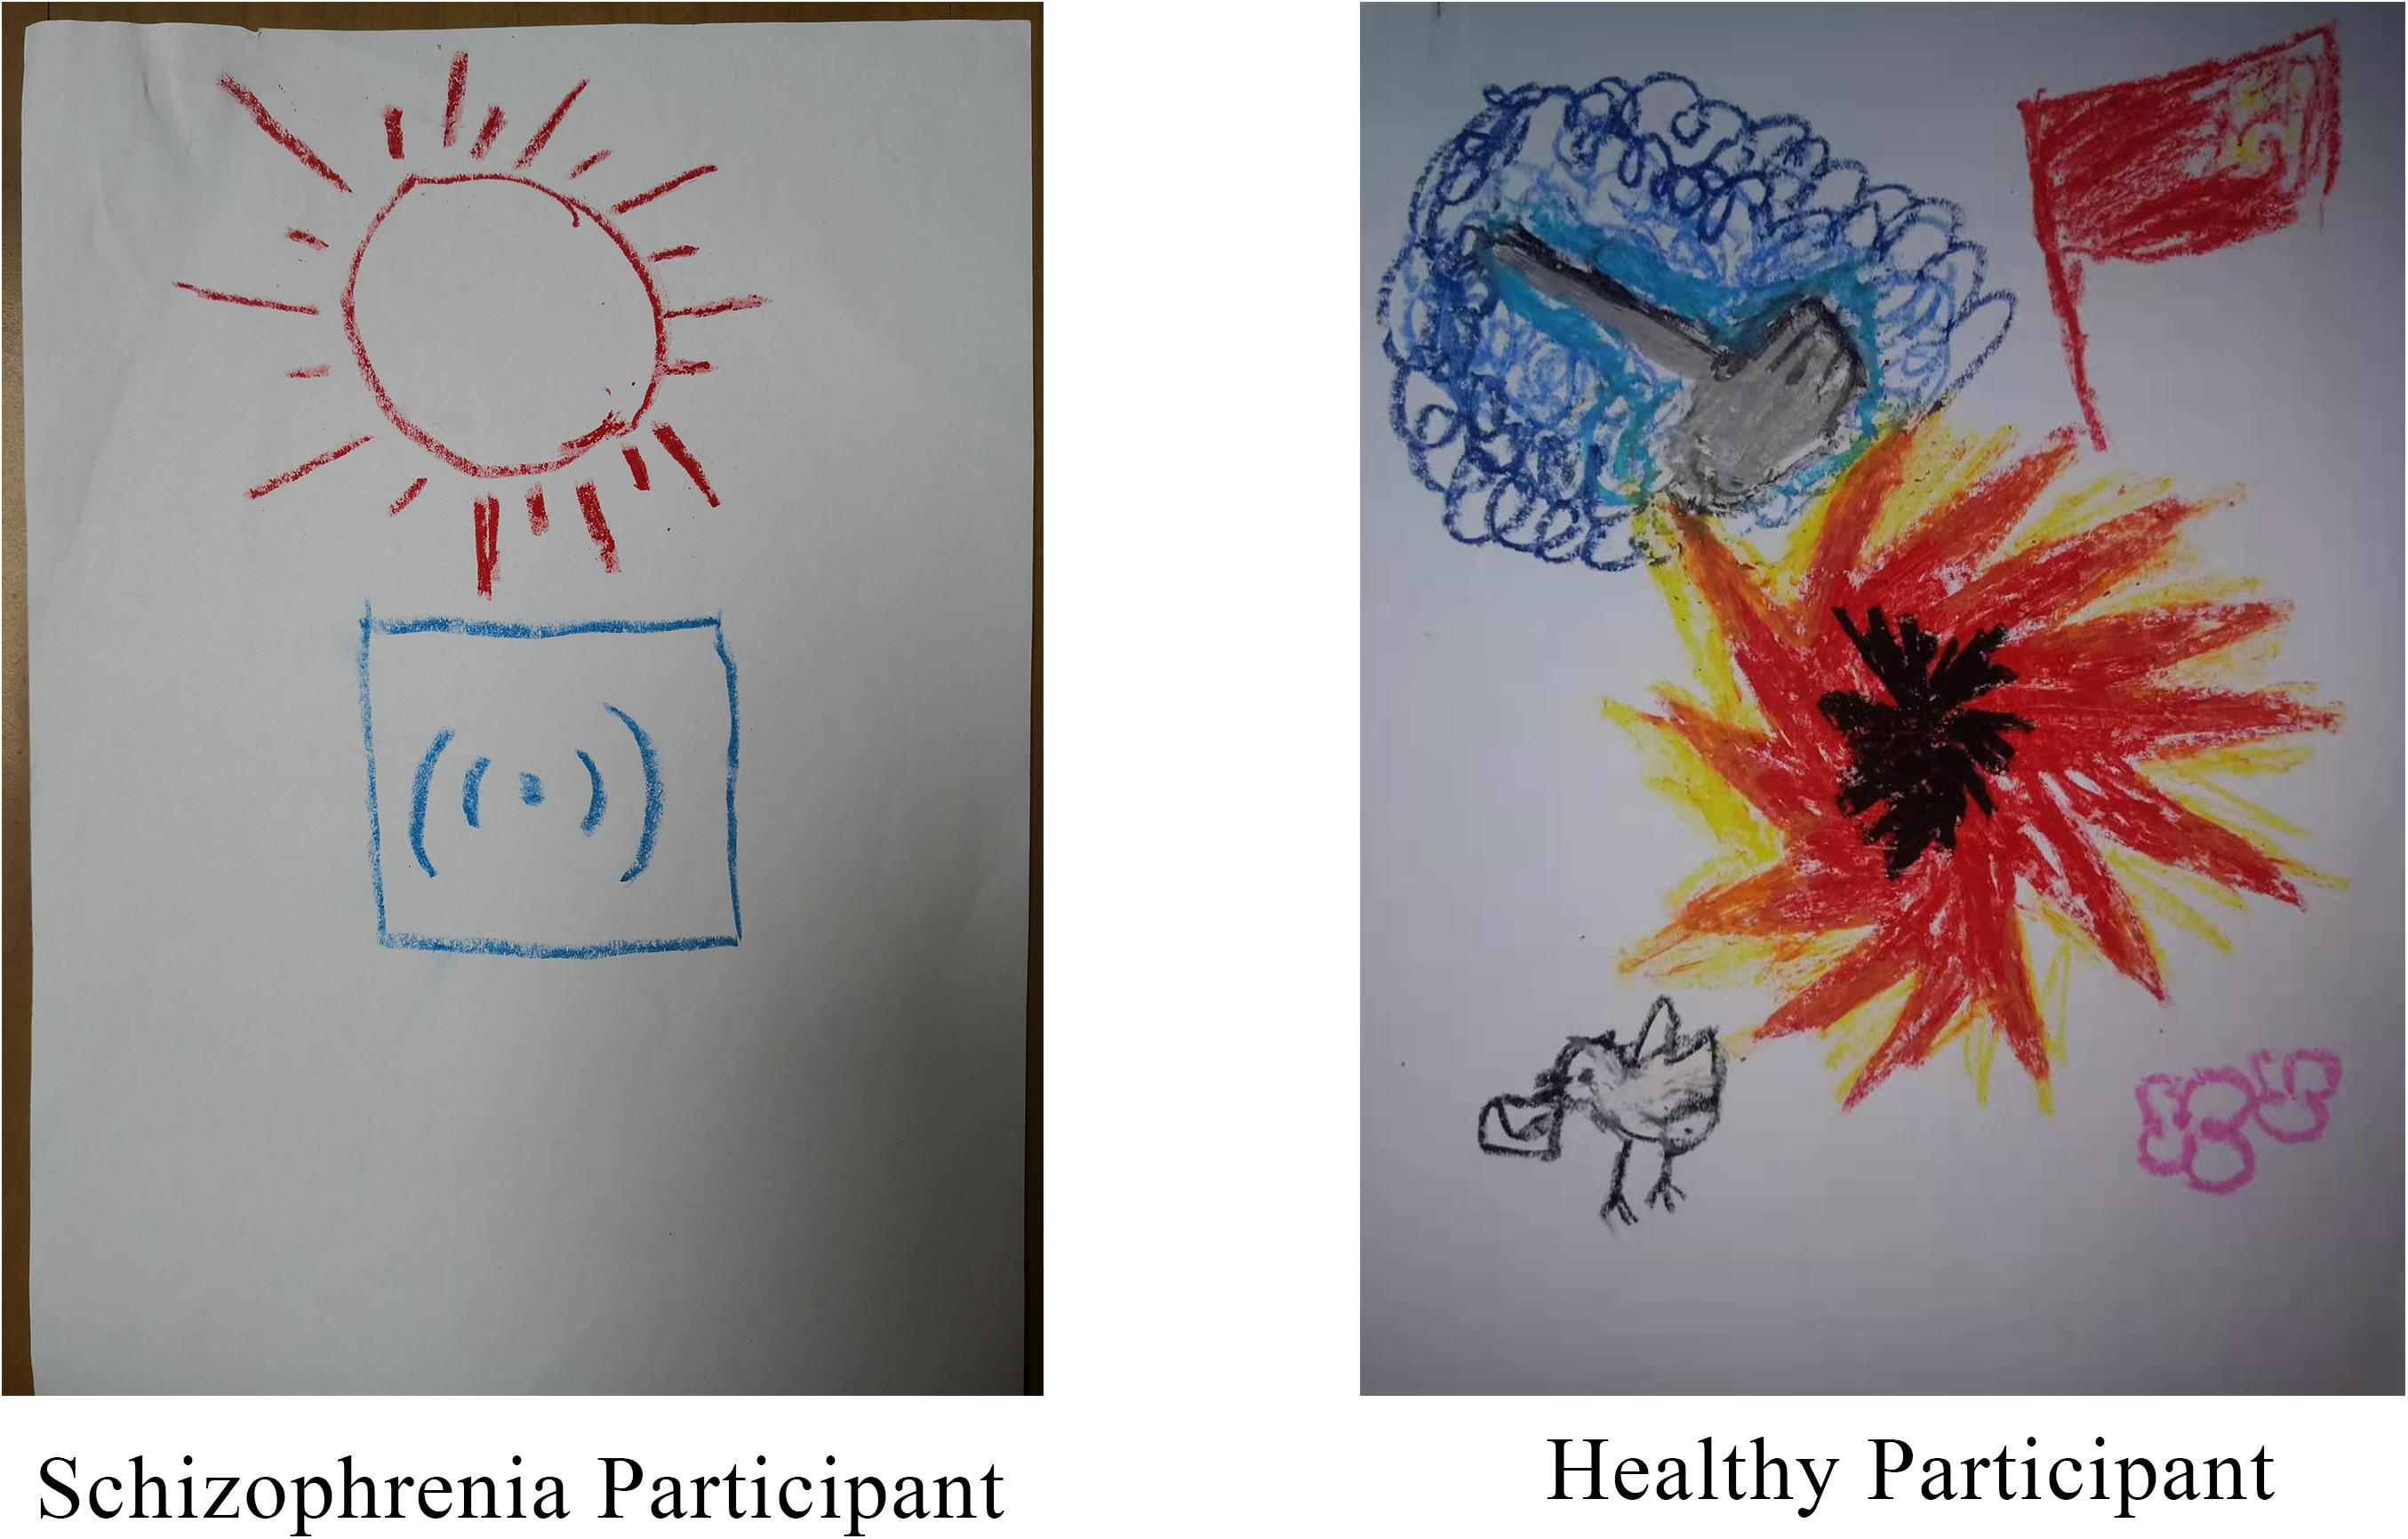
Figure 6. Specific examples of drawings from participants in the schizophrenia group (left) and the healthy group (right).
Correlation analysis of brain data between drawing coding and emotion expression
Scatter plots were prepared using the drawing coding data as the abscissa coordinate and the brain data of the two groups as the vertical coordinate. The fitted results showed that the drawing coding indicators were linearly correlated with brain data in the two groups. Since most of the brain data and picture coding data do not conform to the normal distribution, spearman correlation analysis was carried out between drawing coding and brain activation data in healthy participants during the stage of emotion expression. Results revealed that in the drawing stage, the frontopolar area, DLPFC, and right Broca’s area (Ch2 and Ch8) were correlated with more than five drawing coding indicators in the control group. Specifically, both channels were significantly positively correlated with line variability, richness of literal description, and meaningfulness of the literal description. Paper orientation, tinge, number of colors, line fluency, pressure, relation between wording and the painter’s reality, and consistency between drawing and literal words were significantly correlated to only zero or to one channel. The other codes were all significantly correlated to brain data in two or more channels, of which meaningfulness of the literal description was significantly correlated with five channels (Table 7).
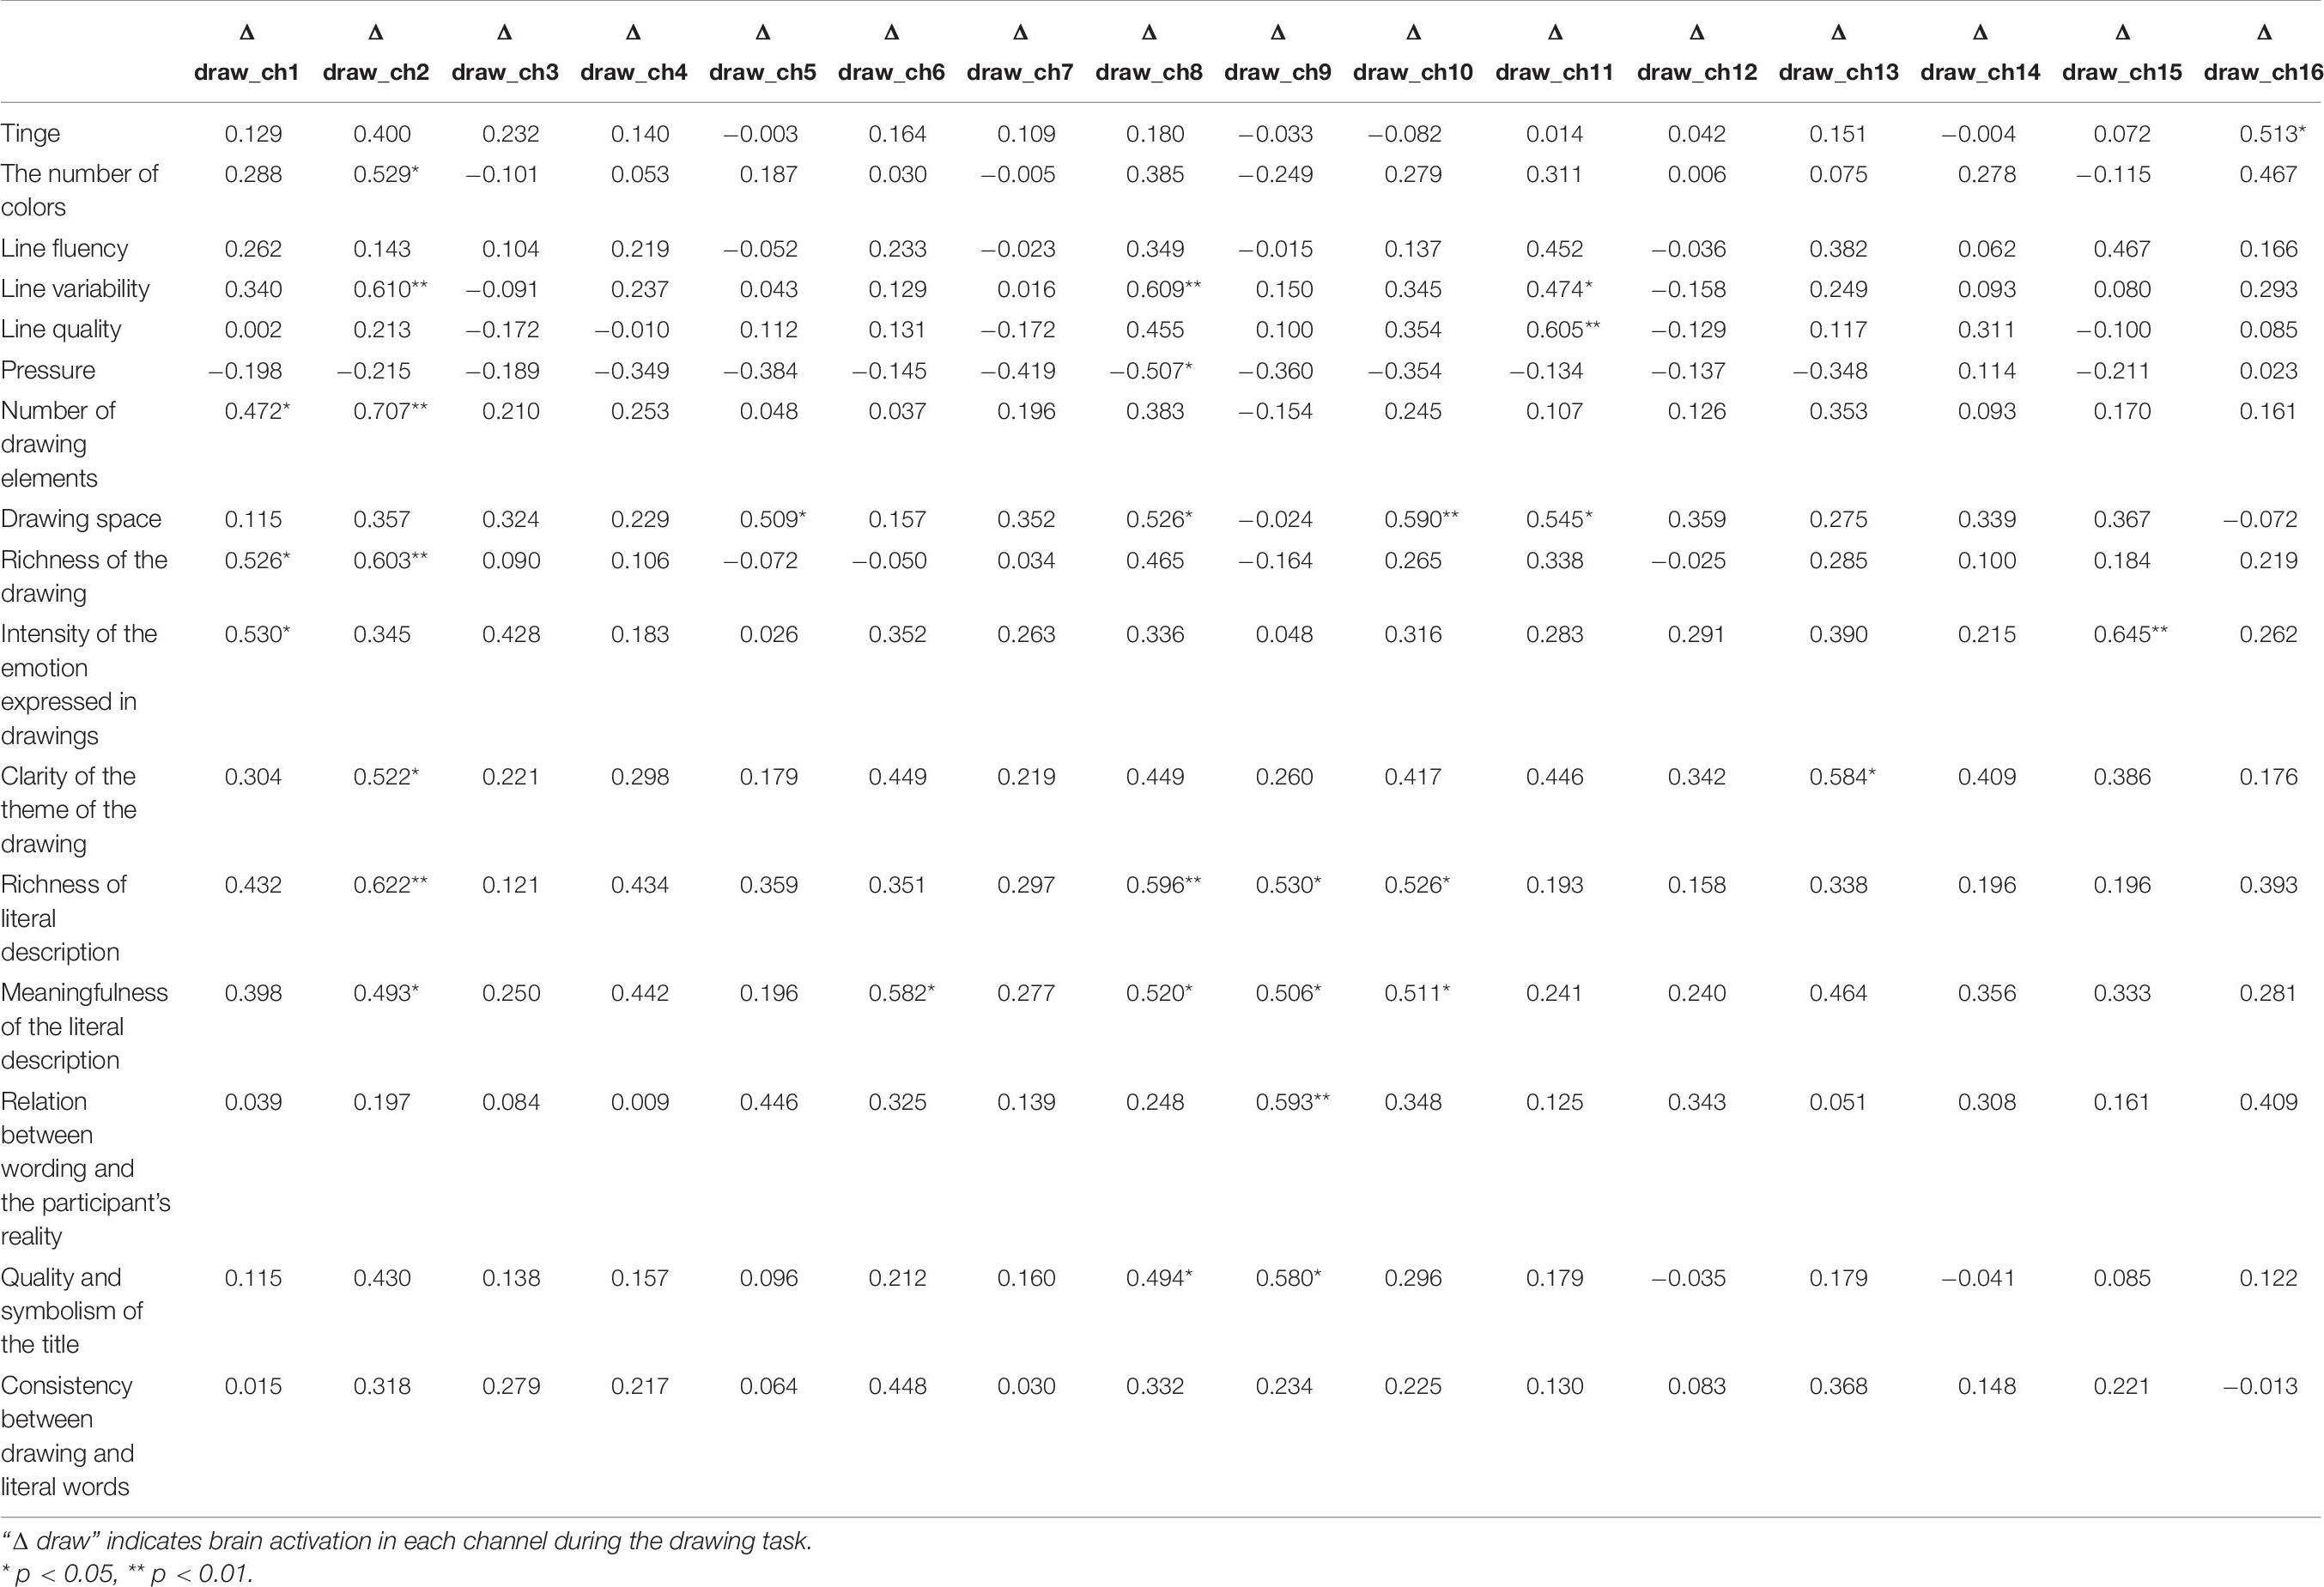
Table 7. Correlation coefficients between drawing coding and brain data in the healthy group during the emotional expression stage.
The same analysis was also carried out for data obtained from patients with schizophrenia (for detailed normal distribution test results refer to Supplementary Table 2). The results showed that the frontopolar area, DLPFC, left Broca’s area, and left orbitofrontal area (Ch8, Ch9, Ch10, Ch12, and Ch15) were associated with more than five (including five) drawing coding indexes during the drawing stage. Paper orientation, tinge, number of colors, meaningfulness of the literal description, quality and symbolism of the title, and consistency between drawing and literal words were significantly correlated with the data of only one or zero brain channels. Line quality, drawing space, intensity of the emotion expressed in the drawings, and clarity of the theme of the drawing were significantly correlated with more than five channels (Table 8). Hypothesis 3 was thus partially verified.
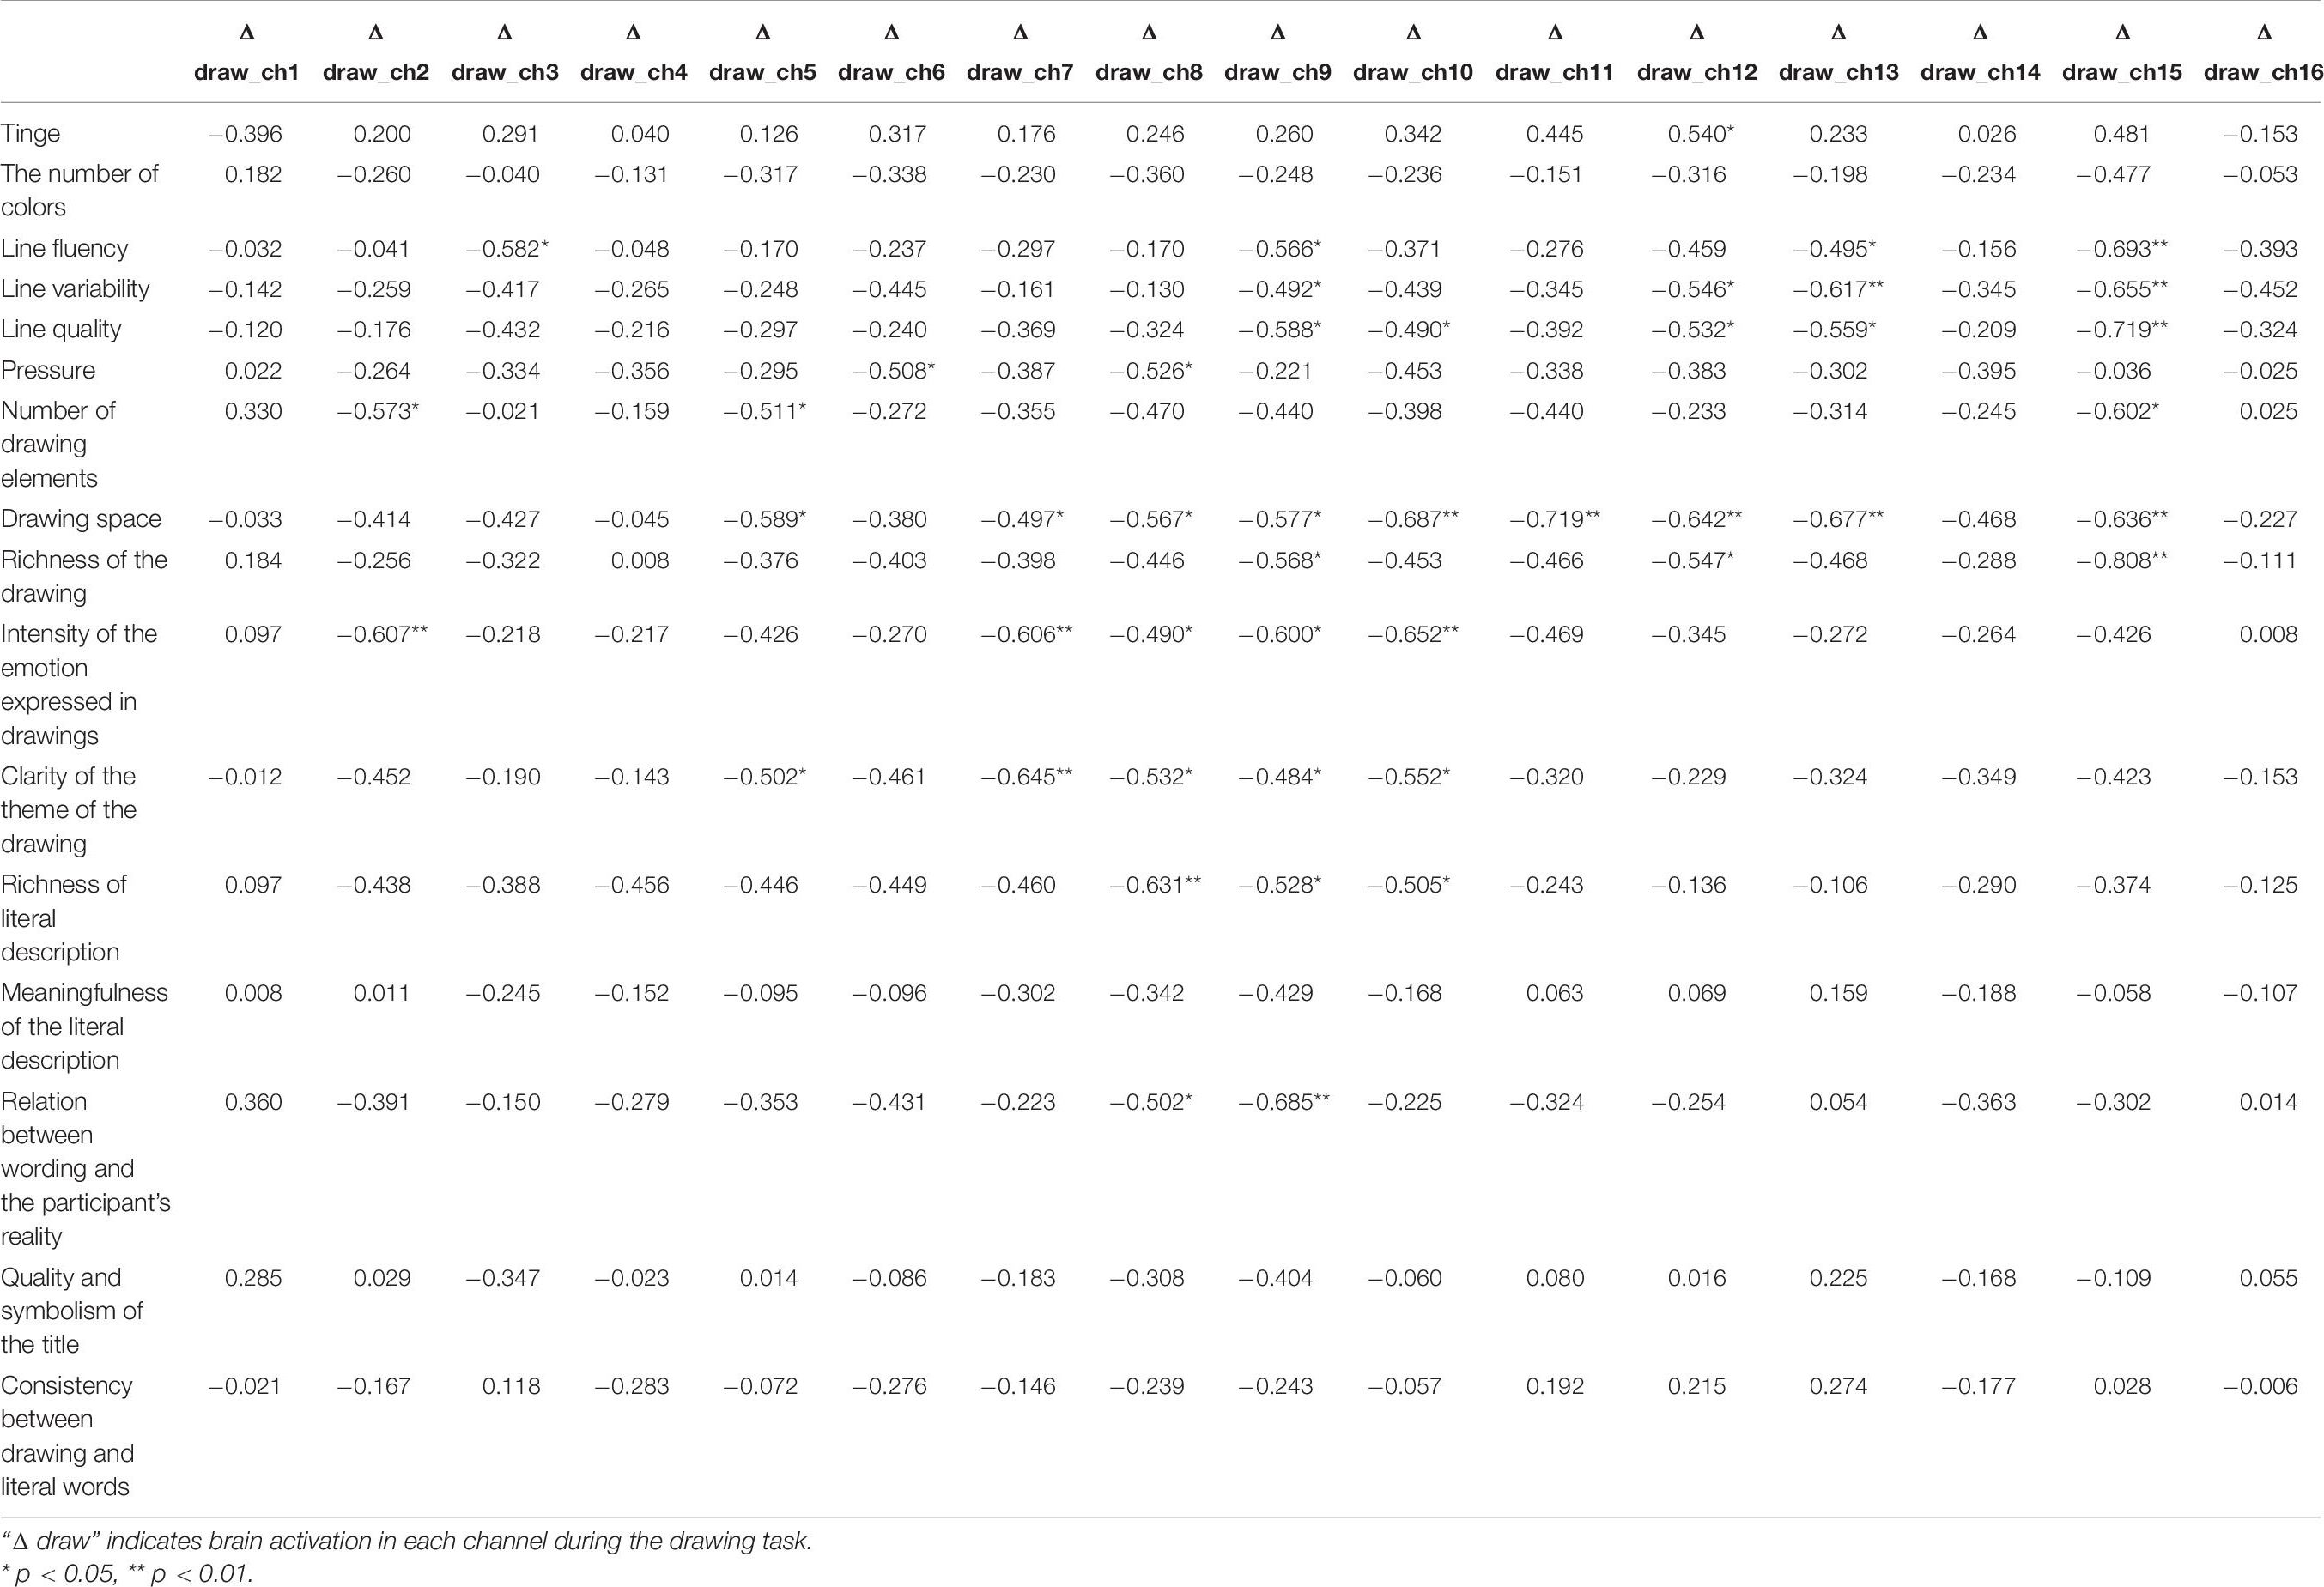
Table 8. Correlation coefficients between drawing coding and brain data in the schizophrenia group during the emotional expression stage.
Correlation analysis of drawing coding with participants’ background information and self-rating scores
Scatter plots were prepared using the drawing coding data as the abscissa coordinate and the self-rated arousal and valence scores of the two groups (for patients with schizophrenia, extra disease information was included) as the vertical coordinate. The fitted results showed that the drawing coding indicators were linearly correlated with self-rated arousal and valence scores of the two groups (and the disease information of schizophrenia patients). And normality test of data showed that most of them did not conform to the normal distribution. Therefore, linear spearman correlation analysis was conducted between drawing coding indicators and self-rated arousal and pleasure scores of the control group after they had watched the film. The results showed a significant positive correlation between arousal and tinge (r = 0.499, p = 0.035) and a significant negative correlation between arousal and drawing space (r = −0.606, p = 0.008). In other words, the higher the emotional arousal of healthy participants, the warmer the tinge and the smaller the drawing space used on the paper. There were significant correlations between pleasure and intensity of the emotion expressed in drawings (r = −0.683, p = 0.002). Specifically, the lower the valence of the participants after watching the film, the higher the intensity of the emotion expressed in drawings.
For patients with schizophrenia, linear correlation analysis was conducted between drawing coding indicators and PANSS (negative) scores, PANSS (positive) scores, general psychopathology, course of disease, and self-rated arousal and pleasure. The results showed no significant correlations between arousal and coding indexes. There was a significant positive correlation between pleasure and line quality (r = 0.486, p = 0.048), indicating that the happier the patients were after watching the film, the higher the quality of the drawing lines was. PANSS (negative) scores were positively correlated with the number of colors (r = 0.532, p = 0.034) while PANSS (positive) scores were significantly correlated with tinge (r = −0.535, p = 0.033), number of colors (r = 0.602, p = 0.014), and number of drawing elements (r = 0.512, p = 0.043), indicating that schizophrenia patients with more symptoms regardless of valence used more kinds of colors but when patients were with more positive symptoms, they used more and colder colors and more elements for drawing. The course of the disease was significantly negatively correlated with the richness of literal description (r = −0.603, p = 0.022) and relation between wording and the participant’s reality (r = −0.557, p = 0.039); thus, a longer illness indicated less verbal description of the drawing and a weaker relation between wording and the participant’s reality (Table 9). From these results, Hypothesis 4 was partially verified.
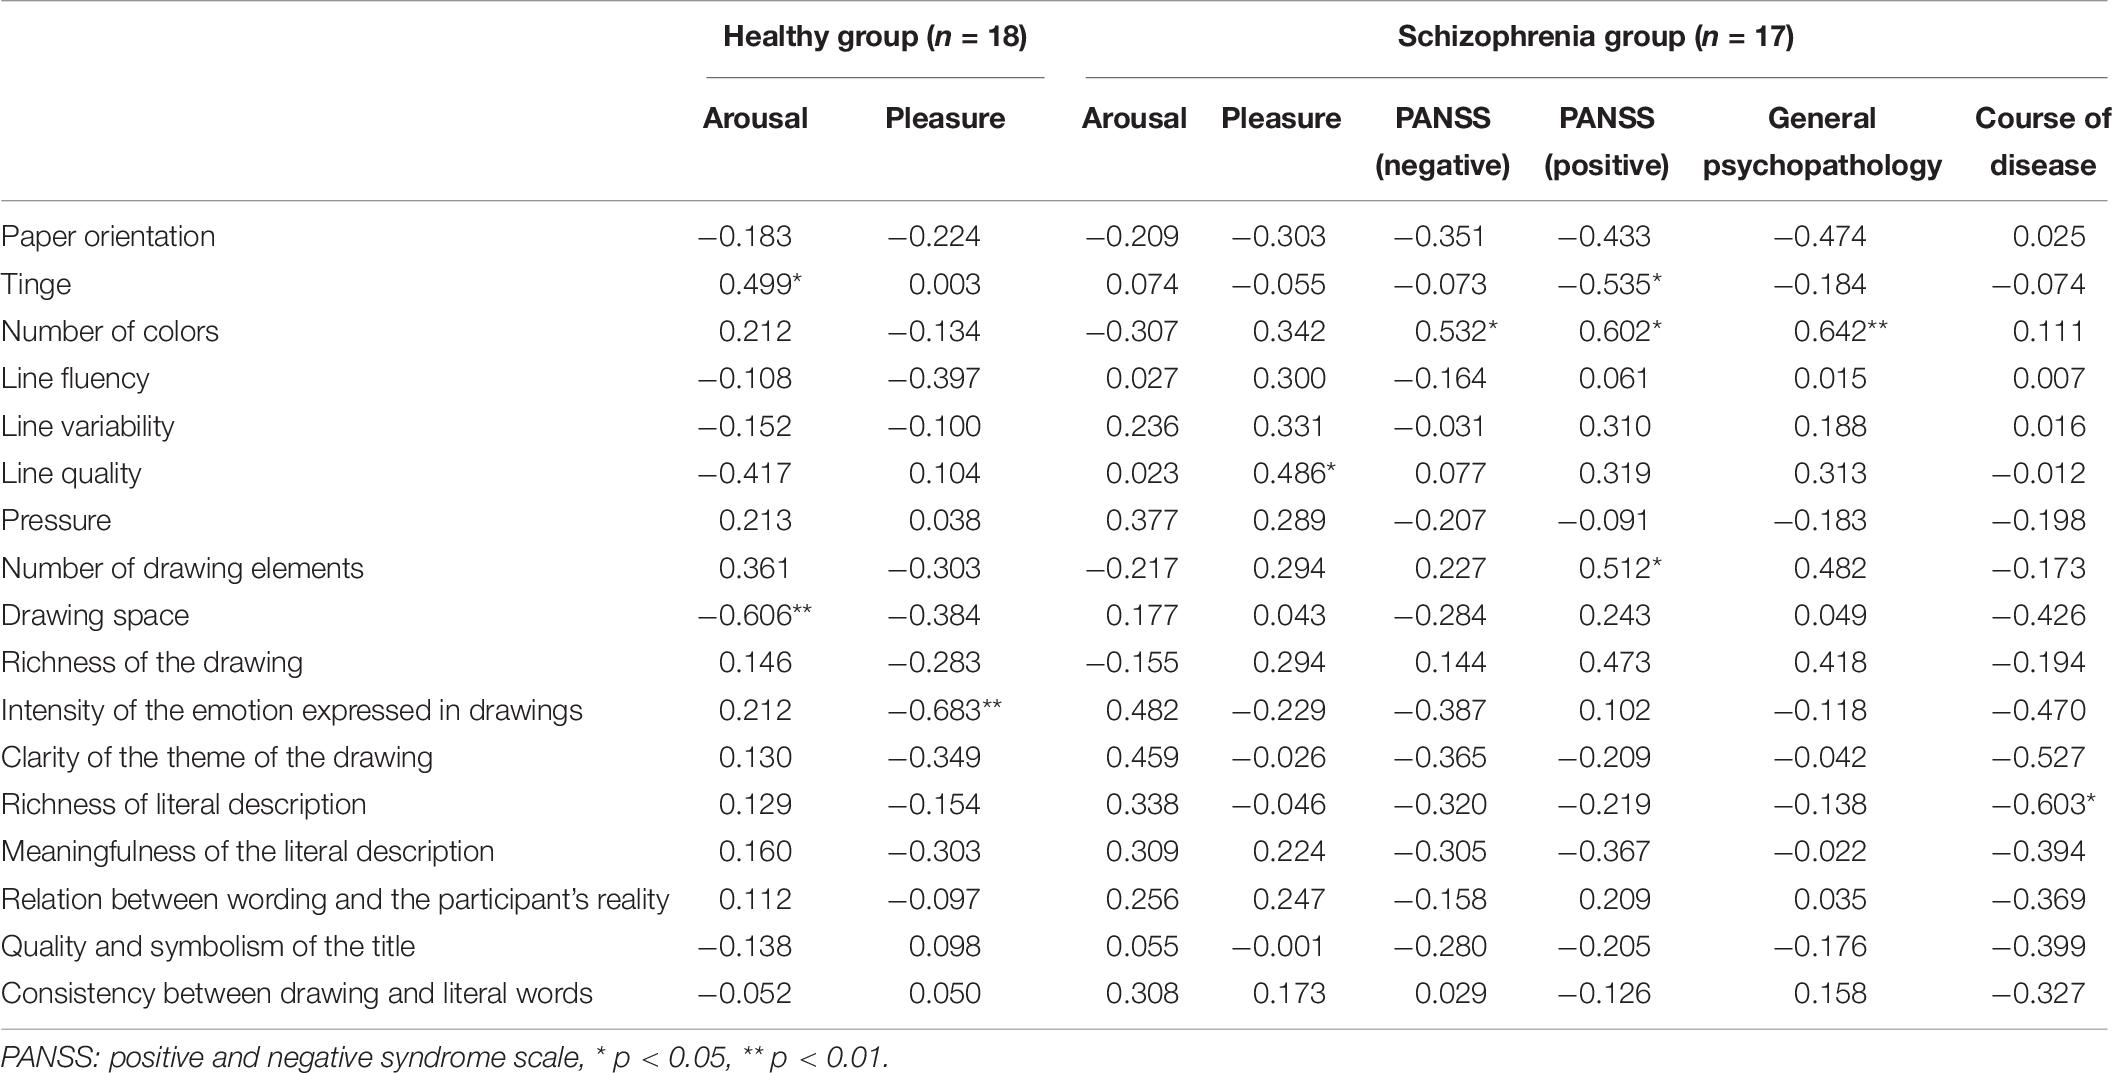
Table 9. Linear correlation coefficients between drawing coding indicators, self-rated arousal and pleasure scores, and disease information.
Discussion
In this study, a movie clip was used to elicit emotions while drawings were used as a way for participants to express emotions. Through the scale and brain activation result data, we verified that there was no significant difference between schizophrenia patients and healthy participants in the experience of anger elicited by the film clip. However, in the expression of anger through drawing, brain activation and drawing results were found to differ significantly between the schizophrenia and healthy groups. The differences in anger expression were evident in the brain data, drawing contents, and interpretation of the drawings. Patients with schizophrenia showed significant negative activation in the Broca’s area, DLPFC, and frontopolar and orbitofrontal areas (Ch1, Ch3, Ch4, Ch6, Ch8, Ch9, Ch10, Ch11, Ch12, and Ch14) whereas those in the control group had significant negative activation in a part of the left Broca’s area (Ch16). We also found significant group differences in the drawing content including in the line variability, the weight of strokes, the number of drawing elements, the richness of the drawing, the intensity of the emotion expressed in drawings, and the clarity of the theme of the drawing. Significant group differences in the wording to describe the drawing were evident in the richness of the literal description, its meaningfulness, the relation between wording and the participant’s reality, the quality and symbolism of the title, and the consistency between the drawing and literal words. In addition, there were significant correlations between emotion experience and emotion expression in the two groups. Correlation analysis of drawing coding and brain activation data showed that the DLPFC and right Broca’s area (Ch2 and Ch8) in the healthy group and the frontopolar area, DLPFC, left Broca’s area, and left orbitofrontal area (Ch8, Ch9, Ch10, Ch12, and Ch15) in patients with schizophrenia were correlated with multiple drawing coding indexes. The results also demonstrated that the emotional intensity of drawings was significantly correlated with the subjective evaluation index of emotion.
Experience of Anger
The results of the affect grid scale showed that both patients with schizophrenia and the healthy group experienced higher arousal and lower pleasure without significant differences in the scores of the two groups. This suggests that both patients with schizophrenia and healthy people experienced anger through watching the movie clips without differences in the degree of anger. This result is similar to that of a previous meta-analysis (Berenbaum and Oltmanns, 1992; Reske et al., 2007; Yan et al., 2012). Changes in HbO concentration during the period of watching the film clip also confirmed this. At the physiological level, there were no differences between the emotion experience of patients with schizophrenia and that of the healthy group, showing comparable brain activation (Kring and Barch, 2014). This confirmed the hypothesis that patients with schizophrenia experienced anger in a normal manner.
Even so, in the process of watching the film, the brain activation patterns of patients with schizophrenia and healthy participants showed significant differences on some channels at some time points. Differences in the process of emotion experience ultimately did not affect the subjective evaluation of emotion experience, and the subjective ratings of emotion experience were similar between the two groups. It may be that the act of watching the film, the constant stimulus of watching it, or the anger depicted in the film itself caused differences in activation or brain connections (Athanassiou et al., 2021) depending on how the two groups experienced the film. Since this study focused on the emotion expression aspect, differences in the process of watching the film will not be discussed in detail. However, these results suggest that there are still some unknown brain activities in the emotion experience of the two groups. In the future, experiments can be designed specifically to elucidate this aspect and explore the differences and their underlying causes.
Brain Mechanisms Underlying Anger Expression Through Drawing
HbO concentrations during emotion expression showed that, compared to the healthy group, patients with schizophrenia showed significant negative activation in many areas of the PFC. This result confirmed that PFC damage affects emotion expression in schizophrenia. The task-induced decrease in brain activity is often called deactivation (Binder, 2012). In this study, blood oxygen concentrations, being lower in the task state than in the resting state, were taken to represent deactivation in the task stage.
In this study, patients with schizophrenia showed more deactivation of brain regions during the drawing process, which may be related to attentional bias. The PFC plays an important role in cognitive control (Miller and Cohen, 2001). Deactivation occurs when active control strategies are important, such as when encoding and actively maintaining cues, or when attentional bias and action preparation are required (Paxton et al., 2008). In this study, the deactivation of many brain regions in the PFC in both groups may be due to the need to maintain attention and suppress other unrelated cues while watching the movie clip and drawing. For patients with schizophrenia, a stronger attentional bias is required to reach the same level as normal individuals, which may cause a stronger deactivation.
In this study, the frontopolar area (BA10) included the frontal pole and part of the mPFC, which is part of the default mode network (DMN)—the brain network in a state of rest when no external task is being processed (Raichle et al., 2001). Most studies suggest that the DMN plays an important role in self-cognition and the detection of environmental attention (Mantini and Vanduffel, 2013; Li and Shu, 2014; Raichle, 2015). Patients with schizophrenia have an abnormal DMN (Abigail G. Garrity et al., 2007), including abnormalities or deactivation in various experimental tasks and excessive activation during the resting state (Broyd et al., 2009; Hu et al., 2017). Therefore, the significant deactivation of BA10-related channels in the experimental group during the emotion expression stage in this study may be due to the abnormal deactivation of the DMN in patients with schizophrenia caused by emotion expression tasks. The DMN is activated during the processing of self-related concepts. The deactivation in this study may be because the patients with schizophrenia did not process self-related information during emotion expression (Raichle et al., 2001; Buckner et al., 2008). The DMN is deactivated when external attention is needed. Therefore, the deactivation in the emotion expression stage in this experiment may reflect that the patients with schizophrenia concentrated their attention on the external world (Li and Shu, 2014)—i.e., they failed to immerse themselves in emotion expression and were still paying attention to stimuli in the external world.
The dorsolateral prefrontal cortex (DLPFC) is associated with a number of higher cognitive functions. It has been suggested that the DLPFC is involved in the cognitive process of monitoring or reporting an individual’s mental state, including spontaneous thoughts and emotion expressions (Castelli et al., 2000). Frith and Frith (1999) proposed that this region is involved in the external expression of the ego state. Drawing, as a projection technology, is a process of concretely expressing the inner state of the individual. This brain region is also involved in the suppression of negative emotions (Anticevic et al., 2010). Deactivation of the DLPFC may indicate that patients with schizophrenia have lower cognitive inhibition of anger, lower attention to anger, and no change in self-cognition due to social factors. Furthermore, cognitive deficits in schizophrenia may be associated with abnormal activation of the DLPFC (Davidson and Heinrichs, 2003; Barch and Ceaser, 2012). For example, DLPFC activation is decreased during the visuospatial working memory maintenance stage in individuals with schizophrenia (Jalbrzikowski et al., 2018) and during active cognitive control tasks (Lesh et al., 2013). In the drawing stage of emotion expression in this study, patients with schizophrenia may have used less active control and expressed their emotions more through drawing, resulting in the DLPFC showing a negative activation state. In addition, the low blood oxygen concentration in the DLPFC may also be because the drawing process is a process of visual stimulation requiring continuous attention, during which the concentration of HbO continues to decrease (Matsuda and Hiraki, 2006).
Characteristics of Using Drawing to Express Emotion
The Characteristics, Similarities, and Differences Between the Schizophrenia and Healthy Groups Using Drawing to Express Emotion
Similarities and differences in drawing characteristics and drawing content between the two groups
Drawing features mainly include drawing layout, color characteristics, and characteristics of lines and strokes. The differences between the two groups were mainly reflected in the latter. Patients with schizophrenia scored lower on line-related measures (fluency, variability, and quality) than the control individuals. This may be related to the low kinesthetic/sensory function of patients with schizophrenia according to the ETC model. These results are consistent with those of previous studies: the line drawing performance of patients with schizophrenia is significantly worse than that of normal control groups (Blyler et al., 1997), and patients with schizophrenia drew shorter clock pointer lines as compared to the control group (Bozikas et al., 2004).
In terms of the drawing contents, the self-rated arousal and valence of the patients with schizophrenia after watching the film were not significantly different from those of the control group. However, the scores for the intensity of emotion expressed and clarity of the theme expressed through the drawings were significantly lower among the patients with schizophrenia compared to those of the control group. This is mainly due to the inability to effectively construct a visual image with intent and to organize the contents of the drawing into an organic whole that clearly reflects the intended theme. This result is also consistent with those from previous studies: the emotion expression and emotion experience of patients with schizophrenia are separated. They show fewer emotion behaviors, but their reported emotion experience is the same as or even higher than that of healthy people (Berenbaum and Oltmanns, 1992; Kring et al., 1993; Kring and Neale, 1996). This may be due to the fact that patients with schizophrenia have difficulty amplifying emotion expression behaviors, which is significantly associated with experiencing negative symptoms, especially apathy (Henry et al., 2007). In the clock drawing test, participants’ performance depends on complete attention, verbal receptivity, executive function (such as planning, organization, parallel processing, and self-health), and visual construction skills (Freedman et al., 1994; Rouleau et al., 1996; Royall et al., 1998). Schizophrenia, on the other hand, causes extensive and multifaceted impairment in many areas of neurocognitive function, including semantic memory, attention, and executive function (Heinrichs and Zakzanis, 1998; Meltzer and McGurk, 1999), as such influencing the expression of emotions through drawing.
Group differences in wording description
There were significant differences between the two groups at the cognitive/symbolic level of the ETC model. Comparing the two groups’ descriptions of the drawings showed that schizophrenia patients’ ability to associate the drawings with the social meaning conveyed was significantly different from that of the healthy participants. The three drawing coding indicators with the highest level of difference between the two groups (d > 2) were related to textual descriptions of the drawing: the relation between text and reality, the quality and symbolism of the drawing, and consistency between drawings and text. For these three codes related to cognition/symbolic hierarchy in the ETC model, patients with schizophrenia scored lower indexes. Symbol function involves the formation of intuition and self-directed concepts, symbolic representation, integrated thinking, symbolic expression, analysis (Kagin and Lusebrink, 1978; Lusebrink, 1990, 1991), links the external entity with the internal image, and can describe the totality of the individual (May, 1960). Compared to the healthy population, patients with schizophrenia exhibit a lack of a sense of reality, a certain degree of loss of self, confusion in self-cognition, and feelings of separation from external entities (American Psychiatric Association, 2013). They further exhibited an inability to connect the reality with the self or connect the text description with the reality of the self to form a symbolic title of quality for their drawings. This suggests that patients with schizophrenia have difficulty associating emotion expressions used in drawings with the social meanings they convey. In addition, because patients with schizophrenia have flights of thought and working memory defects, they cannot actively guide their behavior according to the target information in their working memory (Barch and Ceaser, 2012). This may explain why their drawings and words could not reach a high degree of unity.
In terms of the meaning of verbal descriptions, the performance of patients with schizophrenia was significantly worse than that of healthy groups with a large effect size (d = 1.71). This may be because the participants had fewer words, lacked detailed description, and could not form meaningful descriptions due to problems in executive function, which cause disintegration of language. In addition, anger has the emotional characteristics of narrowing the cognitive range and inhibiting irrelevant information, leading to impulsivity. Healthy people express emotions based on the social environment such that their emotions can adapt to social requirements, whereas patients with schizophrenia may face certain obstacles in this ability. Patients with schizophrenia express their original feelings in a more straightforward—and sometimes violent—manner, regardless of situational or appropriate language.
Group differences in creativity
The fourth level of the ETC model is creativity. This study found that patients with schizophrenia showed lower creativity in drawing and understanding its meaning. The patients with schizophrenia had lower scores than those in the control group in terms of line change, number of elements in the drawing, content richness, clarity of theme, meaningfulness of the text description, and the consistency between text description and the artist’s reality. Previous research on schizophrenia and creativity has been inconclusive. Some studies have found that people with schizophrenia are less creative than healthy groups (Eisenman, 1990), whereas others have reported the opposite result (Jena and Ramachandra, 1995; Kinney et al., 2001; Rubinstein, 2008). Some studies have also found both positive and negative correlations between schizophrenia and creativity (Son et al., 2015). Our results clearly support the findings of the first of the aforementioned studies.
Although there were significant differences in drawing features, drawing contents, and text expression between the schizophrenia and healthy groups, the effect size of differences in the former two features were smaller whereas that of differences in text expression was larger. This is not surprising, given that previous studies have reported language difficulties in patients with schizophrenia (Faber and Reichstein, 1981; Nicolson et al., 2000; Kuperberg and Caplan, 2003; Mitchell and Crow, 2005). Verbal creative expression is particularly challenging for people with schizophrenia when compared to other forms of expression. The DSM-5 defines speech disorder as one of the five major symptoms of schizophrenia, and it is one of the critical criteria for the diagnosis of schizophrenia (American Psychiatric Association, 2013).
Therefore, individuals with schizophrenia have fewer differences from healthy people when using drawings compared to when using words to describe and associate. This also supports the idea that using drawings can help people with schizophrenia express their emotions better.
Relationship Between Emotions Expressed Through Drawing and Brain Activation Data
There was a significant correlation between the drawing data and brain activation data when the two groups expressed emotions. In the healthy group, codes related to the number of colors, line variability, the number of drawing elements, richness of the drawing, clarity of the theme of the drawing, richness of the literal description, and the quality and meaningfulness of the literal description were significantly positively correlated with activation of the right Broca’s area (Ch2) in the drawing stage. The right Broca’s area is primarily responsible for language production and the understanding of action (Nishitani et al., 2005). Therefore, higher richness of literal description, quality and symbolism of the title, and line variability were positively correlated with the activation of Broca’s area, indicating that the higher the degree of activation, the better the performance. Line variability, pressure, drawing space, the meaningfulness and richness of the literal description, and the quality and symbolism of the title were significantly positively associated with the activation of the frontopolar area and a small part of the DLPFC. In other words, the higher the rating score, the stronger the activation in the frontopolar area and in a small part of the DLPFC. Additionally, the frontopolar area plays an important role in the collection of individual internal information (Christoff and Gabrieli, 2000). A meta-analysis also revealed that the mechanism of emotion control depends on the frontal pole (Koch et al., 2018). Therefore, the stronger the frontal pole activation, the better the score of objective indicators of the drawing, and better the ability to express emotions through the drawing. As mentioned earlier, the DLPFC is involved in emotion expression (Castelli et al., 2000) and the external expression of the ego state (Frith and Frith, 1999). In this study, behavioral data and brain activation data were used to further support this point.
In schizophrenia patients, tinge, pressure, line fluency, variability and quality, drawing space, the richness of the drawing, intensity of emotion expressed in the drawing, clarity of the theme of the drawing, richness and meaningfulness of the literal description, and relation between wording and the participant’s reality were negatively correlated with the activation of the frontopolar area and a part of the mPFC (Ch8, Ch9, Ch10, and Ch12). The PFC is deactivated when attentional bias and preparation for action are required (Paxton et al., 2008). Therefore, a higher level of deactivation indicates more attention given to the task and higher drawing rating scores. Line fluency, quality and variability, number of drawing elements, drawing space, and the richness of the drawing were significantly negatively correlated with activation in the left DLPFC and Broca’s area (Ch15). The DLPFC is linked to many higher cognitive processes. Higher levels of deactivation corresponded to better performance on objective indicators for the drawing. Lower DLPFC activation results from active control (Lesh et al., 2013) and corresponded to higher ratings for the drawing. However, the relationship between drawing expression and deactivation of the Broca’s area in patients with schizophrenia is not clear. Future studies can be carried out to further assess the relationship between drawing expression and negative activation of the Broca’s area in patients with schizophrenia.
Limitations
This study has a limited sample size of 17 schizophrenia patients, and its conclusion may not be generalizable. Therefore, further studies should be conducted on a larger sample. Moreover, an affect grid scale was used to assess pleasure and arousal in a short period of time. The indices reflecting high levels of arousal and low levels of pleasure cannot be used to classify anger with fear. Further, we supposed that the film clip, which was used to successfully elicit anger in participants in other studies (Ding et al., 2014; Shi et al., 2015; Shi, 2017), could also be used to elicit anger in our study. Besides we did not set the subjective evaluation measurement of a calm state on the affect grid scale before the emotion experience stage. As such, the emotional state of the participants before watching the film clip was unknown. Therefore, it is unclear whether the experience of anger in participants was due to viewing the film clip or whether it was a pre-existing state of anger in schizophrenia. Although there was no significant difference in average brain activation, patients with schizophrenia showed significantly different activation of some channels compared to the healthy group when watching the film. This may indicate group differences in the process of emotion experience.
The possible effect of medication on negative symptoms (the emotional experience and expression process) (Artaloytia et al., 2006) and fNIRS (Chou et al., 2017) did not include in our consideration in this study. Further should take the medication effect into consideration to control this effect.
This study focused on the activation of the PFC. However, deficits in PFC function in schizophrenia and emotion-related brain regions exist mainly in subcortical structures. And the analysis process use classical method without consider some new methods (Lim et al., 2020). Therefore, future research should combine fMRI and fNIRS to study the brain activation of subcortical structures during emotion experience and expression. In addition, we can enlarge the sample to conduct difference analysis of brain data when drawing in two groups (drawing vertically vs. drawing horizontally), further measure the subjective feelings of emotions after drawing, and compare the influence of emotion expression via drawing on individuals.
Conclusion
There were no differences between patients with schizophrenia and the healthy group in the experience of anger elicited by the film clip, behavioral performance, or overall physiological data. However, there were significant between-group differences in brain activation patterns on some channels at a specific time during the film-clip-watching process. When engaged in a drawing exercise to express anger, the brain activation patterns of patients with schizophrenia were significantly different from those of healthy participants. These differences were mainly reflected in the deactivation of the DLPFC and part of the frontal pole region. There were significant differences between patients with schizophrenia and the healthy group in drawing features, content, and ability to describe the content of the drawings. The effect sizes of the differences in the latter were greater than those of the former two. In terms of emotional expression, the drawing coding data and brain activation data were significantly correlated within the schizophrenia and healthy groups, but the correlation patterns in the two groups differed.
Data Availability Statement
The raw data supporting the conclusions of this article will be made available by the authors, without undue reservation.
Ethics Statement
The studies involving human participants were reviewed and approved by the University Committee on Human Research Protection of East China Normal University, Ethics Committee of Shanghai Changning District Mental Health Center. The patients/participants provided their written informed consent to participate in this study.
Author Contributions
WY was responsible for the overall scheduling, research design, data analysis, and drawing coding system, and contributed to writing and reviewing the manuscript. WJ and LC were responsible for the assessment, grouping, liaison, and arrangement of patients with schizophrenia. CS was responsible for research design, experiment implementation, and data collection. YY analyzed the fNIRS data and contributed to writing. XY contributed to drawing coding, drawing-related data analysis, and writing. All authors contributed to the article and approved the submitted version.
Funding
This is a PI team project sponsored by the Affiliate Mental Health Center and the School of Psychology and Cognitive Science, East China Normal University. Project (201901) supported by Shanghai Changning Mental Health Center, China.
Conflict of Interest
The authors declare that the research was conducted in the absence of any commercial or financial relationships that could be construed as a potential conflict of interest.
Publisher’s Note
All claims expressed in this article are solely those of the authors and do not necessarily represent those of their affiliated organizations, or those of the publisher, the editors and the reviewers. Any product that may be evaluated in this article, or claim that may be made by its manufacturer, is not guaranteed or endorsed by the publisher.
Supplementary Material
The Supplementary Material for this article can be found online at: https://www.frontiersin.org/articles/10.3389/fpsyg.2021.721148/full#supplementary-material
Footnotes
References
Aghevli, M. A., Blanchard, J. J., and Horan, W. P. (2003). The expression and experience of emotion in schizophrenia: a study of social interactions. Psychiatry Res. 119, 261–270. doi: 10.1016/S0165-1781(03)00133-1
Alpert, M., Shaw, R. J., Pouget, E. R., and Lim, K. O. (2002). A comparison of clinical ratings with vocal acoustic measures of flat affect and alogia. J. Psychiatr. Res. 36, 347–353. doi: 10.1016/S0022-3956(02)00016-X
American Psychiatric Association (2013). “Schizophrenia spectrum and other psychotic disorders,” in Diagnostic and Statistical Manual of Mental Disorders, 5th Edn, ed. V. A. Arlington (Washington, DC: American Psychiatric Association). doi: 10.1176/appi.books.9780890425596.dsm02
Anticevic, A., Repovs, G., and Barch, D. M. (2010). Resisting emotional interference: brain regions facilitating working memory performance during negative distraction. Cogn. Affect. Behav. Neurosci. 10, 159–173. doi: 10.3758/CABN.10.2.159
Artaloytia, J. F., Arango, C., Lahti, A., Sanz, J., Pascual, A., Cubero, P., et al. (2006). Negative signs and symptoms secondary to antipsychotics: a double-blind, randomized trial of a single dose of placebo, haloperidol, and risperidone in healthy volunteers. Am. J. Psychiatry 163, 488–493. doi: 10.1176/appi.ajp.163.3.488
Askim, K., and Knardahl, S. (2021). The influence of affective state on subjective-report measurements: evidence from experimental manipulations of mood. Front. Psychol. 12:601083. doi: 10.3389/fpsyg.2021.601083
Athanassiou, M., Dumais, A., Iammatteo, V., De Benedictis, L., Dubreucq, J.-L., and Potvin, S. (2021). The processing of angry faces in schizophrenia patients with a history of suicide: an fMRI study examining brain activity and connectivity. Prog. Neuro Psychopharmacol. Biol. Psychiatry 107:110253. doi: 10.1016/j.pnpbp.2021.110253
Baker, J. M., Liu, N., Cui, X., Vrticka, P., Saggar, M., Hosseini, S. M. H., et al. (2016). Sex differences in neural and behavioral signatures of cooperation revealed by fNIRS hyperscanning. Sci. Rep. 6:26492. doi: 10.1038/srep26492
Balconi, M., Tirelli, S., and Frezza, A. (2015). Event-related potentials (ERPs) and hemodynamic (functional near-infrared spectroscopy, fNIRS) as measures of schizophrenia deficits in emotional behavior. Front. Psychol. 6:1686. doi: 10.3389/fpsyg.2015.01686
Barazzone, N., and Davey, G. C. L. (2009). Anger potentiates the reporting of threatening interpretations: an experimental study. J. Anxiety Disord. 23, 489–495. doi: 10.1016/j.janxdis.2008.10.007
Barch, D. M., and Ceaser, A. (2012). Cognition in schizophrenia: core psychological and neural mechanisms. Trends Cogn. Sci. 16, 27–34. doi: 10.1016/j.tics.2011.11.015
Berenbaum, H., and Oltmanns, T. F. (1992). Emotional experience and expression in schizophrenia and depression. J. Abnorm. Psychol. 101, 37–44. doi: 10.1037//0021-843x.101.1.37
Binder, J. R. (2012). Task-induced deactivation and the “resting” state. NeuroImage 62, 1086–1091. doi: 10.1016/j.neuroimage.2011.09.026
Blyler, C. R., Maher, B. A., Manschreck, T. C., and Fenton, W. S. (1997). Line drawing as a possible measure of lateralized motor performance in schizophrenia. Schizophr. Res. 26, 15–23. doi: 10.1016/s0920-9964(97)00040-6
Bozikas, V. P., Kosmidis, M. H., Gamvrula, K., Hatzigeorgiadou, M., Kourtis, A., and Karavatos, A. (2004). Clock drawing test in patients with schizophrenia. Psychiatry Res. 121, 229–238. doi: 10.1016/j.psychres.2003.07.003
Brennan, P. A., Mednick, S. A., and Hodgins, S. (2000). Major mental disorders and criminal violence in a Danish birth cohort. Arch. Gen. Psychiatry 57, 494–500. doi: 10.1001/archpsyc.57.5.494
Broyd, S. J., Demanuele, C., Debener, S., Helps, S. K., James, C. J., and Sonuga-Barke, E. J. S. (2009). Default-mode brain dysfunction in mental disorders: a systematic review. Neurosci. Biobehav. Rev. 33, 279–296. doi: 10.1016/j.neubiorev.2008.09.002
Buckner, R. L., Andrews-Hanna, J. R., and Schacter, D. L. (2008). The brain’s default network. Ann. N. Y. Acad. Sci. 1124, 1–38. doi: 10.1196/annals.1440.011
Carver, C. S. (2004). Negative affects deriving from the behavioral approach system. Emotion 4, 3–22. doi: 10.1037/1528-3542.4.1.3
Castelli, F., Happé, F., Frith, U., and Frith, C. (2000). Movement and mind: a functional imaging study of perception and interpretation of complex intentional movement patterns. NeuroImage 12, 314–325. doi: 10.1006/nimg.2000.0612
Chou, P. H., Huang, C. J., and Sun, C. W. (2020). The potential role of functional near-infrared spectroscopy as clinical biomarkers in schizophrenia. Curr. Pharm. Des. 26, 201–217. doi: 10.2174/1381612825666191014164511
Chou, P. H., Lin, W. H., Li, W. R., Huang, C. M., and Sun, C. W. (2017). Reduced language lateralization in first episode schizophrenia: a near infrared spectroscopy study. Prog. Neuropsychopharmacol. Biol. Psychiatry 78, 96–104. doi: 10.1016/j.pnpbp.2017.05.001
Christoff, K., and Gabrieli, J. D. E. (2000). The frontopolar cortex and human cognition: evidence for a rostrocaudal hierarchical organization within the human prefrontal cortex. Psychobiology 28, 168–186. doi: 10.3758/BF03331976
Cohen, A. S., and Minor, K. S. (2010). Emotional experience in patients with schizophrenia revisited: meta-analysis of laboratory studies. Schizophr. Bull. 36, 143–150. doi: 10.1093/schbul/sbn061
Cui, X., Bray, S., and Reiss, A. L. (2010). Functional near infrared spectroscopy (NIRS) signal improvement based on negative correlation between oxygenated and deoxygenated hemoglobin dynamics. NeuroImage 49, 3039–3046. doi: 10.1016/j.neuroimage.2009.11.050
Dalebroux, A., Goldstein, T., and Winner, E. (2008). Short-term mood repair through art-making: positive emotion is more effective than venting. Motiv. Emot. 32, 288–295. doi: 10.1007/s11031-008-9105-1
Davidson, L. L., and Heinrichs, R. W. (2003). Quantification of frontal and temporal lobe brain-imaging findings in schizophrenia: a meta-analysis. Psychiatry Res. 122, 69–87. doi: 10.1016/s0925-4927(02)00118-x
Denzin, N. K. (2017). The Research Act: A Theoretical Introduction to Sociological Methods. Piscataway, NJ: Transaction publishers.
Diliberto-Macaluso, K. A., and Stubblefield, B. L. (2015). The use of painting for short-term mood and arousal improvement. Psychol. Aesthet. Creat. Arts 9, 228–234. doi: 10.1037/a0039237
Ding, R., Wang, F., Niu, D., and Li, B. (2014). The effect of emotions associated with certainty (happiness, anger) and uncertainty (sadness) on trust (in Chinese: 高确定性情绪(开心、愤怒)与低确定性情绪(悲伤)对信任的影响). J. Psychol. Sci. 37, 1092–1099.
Eisenman, R. (1990). Creativity, preference for complexity, and physical and mental illness. Creat. Res. J. 3, 231–236.
Faber, R., and Reichstein, M. B. (1981). Language dysfunction in schizophrenia. Br. J. Psychiatry 139, 519.
Fassino, S., Amianto, F., Gastaldo, L., and Leombruni, P. (2009). Anger and functioning amongst inpatients with schizophrenia or schizoaffective disorder living in a therapeutic community. Psychiatry Clin. Neurosci. 63, 186–194. doi: 10.1111/j.1440-1819.2009.01940.x
Feldman Barrett, L., and Russell, J. A. (1998). Independence and bipolarity in the structure of current affect. J. Pers. Soc. Psychol. 74, 967–984. doi: 10.1037/0022-3514.74.4.967
Ferrari, M., and Quaresima, V. (2012). A brief review on the history of human functional near-infrared spectroscopy (fNIRS) development and fields of application. NeuroImage 63, 921–935. doi: 10.1016/j.neuroimage.2012.03.049
Freedman, M., Leach, L., Kaplan, E., Shulman, K., and Delis, D. C. (1994). Clock Drawing: A Neuropsychological Analysis. Oxford: Oxford University Press.
Frith, C. D., and Frith, U. (1999). Interacting minds–a biological basis. Science 286, 1692–1695. doi: 10.1126/science.286.5445.1692
Gaebel, W., and Wölwer, W. (2004). Facial expressivity in the course of schizophrenia and depression. Eur. Arch. Psychiatry Clin. Neurosci. 254, 335–342. doi: 10.1007/s00406-004-0510-5
Garrity, A. G., Pearlson, G. D., McKiernan, K., Lloyd, D., Kiehl, K. A., and Calhoun, V. D. (2007). Aberrant “default mode” functional connectivity in schizophrenia. Am. J. Psychiatry 164, 450–457. doi: 10.1176/ajp.2007.164.3.450
Gross, J. J., and Levenson, R. W. (1995). Emotion elicitation using films. Cogn. Emot. 9, 87–108. doi: 10.1080/02699939508408966
Gühne, U., Weinmann, S., Arnold, K., Ay, E. S., Becker, T., and Riedel-Heller, S. (2012). Künstlerische therapien bei schweren psychischen Störungen. Nervenarzt 83, 855–860. doi: 10.1007/s00115-011-3472-7
Guseva, E. (2018). Bridging art therapy and neuroscience: emotional expression and communication in an individual with late-stage Alzheimer’s. Art Ther. 35, 138–147. doi: 10.1080/07421656.2018.1524260
Halberstadt, A. G., Denham, S. A., and Dunsmore, J. C. (2001). Affective social competence. Soc. Dev. 10, 79–119. doi: 10.1111/1467-9507.00150
Heinrichs, R. W., and Zakzanis, K. K. (1998). Neurocognitive deficit in schizophrenia: a quantitative review of the evidence. Neuropsychology 12:426.
Henry, J. D., Green, M. J., de Lucia, A., Restuccia, C., McDonald, S., and O’Donnell, M. (2007). Emotion dysregulation in schizophrenia: reduced amplification of emotional expression is associated with emotional blunting. Schizophr. Res. 95, 197–204.
Hinz, L. D. (2018). Expressive Therapies Continuum: A Framework for Using Art in Therapy. Taipei: Hung Yeh Publishing.
Hoshi, Y., Kobayashi, N., and Tamura, M. (2001). Interpretation of near-infrared spectroscopy signals: a study with a newly developed perfused rat brain model. J. Appl. Physiol. 90, 1657–1662. doi: 10.1152/jappl.2001.90.5.1657
Hu, M.-L., Zong, X.-F., Mann, J. J., Zheng, J.-J., Liao, Y.-H., Li, Z.-C., et al. (2017). A review of the functional and anatomical default mode network in schizophrenia. Neurosci. Bull. 33, 73–84. doi: 10.1007/s12264-016-0090-1
Izard, C. (2007). Basic emotions, natural kinds, emotion schemas, and a new paradigm. Perspect. Psychol. Sci. 2:260. doi: 10.1111/j.1745-6916.2007.00044.x
Jaeger, S. R., Roigard, C. M., and Chheang, S. L. (2021). The valence × arousal circumplex-inspired emotion questionnaire (CEQ): effect of response format and question layout. Food Qual. Prefer. 90:104172. doi: 10.1016/j.foodqual.2020.104172
Jalbrzikowski, M., Murty, V. P., Stan, P. L., Saifullan, J., Simmonds, D., Foran, W., et al. (2018). Differentiating between clinical and behavioral phenotypes in first-episode psychosis during maintenance of visuospatial working memory. Schizophr. Res. 197, 357–364. doi: 10.1016/j.schres.2017.11.012
Jang, K., Tak, S., Jung, J., Jang, J., Jeong, Y., and Ye, J. C. (2009). Wavelet minimum description length detrending for near-infrared spectroscopy. J. Biomed. Opt. 14:034004. doi: 10.1117/1.3127204
Jena, S., and Ramachandra, S. (1995). Creativity among schizophrenics and non-psychiatric individuals. J. Pers. Clin. Stud. 11, 59–64.
Jiang, J., Dai, B., Peng, D., Zhu, C., Liu, L., and Lu, C. (2012). Neural synchronization during face-to-face communication. J. Neurosci. 32, 16064–16069. doi: 10.1523/jneurosci.2926-12.2012
Kagin, S. L., and Lusebrink, V. B. (1978). The expressive therapies continuum. Art Psychother. 5, 171–180. doi: 10.1016/0090-9092(78)90031-5
Kaimal, G., Ayaz, H., Herres, J., Dieterich-Hartwell, R., Makwana, B., Kaiser, D. H., et al. (2017). Functional near-infrared spectroscopy assessment of reward perception based on visual self-expression: coloring, doodling, and free drawing. Arts Psychother. 55, 85–92. doi: 10.1016/j.aip.2017.05.004
Kay, S. R., Fiszbein, A., and Opler, L. A. (1987). The positive and negative syndrome scale (PANSS) for schizophrenia. Schizophr. Bull. 13, 261–276. doi: 10.1093/schbul/13.2.261
Keltner, D., Sauter, D., Tracy, J., and Cowen, A. (2019). Emotional expression: advances in basic emotion theory. J. Nonverbal Behav. 43, 133–160. doi: 10.1007/s10919-019-00293-3
King, J., and Kaimal, G. (2019). Approaches to research in art therapy using imaging technologies. Front. Hum. Neurosci. 13:159. doi: 10.3389/fnhum.2019.00159
Kinney, D. K., Richards, R., Lowing, P. A., LeBlanc, D., Zimbalist, M. E., and Harlan, P. (2001). Creativity in offspring of schizophrenic and control parents: an adoption study. Creat. Res. J. 13, 17–25.
Koch, S. B. J., Mars, R. B., Toni, I., and Roelofs, K. (2018). Emotional control, reappraised. Neurosci. Biobehav. Rev. 95, 528–534. doi: 10.1016/j.neubiorev.2018.11.003
Kring, A. M., and Barch, D. M. (2014). The motivation and pleasure dimension of negative symptoms: neural substrates and behavioral outputs. Eur. Neuropsychopharmacol. 24, 725–736. doi: 10.1016/j.euroneuro.2013.06.007
Kring, A. M., and Caponigro, J. M. (2010). Emotion in Schizophrenia. Curr. Dir. Psychol. Sci. 19, 255–259. doi: 10.1177/0963721410377599
Kring, A. M., and Moran, E. K. (2008). Emotional response deficits in schizophrenia: insights from affective science. Schizophr. Bull. 34, 819–834. doi: 10.1093/schbul/sbn071
Kring, A. M., and Neale, J. M. (1996). Do schizophrenic patients show a disjunctive relationship among expressive, experiential, and psychophysiological components of emotion? J. Abnorm. Psychol. 105:249.
Kring, A. M., Kerr, S. L., Smith, D. A., and Neale, J. M. (1993). Flat affect in schizophrenia does not reflect diminished subjective experience of emotion. J. Abnorm. Psychol. 102:507.
Kumar, V., Shivakumar, V., Chhabra, H., Bose, A., Venkatasubramanian, G., and Gangadhar, B. N. (2017). Functional near infra-red spectroscopy (fNIRS) in schizophrenia: a review. Asian J. Psychiatry 27, 18–31. doi: 10.1016/j.ajp.2017.02.009
Kuperberg, G., and Caplan, D. (2003). “Language dysfunction in schizophrenia,” in Neuropsychiatry, eds R. B. Schiffer, S. M. Rao, and B. S. Fogel (Philadelphia, PA: Lippincott Williams and Wilkins), 444–466.
Lee, S.-Y., Kim, M.-D., Seo, J. S., Lee, K., Jon, D.-I., and Bahk, W.-M. (2019). The effects of group arts therapy based on emotion management training on the emotional expression, alexithymia, depression, and quality of life in patients with schizophrenia. Schizophr. Bull. 45(Suppl. 2):S243. doi: 10.1093/schbul/sbz019.383
Lesh, T. A., Westphal, A. J., Niendam, T. A., Yoon, J. H., Minzenberg, M. J., Ragland, J. D., et al. (2013). Proactive and reactive cognitive control and dorsolateral prefrontal cortex dysfunction in first episode schizophrenia. Neuroimage Clin. 2, 590–599. doi: 10.1016/j.nicl.2013.04.010
Leucht, S., Kane, J. M., Kissling, W., Hamann, J., Etschel, E., and Engel, R. R. (2005). What does the PANSS mean? Schizophr. Res. 79, 231–238. doi: 10.1016/j.schres.2005.04.008
Levin, S., Hall, J. A., Knight, R. A., and Alpert, M. (1985). Verbal and nonverbal expression of affect in speech of schizophrenic and depressed patients. J. Abnorm. Psychol. 94, 487–497. doi: 10.1037//0021-843x.94.4.487
Li, Y., and Shu, H. (2014). The brain mechanisms and functional hypothesis of default mode network and its clinical application (in Chinese: 默认网络的神经机制、功能假设及临床应用). Adv. Psychol. Sci. 22, 234–249.
Lim, L. G., Ung, W. C., Chan, Y. L., Lu, C. K., Sutoko, S., Funane, T., et al. (2020). A unified analytical framework with multiple fnirs features for mental workload assessment in the prefrontal cortex. IEEE Trans. Neural Syst. Rehabil. Eng. 28, 2367–2376. doi: 10.1109/TNSRE.2020.3026991
Lusebrink, V. B. (1991). A systems oriented approach to the expressive therapies: the expressive therapies continuum. Arts Psychother. 18, 395–403.
Lusebrink, V. B., and Hinz, L. D. (2020). Cognitive and symbolic aspects of art therapy and similarities with large scale brain networks. Art Ther. 37, 113–122. doi: 10.1080/07421656.2019.1691869
Ma, H., Chen, S., Fu, C., Zheng, H., Zhang, C., and Wu, X. (2013). Relationship between psychological state and house—tree—person drawing characteristics of rehabilitation patients with schizophrenia. Chin. Gen. Pract. 16, 2293–2295.
Mantini, D., and Vanduffel, W. (2013). Emerging roles of the brain’s default network. Neuroscientist 19, 76–87. doi: 10.1177/1073858412446202
Matsuda, G., and Hiraki, K. (2006). Sustained decrease in oxygenated hemoglobin during video games in the dorsal prefrontal cortex: a NIRS study of children. NeuroImage 29, 706–711. doi: 10.1016/j.neuroimage.2005.08.019
McDonald, N. M., Perdue, K. L., Eilbott, J., Loyal, J., Shic, F., and Pelphrey, K. A. (2019). Infant brain responses to social sounds: a longitudinal functional near-infrared spectroscopy study. Dev. Cogn. Neurosci. 36:100638. doi: 10.1016/j.dcn.2019.100638
Meltzer, H. Y., and McGurk, S. R. (1999). The effects of clozapine, risperidone, and olanzapine on cognitive function in schizophrenia. Schizophr. Bull. 25, 233–256.
Miller, E. K., and Cohen, J. D. (2001). An integrative theory of prefrontal cortex function. Annu. Rev. Neurosci. 24, 167–202. doi: 10.1146/annurev.neuro.24.1.167
Mitchell, R. L., and Crow, T. J. (2005). Right hemisphere language functions and schizophrenia: the forgotten hemisphere? Brain 128, 963–978.
Nakano, S., Shoji, Y., Morita, K., Igimi, H., Sato, M., Ishii, Y., et al. (2018). Comparison of changes in oxygenated hemoglobin during the tree-drawing task between patients with schizophrenia and healthy controls. Neuropsychiatr. Dis. Treat. 14, 1071–1082. doi: 10.2147/ndt.s159984
Ni, K., Zou, Y.-M., and Chan, R. C. (2017). Pleasure experience, emotion expression and regulation in schizophrenia: a review (in Chinese: 精神分裂症患者的情绪体验、表达与调节). Chin. Mental Health J. 31, 432–435.
Nicolson, R., Lenane, M., Singaracharlu, S., Malaspina, D., Giedd, J. N., Hamburger, S. D., et al. (2000). Premorbid speech and language impairments in childhood-onset schizophrenia: association with risk factors. Am. J. Psychiatry 157, 794–800.
Nishitani, N., Schurmann, M., Amunts, K., and Hari, R. (2005). Broca’s region: from action to language. Physiology 20, 60–69. doi: 10.1152/physiol.00043.2004
Olderbak, S. G., Geiger, M., Hauser, N. C., Mokros, A., and Wilhelm, O. (2021). Emotion expression abilities and psychopathy. Pers. Disord. doi: 10.1037/per0000444 [Epub ahead of print].
Oorschot, M., Lataster, T., Thewissen, V., Lardinois, M., Wichers, M., van Os, J., et al. (2013). Emotional experience in negative symptoms of schizophrenia–no evidence for a generalized hedonic deficit. Schizophr. Bull. 39, 217–225. doi: 10.1093/schbul/sbr137
Paxton, J. L., Barch, D. M., Racine, C. A., and Braver, T. S. (2008). Cognitive control, goal maintenance, and prefrontal function in healthy aging. Cereb. Cortex 18, 1010–1028. doi: 10.1093/cercor/bhm135
Pinti, P., Tachtsidis, I., Hamilton, A., Hirsch, J., Aichelburg, C., Gilbert, S., et al. (2020). The present and future use of functional near-infrared spectroscopy (fNIRS) for cognitive neuroscience. Ann. N. Y. Acad. Sci. 1464, 5–29. doi: 10.1111/nyas.13948
Preacher, K. J., and Hayes, A. F. (2008). Asymptotic and resampling strategies for assessing and comparing indirect effects in multiple mediator models. Behav. Res. Methods 40, 879–891.
Qiu, H.-Z., Ye, Z.-J., Liang, M.-Z., Huang, Y.-Q., Liu, W., and Lu, Z.-D. (2017). Effect of an art brut therapy program called go beyond the schizophrenia (GBTS) on prison inmates with schizophrenia in mainland China—a randomized, longitudinal, and controlled trial. Clin. Psychol. Psychother. 24, 1069–1078. doi: 10.1002/cpp.2069
Raichle, M. E. (2015). The brain’s default mode network. Annu. Rev. Neurosci. 38, 433–447. doi: 10.1146/annurev-neuro-071013-014030
Raichle, M. E., MacLeod, A. M., Snyder, A. Z., Powers, W. J., Gusnard, D. A., and Shulman, G. L. (2001). A default mode of brain function. Proc. Natl. Acad. Sci. U.S.A. 98, 676–682. doi: 10.1073/pnas.98.2.676
Reske, M., Kellermann, T., Habel, U., Jon Shah, N., Backes, V., von Wilmsdorff, M., et al. (2007). Stability of emotional dysfunctions? A long-term fMRI study in first-episode schizophrenia. J. Psychiatr. Res. 41, 918–927. doi: 10.1016/j.jpsychires.2007.02.009
Reyna-Martinez, M., Gonzalez-Romo, R. A., and Lopez, J. A. (2019). Case study: art therapy care to primary caregiver, mother of a child with leukemia to promote emotional expression and functional coping. Arteter. Pap. Arteter. Educ. Art. Incl. Soc. 14, 131–146. doi: 10.5209/arte.65092
Rouleau, I., Salmon, D. P., and Butters, N. (1996). Longitudinal analysis of clock drawing in Alzheimer’s disease patients. Brain Cogn. 31, 17–34.
Royall, D. R., Cordes, J. A., and Polk, M. (1998). CLOX: an executive clock drawing task. J. Neurol. Neurosurg. Psychiatry 64, 588–594.
Rubinstein, G. (2008). Are schizophrenic patients necessarily creative? A comparative study between three groups of psychiatric inpatients. Pers. Individ. Dif. 45, 806–810.
Russell, J. A., and Barrett, L. F. (1999). Core affect, prototypical emotional episodes, and other things called emotion: dissecting the elephant. J. Pers. Soc. Psychol. 76, 805–819. doi: 10.1037/0022-3514.76.5.805
Russell, J. A., Weiss, A., and Mendelsohn, G. A. (1989). Affect grid: a single-item scale of pleasure and arousal. J. Pers. Soc. Psychol. 57, 493–502. doi: 10.1037/0022-3514.57.3.493
Schultz, S. H., North, S. W., and Shields, C. G. (2007). Schizophrenia: a review. Am. Fam. Physician 75, 1821–1829.
Shi, T. (2017). fNIRS Study on the Influence of Anger on Creative Cognitive Processes (in Chinese: 愤怒情绪影响创造性认知过程的fNIRS研究) [Master thesis]. Xi’an: Shaanxi Normal University.
Shi, Y., Xu, F., Li, Y., and Liu, C. (2015). The impact of specific negative emotions on the framing effect (in Chinese: 具体负性情绪对框架效应的影响). Psychol. Res. 8, 18–25.
Shin, J., Müller, K.-R., and Hwang, H.-J. (2016). Near-infrared spectroscopy (NIRS)-based eyes-closed brain-computer interface (BCI) using prefrontal cortex activation due to mental arithmetic. Sci. Rep. 6:36203. doi: 10.1038/srep36203
Singh, A. K., and Dan, I. (2006). Exploring the false discovery rate in multichannel NIRS. NeuroImage 33, 542–549. doi: 10.1016/j.neuroimage.2006.06.047
Small, D. A., and Lerner, J. S. (2008). Emotional policy: personal sadness and anger shape judgments about a welfare case. Polit. Psychol. 29, 149–168. doi: 10.1111/j.1467-9221.2008.00621.x
Son, S., Kubota, M., Miyata, J., Fukuyama, H., Aso, T., Urayama, S.-I., et al. (2015). Creativity and positive symptoms in schizophrenia revisited: structural connectivity analysis with diffusion tensor imaging. Schizophr. Res. 164, 221–226.
Strauss, G. P., and Herbener, E. S. (2011). Patterns of emotional experience in schizophrenia: differences in emotional response to visual stimuli are associated with clinical presentation and functional outcome. Schizophr. Res. 128, 117–123. doi: 10.1016/j.schres.2011.01.010
Stuss, D., Gow, C., and Hetherington, C. (1992). “No longer gage”: frontal lobe dysfunction and emotional changes. J. Consult. Clin. Psychol. 60, 349–359. doi: 10.1037//0022-006X.60.3.349
Tak, S., and Ye, J. C. (2014). Statistical analysis of fNIRS data: a comprehensive review. NeuroImage 85, 72–91. doi: 10.1016/j.neuroimage.2013.06.016
Tong, J., Yu, W., Fan, X., Sun, X., Zhang, J., Zhang, J., et al. (2021). Impact of group art therapy using traditional chinese materials on self-efficacy and social function for individuals diagnosed with schizophrenia. Front. Psychol. 11:571124. doi: 10.3389/fpsyg.2020.571124
Trémeau, F. (2006). A review of emotion deficits in schizophrenia. Dialogues Clin. Neurosci. 8, 59–70. doi: 10.31887/DCNS.2006.8.1/ftremeau
Van Os, J., and Kapur, S. (2009). Schizophrenia. Lancet 374, 635–645. doi: 10.1016/S0140-6736(09)60995-8
van’t Wout, M., Chang, L. J., and Sanfey, A. G. (2010). The influence of emotion regulation on social interactive decision-making. Emotion 10, 815–821. doi: 10.1037/a0020069
Volavka, J. (1999). The neurobiology of violence. J. Neuropsychiatry Clin. Neurosci. 11, 307–314. doi: 10.1176/jnp.11.3.307
Xia, M., Wang, J., and He, Y. (2013). BrainNet viewer: a network visualization tool for human brain connectomics. PLoS One 8:e68910. doi: 10.1371/journal.pone.0068910
Yan, C., Cao, Y., Zhang, Y., Song, L.-L., Cheung, E. F. C., and Chan, R. C. K. (2012). Trait and state positive emotional experience in schizophrenia: a meta-analysis. PLoS One 7:e40672. doi: 10.1371/journal.pone.0040672
Yan, W., Zhang, M., and Liu, Y. (2021). Regulatory effect of drawing on negative emotion: a functional near-infrared spectroscopy study. Arts Psychother. 74:101780. doi: 10.1016/j.aip.2021.101780
Ye, J. C., Tak, S., Jang, K., Jung, J., and Jang, J. (2009). NIRS-SPM: statistical parametric mapping for near infrared spectroscopy. NeuroImage 44, 428–447. doi: 10.1117/12.762291
Zhang, Y., Meng, T., Hou, Y., Pan, Y., and Hu, Y. (2018). Interpersonal brain synchronization associated with working alliance during psychological counseling. Psychiatry Res. 282, 103–109. doi: 10.1016/j.pscychresns.2018.09.007
Zheng, P., Liu, C., and Yu, G. (2012). An overview of mood-induction methods (in Chinese: 情绪诱发方法述评). Adv. Psychol. Sci. 20, 45–55.
Keywords: schizophrenia, emotion experience, drawing, anger, fNIRS, emotion expression
Citation: Yan W, Ji W, Su C, Yu Y, Yu X and Chen L (2021) Anger Experience and Anger Expression Through Drawing in Schizophrenia: An fNIRS Study. Front. Psychol. 12:721148. doi: 10.3389/fpsyg.2021.721148
Received: 06 June 2021; Accepted: 09 August 2021;
Published: 01 September 2021.
Edited by:
Yizhang Jiang, Jiangnan University, ChinaReviewed by:
Po-Han Chou, China Medical University Hsinchu Hospital, TaiwanRihui Li, Stanford University, United States
Laura Angioletti, Catholic University of the Sacred Heart, Italy
Tong Boon Tang, University of Technology Petronas, Malaysia
Copyright © 2021 Yan, Ji, Su, Yu, Yu and Chen. This is an open-access article distributed under the terms of the Creative Commons Attribution License (CC BY). The use, distribution or reproduction in other forums is permitted, provided the original author(s) and the copyright owner(s) are credited and that the original publication in this journal is cited, in accordance with accepted academic practice. No use, distribution or reproduction is permitted which does not comply with these terms.
*Correspondence: Wenhua Yan, whyan@psy.ecnu.edu.cn