
- 1 Department of Psychology, The University of Oklahoma, Norman, OK, USA
- 2 Department of Psychological and Brain Sciences, Indiana University, Bloomington, IN, USA
Research has shown that visual speech perception can assist accuracy in identification of spoken words. However, little is known about the dynamics of the processing mechanisms involved in audiovisual integration. In particular, architecture and capacity, measured using response time methodologies, have not been investigated. An issue related to architecture concerns whether the auditory and visual sources of the speech signal are integrated “early” or “late.” We propose that “early” integration most naturally corresponds to coactive processing whereas “late” integration corresponds to separate decisions parallel processing. We implemented the double factorial paradigm in two studies. First, we carried out a pilot study using a two-alternative forced-choice discrimination task to assess architecture, decision rule, and provide a preliminary assessment of capacity (integration efficiency). Next, Experiment 1 was designed to specifically assess audiovisual integration efficiency in an ecologically valid way by including lower auditory S/N ratios and a larger response set size. Results from the pilot study support a separate decisions parallel, late integration model. Results from both studies showed that capacity was severely limited for high auditory signal-to-noise ratios. However, Experiment 1 demonstrated that capacity improved as the auditory signal became more degraded. This evidence strongly suggests that integration efficiency is vitally affected by the S/N ratio.
Introduction
When someone utilizes lip-reading to take advantage of both auditory and visual modalities, how is this accomplished? Research shows that even normal-hearing individuals benefit in accuracy from bimodal information in low-to-moderate signal-to-noise ratio conditions (e.g., Sumby and Pollack, 1954). Speech perception is a multimodal perceptual phenomenon that relies on auditory, visual, and even haptic information as inputs to the system where word recognition is the output (e.g., McGurk and MacDonald, 1976; Massaro, 1987; Fowler and Dekle, 1991). Multimodal perception has become an area of burgeoning interest in sensory and cognitive areas of psychology. Yet, the real-time processing mechanisms of lip-reading and how they relate to auditory word perception remain opaque (see Jesse and Massaro, 2010, for a recent study using the gating paradigm). Due to the very different methodologies used, the great mass of work in the audiovisual literature does not speak to the issues we investigate in this study1.
Within the domain of response times (RTs), theory-driven methodologies have been developed to identify key processing characteristics applicable to bimodal speech perception (e.g., Townsend and Nozawa, 1995; Townsend and Wenger, 2004a). A problem of interest that will be described in the following sections concerns whether the information from the auditory and visual modalities is combined or “integrated” in the early stages of processing, or rather in later stages after phoneme, syllable, or even word recognition. These issues are important in building a theory of multimodal speech perception since ultimately they must be specified in any real-time processing system. However, no determinations of these processing issues have been made in the area of audiovisual speech perception and few have been made in general studies of multimodal processing. Research involving non-speech multisensory stimuli in detection tasks has shown evidence for early bimodal interactions (see Barutchu et al., 2009; Barutchu et al., 2010 for studies using children and adults). Other examples include: Miller (1982, 1986) who used pure tones and dots, Berryhill et al., 2007 (see also Fournier and Eriksen, 1990) who used images of numerals/letters plus sounds, and Molholm et al. (2004) who used still images of animals combined with vocalizations. A brief introduction to the systems factorial technology components pertinent to audiovisual speech processing will now be provided. More rigorous definitions shall appear later. Specific relationships to bimodal speech perception noted immediately thereafter.
First, architecture refers to whether bimodal channels are operating in parallel or in a coactive fashion (see Townsend and Wenger, 2004a; see also Miller, 1982)2. Also, certain types of parallel systems can also be experimentally discriminated from one another, such as separate decisions versus coactive where information is pooled into a final conduit (see Figure 1). Certainly, the peripheral physiological tributaries transmit sensory information in parallel to begin with, but the exact mechanisms and the higher order real-time properties required for various psychological tasks, such as processing of linguistic information from different modalities, remain unknown. A schematic diagram of potential models of audiovisual speech processing is shown in Figure 1. These include a parallel model in which auditory and visual linguistic information can be recognized separately in distinct auditory and visual pathways or channels. Second, a coactive model is shown, which assumes that auditory and visual speech information are combined and translated into a common code (and therefore, any decision is made on the combined information). Finally, Figure 1 displays the schematics of a serial model.
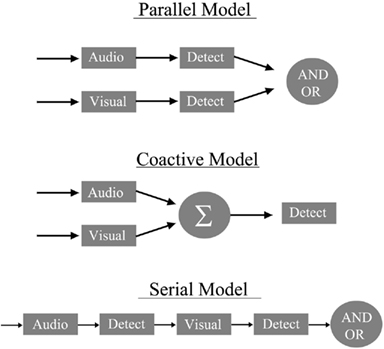
Figure 1. A diagram of a parallel model (top) with an OR and AND gate (See also Townsend and Nozawa, 1995 for a similar diagram). The coactive model below assumes that each channel is pooled into a common processor where evidence is accumulated prior to the decision stage. Lastly, the figure depicts a serial model, which assumes that processing does not begin on the second modality until it finishes processing on the first.
Another important feature of the system concerns its workload capacity. This refers to how the system responds to an increase in workload. Just as it can be expected that processing is parallel when visual and acoustic elements of speech sounds are processed together, a natural prediction is that visual and acoustic forms of a speech sound would be processed at least as fast as in a standard parallel system (see Figure 1), with separate decisions on separate auditory and visual channels, and perhaps faster. If the time it takes to process the bimodal information is the same as predicted by a standard parallel system, it is referred to as unlimited capacity, and if it is faster it is referred to as super capacity. In fact, reasonable assumptions concerning configural or holistic perception predict super capacity under conditions akin to those in the present study (Townsend and Nozawa, 1995; Wenger and Townsend, 2001). Processes in which information is slower than predicted by a standard parallel process are called limited capacity.
The decisional stopping rule determines whether all the items or channels must complete processing before the system terminates and arrives at a decision. When early termination of processing is possible, such as when a target contains redundant information, it is valuable to learn if people can take advantage of the opportunity – which is by no means certain under conditions where responses are made within several hundred milliseconds. This decisional component of processing is important in its own right but in addition, other facets of processing cannot be assessed if it is ignored.
Finally, stochastic independence versus interaction and influences on capacity indicates whether cross-channel interactions are present. The presence of cross-channel dependencies can be assessed in conjunction with the architecture and capacity analyses (e.g., Townsend and Nozawa, 1995; Wenger and Townsend, 2000, 2001; Townsend and Wenger, 2004a,b). For instance, super capacity follows from mutual facilitatory (positively correlated) interactions and from coactive processing. Either could be associated with configural perception. Limited capacity can be caused by inhibitory interactions among channels, or for example, fixed capacity although other causes are also possible (Townsend and Wenger, 2004b).
Since evidence from previous speech studies demonstrates that visual information improves the accuracy in near-threshold experiments (e.g., Sumby and Pollack, 1954; Grant et al., 1998), an important question arises as to when this interaction takes place. The terminology differs somewhat, but one camp views the interaction as occurring after identification of the information from the separate modalities (e.g., Bernstein et al., 2004; Bernstein, 2005), although sensory modulation across modalities can be present before the identification of linguistic information (see van Wassenhove et al., 2005; Ponton et al., 2009). The other camp views the interaction as taking place early on, for instance, in some kind of unitary code (e.g., Summerfield, 1987; Massaro, 2004; Rosenblum, 2005). In keeping with the terminology of the literature, we shall refer to the former as late integration, and the latter as early integration models. Although rarely stated explicitly, it appears that information from the two modalities is assumed to be processed in parallel by both models.
We propose that late integration interpretations might be modeled by parallel systems where identification on each channel takes place after processing on each channel is accomplished. We shall refer to these as separate decisions parallel models as indicated above. In contrast, early integration processing would appear to be instantiated by parallel models that merge their separate channel information before a final decision is made, perhaps on a modality-free code (see Summerfield, 1987, for a thorough review that is still topical). In keeping with a literature where this notion has been quantitatively investigated and as informally defined above, we shall call it coactive processing or simply coactivation. We now turn to relevant theoretical accounts of audiovisual speech processing.
Accounts of Multisensory Speech Processing
As noted earlier, previous mathematical models are typically not temporal in nature and are therefore silent with regard to the inherently dynamic processing issues under study here, particularly architecture, capacity, and stopping rule. Most major debates with regard to even the type of processing, separate decisions parallel versus coactive, have taken place at a qualitative level if at all. As discussed in our exposition below, we go forward on the basis that our separate decisions parallel models are natural quantitative candidates for segregated perceptual operations followed by late integration. As observed, we propose that coactive models form a class of minimally complex models of early integration. Our methods do not address such specifics as the code used in the processing channels. Further, due to space constraints, the exposition in this section must be limited to giving the flavor of the debate and a general guide to the literature.
In a review of the audiovisual speech literature, Rosenblum (2005) argued that the neuro-physiological underpinnings and information sharing involved in audiovisual speech perception operate by extracting amodal information from the auditory and visual components of the speech signal. This position is based on the theoretical account of speech perception assuming that the primitives of speech perception are gestural – a position taken by the motor (Liberman and Mattingly, 1985) and articulatory dynamic (Summerfield, 1987; Fowler and Rosenblum, 1991) theories of speech processing. Accordingly, each “…sensory modality is largely invisible to the speech perception function and the relevant information for phonetic resolution is modality-neutral” (Rosenblum, 2005, p. 51). Rosenblum further argued that considerable support for this position comes from evidence showing that the auditory and visual speech streams are integrated in the earliest stages of perception, prior to word recognition or phonetic categorization.
Green and Miller (1985) carried out a behavioral study interpreted to be supportive of early audiovisual integration (see Rosenblum, 2005). The authors demonstrated that the visually perceived rate of articulation influences auditory segment perception. They showed that visual information about place of articulation can influence the perception of voice onset time (VOT). Participants were shown audiovisual clips of a talker saying a syllable that varied auditorially and visually on a continuum from/bi/to/pi/. The corresponding visual information was played either fast or slow. The results demonstrated that rapidly articulated syllables increased the rate at which the participants perceived/bi/relative to/pi/, a finding consistent with early interactions between the auditory and visual components. Further evidence for a recognition process that utilizes both auditory and visual cues has come from studies using Minkowski metrics comparing models of speech integration. Arnold et al. (2010) fit a probability summation model, and a model assuming that auditory and visual cues are encoded as a unitary psychological process, to audiovisual identification data. The authors found that the latter model provided a superior fit. Findings such as these indicate a decision process that has access to both auditory and visual information, and combines the two sources of information in the early stages of phonetic perception.
Behavioral data, however, are not unequivocal on the issue of early versus late integration. Bernstein (2005) cited several studies showing that integration may in fact occur at later processing stages. For instance, the introduction of large stimulus onset asynchronies between the auditory and visual modalities fails to abolish the McGurk effect (McGurk and MacDonald, 1976), perceptual fusions that arise from incongruent auditory and visual speech information (e.g., Massaro et al., 1996). This suggests that a framework assuming extensive unisensory processing can account for audiovisual fusion. Further evidence for late integration comes from studies showing that the McGurk effect varies in strength across cultures (Sekiyama and Tohkura, 1993) and for familiar versus unfamiliar talkers (Walker et al., 1995). Thus, an alternative account to the theory that amodal information is extracted and combined in the early stages of processing is the view, supported by some of the evidence cited above, that neural networks learn associations between auditory and visual information (see Bernstein et al., 2004). Extensive unisensory processing is believed to occur in the auditory and visual channels prior to recognition, with integration of speech specific features occurring late in the perceptual processing stages. Evidence from EEG tasks using mismatch negativity does indicate that information from visual processing areas “modulates” early auditory processing, although the integration of higher order features specific to speech does not seem to occur at this stage (Ponton et al., 2009; see also van Wassenhove et al., 2005; Pilling, 2009; Winneke and Phillips, 2011).
We now turn to the experimental methodology of the double factorial paradigm (DFP) that will be employed in two studies to investigate the above issues central to audiovisual integration in speech perception. The DFP can readily be used to investigate and falsify accounts of audiovisual integration that have not been tested in a direct and definitive manner. The paradigm employs reaction time based methodology engineered so as to avoid model-mimicking obstacles (Townsend, 1971; Townsend and Nozawa, 1995). We refer interested readers to Townsend and Wenger (2004a) for a general survey and bibliography.
The Double Factorial Paradigm: Assessing Models of Audiovisual Processing
Given the theoretical distinction between coactive and parallel models of integration in audiovisual speech perception, it is important to find a way to empirically distinguish between them. To our knowledge, this has not been accomplished in the speech perception literature. The description of what we refer to as “coactive” and “parallel” models in the speech perception literature as well as serial mechanisms require specific mathematical formulation along with behavioral data if they are to be tested. The methodology can be used to directly test separate decisions parallel versus coactive parallel processing, as well as to assess workload capacity, and to identify the decisional stopping rule (Townsend and Nozawa, 1995). Evidence concerning channel independence or cross-channel audiovisual interactions contributing to the recognition process can also be garnered. Finally, there are very few assumptions needed to carry out our tests besides high accuracy. For instance, the predictions do not rely on parametric assumptions (e.g., that the data are normally distributed). The major assumptions and DFP methodology are discussed in the following section. A basic understanding of these principles should assist investigators interested in carrying out DFP style experiments in their respective research domain.
Assumptions
Basic experimental design
The basic design of the DFP involves the detection or identification of targets, usually presented in one or two channels. The term channel refers to an abstract information processing construct, which normally involves the direction of attention to a particular object or modality. Consider the following design as an exemplary DFP experiment. Suppose observers participate in a simple task involving the presentation of the following stimuli: an auditory pure tone, a visual dot, and “target-absent” trials in which only a blank screen is presented. The classic DFP design often involves the presentation of four trial types: (a) single target trials where only an auditory tone is presented, (b) single target trials where only a visual dot is presented, (c) redundant target trials in which both a dot and the auditory tone are presented, and finally (d), target-absent trials. One common response mapping (usually referred to as an OR design) would require observers to make a “YES” response when single target auditory, single target visual, or redundant (auditory and visual) information is presented, and a “NO” response on target-absent trials. Participants are normally instructed to make a “NO” response upon perceiving the absence of stimulus information in both modalities (experimental trials are typically initiated by the presentation of a cue such as a fixation cross). While DFP studies generally obtain both accuracy and reaction time information, reaction times constitute the crucial dependent measure used in assessments of architecture and capacity. The DFP generally requires a large number of trials in order to obtain a distribution of RTs from each of the conditions described above. As we shall see, this basic design can be readily adapted to address questions in the speech perception literature by requiring participants to identify spoken words using audiovisual, auditory-only, or visual-only information.
Factor 1: number of channel available
The first factor manipulated in the context of the DFP concerns the number of targets present, or channels available (Auditory-only/Visual-only versus AV) when the observer is making a decision. This is crucial for calculating the measure of capacity, which assesses information processing efficiency as a function of the number of channels available. In the clinical speech perception literature for instance, researchers are often concerned with how “efficiently” different clinical populations recognize words when they have both auditory and visual information available compared to when only auditory (or only visual “lip-reading”) information is available (e.g., Bergeson and Pisoni, 2004 for a review, and Sommers et al., 2005). Typically, accuracy-only measures are used when comparing the performance of clinical populations such as elderly hearing-impaired or children with cochlear implants, to young normal-hearing listeners.
In Experiment 1, the basic design of the DFP was adapted in such a way as to include a closed set word identification experiment in which words were presented to participants in auditory-only, visual-only, and audiovisual settings. We assessed workload capacity (described shortly) for three different auditory S/N ratios in order to investigate how integration efficiency and the nature of cross-modal interactions change under variable listening conditions.
Factor 2: saliency
The second factor manipulated in the typical DFP design is the saliency of each channel. For our purposes, the overall clarity of the auditory and visual signals can be manipulated using a high (“easy”) and low (“difficult”) level of saliency to induce faster versus slower reaction times respectively. The salience manipulation is induced to assess architecture (i.e., parallel versus coactive) without contamination through workload capacity changes (Townsend, 1974). When both auditory and visual information are presented, there are four possible saliency trial types: High-A & High-V (hh), High-A & Low-V (hl), Low-A & High-V (lh), and Low-A & Low-V (ll). In the context of the exemplary audiovisual tone and dot identification task described here, the dot would be presented at two levels of brightness in the redundant target (and also single target) trials, and the tone could be presented at 2 dB levels or S/N ratios (again, in both single and redundant target trials). The saliency manipulation is crucial for assessing architecture and also decision rule, but not capacity. As we shall see in the Section below on “selective influence,” it is important to test whether the salience manipulation was “effective.”
In a pilot study described shortly, we adapted the basic DFP design to include a study involving a two-alternative forced-choice discrimination between the words “Base” and “Face.” Participants were presented with auditory-only, visual-only or combined audiovisual information. The information in the auditory and visual channels was presented at two different saliency levels to create the four factorial conditions in audiovisual trials (hh, hl, lh, and ll). The purpose of this study was to provide a preliminary assessment of architecture and decision rule.
Selective influence
An important assumption integral to DFP methodology is selective influence. This is crucial when assessing architecture and decision rule. Selective influence refers to the fact that the salience manipulation must be “effective” in causing changes in the processing speed of a particular sub-process. For selective influence to hold, the saliency manipulation in the auditory and visual channels must have the effect of changing processing speed (either speeding up or slowing down) in that particular channel. One of the first incarnations of selective influence was within Saul Sternberg’s additive factors method (Sternberg, 1969). At that stage in its history, the theoretical basis was unclear and there was no way to verify its validity. It was not discovered until later that the influence must occur at a sufficient grade of statistical strength for architectural differences to be testable (Townsend and Ashby, 1983; Townsend, 1990, Chapter 12; Townsend and Schweickert, 1989). Our methodology for assessing selective influence involves checking that the empirical distribution functions from each factorial condition are ordered in such a way that the distribution corresponding to the High-A High-V (hh) condition shows “faster” RTs compared to the distribution functions corresponding to the High-A/Low-V and Low-A/High-V (hl/lh) conditions, and also that the distribution functions corresponding to the High-A/Low-V and Low-A/High-V conditions (hl/lh) indicate faster RTs than the distribution function corresponding to the Low-A and Low-V conditions (ll). The empirical cumulative distribution functions (CDFs or survivor functions) should thus follow a specific ordering (see Townsend, 1990; Townsend and Nozawa, 1995). For example, the CDF for the hh condition should be greater than the distributions for the hl/lh and ll conditions.
Assessing Architecture and Decision Rule
First, in DFP methodology, we compute a mean interaction contrast using mean reaction times from each factorial condition obtained from the audiovisual trials: MIC = [RTll–RTlh]–[RThl–RThh]. Additionally, DFP affords a deeper test of interactions between empirical survivor functions to yield a more fine grained interaction measure than would be provided by mean RTs alone (Townsend and Nozawa, 1995). Survivor functions are used instead of CDFs to compute architecture and decision rule since the mathematical proofs provided by Townsend and Nozawa (1995) assume the computation of survivor functions. Survivor functions provide the probability that a process has not finished (i.e., that recognition has not occurred yet) by time t. Let us call the CDF obtained from binned RTs in each condition: F(t) = P(T ≤ t), where T represents the processing time random variable, and t is a specific value (e.g., 500 ms). Then, the survivor function is defined as S(t) = 1 − F(t), and indicates the probability that processing does not finish until later than, say, t = 500 ms. The survivor interaction contrast, or SIC(t), is defined as SIC(t) = [Sll(t)–Slh(t)]–[Shl(t)–Shh(t)]. The form of this contrast is the same as the MIC, although the survivor interaction contrast is computed along each point in the functions. Since the SIC(t) is computed across multiple points, it produces a continuous function rather than just a single number.
Figure 2 shows how the shape of the interaction contrast can be used to identify different processing architectures and decision rules. It will aid in our presentation to point out that since the area under a survivor function is equal to its mean, the MIC is the integral of the SIC(t) function.
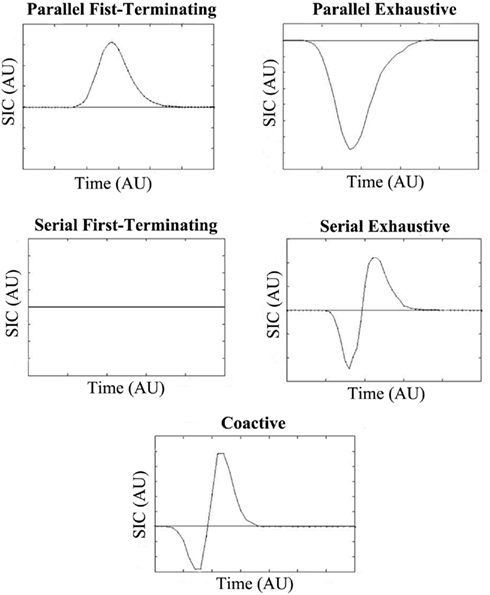
Figure 2. SIC(t) predictions for standard independent parallel, serial, and coactive models. The two top panels display the predictions of the independent parallel first-terminating and exhaustive models respectively, while the middle panels display the predictions of the serial first-terminating and exhaustive models respectively. The bottom panel displays the coactive model predictions. The SIC(t) is plotted against arbitrary time units (AU).
The upper left panel in Figure 2 shows the predictions of an independent parallel processing model with a first-terminating stopping rule. The SIC(t) function for this model is entirely positive (Proposition 1 in Townsend and Nozawa, 1995). To understand why the curve should be positive, consider how the lh, hl, and hh conditions each have at least one “fast” process due to the salience manipulation. Recognition can occur as soon as the fastest channel reaches threshold. Therefore, when the SIC(t) is computed, [Sll(t)–Slh(t)] should be greater at each time point than [Shl(t)–Shh(t)]; survivor functions with slower RTs are greater than survivor functions with faster RTs. The MIC in this case should also be positive. The upper right panel in Figure 2 depicts the predictions for the same independent parallel model but now with an exhaustive stopping rule. These models predict SIC(t)’s that are entirely negative (Proposition 2 from Townsend and Nozawa, 1995). In this case, the ll, lh, and hl conditions each have at least one slow process. In exhaustive models, recognition occurs only when both channels (or the slowest of the two processes) reach threshold. Therefore, when the SIC(t) is computed, [Sll(t)–Slh(t)] should be less than [Shl(t)–Shh(t)] at each time point. Again, it follows that the MIC should be a negative number. Coactive models produce SIC(t) functions that exhibit a small negative region for early time intervals, followed by a larger positive region thereafter. The reason for this predicted shape is not intuitive, and relies on a proof assuming a Poisson model provided by Townsend and Nozawa (1995). The MIC for coactive models, like parallel first-terminating models, should also be positive due to the larger positive area in the SIC(t) function.
Finally, although serial processing has never to our knowledge been considered as a viable model of multisensory integration in the audiovisual speech perception literature, the test for serial processing “comes for free” with the DFP, and might prove useful in certain paradigms employing speech stimuli. When processing is serial with independent channels and a first-terminating stopping rule, the SIC(t) is flat and equal to 0 at every point of time (Proposition 3 from Townsend and Nozawa, 1995). This is because serial or additive processes predict interaction contrasts equal to 0 (Sternberg, 1969). Obviously, this implies that the MIC should be 0 as well. On the other hand, with exhaustive serial processing and independent channels shown in the panel to the right, an S-shaped curve is predicted with a negative region for early processing times and a positive region for later processing times. The reason for the S-shaped curve in the serial exhaustive SIC(t), much like the coactive case, is not intuitive. We refer the interested reader to the proof in Townsend and Nozawa (1995) for an explanation. Interestingly, the negative and positive regions of the curve are equal to each other in serial exhaustive models thereby forcing the MIC to be 0.
Assessing Workload Capacity
An important feature of our methodology is its ability to assess the workload capacity of the system. Workload capacity measures how the number of working channels (in this case, one that is auditory-only or visual-only versus auditory and visual) affects processing efficiency at time t. Is there a cost, benefit, or no change in efficiency when both auditory and visual channels are present relative to the conditions when only auditory or visual information is available? Capacity predictions for parallel and coactive models are shown in Figure 3. The equation for calculating the capacity coefficient C(t) involves calculating the integrated hazard function H(t) = ∫ h(t)dt. A nice property of this integrated hazard function is that H(t) = −log(S(t)), which provides a straightforward estimate of H(t). The equation from Townsend and Nozawa (1995) is:
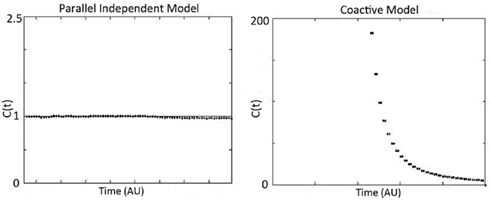
Figure 3. Predicted workload capacity, C(t), for independent parallel models (left), and coactive models (right). Notice that coactive model predicts extreme super capacity, while independent parallel models predict C(t) = 1 (which is the benchmark for efficient audiovisual processing or integration). Standard serial models (generally) predict C(t) = 1/2 while parallel models with negative cross-talk can readily mimic such predictions.

The subscripts A and V represent auditory and visual reaction time trials, usually across all levels of saliency. It is worth noting that capacity is a relative measure, meaning that it assays the performance for workload with both channels in action relative to the predictions of a parallel system with independent channels (see Figure 1). If the processing system is parallel with stochastically independent channels and the rate on each single channel is unaffected by increasing the number of operating channels, the system is said to be of unlimited capacity. Any such unlimited capacity, independent channels, parallel system predicts C(t) = 1 for all t ≥ 0 because the prediction of any such system is the denominator of the above expression namely, HA(t) + HV(t). One benefit to computing the capacity coefficient is that it provides instantaneous information regarding whether the observer violated the assumption of independence by deviating from the benchmark of “integration efficiency” [i.e., C(t) = 1]. If the channels slow down as other channels are engaged (i.e., with greater workload) then it operates at limited capacity, and C(t) < 1. Inhibition between channels can cause such a slowdown (Townsend and Wenger, 2004b). If there is a benefit in processing rate, then it operates at super capacity (see Wenger and Townsend, 2001); such a scenario can be caused by facilitation between channels.
Bounds on performance
An upper bound on performance for separate decisions parallel models, also known as race models (Raab, 1962) was provided by (Miller, 1982; see Colonius, 1990) in the form of the well-known race inequality. It stipulates that in such models it must be the case that:
where FAV(t) is the CDF FAV(t) = PAV(T ≤ t) for the double target trials and Fi (t) (i = A, V) are the corresponding statistics for the single target trials. It forms an upper limit on performance for a wide variety of parallel race models, including, but not confined to, the unlimited capacity parallel model with independent channels.
Although C(t) and the Miller bound are both assessing performance as workload changes, they are not at all identical. The capacity coefficient offers a graded comparison of data with the standard parallel model, for all time t whereas the bound establishes a region where performance is super capacity to the extent that a large set of parallel race models cannot cross. The Miller race inequality is informative for such values of time that FA(t) + FV(t) ≤ 1 but not thereafter. C(t) is not restricted in this fashion. Townsend and Nozawa (1985) proved that if C(t) > 1 for an interval early in processing (i.e., fast RTs) then the above inequality has to be violated. On the other hand, for larger RTs, C(t) sometimes has to be quite large to violate Miller’s bound.
A bound that assesses limited rather than super capacity is known as the Grice bound. It is given by the inequality that will hold if processing is not too limited in capacity: FAV(t) > MAX{FA(t), FV(t)} (Grice et al., 1984; Colonius, 1990). Townsend and Nozawa (1995) proved that if the Grice bound is violated at time t, then C(t) < 1 for that time point, much less than 1 in most cases. If HA(t) = HV(t) the Grice bound is achieved when C(t) = 1/2 (see Townsend and Ashby, 1983; Townsend and Nozawa, 1995). Overall then, architecture is assessed most directly from the SIC(t) and MIC results on double target trials with variation of the selective influence factors, while workload capacity is measured from the single target workloads in comparison to the double target workload through the C(t) function. Together, they constitute a methodology capable of determining key aspects of the attendant processing system.
We will demonstrate in the following studies how RT methodology proposed in this work provides a convenient means for investigating the issue of “early versus late integration” (or coactive versus parallel processing) and other questions related to the processing of bimodal speech or non-speech stimuli. We first present the results of a pilot study, which constituted an initial attempt to employ a full DFP design to investigate architecture and decision rule processing issues in speech perception. While this represents a basic application of the design, we intend for the basic principles to be applied to future studies. The primary study, Experiment 1 was designed to assess capacity and integration efficiency using a more ecological design by employing multiple signal-to-noise ratios, a larger set size, and multiple talkers.
Pilot Study
We carried out a pilot experiment to investigate processing architecture and decision rule in a task that required discrimination between two words (“Base” versus “Face”) using audiovisual, auditory-only, and visual-only trials. The inclusion of two spoken words in the context of a forced-choice task (see Massaro, 2004 for a series of two-alternative forced-choice tasks) should be simple enough to allow us to implement DFP methods while also encouraging the listener to engage in language perception. We also assessed processing capacity. Six subjects participated in this pilot study, in which they were exposed to video clips of a female talker saying the words “Base” and “Face.” Their task was to make a two-alternative forced-choice button press response corresponding to the word they thought the talker said using audiovisual information, auditory-only information (with the visual portion of the clip removed), or visual-only information (with the auditory signal removed). The saliency manipulation on the visual signal involved presenting the video at two levels of brightness, and the saliency manipulation on the auditory signal involved presenting the auditory signal at two different auditory S/N ratios. Table 1 below shows the basic experimental set-up. The Ø symbol indicates the absence of auditory or visual stimuli in a particular channel. Reaction time distributions were obtained for each trial type and each salience condition.
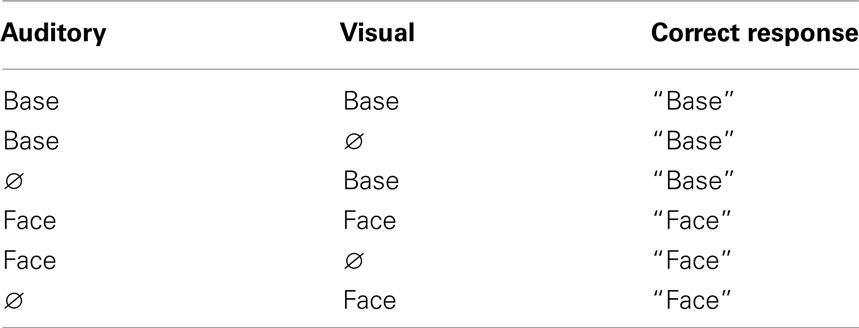
Table 1. The table shows each stimulus–response category (Base and Face) alongside each factorial condition.
The SIC(t) and MIC were computed for each participant, and mean accuracy scores, particularly in the redundant target condition were high (>90%). The individual survivor functions from each of the saliency conditions were computed for each participant, and they were checked for the correct orderings using the procedure described previously. Each participant obeyed the assumptions for selective influence for at least some time intervals.
Figure 4 shows the results of the architecture (Figures 4A,B) and capacity analysis for a typical participant. Each participant’s SIC(t) was consistently overadditive across a large range of processing times. Overall, these results provide preliminary support for a parallel model of audiovisual integration with a first-terminating stopping rule. These results thus allow us to rule out parallel exhaustive processing accounts (and also serial models). Only one participant (not shown) yielded a statistically significant region of early negativity in the SIC(t), which was consistent with coactive processing. Interestingly, capacity was extremely limited for every participant and violated the lower bound for nearly all time points – a finding inconsistent with coactive models, which predict extreme super capacity (see Townsend and Wenger, 2004b). Overall, the combined SIC(t) and capacity results from this study suggest parallel first-terminating processing with cross-channel inhibition causing decrements in capacity.
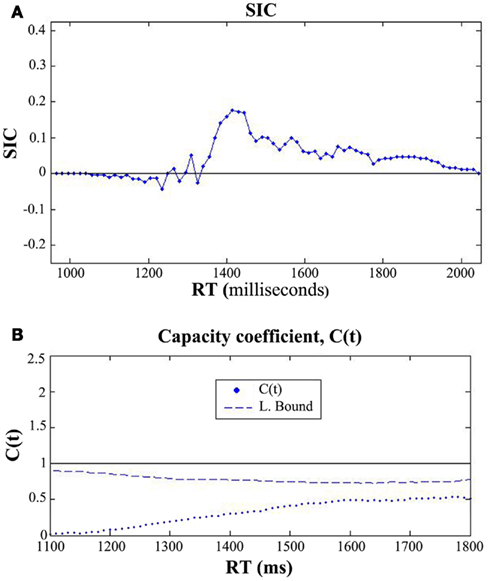
Figure 4. (A) SIC(t) function for one exemplary participant in the pilot study. This participant showed evidence for parallel first-terminating processing (as did three other participants). Only one participant produced an SIC(t) consistent with another model, which was coactive processing. (B) The capacity results computed for the same participant. C(t) was computed across all saliency levels (i.e., the integrated hazard functions from the AV, A-only, and V-only conditions included RTs from each level of saliency). Each participant yielded strong evidence for extremely limited capacity, a finding inconsistent with coactivation, but consistent with a parallel model with cross-channel inhibition.
We expected the design of this pilot experiment to encourage participants to call on their speech facilities since higher order features of the stimuli must be utilized in order to perform the task and discriminate two words. Still, there were several limitations to this experiment due to the restricted nature of the stimulus set. Since DFP methodology typically requires a large number of responses, we restricted the experiment to a two-alternative forced-choice task using only one talker, at the expense of ecological validity. While this study was successful in offering a novel way to test outstanding assumptions in the multisensory perception literature, some of the conclusions drawn may be limited to certain restricted stimulus sets.
To that end, we designed an experiment to address these limitations. First, to enhance ecological validity, we employed two talkers and included eight monosyllabic words in the stimulus set – eight words was one of the set sizes employed by Sumby and Pollack (1954). Second, we employed multiple auditory signal-to-noise ratios (both “low” and “high”) to examine how workload capacity/multisensory benefit changes as a function of the quality of the auditory signal. The pilot experiment utilized auditory signal-to-noise ratios to elicit both high accuracy and selective influence. Therefore, the auditory signal-to-noise ratios in that experiment were not optimal for drawing strong conclusions about multisensory enhancement because they produced accuracy levels at the high end of the performance spectrum, unlike the signal-to-noise ratios of Sumby and Pollack’s (1954) study. Experiment 1 allowed us to determine which auditory signal-to-noise ratios would elicit multisensory enhancement or efficient integration as measured by processing capacity. This also assisted us in interpreting our results within the milieu of the multisensory speech literature.
Experiment 1
Experiment 1 was a speech recognition task motivated by the design features implemented in Sumby and Pollack’s (1954) seminal investigation of audiovisual enhancement. Sumby and Pollack (1954) investigated speech intelligibility using five different auditory signal-to-noise ratios (−30, −24, −18, −12, and −6 dB) and seven different vocabulary sizes consisting of bi-syllabic spondees. In this experiment, both RT data and accuracy scores were collected in auditory-only, visual-only, and audiovisual conditions. Three different auditory signal-to-noise ratios (were employed in this study: −18, −12 dB, and clear. The clear, low noise condition was designed to approximate optimal listening conditions such as those that would be experienced in a quiet room. A vocabulary size of eight monosyllabic words was used in this study – one of the vocabulary sizes used by Sumby and Pollack (1954). While a larger set size would generally be optimal for speech perception experiments, the collection of RT data necessitated a closed set of responses with fewer choices. It is important to note that the results obtained by Sumby and Pollack (1954) in the eight-word condition followed the same overall trend in terms of audiovisual gain scores as the conditions employing larger vocabularies. The set size of eight words using three signal-to-noise ratios constitutes an ideal starting point for RT based audiovisual speech analysis.
Materials and Methods
Participants
A total of 15 college aged individuals (18–23) who reported normal hearing, with normal or corrected vision served as participants. All participants were native speakers of American English. Five participants were randomly allocated to the condition with the clear auditory signal (S/N = clear), five to the S/N ratio = −12 dB condition, and five to the S/N ratio = −18 dB. Each participant was paid 10 dollars per session.
Materials
The stimulus materials included audiovisual movie clips of two different female talkers from the Hoosier Multi-Talker Database (Sherffert et al., 1997). Two tokens of the monosyllabic words recorded from the two female talkers selected for this study included: “Mouse,” “Job,” “Gain,” “Tile,” “Shop,” “Boat,” “Date,” and “Page.” Audio, visual, and audiovisual files were edited using Final Cut Pro HD version 4.5. The audio files were sampled at a rate of 48 kHz at a size of 16 bits. The duration of the auditory, visual, and audiovisual files ranged from 800 to 1000 ms. We selected and edited the stimuli in such a way as to minimize differences between onset of facial movement and vocalization between clips. Each video contained either two–three lead in frames (approximately 60–90 ms) before the onset of the first visual onset cue. White noise was mixed with each audio file using Adobe Audition to create an auditory S/N ratio of −12 dB SPL, and another to create an auditory S/N ratio of −18 dB SPL. A third set of auditory files was used in the clear trials (68 dB SPL), in which white noise was not mixed with the auditory files. Visual saliency was not manipulated in this study since we were not interested in directly assessing architecture via the survivor interaction contrast. Capacity was calculated separately for each auditory S/N ratio [e.g., HAClearV/(HAClear + HV)].
Design and Procedure
Participants were seated 14″ to 18″ in front of a Macintosh computer equipped with Beyer Dynamic-100 headphones. Each trial began with a fixation cross (+) appearing in the center of the computer screen followed by the stimulus. The stimuli included auditory-only, visual-only or audiovisual stimuli, which were presented in different blocks. Immediately after the presentation of the stimulus word, a dialog box appeared on the computer monitor containing eight boxes (1″ × 2″ in size) arranged in four rows and two columns, and each box was labeled with one of the eight possible stimulus words. The labels on the grid were randomized for each participant. Participants were instructed to respond as quickly and accurately as possible by using the mouse to click the box labeled with the word the thought the talker said. Reaction times were measured from stimulus onset. On auditory-only trials, participants were required to base their response on auditory information, and on visual-only trials participants were required to lip-read. Each experimental session consisted of three randomly ordered blocks per day (auditory, visual, and audiovisual stimuli), and lasted approximately 45 min. Participants also received 24 practice trials at the onset of each of the two experimental sessions that were not included in the subsequent data analysis. The experiment was divided into two sessions where each subject participated in one session per day for a total of 2 days. The experiment consisted of 400 total auditory-only trials, 400 visual-only trials, and 400 audiovisual trials, where 200 trials in each condition were spoken by each of the two talkers.
Results
Data from three experimental conditions consisting of an auditory signal-to-noise ratio of −18 dB, S/N of −12 dB, and the clear auditory S/N ratio with a low noise auditory signal approximating optimal listening conditions are presented in Table 2 respectively. Each portion of the table displays the proportion correct, the mean RT, and audiovisual gain scores for each participant across conditions. One of the conventional measures of gain, labeled “Gain V,” assesses the overall contribution of visual information in terms of accuracy and is measured by AV–A (see Massaro and Cohen, 2000; Grant, 2002; Bergeson and Pisoni, 2004). We also included a measure of auditory gain (Gain A), measured AV–V, which essentially measures the benefit afforded by auditory information. The measures labeled “Gain (RTV)” and “Gain (RTA)” denote the amount of facilitation that occurs, in terms of processing time, when visual (ART–AVRT) or auditory information (VRT–AVRT) is added to the signal. Finally, a measure of gain expressed as the amount of “information transmitted” (IT) was included (AV–A)/(100 − A).
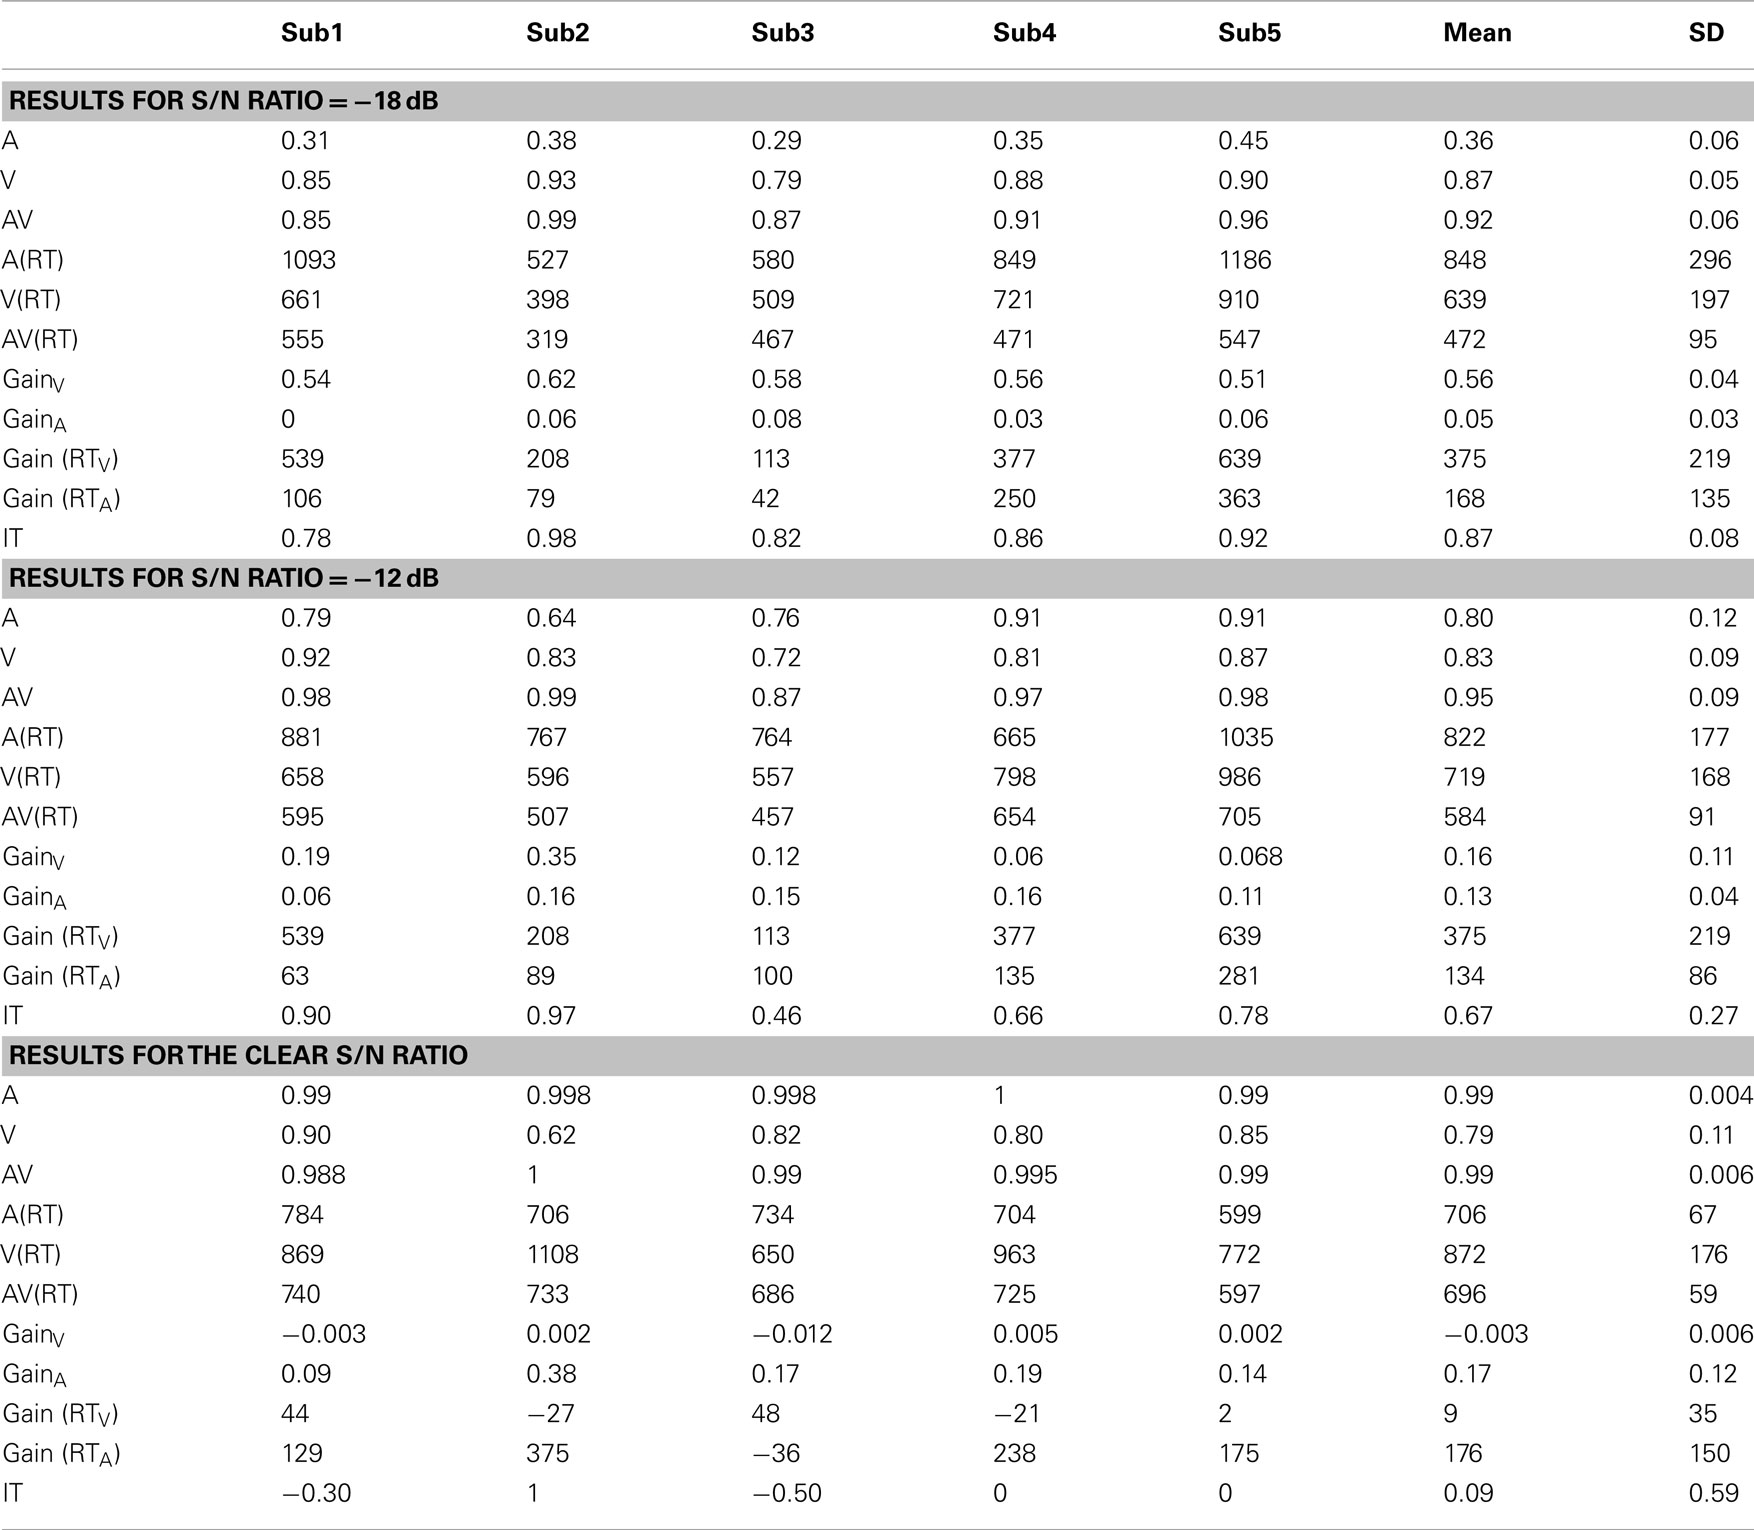
Table 2. Mean accuracy scores for the auditory-only (A), visual-only (V), and audiovisual conditions (AV).
The gain scores (AV–A) and (AV–V), the RT gains (ART–AVRT) and (VRT–AVRT), and the information transmitted (AV–A)/(100 − A) (see Sumby and Pollack, 1954). The results from Table 2 indicate that accuracy scores in the auditory channel increased as the S/N ratio improved (mean −18 dB = 0.36, mean −12 dB = 0.78, mean clear ≈ 1.0; F(2, 13) = 81.9, p < 0.0001). The mean proportion correct in the audiovisual condition did not significantly differ between conditions. Nonetheless, a non-significant trend to this effect was observed (mean −18 dB = 0.92, mean −12 dB = 0.99, mean clear = 1.0; F(2, 13) = 1.97, p < 0.20). Finally, the mean proportion correct for the visual-only condition (which was not degraded) across conditions was 0.83. Sumby and Pollack (1954) did not technically employ a visual-only condition, but instead included a condition in which the auditory signal-to-noise ratio was −30 dB. This provided some highly degraded auditory information.
Overall, RTs decreased as the auditory S/N ratio increased in the auditory-only condition. We did not observe significant differences between experimental conditions in terms of RT [mean −18 dB = 847 ms, mean −12 dB = 771 ms, mean clear = 705 ms; F(2, 13) < 1]. This result could be due to lack of power since variability in RT scores is generally greater than accuracy scores. The mean RT for the visual-only condition was 735 ms. Interestingly, the analysis of mean processing times in the audiovisual condition revealed that RTs decreased as the auditory signal-to-noise ratio increased [mean −18 dB = 471 ms, mean −12 dB = 584 ms, mean clear = 696 ms; F(2, 13) = 8.93, p < 0.01]. Hence, the audiovisual stimuli were processed more quickly and more accurately as the quality of the auditory information increased.
Interestingly, audiovisual significant gains were observed across experimental conditions. Not surprisingly, audiovisual gain scores decreased as the auditory signal-to-noise ratio improved due to a ceiling effect for percent correct [mean −18 dB = 0.56, mean −12 dB = 0.15, mean clear ≈ 0; F(2, 13) = 80.10, p < 0.0001]. Similarly, the observed gain for RT was significant as well (mean −18 = 375 ms, mean −12 = 187 ms, mean clear = 10 ms; F(2, 13) = 15.60, p < 0.0005). Finally, audiovisual gain measured expressed as AV-A/(100-A) noticeably improved as the auditory signal-to-noise ratio decreased (mean −18 dB = 0.87, mean −12 dB = 0.67, mean clear = 0.09; F(2, 13) = 83.3, p < 0.0001). This result provides further evidence that a degraded auditory signal combined with information obtained from lip-reading facilitates audiovisual integration abilities.
Capacity Analysis
Figure 5 displays the capacity results for each participant and auditory signal-to-noise ratio. In each panel, Participants 1, 2, and 3 are arranged sequentially in the top row, followed by 4 and 5 in the bottom row. The qualitative pattern of experimental results revealed that processing capacity/efficiency changed as a function of auditory signal-to-noise ratio. More specifically, the benefit or gain in efficiency in terms of the capacity coefficient decreased as the auditory signal-to-noise ratio improved from −18 to −12 dB. The pattern of the capacity data effectively demonstrated that visual information aids processing efficiency to a greater degree when the auditory input is degraded or otherwise less intelligible. One reason for this observed enhancement might be due to the fact that auditory and visual signals often provide complimentary information (See Summerfield, 1987; Grant et al., 1998). Information about place of articulation, for example, is available from lip-reading even though this information becomes increasingly degraded in the auditory domain under difficult listening conditions.
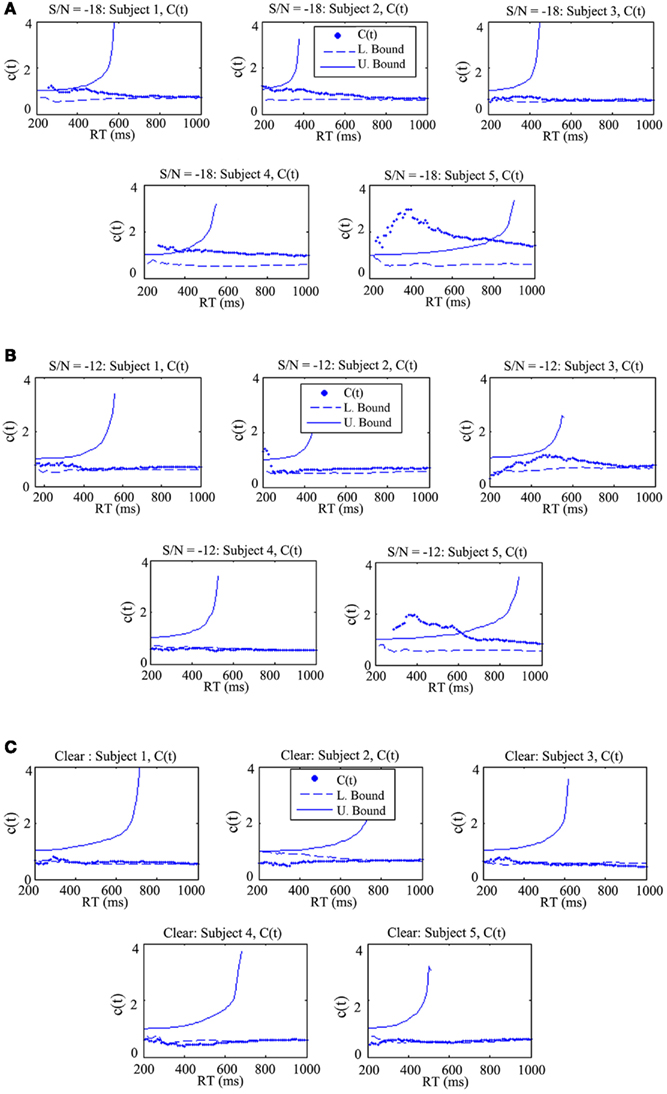
Figure 5. The capacity coefficient C(t) for each participant across all three experimental conditions. The top (A), shows C(t) for five participants in the condition where the auditory S/N ratio was −18 dB. Each participant, except for Participant 3, evidenced super capacity (violating the bound C(t) = 1, or upper Miller Bound in capacity space; Eidels et al., 2011). The legend shows that C(t) is denoted by the dots, the upper bound by the solid curve, and the lower bound by the dashed line. (B) shows C(t) for five participants in the condition with an auditory S/N ratio of −12 dB, and the bottom (C) shows C(t) for five participants in the condition without any degradation of the auditory signal.
In the −18 dB condition, four out of five participants exhibited super capacity for multiple time points. As can be observed in the individual panels, the data points approached the upper Miller bound for super capacity in several cases (denoted by the curved solid line; Miller, 1982; Townsend and Wenger, 2004b). Violations of the Miller bound are typically characteristic of coactive information processing (Miller, 1982, 1986; Townsend and Nozawa, 1995; Townsend and Wenger, 2004b) although recent evidence has shown that certain classes of parallel linear dynamic models and Poisson summation models with facilitatory cross-talk between can produce similar violations of the bound. Simulations have demonstrated magnitude of these violations is typically less than the magnitude predicted by coactive summation models (Townsend and Wenger, 2004b; Eidels et al., 2011).
The data shown in Figure 5B shows that as the signal-to-noise ratio improved from a S/N ratio of −18 to −12 dB the C(t) appeared to become more limited as is evident by the overall drop in the capacity coefficient. C(t) for participants 2, 3, and 5 was super capacity for some processing times, although the C(t) was greater than 1 for extended time intervals only for Participant 5. While the −12 dB condition failed to produce any systematic violations of the Grice bound, C(t) generally hovered around 1/2 region and the Grice bound during later processing stages. Conversely, the C(t) for each participant in the −18 dB condition was typically equal to or greater than 1, and was consistently greater than the Grice bound.
Contrary to the findings observed in the −18 and −12 dB S/N ratio conditions, the C(t) data shown in Figure 5C evidenced multiple violations of the Grice bound for limited capacity in Participants 2, 3, 4, and 5, with C(t) being approximately equal to the bound in Participant 1’s data set. As in Experiment 1, this condition failed to produce any sizeable violations of the Miller bound for super capacity. Overall, processing capacity was extremely limited in this condition providing further evidence that the addition of visual information does not significantly contribute, but instead can detract from efficient use of available auditory speech information in some cases. Exposing hearing-impaired listeners to this latter experimental condition might reveal a pattern of results similar to the −12 and −18 dB conditions in which some individuals, perhaps highly efficient lip readers, utilize the auditory and visual speech information sources more efficiently than others.
Taken together, the results suggest that integration becomes enhanced only when the auditory S/N ratio is low; an observation in line with the law of inverse effectiveness (see Meredith and Stein, 1983; Stevenson and James, 2009; although cf. Ma et al., 2009). The results in Table 2 suggest that visual gain (mean = 0.56) was most noticeable in the −18 dB condition. Second, audiovisual enhancement, measured by C(t) was greatest in this condition as well.
One may object that since the auditory S/N ratio was so low in the −18 dB condition, that it was functionally visual-only. Several observations can be offered as evidence against this. First, auditory-only recognition was above chance (12.5%) for each participant. Moreover, Table 2 revealed that the auditory gain AV–V was statistically greater than 0, with a mean of 5% [t(df = 4) = 3.29, p < 0.05]. We wish to emphasize that in terms of real-time processing, that the C(t) and RT analysis effectively demonstrated that the level of gain from unisensory to multisensory processing is greater than would be predicted by a parallel race model [the A gain in terms of RT was also significantly different from 0; t(df = 4) = 2.8, p < 0.05)]. Overall, these observations are essentially in agreement with previous literature indicating that auditory integration occurs for auditory S/N ratios as low as −24 dB (Ross et al., 2007).
Another potential objection to our interpretation that C(t) shows more efficient integration under degraded listening conditions is that language processing skills may have differed across group. In particular, visual-only accuracy scores suggest that the participants in the −18 dB listening condition (mean = 0.87) may have been better lip readers than the −12 dB (mean = 0.83) or clear condition (mean = 0.79) participants. However, the t-test comparing V-only performance between the −18 and −12 dB conditions was non-significant [t(8) = 0.97, p = 0.36], as was the t-test comparing performance between the −18 dB and clear condition [t(8) = 1.30, p = 0.23]. Furthermore, as we shall see, correlations between visual (or auditory) accuracy and peak capacity values were non-significant. Future studies can also address these concerns by including a larger sample of participants and by using a within-subject design.
How well does the capacity measure relate to other measures of language perception and integration? Bivariate correlations were carried out in order to obtain preliminary evidence for the hypothesis that lip-reading ability or visual gain is associated with processing capacity scores. Correlations for the participants were obtained for the maximum capacity value max{C(t)}, the mean accuracy scores, RTs, and enhancement scores as well as information transmitted. The question is which factors obtained in this study, including the availability of sensory information serve as predictors for integration efficiency as measured by the capacity coefficient? The next analyses should provide groundwork for investigating cognitive factors associated with audiovisual gain in future studies.
Thus, the Pearson correlations for the accuracy scores turned out to be marginally significant. Auditory accuracy shares a slight negative correlation with processing capacity (r = −0.39, p = 0.077), while visual-only accuracy scores and workload capacity also evidenced a marginal correlation (r = 0.37, p = 0.087). This might suggest that higher capacity values are achieved in individuals with lower auditory recognition accuracy but better lip-reading skills, although more evidence is required for this conclusion. The hypothesis that higher capacity values are associated with a greater degree of information transmitted was also supported by the correlation analysis (r = 0.51, p < 0.05). While these results are very preliminary due to the small sample size, the emerging picture suggests a negative linkage between traditional measures of audiovisual gain and integration efficiency as measured by workload capacity.
Discussion
Research into lip-reading and auditory speech perception has demonstrated that the former can noticeably improve accuracy in the latter in a noisy environment (e.g., Sumby and Pollack, 1954; see also Grant et al., 1998; and Bergeson and Pisoni, 2004). Yet, very little was or, for that matter, is known concerning their interactions in the RT domain and nothing seems to be on record with regard to their underlying dynamic mechanisms, such as architecture and stopping rule, across time. Jesse and Massaro (2010) did observe evidence for early interactions between visually salient visemes (such as stop consonants) and auditory information in a gating task. Although the authors’ methodology did not assay issues related to parallel versus coactive processing, their findings appear to be consistent with our data supporting an interactive parallel account of audiovisual integration. The DFP methodology provides converging or supplementary information to other data sets where evidence for interactions might emerge, in addition to valuable information concerning systems level attributes such as architecture, decision rule, and capacity.
Measures of architecture and capacity were used to identify a number of mechanisms critical to integration processes. Two fundamental types of parallel systems, separate decisions versus coactive processing capture the first-order aspects of “late stage” versus “early stage” sound–vision integration (e.g., Summerfield, 1987; Massaro, 2004; Bernstein, 2005; Rosenblum, 2005; van Wassenhove et al., 2005). The architecture and capacity assessments from the pilot study yielded consistent conclusions: The architectural and capacity analyses support some variety of parallel processing with a first-terminating decision rule. These results, particularly capacity, were robust occurring for all individuals.
One limitation of the pilot study was the presence of only two words in the stimulus set, and the selection of signal-to-noise ratios that allowed us to achieve both high accuracy and selective influence. This set-up allowed us to give a basic assessment of architecture and decision rule, providing us converging evidence to studies that have indicated the presence of parallel separate decisions integration in speech perception (e.g., Bernstein, 2005; Jesse and Massaro, 2010). Our design however, came at the expense of not providing an ecologically valid way to assess audiovisual gain and workload capacity. Still, the observation of limited capacity suggests that auditory and visual channels interact, in an inhibitory manner, at certain S/N ratios.
To that end, we designed an experiment to include lower auditory signal-to-noise ratios, a larger set size, as well as multiple talkers. We did this in order to be able to connect our workload capacity results with previous studies in the literature assessing audiovisual gain (e.g., Sumby and Pollack, 1954). The results from Experiment 1 showed once again that at high S/N ratios (in this case, the clear S/N ratio), capacity was extremely limited. For lower S/N ratios, we observed super capacity for some subjects along with higher audiovisual gain values in the accuracy domain as expected. The workload capacity values observed in this experiment were consistent with the predictions of separate decisions parallel models with interactions (see Townsend and Wenger, 2004b; Eidels et al., 2011).
Interestingly, audiovisual literature suggests that integration tends to become more efficient as S/N ratio decreases, and becomes less efficient when the clarity of the auditory signal decreases too much (Ross et al., 2007), contrary to a strict principle of inverse effectiveness (Meredith and Stein, 1983), where the prediction would be that integration is a monotonic decreasing function of S/N ratio. This finding appears to especially hold true when the stimulus set size is finite (Ma et al., 2009). Perhaps there is a S/N window for optimal audiovisual integration, which Ross et al. (2007) reported to fall around −10 to −12 dB and ∼−18 dB in our study (smaller set sizes tend to shift the window to lower S/N ratios). Future research will be necessary to explore more deeply, the relation between behavioral and neural measures of audiovisual integration efficiency, although recent research investigating the relation between ERPs and RTs measures has been carried out (Altieri and Wenger, 2011; Winneke and Phillips, 2011).
Conclusion
Architecture
The emerging picture is of a separate decisions parallel system rather than coactive parallelism. This characteristic favors the concept of late rather than early integration. The pilot study showed that the system is capable of taking advantage of the opportunity to conclude processing with the winner of a race, again for every individual. This inference follows from our architectural and stopping rule analyses. Although it may seem obvious that early termination could occur, it may be recalled that early in the research on rapid short-term memory search it was argued that such brief searches might propel exhaustive processing (e.g., Sternberg, 1969).
Capacity
There are two straightforward causes of the differences in capacity when S/N ratio was manipulated. The first is differences in resources, such as attention that is distributed across the operating channels (e.g., Townsend, 1974; Townsend and Ashby, 1978; Bundesen and Habekost, 2009). Although such an account cannot be ruled out definitively at this point, it seems somewhat improbable that available resources would diminish as S/N ratio changes. A second possibility, and the one favored here, is the presence of facilitatory/inhibitory connections between auditory and visual channels. Cross-channel connections in information processing models are known to effectively diminish or increase efficiency as measured by capacity (Townsend and Wenger, 2004b; Eidels et al., 2011).
Tending to bolster that hypothesis, studies using auditory, visual, plus synchronous, and asynchronous audiovisual speech stimuli have shown that the ERP signal resulting from the audiovisual stimuli in the synchronous condition is depressed compared to the ERP arising from the unimodal (A-only and V-only) stimuli (Pilling, 2009). Ponton et al. (2009) used mismatch negativity with EEG and found evidence that feedback from (phonetic) processing in visual brain regions influences auditory processing (see also van Wassenhove et al., 2005; Winneke and Phillips, 2011). In a combined RT and ERP study assessing audiovisual integration in younger normal-hearing and older adults, Winneke and Phillips (2011) carried out an audiovisual speech discrimination task requiring two-alternative forced-choice responses to spoken words. The auditory S/N ratio was adjusted for each participant in order to equate performance across age groups. Similar to van Wassenhove et al. (2005), the authors observed that early N1 and P1 AV ERP peak amplitudes (i.e., occurring upon the onset, or prior to phonetic recognition) for the audiovisual condition were reduced compared to the A-only plus V-only ERP peak amplitudes. Interestingly, this amplitude reduction was slightly greater for older compared to younger adults. An analysis of reaction time data averaged across individual participants further revealed that audiovisual trials produced faster reaction times compared to the unisensory trials, as evidenced by violations of race model predictions in both age groups. Both the reaction time and EEG results provided evidence that neural dynamic interactions between brain regions influence audiovisual integration in speech perception. In fact, the violation of the race model inequality suggests a role for facilitatory interactions. A potentially fruitful direction for future research would be to further investigate the relation between integration efficiency as measured by RTs [i.e., C(t)], and audiovisual versus unisensory peak amplitudes in the ERP signal. Using capacity and EEG to investigate individual differences should also prove to be beneficial (e.g., Altieri and Wenger, 2011).
Findings such as these add support to the hypothesis that inhibitory/excitatory mechanisms operate between brain regions, even when super-threshold stimuli that yield high accuracy are used (e.g., van Wassenhove et al., 2005; Pilling, 2009). The juxtaposition of studies finding evidence for facilitation with the capacity and parallel processing results found here, suggests that bimodal speech perception may vary in fundamental ways at different accuracy levels. While the link between information processing measures (i.e., architecture and capacity) and neural processing remains tenuous, future experiments using DFP methods in conjunction with EEG or fMRI can better investigate the neural underpinnings of efficient audiovisual integration.
One final caveat is that most previous studies employed tasks in which the participants were instructed to report what they “heard” without being asked to report specifically what they “saw.” Such tasks, though natural ecologically, are a bit unusual in basic sensory and perceptual research. In the typical laboratory paradigm the task is either “selective attention” or “divided attention.” In the former, the participant is instructed to focus on the attended signal and ignore, to the extent possible, the unattended stimuli. In the latter, the participants usually must indicate through some type or report procedure that they are indeed paying attention to both stimulus sources. Interestingly, recent work has shown that when participants are instructed to pay attention to just what they hear in a focused (i.e., selective) attention version of the paradigm which includes incongruent visual (McGurk) distractors, the distracting information inhibits processing in the time domain (Altieri, 2010). We believe that much can be learned about multimodal speech perception through this program.
Conflict of Interest Statement
The authors declare that the research was conducted in the absence of any commercial or financial relationships that could be construed as a potential conflict of interest.
Acknowledgments
This study was supported by the National Institute of Health (Grant No. DC-00111) and the National Institute of Health Speech Training Grant (No. DC-00012) and by NIMH 057717-07 and AFOSR FA9550-07-1-0078 grants to James T. Townsend. We would like to acknowledge Jeremy Loebach and Luis Hernandez of the Speech Research Laboratory, members of James T. Townsend’s Laboratory at Indiana University, and three anonymous reviewers for their helpful insights. Portions of this study were presented at the Annual Meeting of the Society for Mathematical Psychology held in Washington, DC in 2008, and were included in the first author’s doctoral dissertation.
Footnotes
- ^The bulk of research combining experimentation and modeling is due to Massaro and colleagues (e.g., 1987; 2004). In addition, influential models of bimodal speech perception have been put forth by Braida (1991) and Grant et al. (1998) (see also Grant, 2002). However, these models were not designed for and therefore cannot adjudicate the critical issues examined here, although Massaro (2004) addressed the issue of “convergent” (coactive) versus “non-convergent” (parallel) audiovisual integration in a qualitative manner.
- ^The term “architecture” is used here in a general sense and does not rule out the possibility that processing might be parallel in one instance yet serial under different task conditions.
References
Altieri, N. (2010). Toward a Unified Theory of Audiovisual Integration in Speech Perception. Doctoral Dissertation, Indiana University, Bloomington, IN.
Altieri, N., and Wenger, M. J. (2011). “Neural and information processing measures of audiovisual integration,” in Conference of the Vision Sciences Society, Poster Presentation, Naples, FL.
Arnold, D. H., Tear, M., Schindel, R., and Roseboom, W. (2010). Audio-visual speech cue combination. PLoS ONE 5, e10217. doi: 10.1371/journal.pone.0010217
Barutchu, A., Crewther, D. P., and Crewther, S. G. (2009). The race that precedes coactivation: development of multisensory facilitation in children. Dev. Sci. 12, 464–473.
Barutchu, A., Danaher, J., Crewther, S. G., Innes-Brown, H., Shivdasani, M. N., and Paolini, A. G. (2010). Audiovisual integration in noise by children and adults. J. Exp. Child. Psychol. 105, 38–50.
Bergeson, T. R., and Pisoni, D. B. (2004). “Audiovisual speech perception in deaf adults and children following cochlear implantation,” in The Handbook of Multisensory Processes, eds G. A. Calvert, C. Spence, and B. E. Stein (Cambridge, MA: The MIT Press), 153–176.
Bernstein, L. E. (2005). “Phonetic perception by the speech perceiving brain,” in The Handbook of Speech Perception, eds D. B. Pisoni and R. E. Remez (Malden, MA: Blackwell Publishing), 79–98.
Bernstein, L. E., Auer, E. T., and Moore, J. K. (2004). “Audiovisual speech binding: convergence or association?” in Handbook of Multisensory Processing, eds G. A. Calvert, C. Spence, and B. E. Stein (Cambridge, MA: MIT Press), 203–223.
Berryhill, M., Kveraga, K., Webb, L., and Hughes, H. C. (2007). Multimodal access to verbal name codes. Percept. Psychophys. 69, 628–640.
Braida, L. D. (1991). Crossmodal integration in the identification of consonant segments. Q. J. Exp. Psychol. 43A, 647–677.
Bundesen, C., and Habekost, T. (2009). Principles of Visual Attention: Linking Mind and Brain. Oxford: Oxford University Press.
Colonius, H. (1990). Possibly dependent probability summation of reaction time. J. Math. Psychol. 34, 253–275.
Eidels, A., Houpt, J., Altieri, N., Pei, L., and Townsend, J. T. (2011). Nice guys finish fast and bad guys finish last: A theory of interactive parallel processing. J. Math. Psychol. 55, 176–190.
Fournier, L. R., and Eriksen, C. W. (1990). Coactivation in the perception of redundant targets. J. Exp. Psychol. Hum. Percept. Perform. 16, 538–550.
Fowler, C. A., and Dekle, D. J. (1991). Listening with eye and hand: cross-modal contributions to speech perception. J. Exp. Psychol. Hum. Percept. Perform 17, 816–828.
Fowler, C. A., and Rosenblum, L. D. (1991). “Perception of the phonetic gesture,” in Modularity and the Motor Theory of Speech Perception, eds I. G. Mattingly and M. Studdert-Kennedy (Hillsdale, NJ: Lawrence Erlbaum), 33–59.
Grant, K. W. (2002). Measures of auditory-visual integration for speech understanding: a theoretical perspective. J. Acoust. Soc. Am. 112, 30–33.
Grant, K. W., Walden, B. E., and Seitz, P. F. (1998). Auditory-visual speech recognition by hearing-impaired subjects: consonant recognition, sentence recognition, and auditory-visual integration. J. Acoust. Soc. Am. 103, 2677–2690.
Green, K. P., and Miller, J. L. (1985). On the role of visual rate information in phonetic perception. Percept. Psychophys. 38, 269–276.
Grice, G. R., Canham, L., and Gwynne, J. W. (1984). Absence of a redundant-signals effect in a reaction time task with divided attention. Percept. Psychophys. 36, 565–570.
Jesse, A., and Massaro, D. W. (2010). The temporal distribution of information in audiovisual spoken-word identification. Atten. Percept. Psychophys. 72, 209–225.
Liberman, A. M., and Mattingly, I. G. (1985). The motor theory of speech perception. Cognition 21, 1–36.
Ma, W. J., Zhou, X., Ross, L. A., Foxe, J. J., and Parra, L. C. (2009). Lip reading aids word recognition most in moderate noise: a Bayesian explanation using high-dimensional feature space. PLoS ONE 4, e4638. doi: 10.1371/journal.pone.0004638
Massaro, D. W. (1987). “Speech perception by ear and eye,” in Hearing by Eye: The Psychology of Lip-Reading, eds B. Dodd, and R. Campbell (Hillsdale, NJ: Lawrence Erlbaum), 53–83.
Massaro, D. W. (2004). “From multisensory integration to talking heads and language learning,” in The Handbook of Multisensory Processes, eds G. A. Calvert, C. Spence, and B. E. Stein (Cambridge, MA: The MIT Press), 153–176.
Massaro, D. W., and Cohen, M. M. (2000). Tests of auditory-visual integration efficiency within the framework of the fuzzy logical model of perception. J. Acoust. Soc. Am. 108, 784–789.
Massaro, D. W., Cohen, M. M., and Smeele, P. M. T. (1996). Perception of asynchronous and conflicting visible and auditory speech. J. Acoust. Soc. Am. 100, 1777–1786.
Meredith, M. A., and Stein, B. E. (1983). Interactions among converging sensory inputs in the superior colliculus. Science 221, 389–391.
Miller, J. (1982). Divided attention: evidence for coactivation with redundant signals. Cogn. Psychol. 14, 247–279.
Miller, J. (1986). Time course of coactivation in bimodal divided attention. Percept. Psychophys. 40, 331–343.
Molholm, S., Ritter, W., Javitt, D. C., and Foxe, J. J. (2004). Multisensory visual–auditory object recognition in humans: a high-density electrical mapping study. Cereb. Cortex 14, 452–465.
Pilling, M. (2009). Auditory event-related potentials (ERPs) in audiovisual speech perception. J. Speech Lang. Hear. Res. 52, 1073–1081.
Ponton, C. W., Bernstein, L. E., and Auer, E. T. (2009). Mismatch negativity with visual-only and audiovisual speech. Brain Topogr. 21, 207–215.
Raab, D. H. (1962). Statistical facilitation of simple reaction times. Trans. N. Y. Acad. Sci. 24, 574–590.
Rosenblum, L. D. (2005). “Primacy of multimodal speech perception,” in The Handbook of Speech Perception, eds D. B. Pisoni, and R. E. Remez (Malden, MA: Blackwell Publishing), 51–78.
Ross, L. A., Saint-Amour, D., Leavitt, V. M., Javitt, D. C., and Foxe, J. J. (2007). Do you see what I am saying? Exploring visual enhancement of speech comprehension in noisy environments. Cereb. Cortex 17, 1147–1153.
Sekiyama, K., and Tohkura, Y. (1993). Inter-language differences in the influence of visual cues in speech perception. J. Phon. 21, 427–444.
Sherffert, S., Lachs, L., and Hernandez, L. R. (1997). “The Hoosier audiovisual multi-talker database,” In Research on Spoken Language Processing Progress Report No. 21, Bloomington, IN: Speech Research Laboratory, Psychology (Department), Indiana University.
Sommers, M., Tye-Murray, N., and Spehar, B. (2005). Auditory-visual speech perception and auditory-visual enhancement in normal-hearing younger and older adults. Ear Hear. 26, 263–275.
Sternberg, S. (1969). The discovery of processing stages: extensions of Donder’s method. Acta Psychol. (Amst.) 30, 276–315.
Stevenson, R. A., and James, T. W. (2009). Audiovisual integration in human superior temporal sulcus: inverse effectiveness and the neural processing of speech and object recognition. Neuroimage 44, 1210–1223.
Sumby, W. H., and Pollack, I. (1954). Visual contribution to speech intelligibility in noise. J. Acoust. Soc. Am. 26, 12–15.
Summerfield, Q. (1987). “Some preliminaries to a comprehensive account of audio-visual speech perception,” in The Psychology of Lip-Reading, eds B. Dodd, and R. Campbell (Hillsdale, NJ: LEA), 3–50.
Townsend, J. T. (1971). A note on the identifiability of parallel and serial processes. Percept. Psychophys. 10, 161–163.
Townsend, J. T. (1974). “Issues and models concerning the processing of a finite number of inputs,” in Human Information Processing: Tutorials in Performance and Cognition, ed. B. H. Kantowitz (Hillsdale, NJ: Erlbaum Press), 133–168.
Townsend, J. T. (1990). Truth and consequences of ordinal differences in statistical distributions: toward a theory of hierarchical inference. Psychol. Bull. 108, 551–567.
Townsend, J. T., and Ashby, F. G. (1978). “Methods of modeling capacity in simple processing systems,” in Cognitive Theory, Vol. 3, eds J. Castellan, and F. Restle (Hillsdale, NJ: Erlbaum Associates), 200–239.
Townsend, J. T., and Ashby, F. G. (1983). The Stochastic Modeling of Elementary Psychological Processes. Cambridge: Cambridge University Press.
Townsend, J. T., and Nozawa, G. (1995). Spatio-temporal properties of elementary perception: an investigation of parallel, serial, and coactive theories. J. Math. Psychol. 39, 321–359.
Townsend, J. T., and Schweickert, R. (1989). Toward the trichotomy method: laying the foundation of stochastic mental networks. J. Math. Psychol. 33, 309–327.
Townsend, J. T., and Wenger, M. J. (2004a). The serial-parallel dilemma: a case study in a linkage of theory and method. Psychon. Bull. Rev. 11, 391–418.
Townsend, J. T., and Wenger, M. J. (2004b). A theory of interactive parallel processing: new capacity measures and predictions for a response time inequality series. Psychol. Rev. 111, 1003–1035.
van Wassenhove, V., Grant, K. W., and Poeppel, D. (2005). Visual speech speeds up the neural processing of auditory speech. Proc. Natl. Acad. Sci. U.S.A. 102, 1181–1186.
Walker, S., Bruce, V., and O’Malley, C. (1995). Facial identity and facial speech processing: familiar faces and voices in the McGurk effect. Percept. Psychophys. 59, 1124–1133.
Wenger, M. J., and Townsend, J. T. (2000). Basic response time tools for studying general processing capacity in attention, perception, and cognition. J. Gen. Psychol. 127, 67–99.
Wenger, M. J., and Townsend, J. T. (2001). “Faces as gestalt stimuli: process characteristics,” in Computational, Geometric, and Process Perspectives on Facial Cognition, eds M. J. Wenger, and J. T. Townsend (Mahwah, NJ: Erlbaum Press), 229–284.
Keywords: speech, multisensory integration, coactive, parallel, capacity
Citation: Altieri N and Townsend JT (2011) An assessment of behavioral dynamic information processing measures in audiovisual speech perception. Front. Psychology 2:238. doi: 10.3389/fpsyg.2011.00238
Received: 01 February 2011;
Accepted: 30 August 2011;
Published online: 26 September 2011.
Edited by:
Colin Davis, Royal Holloway University of London, UKReviewed by:
Colin Davis, Royal Holloway University of London, UKAxel Winneke, Jacobs University Bremen, Germany
Copyright: © 2011 Altieri and Townsend. This is an open-access article subject to a non-exclusive license between the authors and Frontiers Media SA, which permits use, distribution and reproduction in other forums, provided the original authors and source are credited and other Frontiers conditions are complied with.
*Correspondence: Nicholas Altieri, Department of Psychology, The University of Oklahoma, 3100 Monitor Avenue, Two Partners Place, suite 280, 1-405-325-3936, Norman, OK 73019, USA. e-mail: nick.altieri@ou.edu