
- 1 Department of Experimental Psychology, Ghent University, Ghent, Belgium
- 2 Laboratoire de Psychologie Expérimentale, CNRS et University René Descartes, Paris, France
In this Perspective Article we assess the usefulness of Google’s new word frequencies for word recognition research (lexical decision and word naming). We find that, despite the massive corpus on which the Google estimates are based (131 billion words from books published in the United States alone), the Google American English frequencies explain 11% less of the variance in the lexical decision times from the English Lexicon Project (Balota et al., 2007) than the SUBTLEX-US word frequencies, based on a corpus of 51 million words from film and television subtitles. Further analyses indicate that word frequencies derived from recent books (published after 2000) are better predictors of word processing times than frequencies based on the full corpus, and that word frequencies based on fiction books predict word processing times better than word frequencies based on the full corpus. The most predictive word frequencies from Google still do not explain more of the variance in word recognition times of undergraduate students and old adults than the subtitle-based word frequencies.
The Importance of Word Frequency for Word Recognition Research
Word frequency is the most important variable in predicting word processing efficiency: High-frequency words are processed faster than low-frequency words, as measured, for instance, with lexical decision and word naming. In recent years, however, it has become clear that not all word frequency estimates are equally predictive. Brysbaert and Cortese (2011), for instance, compared the popular Kučera and Francis (1967) frequencies, based on the Brown corpus, with the SUBTLEX-US frequencies derived from subtitles to movies and television series (Brysbaert and New, 2009). For a set of over 2,000 monosyllabic English words Brysbaert and Cortese found that the percentage of variance accounted for in lexical decision times was 11.3% less with the Kučera and Francis frequencies than with the SUBTLEX frequencies (32.3 vs. 43.5%). This difference is considerable given that, once the frequency effect is partialed out, many other variables explain no more than 1 or 2% of extra variance (Baayen et al., 2006; Brysbaert and Cortese, 2011). As a consequence, an effect of a variable found in an analysis with a suboptimal frequency measure may well turn out be confounded by the frequency measure used (as argued by Zevin and Seidenberg, 2002).
Word Frequency Estimates Based on Google’s Digitized Books
Given the considerable differences in word frequency estimates to explain variance in word processing times, it is important to assess the usefulness of new, interesting sources. Such a source has recently been made available by the internet company Google, which has published sets of ngram frequencies, reflecting the number of occurrences of individual words (1-g) up to sequences of five consecutive words (5-g) in books (Michel et al., 20111). In particular the size of the corpus is impressive. Google has digitized 15 million books from 1500 to 2009 (12% of all books ever published). From this original corpus, they selected a subset of over 5 million books for analysis. The resulting corpus contains 361 billion words in English, 45 billion words in French and Spanish, 37 billion words in German, 35 billion words in Russian, 13 billion words in Chinese, and 2 billion words in Hebrew. In addition, Google provides information about the years in which the books were published.
The Google ngrams are a rich source of information, which will be of great interest for psycholinguistic research. In particular, the size of the corpus is unmatched by any other existing word frequency measure. However, Brysbaert and New (2009) reported two aspects of word frequency estimates that may be of importance for experimental research of word processing. First, they observed that the size of the corpus has little added value above 20–30 million words. Whereas word frequency estimates based on a corpus of 10 million words explained some 10% more of the variance in word processing indices than frequency estimates based on a corpus of 1 million words, there was less than 1% difference between a corpus of 16 million words and a corpus of 50 million words (see also Keuleers et al., 2010a, Footnote 2). Second, Brysbaert and New (2009) observed that word frequency estimates were better predictors of word processing when the frequencies were derived from language registers participants in word recognition experiments (typically undergraduate students) have been exposed to. In particular, Brysbaert and New (2009) found that word frequency estimates based on film subtitles did better than most word frequencies based on written sources, such as fiction and non-fiction books, newspapers, and internet pages.
On the basis of the above considerations, we can make the following predictions about the use of Google ngrams for word recognition tasks:
1. Given the size of the Google corpus and given that frequency estimates do not become better above the size of some 30 million words, word frequencies based on more recent books may be better predictors of word recognition efficiency than word frequencies based on the entire corpus.
2. Given that the predictivity of frequency estimates for word processing efficiency depends on the extent to which the corpus corresponds to the language read by undergraduates, one may expect that fiction books will yield more useful estimates than non-fiction (scientific) books. This can be tested in English (but not in the other languages), because Google provides an estimate based on fiction books alone.
Indeed, when using the Google ngram frequency measure, it is important to keep in mind that Google’s first aim was to make available ngram frequencies that are representative of the books published in a language, rather than representative of the books read by a typical participant in a psychology experiment.
In the analyses below we test the importance of the above considerations. In addition, we compare the usefulness of the Google ngram = 1 estimate to the SUBTLEX-US word frequencies of Brysbaert and New (2009). For the analyses we made use of the following two subcorpora of Google Ngram Viewer:
– The American English corpus: This corpus is limited to books published in the United States. It includes a total 157 billion tokens, of which 130.7 billion tokens are words or numbers2. The fact that the corpus is limited to American English may be interesting, because we will correlate the frequency estimates with the word processing data from the English Lexicon Project (ELP; Balota et al., 2007), which are based on American students.
– The English Fiction corpus: This corpus is limited to all fiction books in the Google database (90.7 billion tokens, of which 75.1 billion are words or numbers). It does not make a distinction between American and British English.
Google’s American English Word Frequencies
We tested the predictivity of Google’s American English word frequencies on the average word processing reaction times (RTs) from the ELP (Balota et al., 2007), in which speakers of American English reacted to 40,000 English words. For each of these words, the ELP lists the average lexical decision time, the standardized lexical decision time, the accuracy in the lexical decision task, the naming time, and the standardized naming time3. The standardized times are based on the z-scores of the participants. Because differences between participants in overall speed and variability are partialed out, this measure contains less noise.
In a first analysis we compared the correlations of the ELP data with the word frequency estimates based on the full Google American English corpus (130.7 billion alphanumeric tokens), based on books published in the 1980s (1980–1989; 13 billion alphanumeric tokens), books published in the 1990s (1990–1999; 16 billion alphanumeric tokens), and books published in the 2000s (2000–2009; 22 billion alphanumeric tokens). Additionally, we looked at the correlation with the SUBTLEX-US frequencies, based on a corpus of 51 million alphanumeric tokens (Brysbaert and New, 2009).
For the analyses of the accuracy data, we exclude the genitive forms of nouns (ending with ’s) and words with an accuracy of 0, leaving us with a total of 39,368 words. For analyses on RTs and standardized reaction times (zRTs) we only looked at words that had a lexical decision accuracy of at least 0.66 (i.e., the words were recognized by at least two thirds of the participants), leaving us with a total of 32,961 words. All frequencies were transformed by taking the base 10 logarithm of the absolute frequency + 1. Table 1 shows the results.
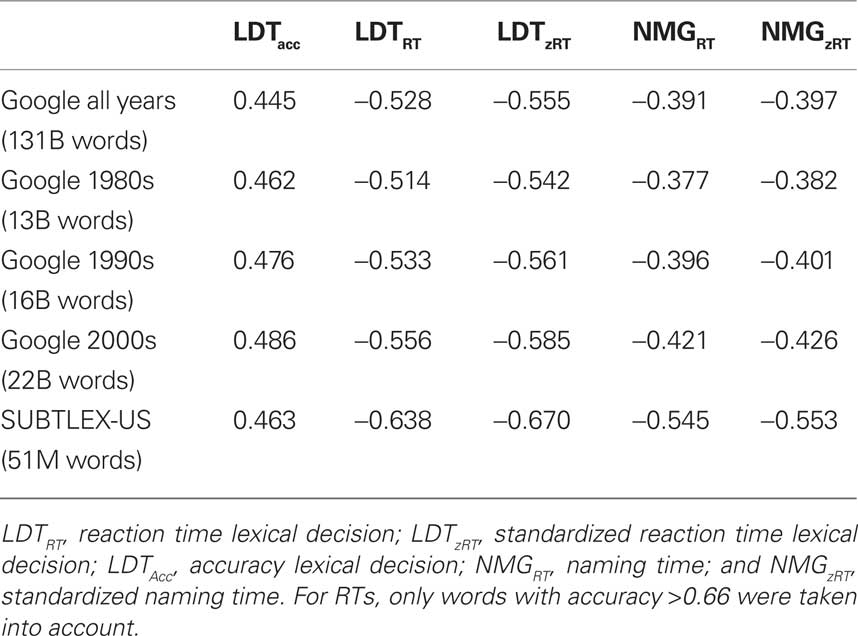
Table 1. Correlations of the Elexicon data with word frequencies estimated on the basis of the Google American English Books Corpus and with SUBTLEX-US word frequencies.
The data in Table 1 illustrate that:
1. The more recent Google word frequencies indeed correlate more with word processing data than the less recent ones. A corpus limited to the books published after 2000 is more predictive than the full corpus.
2. Despite the impressive size of the Google Books corpus, the Google word frequencies in general correlate less with word processing times than the SUBTLEX-US frequencies. This is particularly true for word frequencies based on the entire corpus. Only for accuracy are the recent Google estimates more predictive than SUBTLEX-US.
To further investigate the impact of year published, we correlated the LDT accuracies and RTs with the Google frequencies per year. In addition, rather than looking at the correlations, we measured the percentage of variance explained by polynomials of the third degree. Such polynomials allow us to take into account the fact that the relationship between word processing efficiency and log frequency is not entirely linear (Balota et al., 2004; Baayen et al., 2006; Keuleers et al., 2010b). Finally, we compared three measures provided by Google. The first is the raw frequency of occurrence (the one used in Table 1). The second is the number of pages on which the words are observed, and the third is the number of books in which the words are observed. The latter two measures may be more interesting than the former, given that Adelman et al. (2006) observed higher correlations between word processing times and contextual diversity rather than word frequency. According to them, the number of contexts in which a word appears, is more important than the number of exposures to the word.
Figure 1 shows the outcome of the analysis. It depicts the percentage of variance explained in the lexical decision accuracy and RT data of the Elexicon as a function of the year in which the books were published. It also provides information on the number of words present in each subcorpus (the light gray bars referring to the legend on the right ordinate) and it indicates the percentage of variance explained by the SUBTLEX-US frequencies (the two top lines, indicating the percentages explained by the frequency of occurrence of each word – red line – and the number of films in which the word was used – blue line).
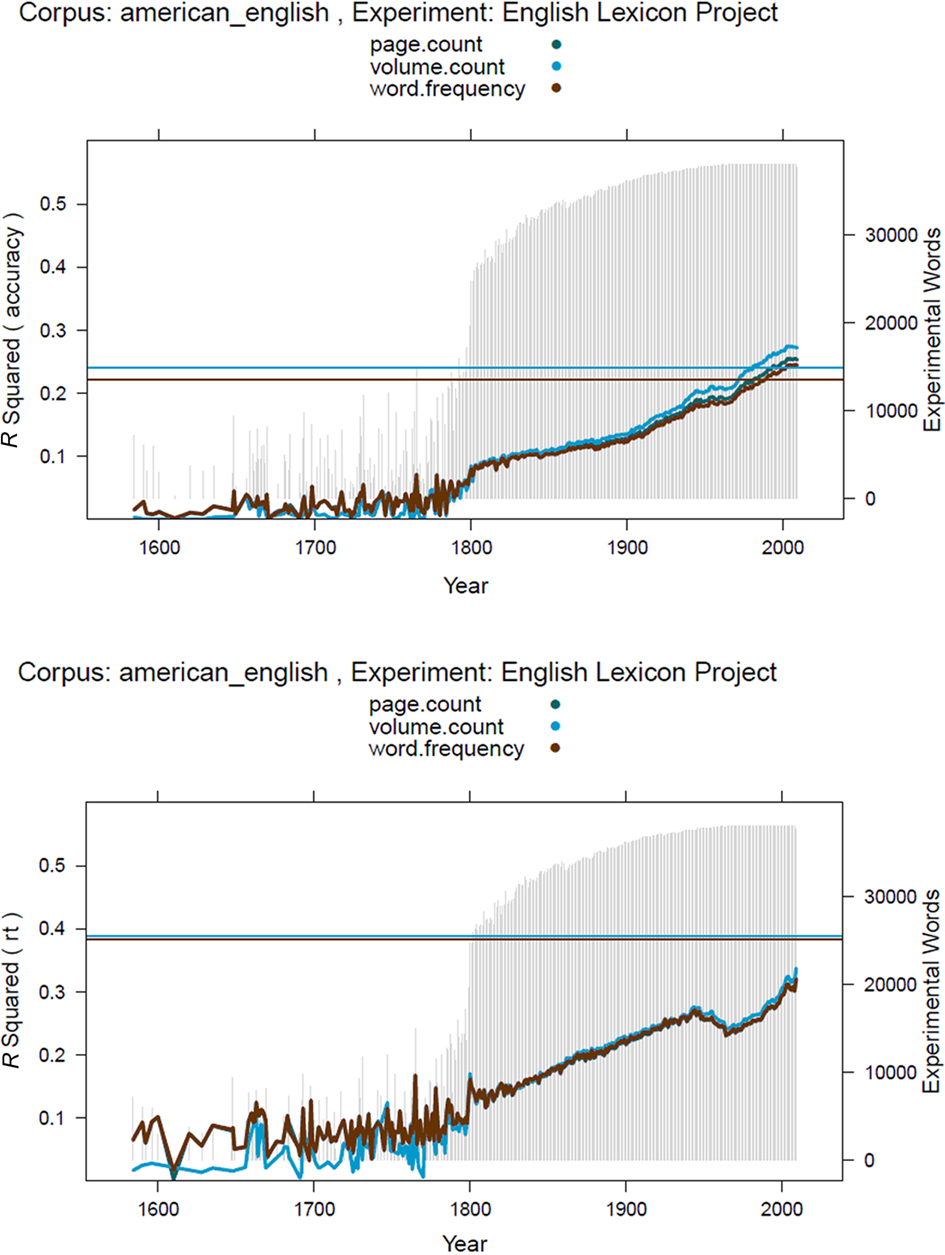
Figure 1. Percentages of variance explained by the Google American English ngrams in the accuracy (top panel) and RT data (bottom panel) of the Elexicon Project as a function of the years in which the books were published. The three lines indicate different values reported by Google: the number of occurrences of the word, the number of pages on which the word occurs, and the number of books in which the word appears. The light gray bars indicate the number of words from the Elexicon Project found in the Google books over the various years (ordinate to the right). The red horizontal line indicates the percentage of variance explained by SUBTLEX-US word frequency; the blue horizontal line indicates the percentage of variance explained by the number of SUBTLEX-US films in which the word appears. RT data based on words with accuracy >0.66.
Several interesting conclusions can be drawn from Figure 1:
1. Very few words from the Elexicon project can be found in books published before 1800 (see the light gray bars). The percentages of variance explained by these frequency estimates therefore tend to be low and subject to considerable noise.
2. There is a huge improvement in the percentage of variance explained over the years, although there is a surprising dip in the last third of the twentieth century, possibly due to the type of works that could be included in Google Books (where issues of availability and copyright may have been the most pressing). Finally, there is also a leveling off in the most recent years, possibly due to the fact that the books from these years may be less representative of all books published (the collection of data ended sometime in 2009).
3. Especially for accuracy, the estimates based on the number of books in which a word appears are better than the estimates based on the number of occurrences of the word and the number of pages on which the words appears. This is the case for nearly all years since 1800 and tends to increase as more books are included. The same pattern is present for response latencies by less outspoken.
4. Only for the most recent (i.e., best) estimates of Google is the percentage variance explained in the accuracy data higher than for SUBTLEX. For RTs, the more often used dependent variable, the best Google estimates remain well below the level reached by the SUBTLEX-US frequencies.
Google’s English Fiction Word Frequencies
To see whether more predictive word frequency estimates on the basis of the Google ngrams are possible, we next analyzed the English fiction corpus. It may be argued that the American English corpus includes too many non-fiction books, unlikely to be read by undergraduate students (the participants of the ELP). If so, we may expect the word frequencies based on the English fiction books to give better results. On the downside, this corpus does not make a distinction between American and British English, which may lead to biased estimates for some words with different usage and spellings in both variants.
Table 2 and Figure 2 show the results of the analyses with the Google English Fiction word frequencies.
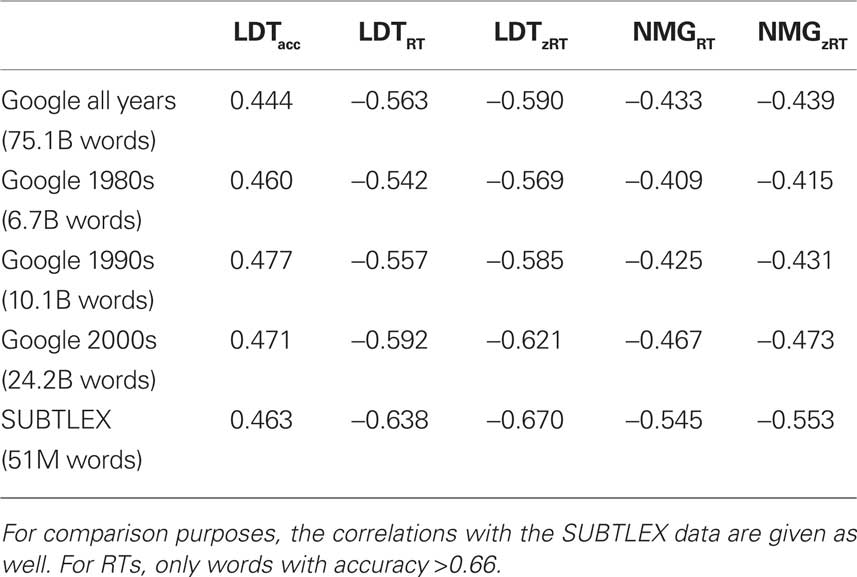
Table 2. Correlations between the Elexicon data and word frequencies estimated on the basis of the Google Books English Fiction corpus.
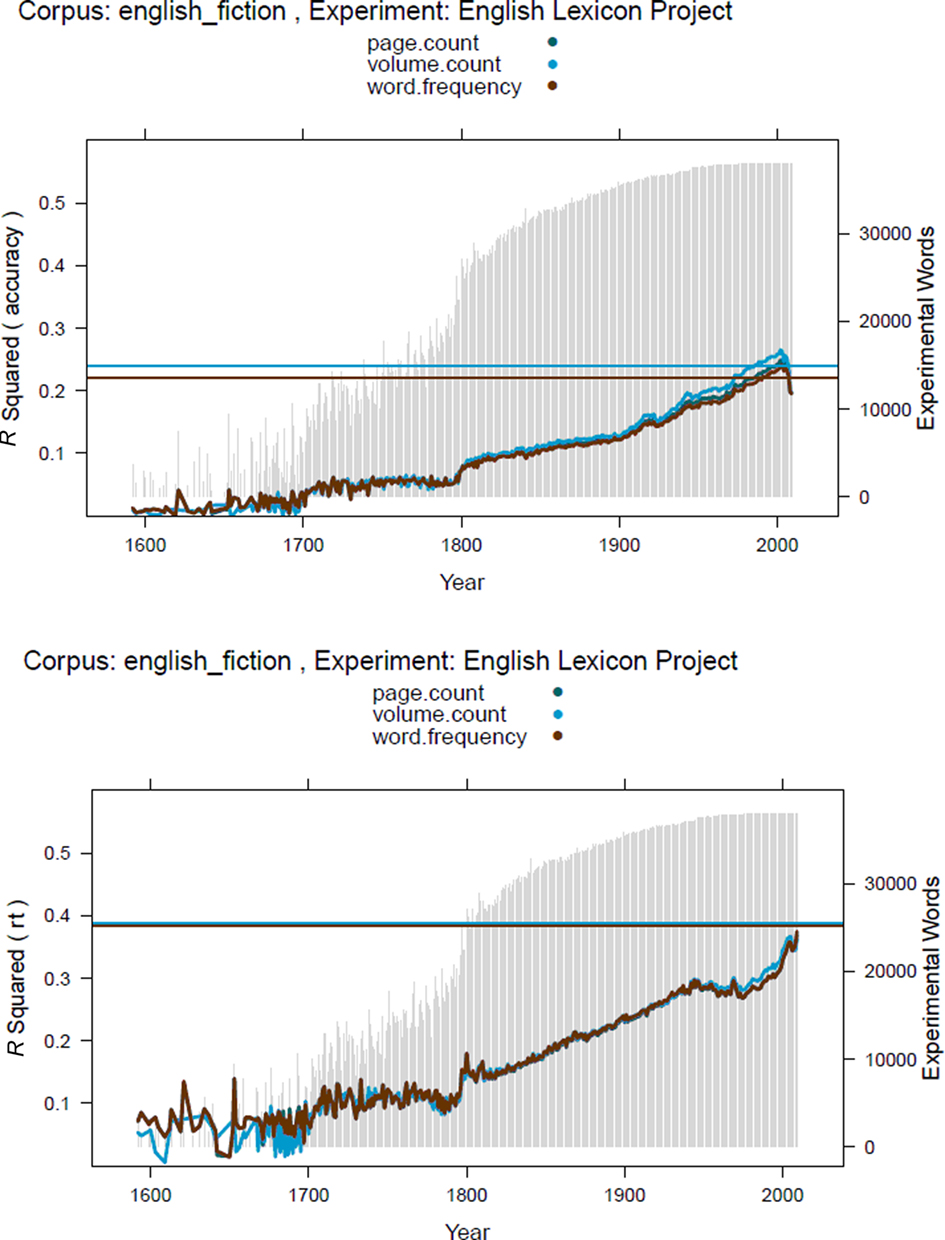
Figure 2. Percentages of variance explained by the Google English Fiction ngrams in the accuracy (top panel) and RT data (bottom panel) of the Elexicon Project as a function of the years in which the books were published. The three lines indicate different values reported by Google: the number of occurrences of the word, the number of pages on which the word occurs, and the number of books in which the word appears. The light gray bars indicate the number of words from the Elexicon Project found in the Google books over the various years (ordinate to the right). The red horizontal line indicates the percentage of variance explained by SUBTLEX-US word frequency; the blue horizontal line indicates the percentage of variance explained by the number of SUBTLEX-US films in which the word appears. RT data based on words with accuracy >0.66.
A comparison of Tables 1 and 2 and Figures 1 and 2 indicates that the Google English Fiction word frequencies indeed are more predictive than the Google American English for RTs but not for accuracy data. In particular, the estimates of the final 2 years (2008–2009) seem to be less good. The difference between word frequency and the number of volumes in which words appear tends to be smaller, suggesting that some of the superiority of the volume variable with the American English corpus may be due to words used very frequently in a limited number of non-fiction books.
At the same time, it remains amazing how good the SUBTLEX-US estimates are, given the small corpus on which they are based. To make sure that the difference between Google Fiction ngram and SUBTLEX-US was not due to low-frequency words that were not present in the SUBTLEX-US corpus, we repeated the RT analyses for those words present in SUBTLEX as well as in Google Fiction 2000+ (N = 30,680). In these analyses as well SUBTLEX explained more variance than Google (lexical decision RTs: 37.8 vs. 31.7%; naming RTs: 27.2 vs. 19.1%). A comparison of the Google frequencies and subtitle-based frequencies in other languages (French, German, Chinese) confirmed this pattern too. For instance, whereas subtitle frequencies explained 34.2% of the variance in the French Lexical Project lexical decision times (Ferrand et al., 2010; N words = 38,043), the Google frequencies from the years 2000–2009 only explained 26.7%. For this language too, more recent frequencies explained more variance than less recent frequencies. Unfortunately, Google did not publish separate fiction estimates for the non-English languages (yet), so that the improvement from Table 1 to Table 2 cannot be realized in these languages.
Why are the More Recent Google Word Frequencies Better?
Two non-mutually exclusive hypotheses can account for the observation that the predictivity of the Google word frequencies increases with publication time. The more exciting hypothesis is that participants in experiments are particularly influenced by words encountered in periods close to the time of the experiment. Word use is a dynamic process, with some words increasing in frequency over the years and others decreasing. Therefore, the Google word frequencies of the 2000s decade could be more predictive because the ELP was run in the early 2000s.
A second, more mundane hypothesis is the type of input. Maybe the books included in Google Books in recent years are a more representative sample of everyday language use. Now that books are made electronically, they no longer have to be scanned (reducing the costs and reading errors). Furthermore, as the Google Books project gained commercial impetus, publishers may be have been more likely to submit their books, further increasing the representativeness of the books covered. A comparison of the American English and English Fiction corpora, for instance, indicates that the share of fiction books was higher in the 2000s than in the 1980s (see the word counts in Tables 1 and 2).
To assess the relative importance of the two factors, we need a word processing experiment that has been repeated with an interval of several years. The best candidate we could find was the megastudy published by Seidenberg and Waters (1989) in which nearly 3,000 words were named by 30 students. Many of these words were named again in the Elexicon Project nearly 20 years later (Balota et al., 2007). There were 2,724 words in common. Figure 3 shows the percentages of variance explained in the naming latencies of both studies by the Google American English word frequency estimates.
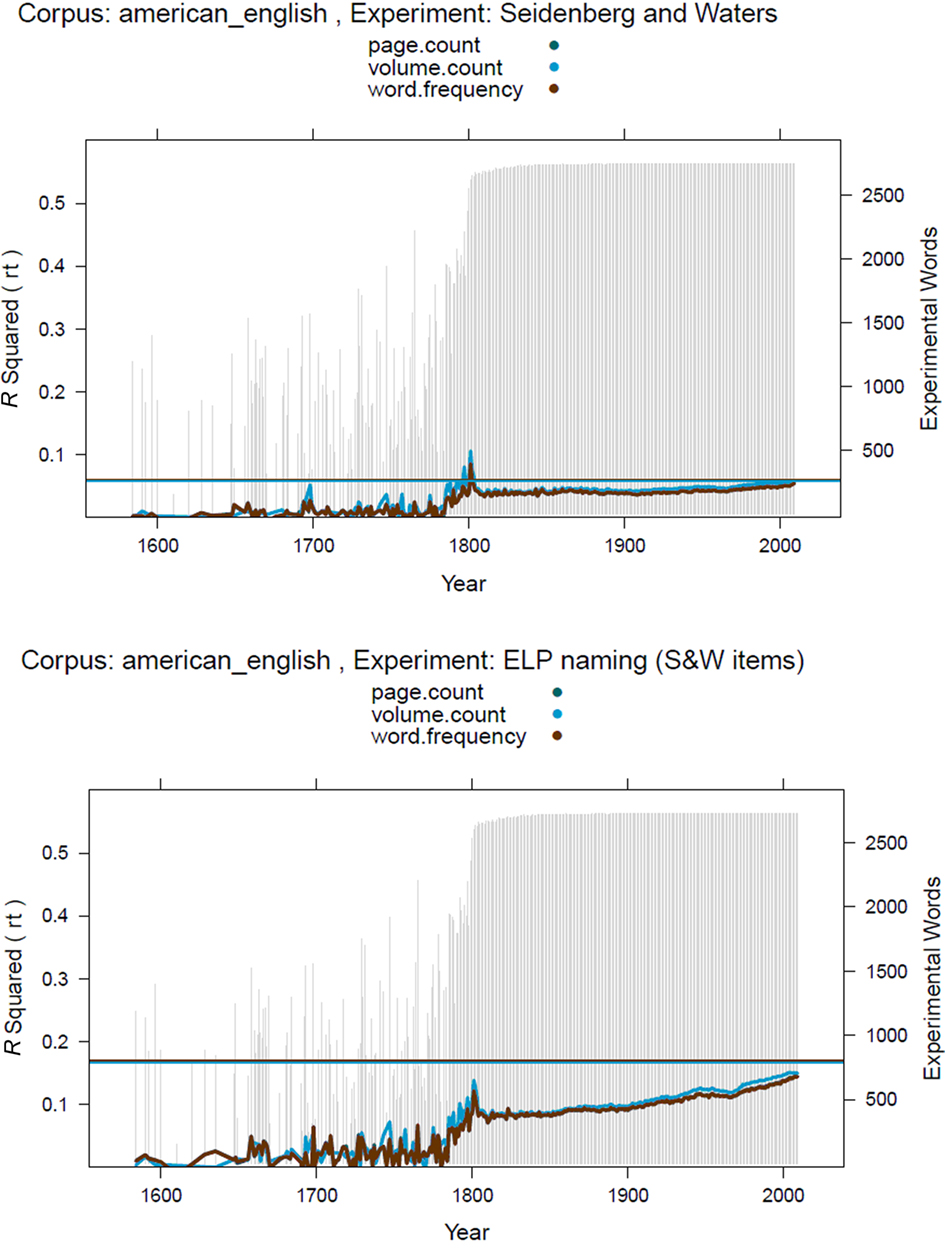
Figure 3. Percentages of variance explained by the Google American English ngrams in the naming latencies of the Seidenberg and Waters (1989) word naming study (top) and the Balota et al. (2007) replication (bottom). Horizontal lines: Percentages of variance explained by SUBTLEX-US. The patterns are similar for the English Fiction ngrams.
There are several interesting aspects in Figure 3:
1. The percentage of variance explained by word frequency is much lower in the original Seidenberg and Waters (1989) than in the Elexicon Project (Balota et al., 2007). One reason for this may be the microphone used to detect voice onset times. Treiman et al. (1995) reported that no less than 22.8% of the variance in Seidenberg and Waters’s RTs was uniquely due to the first phoneme of the words, more than in other similar experiments. The importance of good time registration in word naming studies has been highlighted by Rastle and Davis (2002) and Duyck et al. (2008).
2. Surprisingly, the best Google frequency estimates for this sample of stimuli seem to be those from shortly after 1800! As in Figure 1, there is an increase in predictivity from the beginning of the twentieth century to the beginning of the twenty-first century.
3. Most importantly, however, the increase seems to be very similar for the 1989 study and the 2007 replication. There is no decline in variance accounted for in the Seidenberg and Waters (1989) data toward the end of the curve (30 years after the study was run), suggesting that the increased representativeness of the corpus texts in recent years is a more important factor than the time of the experiment.
Another way to examine whether the year published has practical relevance for psycholinguists is to compare the results of two participant groups that differ in age. Two such studies were published by Balota et al. (2004; see also Spieler and Balota, 1997, 2000). In these studies, a group of young adults (mean age early 20) and a group of old adults (mean age over 70) took part in a lexical decision task4. It might be argued that old participants are more influenced by “old” frequencies than young participants. Indeed, Brysbaert and New (2009, Footnote 6) reported some evidence for this possibility. When they compared word frequency estimates based on films before 1990 to word frequency estimates based on films after 1990, they observed that the pre-1990 frequencies explained 3% less of the variance in the lexical decision times of the young participants of Spieler and Balota, but 1.5% more in the lexical decision times of the old participants.
Figure 4 shows the percentages of variance explained in the lexical decision latencies of the young and the old participants by the Google American English frequency estimates. As in Figure 3, the two curves are largely the same, although the increase in predictivity over the last 30–40 years seems to be slightly bigger for the young participants than for the old. This pattern again suggests that the improved predictivity of the Google ngram frequencies in recent years has largely to do with the quality of the corpus, although there is a hint of an effect due the changes in word use over time. In this respect, it will be interesting to see how the patterns of results for the various RT databases evolve over the coming decades (centuries), provided that the Google Books ngrams are regularly updated.
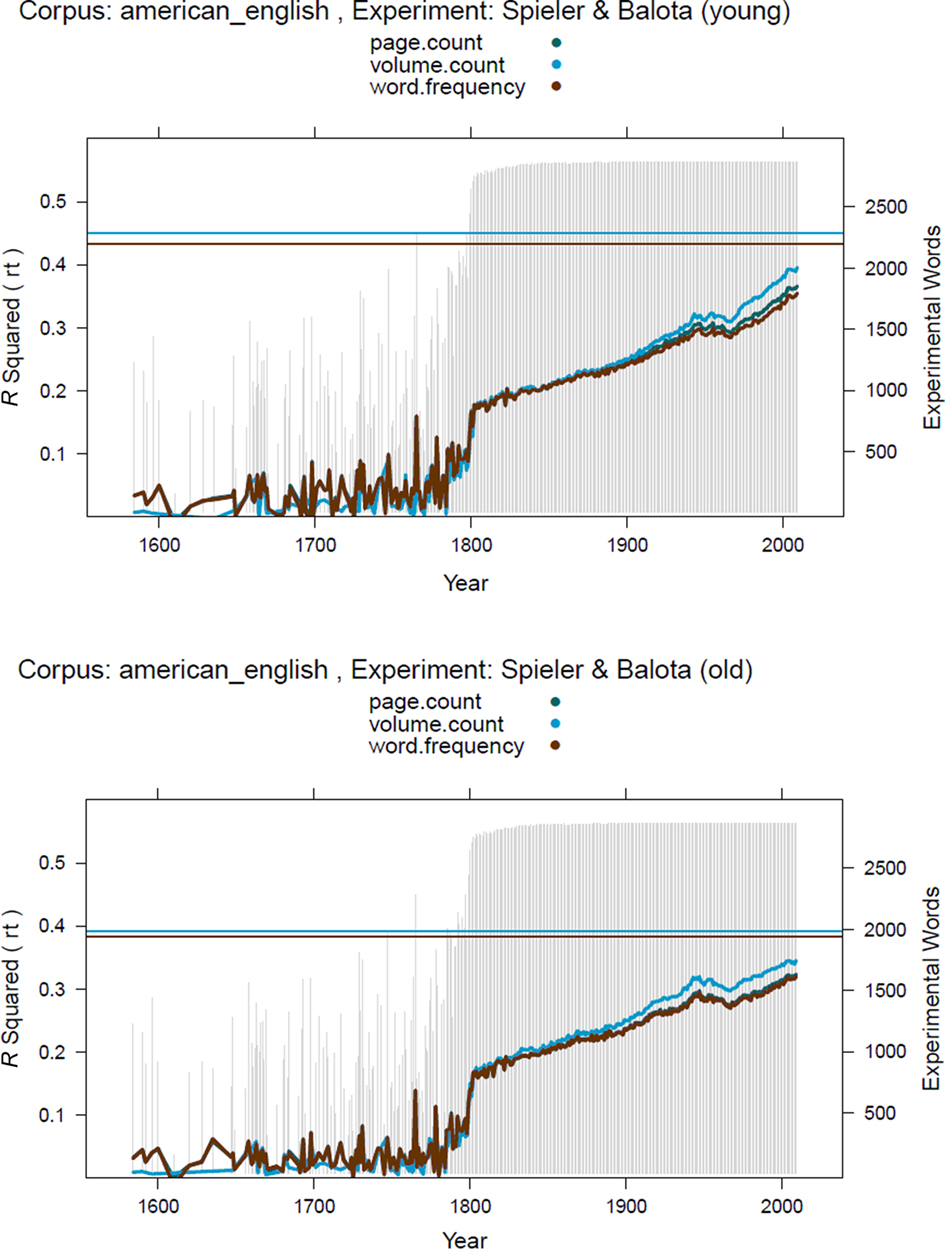
Figure 4. Percentages of variance explained by the Google American English ngrams in the lexical decision latencies of Spieler and Balota. Top: data for the young participants; Bottom: data for the old participants. Horizontal lines: Percentages of variance explained by SUBTLEX-US. The patterns are similar for the English Fiction ngrams.
Conclusion
Despite the enormous size of the corpus, a thoughtless use of the Google word ngrams is likely to result in a suboptimal measure of word frequency for word recognition research based on lexical decision and word naming. As our analyses show, frequency estimates based on the complete corpus are worse than frequency estimates based on the years 2004–2007. Further improvements (at least for the prediction of RTs) can be made by using the English Fiction corpus rather than the American English corpus. The most likely reason for these findings is that old books and non-fiction books are not very representative for the type of language read by undergraduate students.
At the same time it is remarkable that even the best Google frequencies are not better predictors of RTs (which tend to be the more important variable in psycholinguistic research) than the SUBTLEX frequencies based on a much smaller corpus. The better performance of SUBTLEX was true not only for experiments with student participants, but also for Balota et al.’s (2004) study with old adults (Figure 4). This means that word frequency in psycholinguistic word recognition experiments is still best controlled on the basis of subtitle frequencies (possibly in combination with a written frequency measure; Brysbaert and New, 2009). Subtitle frequencies are available for French (New et al., 2007), Chinese (Cai and Brysbaert, 2010), Spanish (Cuetos et al., 2011), and can easily be compiled for other languages.
The recent Google word frequencies are more predictive for word recognition times than the older ones. The main reason for this seems to be that the books entered in the Google books database after 2000 are more representative of everyday language. We did not find convincing evidence for enhanced predictive power of the frequencies around the time of testing (Figure 3), maybe because the time period that could be investigated (between 1989 and 2007) was too short. We did not find a drop in the predictivity of the more recent frequency estimates for old participants either, as had been reported for the subtitle frequencies by Brysbaert and New (2009, Footnote 6). The fact that frequencies based on recent books are better than those based on older books means that the Google English One Million corpus is the worst corpus to use for psycholinguistic research, because this corpus equates the number of words across time and, therefore, includes less recent books than the other corpora.
Conflict of Interest Statement
The authors declare that the research was conducted in the absence of any commercial or financial relationships that could be construed as a potential conflict of interest.
Footnotes
- ^http://ngrams.googlelabs.com/
- ^Most other tokens were punctuation marks.
- ^Similar results were obtained with the more recent British Lexicon Project (Keuleers et al., in preparation).
- ^There was also a naming experiment, which is not reported here as the data do not add anything to the conclusions.
References
Adelman, J. S., Brown, G. D. A., and Quesada, J. F. (2006). Contextual diversity, not word frequency, determines word naming and lexical decision times. Psychol. Sci. 17, 814–823.
Baayen, R. H., Feldman, L. B., and Schreuder, R. (2006). Morphological influences on the recognition of monosyllabic monomorphemic words. J. Mem. Lang. 55, 290–313.
Balota, D. A., Cortese, M. J., Sergent-Marshall, S. D., Spieler, D. H., and Yap, M. J. (2004). Visual word recognition of single-syllable words. J. Exp. Psychol. Gen. 133, 283–316.
Balota, D. A., Yap, M. J., Cortese, M. J., Hutchison, K. A., Kessler, B., Loftis, B., Neely, J. H., Nelson, D. L., Simpson, G. B., and Treiman, R. (2007). The English lexicon project. Behav. Res. Methods 39, 445–459.
Brysbaert, M., and Cortese, M. J. (2011). Do the effects of subjective frequency and age of acquisition survive better word frequency norms? Q. J. Exp. Psychol. 64, 545–559.
Brysbaert, M., and New, B. (2009). Moving beyond Kučera and Francis: a critical evaluation of current word frequency norms and the introduction of a new and improved word frequency measure for American English. Behav. Res. Methods 41, 977–990.
Cai, Q., and Brysbaert, M. (2010). SUBTLEX-CH: Chinese word and character frequencies based on film subtitles. PLoS ONE 5, e10729. doi: 10.1371/journal.pone.0010729
Cuetos, F., Glez-Nosti, M., Barbon, A., and Brysbaert, M. (2011). SUBTLEX-ESP: Spanish word frequencies based on film subtitles. Psicologica. 32, 133–143.
Duyck, W., Anseel, F., Szmalec, A., Mestdagh, P., Tavernier, A., and Hartsuiker, R. J. (2008). Improving accuracy in detecting acoustic onsets. J. Exp. Psychol. Hum. Percept. Perform. 34, 1317–1326.
Ferrand, L., New, B., Brysbaert, M., Keuleers, E., Bonin, P., Meot, A., Augustinova, M., and Pallier, C. (2010). The French lexicon project: lexical decision data for 38,840 French words and 38,840 pseudowords. Behav. Res. Methods 42, 488–496.
Keuleers, E., Brysbaert, M., and New, B. (2010a). SUBTLEX-NL: a new frequency measure for Dutch words based on film subtitles. Behav. Res. Methods 42, 643–650.
Keuleers, E., Diependaele, K., and Brysbaert, M. (2010b). Practice effects in large-scale visual word recognition studies: a lexical decision study on 14,000 Dutch mono- and disyllabic words and nonwords. Front. Psychol. 1:174. doi: 10.3389/fpsyg.2010.00174
Kučera, H., and Francis, W. (1967). Computational Analysis of Present-day American English. Providence, RI: Brown University Press.
Michel, J. B., Shen, Y. K., Aiden, A. P., Veres, A., Gray, M. K.; Google Books Team, Pickett, J. P., Hoiberg, D., Clancy, D., Norvig, P., Orwant, J., Pinker, S., Nowak, M. A., and Aiden, E. L. (2011). Quantitative analysis of culture using millions of digitized books. Science 331, 176–182.
New, B., Brysbaert, M., Veronis, J., and Pallier, C. (2007). The use of film subtitles to estimate word frequencies. Appl. Psycholinguist. 28, 661–677.
Rastle, K., and Davis, M. H. (2002). On the complexities of measuring naming. J. Exp. Psychol. Hum. Percept. Perform. 28, 307–314.
Seidenberg, M. S., and Waters, G. S. (1989). Word recognition and naming: a mega study. Bull. Psychon. Soc. 27, 489.
Spieler, D. H., and Balota, D. A. (1997). Bringing computational models of word naming down to the item level. Psychol. Sci. 8, 411–416.
Spieler, D. H., and Balota, D. A. (2000). Factors influencing word naming in younger and older adults. Psychol. Aging 15, 225–231.
Keywords: word frequency, lexical decision, Google Books ngrams, SUBTLEX
Citation: Brysbaert M, Keuleers E and New B (2011) Assessing the usefulness of Google Books’ word frequencies for psycholinguistic research on word processing. Front. Psychology 2:27. doi: 10.3389/fpsyg.2011.00027
Received: 11 January 2011;
Paper pending published: 01 February 2011;
Accepted: 08 February 2011;
Published online: 02 March 2011.
Edited by:
Guillaume Thierry, Bangor University, UKReviewed by:
Olaf Hauk, MRC Cognition and Brain Sciences Unit, UKNina Kazanina, University of Bristol, UK
Copyright: © 2011 Brysbaert, Keuleers and New. This is an open-access article subject to an exclusive license agreement between the authors and Frontiers Media SA, which permits unrestricted use, distribution, and reproduction in any medium, provided the original authors and source are credited.
*Correspondence: Marc Brysbaert, Department of Experimental Psychology, Ghent University, H. Dunantlaan 2, B-9000 Gent, Belgium. e-mail: marc.brysbaert@ugent.be