
- 1 Université de Toulouse, Université Paul Sabatier, Centre de Recherche Cerveau et Cognition, Toulouse, France
- 2 Centre National de la Recherche Scientifique, Centre de Recherche Cerveau et Cognition, Toulouse, France
In speeded categorization tasks, decisions could be based on diagnostic target features or they may need the activation of complete representations of the object. Depending on task requirements, the priming of feature detectors through top–down expectation might lower the threshold of selective units or speed up the rate of information accumulation. In the present paper, 40 subjects performed a rapid go/no-go animal/non-animal categorization task with 400 briefly flashed natural scenes to study how performance depends on physical scene characteristics, target configuration, and the presence or absence of diagnostic animal features. Performance was evaluated both in terms of accuracy and speed and d′ curves were plotted as a function of reaction time (RT). Such d′ curves give an estimation of the processing dynamics for studied features and characteristics over the entire subject population. Global image characteristics such as color and brightness do not critically influence categorization speed, although they slightly influence accuracy. Global critical factors include the presence of a canonical animal posture and animal/background size ratio suggesting the role of coarse global form. Performance was best for both accuracy and speed, when the animal was in a typical posture and when it occupied about 20–30% of the image. The presence of diagnostic animal features was another critical factor. Performance was significantly impaired both in accuracy (drop 3.3–7.5%) and speed (median RT increase 7–16 ms) when diagnostic animal parts (eyes, mouth, and limbs) were missing. Such animal features were shown to influence performance very early when only 15–25% of the response had been produced. In agreement with other experimental and modeling studies, our results support fast diagnostic recognition of animals based on key intermediate features and priming based on the subject’s expertise.
Introduction
The mammalian neural system has evolved to cope with complex sensory stimuli and to decide and program appropriate motor responses in challenging situations. Quick and accurate responses to sudden world events can be crucial for survival (e.g. detecting a predator or a possible prey). The visual system is plastic and can learn frequently encountered visual features or feature contingencies (Jiang and Chun, 2001 ). However, as proposed recently, neural systems in the brain might have been constrained by natural selection for some critical stimuli to produce rapid reliable decisions and responses based on their fast coarse analysis (New et al., 2007 ).
Not surprisingly, behavioral motor responses have been used as a primary tool for inferring elementary mental organization (Luce, 1986 ). In this article, a speeded reaction time (RT) go/no-go visual categorization task (Thorpe et al., 1996 ) was used to analyze the influence of stimulus image content on subjects’ performance. This task has been used extensively since 1996 to demonstrate how quickly our visual system can detect target-objects in natural photographs. Animals, means of transport, food objects, faces, and scene gists can all be categorized with high accuracy (around 95% correct) and with median RTs of about 400 ms (Delorme et al., 2000 ; Fabre-Thorpe et al., 2001 ; VanRullen and Thorpe, 2001 ; Rousselet et al., 2003 ; Joubert et al., 2007 ). The 250–270 ms latencies of earliest responses are so short that they are difficult to explain without arguing that visual processing must be done on the basis of a single feed-forward wave of processing along the ventral visual stream (Delorme and Thorpe, 2001 ; Thorpe and Fabre-Thorpe, 2001 ; VanRullen and Thorpe, 2002 ).
It has been shown recently that computational models relying only on feed-forward processing can perform categorization of natural images with an accuracy that can almost reach human accuracy in specific circumstances (Delorme and Thorpe, 2001 ; Serre et al., 2007 ). Such models rely on a basic dictionary of generic features (Masquelier and Thorpe, 2007 ) which are relatively independent of target viewpoint. The exact description and interaction of these feature detectors in the visual system has so far remained unclear.
The detection of diagnostic features of intermediate complexity could be crucial. Alternatively, global coarse shape of target might also play a central role. The crucial and early use of shape and texture has recently been demonstrated (Elder and Velisavljevic, 2009 ) although subjects were not under any constraints to produce fast responses. But even in rapid categorization tasks in which speeded responses are required, primate might rely on coarse global shape to detect animals in natural images. Indeed monkeys and human subjects still score around 80% correct in such tasks when categorizing achromatic natural images with such reduced contrast (Macé et al., 2005 ) that they can hardly rely on more than 20–30 levels of gray in the image.
One of our goals was to study which image or target characteristics are the most important for determining human performance observed in such rapid visual categorization tasks. It has been shown that categorization of objects could rely on the detection of some particular elements that are diagnostic of their presence (Schyns, 1999 ; Sigala et al., 2002 ; Sowden and Schyns, 2006 ). For example, the detection of an eye could be enough to decide that an animal is present in the scene. The neurophysiological bases for detecting such diagnostic features are present in the visual system. All along the ventral stream of visual processing, the retinal image is processed in a succession of cortical areas coding visual features with increasing complexity up to the infero-temporal cortex (IT) where neurons have view specific responses to the presentation of body parts, eyes, faces, and so on (Gross et al., 1972 ; Perrett et al., 1982 ; Wachsmuth et al., 1994 ; Tanaka, 2003 ). Diagnostic categorization may involve several related mechanisms each of which performs local processing of features of intermediate complexity in a hierarchical network (Ullman et al., 2002 ; Rousselet et al., 2004a ; Serre et al., 2007 ). At the earliest level, basic image features are extracted whereas, at the highest level, categories may be represented.
Throughout our life, our expertise with surrounding objects moulds our visual system and when involved in a given categorization task, subject’s performance might be biased by the implicit priming of pertinent feature detectors. Indeed, task pertinent features have been shown to shape the specificity of IT neuronal responses (Sigala and Logothetis, 2002 ). Selection of basic object features could even be done earlier in the ventral stream, at the level of V4 neurons (Mirabella et al., 2007 ). Such a bias towards fast detection of diagnostic features could be achieved by either lowering the threshold of selective units or, by speeding the rate of information accumulation. Thus, to further refine models of the visual system, we were also interested in understanding how visual processing and performance speed-accuracy trade off would be affected by the presence of particular features. The threshold lowering of selective units would result in a shift of the speed accuracy trade-off towards shorter latencies, whereas a shift of the speed accuracy trade-off curves that vary with response latency would be in favor of a speeded rate of information accumulation.
To address these questions and try and assess which priming model is most biologically plausible, we analyzed the performance of 40 subjects in a fast visual go–no-go animal/non-animal categorization task. Using briefly flashed unmasked natural scenes we restricted the amount of time allowed for information uptake and investigated the integration time needed for global image features and specific target features to affect accuracy and speed of performance.
Materials and Methods
Subjects
Forty volunteers – 20 men and 20 women (mean age of 23 years, range 18–45) categorized 400 photographs using a rapid go/no-go visual categorization task with animals as the target category. Subjects had normal or corrected to normal vision and reported normal color perception. Subjects were mainly university students or members of the laboratory staff and gave their informed consent.
Task and Set Up
Subjects sat in a dimly lit room at about 30–35 cm from a tactile screen. They were presented with 400 natural photographs in four successive series of 100 images each. Sequences were randomized for each individual although some subjects had identical image sequences (subjects were primarily tested to compare performance in humans and monkeys using the same sequence of images). In each series of 100 images, half of the images contained an animal. Subjects placed one hand on a capacitive tactile key located below the screen at waist level to start stimulus presentation. Pictures were flashed for 32 ms at random intervals of 1.5–3 s at the center of a black screen. In between image presentations, a white fixation cross was shown.
Subjects were asked to release the capacitive tactile key as fast and as accurately as possible whenever a presented photograph contained an animal and touch the tactile computer screen on which the image was presented. They had 1 s to release the button and touch the screen when they detected an animal, after which delay the response was considered to be a no-go response. In the absence of an animal-target, they had to keep their hand on the button. In such task, subjects have to make a succession of rapid decisions on the basis of brief stimulus presentations that prevent any exploratory eye movements. Correct – go or no-go – decisions were indicated by a beep noise. Incorrect decisions were followed by a 3- to 4-s display of the incorrectly classified stimuli allowing time for ocular exploration. Subjects could rest as long as they wanted (usually a few minutes) in between each series of 100 images. For those who had never performed the task, 200 additional images were presented before the beginning of the experiment so that they could get familiar with the task in order to eliminate early training effects (Fabre-Thorpe et al., 2001 ).
Stimuli
All the pictures were natural scenes taken from a large commercial CD database (Corel). Targets and distractors were equiprobable and included both close-ups and general views. Animal targets were all vertebrates and included fish, birds, mammals, and reptiles presented in their natural environments. Distractors included landscapes, trees, flowers, objects, monuments, cars… On target trials, subjects had no a priori knowledge concerning the position, the size or the number of targets in the picture. Some target animals were only partly visible, or partially masked in the scene. Images (192 × 128 pixels, corresponding to an angular size of about 25°/15°) were mostly horizontal photographs (73%). They were flashed for two frames at a refresh rate of 62 Hz (non-interlaced), corresponding to a presentation time of 32 ms, using a programmable graphics board (VSG 2, Cambridge Research Systems) mounted in a PC-compatible computer. All images were converted from 24-bit color photographs to 8-bit indexed pixels (GIF format) for display using the Corel algorithm based on a weighed average of the red, green, and blue channels. Among these 400 images, 200 images contained chromatic information – 100 animals and 100 distractors – and 200 images were shown in gray levels – 100 animals and 100 distractors.
Data Analysis
Performance was evaluated both in terms of accuracy and speed. A go response was scored (whether correct on target trials or incorrect on distractor trials) when the subject released the key in less than 1 s. Reaction times – delay between stimulus onset and tactile button release – were recorded for all go responses. A no-go response was scored when the subject kept pressing the key for over 1 s. All analyses described below were performed using Microsoft Excel, and custom Matlab scripts.
Based on signal-detection theory, d′ curves were plotted as a function of time with 1-ms time bin increments. At a given latency, the cumulative numbers of hits and false alarm (FA) responses below that latency were used to calculate d′ = z_hits − z_FA where z is the inverse of the normal distribution function (Macmillan and Creelman, 2005 ). Such d′ curves correspond to the time course of performance and give an estimation of the processing dynamics for the entire subject population.
To compare performance scores reached on different sets of stimuli, comparisons were done on pairs of stimulus sets differing along one characteristic (low versus high luminance for example). To assess the earliest latency at which subjects became more accurate on one of the two stimulus sets, we computed a two-tailed χ2 test on correct target images for each 1-ms bin from 250 to 1000 ms. At a given latency, we counted the number of correct responses for each category with RT faster than the latency limit, then computed the χ2 value and the associated inferential statistics based on the null hypothesis of an homogeneous response distribution between the two stimulus sets. Incorrect responses which are taken into account in the d′ calculation were too few to include in the χ2 statistics. We then found the earliest latency from which the χ2 test always reached significance at p = 0.05 while reaching at least p < 0.001 in the subsequent time bins.
We also computed the RT difference between two sets of specific images using parametric t-tests across the 40 subject’s median RTs.
To study interactions between features, for each pair of characteristics A and B, we considered the following: all images containing A but not B versus all images that contain both A and B characteristics. Computing the difference in median RTs between these two sets of images allows us to determine the influence of B on the categorization of images already containing A. To assess statistics, the standard method would be to use a repeated measure ANOVAs on median RT, but since we are dealing with non-normal RT distributions we preferred to use bootstrap statistics which are insensitive to data probability distributions. Under the null hypothesis that the two sets of images originate from the same distribution, we pooled RTs from both sets A and A + B, and computed a bootstrap distribution of RT difference (1000 repetitions). We then tested if the original RT difference between A and A + B failed within the tail of the bootstrap distribution indicating a significant difference (Wilcox, 2005 ).
Results
Because of the large number of subjects in our study, it was possible to determine the correlation between overall subject accuracy for a given image and mean RT for the same image. If a target is difficult to categorize, i.e. many subjects make an error on this image, then one may expect longer RTs for subjects that correctly categorized this image (Fabre-Thorpe et al., 2001 ). It is indeed what was observed (Figure 1 ): the linear regression between RT and log accuracy (measured in terms of number of errors starting from 1) was highly significant (R2 = 0.96; p < 1E − 7). We noted that the results for the 20 men and 20 women were not significantly different. This result indicates that RT and response accuracy can be used as complementary measures of task difficulty.
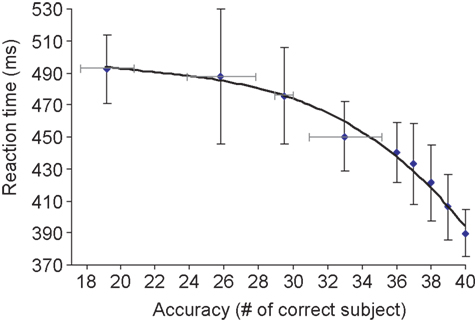
Figure 1. Global accuracy score plotted as a function of mean reaction time on target images. For each target image, we determined the mean reaction time (averaged over 40 subjects) and the accuracy in terms of the number of subjects that categorized the image correctly. More than half of the target-images (112 out of 200) were correctly categorized by all 40 subjects. Failure of a large number of subjects was only observed for a few target images. Vertical bars represent the standard deviation of reaction time on correctly categorized images. For lower accuracy levels (<35 subjects correct out of 40), reaction times were averaged for image clusters of approximately the same size. Four clusters were considered at accuracy levels corresponding to 19, 26, 29, and 33 (number of correct subjects out of 40 subjects), the horizontal bars representing the standard deviation in terms of subjects correct for these clusters. The correlation between accuracy and RT fits to an exponentially decreasing curve as shown above (linear correlation in appropriate log-space R2 = 0.96; p < 2.10−7). For accuracy levels above or equal to 36/40, the relation between accuracy and RT is also close to linear (R2 = 0.98; p = 0.0014).
The first analyses were performed to estimate the role of three global physical image characteristics on subject performance: color information, global luminance, target/background size ratio (see Table 1 ). The role of color was tested in order to confirm previous results obtained in two monkeys and 10 of the present 40 subjects (Delorme et al., 2000 ). We observed no statistically significant differences on median RTs (color targets: 394 ms, BW targets: 398 ms), but subject’s accuracy was slightly higher for color images in both go target trials and no-go distractor trials (targets/distractors: 96.8%/93.9% correct in color; 94.1%/90.8% correct in BW). The 3% difference on target accuracy became significant for RTs above 325 ms when 89% of the response still had to be produced (Figure 2 ). These results replicate on a larger population of subjects the data previously reported for humans and monkeys (Delorme et al., 2000 ). Nevertheless, for the 11% of the targets (more than 1000 trials) that have been categorized with the fastest RTs (<325 ms), no differences could be observed between BW and color images. Thus, the absence of color has no detectable effect on RT, has little effect on accuracy and does not affect accuracy of the fastest responses. Note that, for independent measures, we also studied separately the 30 subjects that did not participate to the original study by Delorme et al. (2000) , RT were similar in both color and BW conditions. When using the d′ over time windows of increasing size, the accuracy difference became significant at about 359 ms (when 27.4% of the stimuli have been categorized).
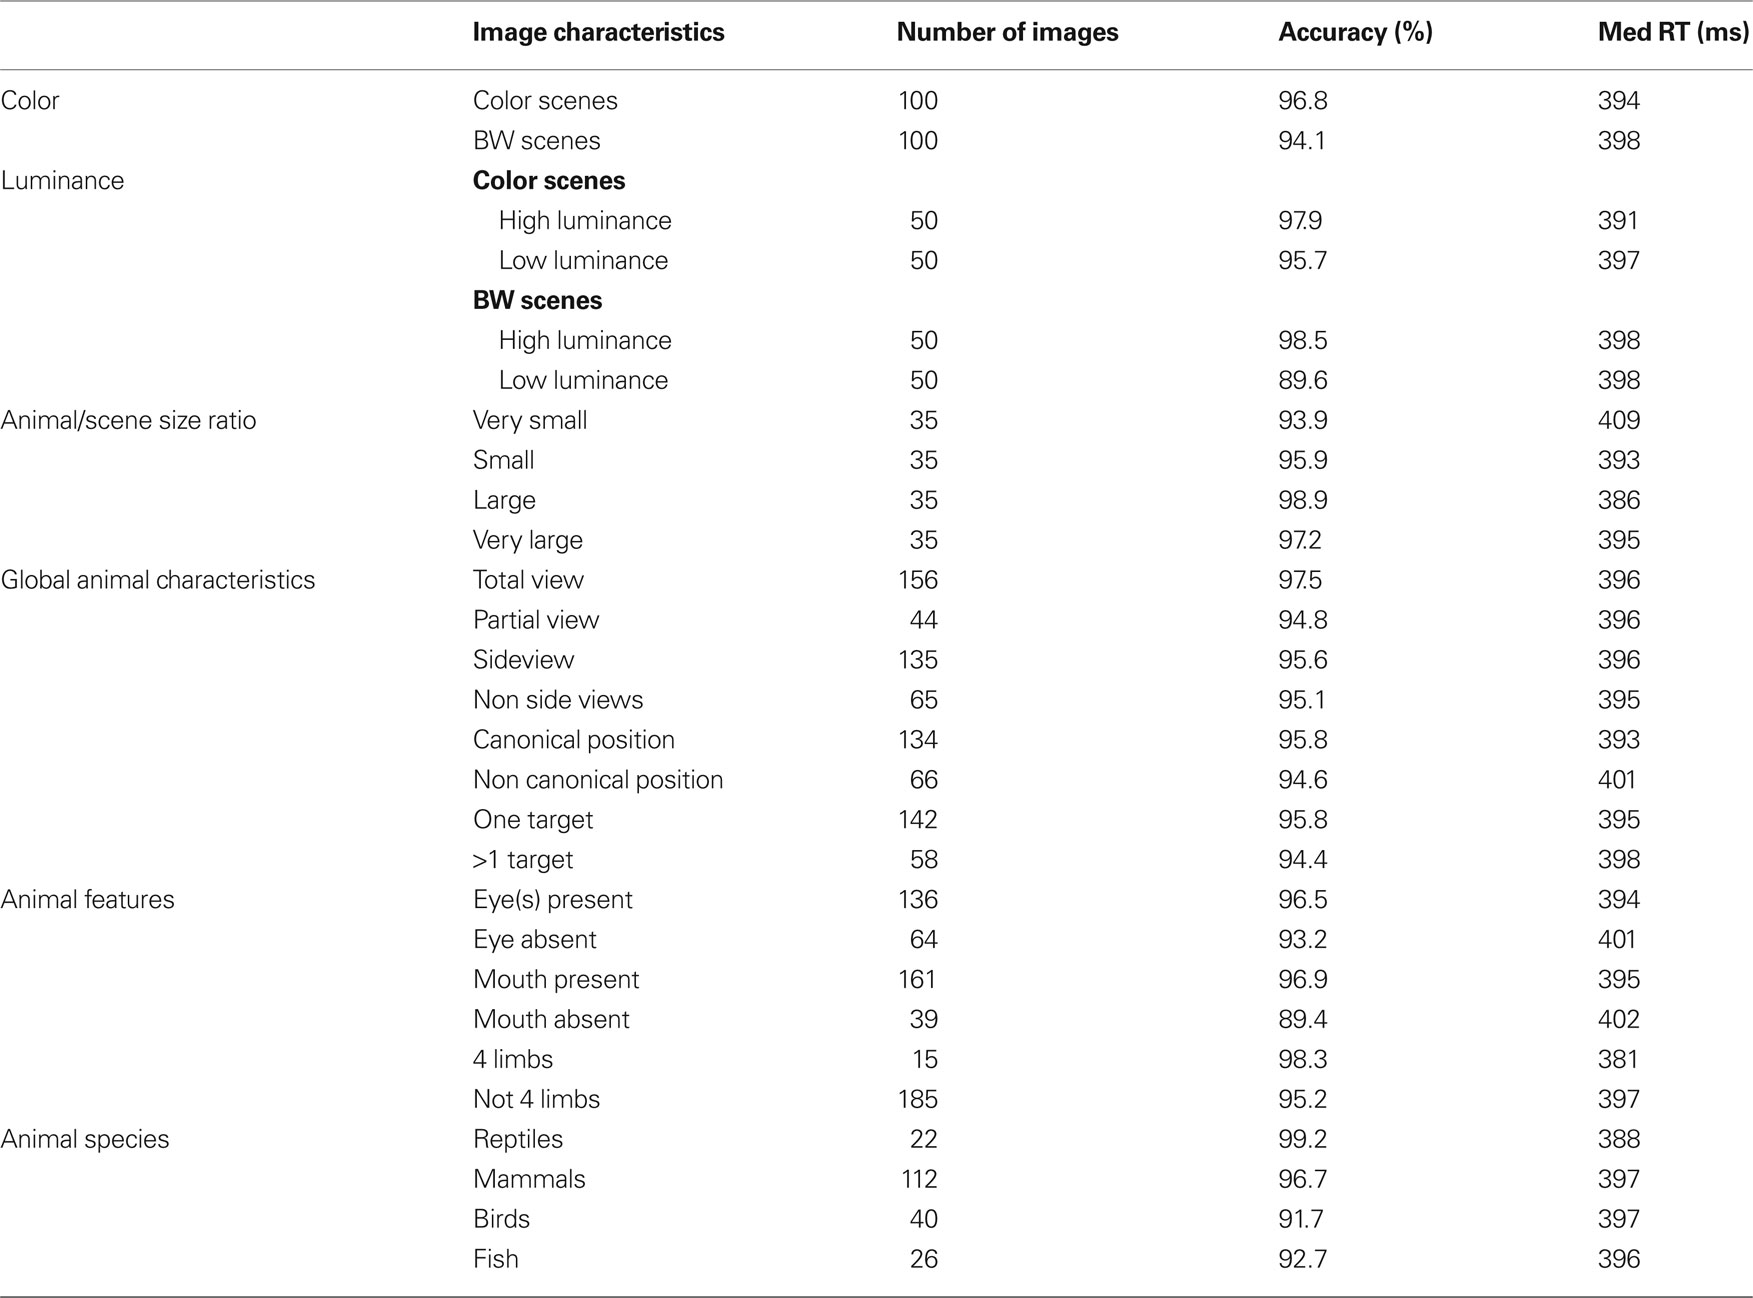
Table 1. Number of photographs considered for the different image characteristics, along with the corresponding accuracy and median response time.
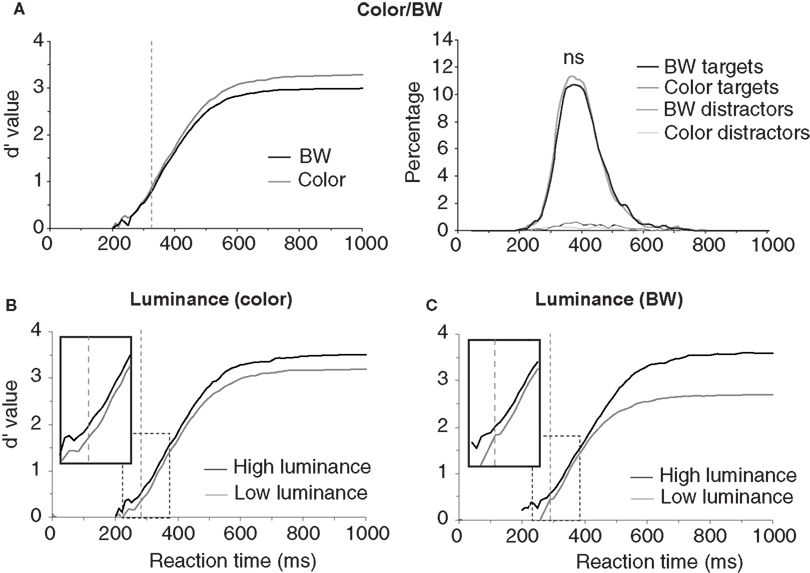
Figure 2. Influence of image luminance and color on performance. (A) Performance on color and BW images. On the right, the reaction-time distributions (plotted as percentage of responses) for target and distractor trials in color or in BW show a small effect around median reaction time. On the left, the dynamic d′ curve indicates that differences in accuracy are observed from 325 ms (vertical dashed line) with color image being more accurately categorized than BW ones (χ2 test at p < 0.05 reaching at least p < 0.001 in the subsequent time bins; see Materials and Methods). However there is no difference in accuracy between BW and color images for the fastest responses. (B) Effect of global image luminance on performance for color photographs reaching significance at 281 ms. C. Effect of global image luminance on performance for BW photographs reaching significance at 292 ms. (B) and (C) The dynamic d′ curves computed for low luminance images are shifted towards longer latencies (see enlargement of dashed rectangle). The vertical dashed line shows the latency at which the accuracy difference becomes significant.
The second image physical characteristic that was tested was the influence of stimulus brightness on categorization performance. Since ganglion cells in the retina respond more rapidly to stimuli with high luminance (Bolz et al., 1982 ), we might expect that bright images could be categorized faster. To estimate image brightness, the average brightness of each pixel was computed in the image (the VSG graphic board ensures that the brightness response of the associated computer monitor is approximately linear with respect to stimulus image brightness). For color pictures, we computed a weighted average of the pixel values for the red, green, and blue channels (0.2126 Red + 0.7152 Green + 0.0722 Blue, Poynton, 2003 ). Color and BW images were all in the mesopic range (0.5–4.1 cd/m2) with an average luminance of 1.9 cd/m2. They were divided into two groups of equal size containing either low-brightness or high-brightness images. The overall results showed that global response latency, as evaluated by median RTs, was not affected by global image brightness; on the other hand a clear effect was seen on accuracy with the “high brightness” set of images being significantly categorized more accurately than the “low-brightness” set (98% vs. 92.9% correct, p < 0.05 from 251 ms then down to at least p < 0.001 at subsequent latencies – see Materials and Methods). This accuracy drop is strongly modulated by the presence or absence of chromatic information (Table 1 ). It is reduced with color images (2.2%) but very pronounced with BW images (8.9%) suggesting that chromatic information might compensate for low brightness. Figure 2 B illustrates separately for images in color and images in BW the temporal dynamics of the subject’s performance for both low and high brightness sets of images. In color, this accuracy difference becomes significant when the response latencies are longer than 281 ms (see Materials and Methods for how the significance was assessed). Significant effects are seen with BW images at about the same latency from 292 ms (Figure 2 ). Looking at the accuracy of the earliest behavioral responses (Figures 2 B,C) a significant 15-ms shift is observed both in color and in BW with the d′ curve for low image luminance shifted towards longer latencies. This might reflect a residual effect of a difference in ganglion cell response latency between images with high versus low stimulus luminance regardless of the presence of chromatic information. Such an increase of response latencies has already been reported with low contrast stimuli (Macé et al., 2005 , 2010 ).
In all the analyses that follow, images in color and BW were pooled together in order to obtain a sufficient number of images for each type of characteristic. We checked in all possible cases that the presence or absence of color had no observable effect on the conclusion of a given analysis.
The last global image characteristic that was checked concerned the relative surface occupied by the animal-target in the images. We hypothesized that subjects would find it easier to categorize images in which animals occupy a large portion of the image rather than to categorize those in which they occupy only a small portion of the image. To estimate the role of the relative surface of the animal in target images, animals were manually cut out from the image (Figure 3 A) then the surface of the animal was calculated by a custom computer program which counted the number of missing pixel in the image. Note that this operation was carried out only on the images containing a single animal (142 out of 200 targets) to obtain four groups of 35 images (the smallest and the largest targets were discarded in the analysis). The four groups of equal size were: “very small” (0.5–10.5% of the image surface), “small” (10.5–18.5%), “large” (18.5–34.5%) and “very large” (34.5–70%). Performance (in accuracy and speed) was best for the group of large animals (98.9% correct, median RT: 386 ms) and worst for the group of very small animals (93.9% correct, median RT: 409 ms) as illustrated in Figure 3 B (see also Table 1 ). The poorer precision seen with the “very small” animals is obviously due to the difficult detection of the animals. Performance was intermediate and very similar for the “small” animal set (95.9% correct, median RT 393 ms) and the “very large” animal set (97.2% correct, median RT 395 ms) both in terms of accuracy and reaction-time distribution (Figure 3 C). Score in response accuracy and speed between these two groups of images were not statistically different. The d′ analysis shows that the target/background size ratio influences performance early on. The effect becomes significant between the “very small” and “large” set of images from 318 ms when only 9.3% of the responses have been triggered. A linear regression computed between RT and target size showed a weak but significant correlation (R2 = 0.04; p = 0.024) with large targets being categorized faster. The correlation was stronger when we considered a linear regression between the log of target size (in pixels) and RT (R2 = 0.1; p = 0.00015). A clear early shift of about 20 ms of the d′ curves is observed when comparing the large animal and very small animal conditions. This shift is present even at the earliest response latencies, suggesting an implicit processing bias due to the subject’s experience with the structure of natural photographs and affecting even the fastest responses. However “very large” animals are very often truncated in the image so that our results might partly reflect the role of target global shape shown by Elder and Velisavljevic (2009) and to a certain extent by one of our previous studies (Macé et al., 2005 ).
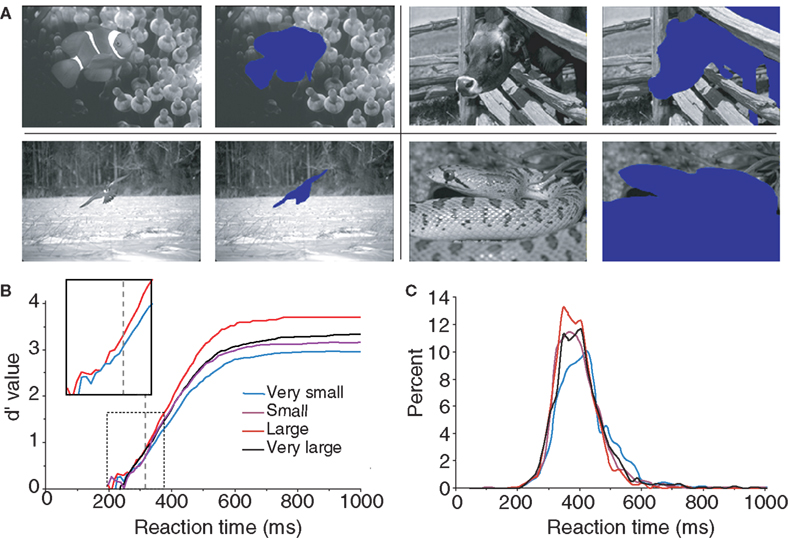
Figure 3. Influence of the relative surface occupied by the animal in target pictures. Only target pictures containing one animal are considered here. (A) Four examples of animals semi-automatically cut out of target pictures to calculate their surface in the picture (one for each size class “very small”, “small”, “large” and “very large”). (B) Dynamic d′ plots (see Materials and Methods) showing how subject accuracy varied over time for the four groups of images containing animals of increasing sizes). The vertical dashed line at 318 ms indicates the latency at which there is a significant difference in accuracy between the “very small” and the “large” animal groups (χ2 test; same as in Figure 2 ). The box shows a close-up view of the dashed rectangle only for the d′ curves computed for “very small” and “large” targets in order to better illustrate the shift towards longer latencies observed with very small targets. (C) Histogram of reaction time (20-ms time bins) for the four sets of stimuli.
To test this hypothesis, we divided the pool of target images in partially visible and completely visible animal photographs. Images containing animals with part of their body outside the limits of the picture or partly hidden behind another object were classified as partially visible (this classification and all the following ones were performed based on visual inspection of target images by experimenter AD). Surprisingly, we did not find any significant difference in terms of RT between these two sets of images (Figure 4 A). The only effect was a decrease in accuracy for partially visible targets (a 2.7% drop in correct responses) that appeared very late at 479 ms when more than 80% of the responses have already been produced.
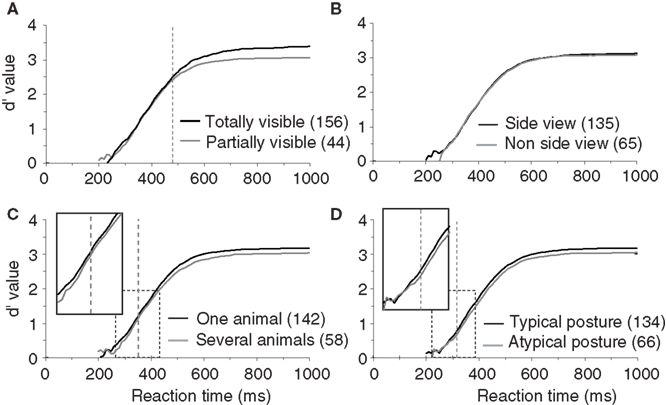
Figure 4.Influence of animal target configuration on subjects performances illustrated with d′ curves. (A) Analysis of performance depending on whether the animal was totally or only partially visible. (B) Influence of the viewpoint of the animal (side-view versus non side-view). (C) Influence of the number of animals in the target image (“one” versus “several”). (D) Influence of the animal posture typical versus atypical. For A–D, as in previous figures, vertical doted lines represent the earliest latency at which a statistically significant effect was seen on accuracy (479 ms for visibility; 353 ms for the number of animal; 316 ms for the animal posture). Numbers in brackets indicate the number of stimuli considered in each class. Boxes show close-up views of the d′ curves within the dashed rectangles.
In addition to whether the animal was partially or totally visible, we also considered other aspects of animal’s appearance that could potentially influence categorization performance: (1) the number of animals present, (2) the position of the animal (side view or not), and (3) the canonical aspect of the animal’s posture. Images containing animals with the majority of the body visible were defined as side view (rotation of more than 45° from a front view). Front, rear, or partial head views were defined as non side-view. We defined a canonical posture as a posture in which you would expect to see the animal in his environment, the animal (close-up or far away view) was in an upright position and totally visible. Non-typical postures could involve animals scraping their back in the dust, or a horse rearing up… Although the criteria used for the last two classifications are debatable, in practice, for the large majority of images the classification was non-ambiguous. The number of images considered in each set is indicated in Figure 4 (see also Table 1 ) that illustrates recorded performance in terms of d′. Whether the animal is seen from the side-view or not had no influence on either categorization accuracy (95.6% vs. 95.1% correct) or categorization speed (mean RT 396 vs. 395 ms). On the other hand, as shown in Figure 4 , the global performance of the subjects does appear to be influenced by the posture of the animal. Subjects are significantly slower (p = 0.001; median RT 401 vs. 393 ms) and less accurate (94.6% vs. 95.8% correct) when the animals are presented in a non-canonical view. The d′ sensitivity curves already differ significantly from 316 ms when less than 10% of the responses have been initiated. Thus the typical position of an animal-target in an image is an important feature to obtain rapid and accurate responses. The presence of “one animal only” also affects performance (see Table 1 ), but the difference only appears when about 25% of the responses have already been produced. This effect is most likely linked with the effect seen with target size because as the number of animals in the photograph increases, they become smaller and harder to detect.
Obviously, global aspects of the target animal only slightly affected performance with the notable exception of the animal relative size in the picture and its canonical posture. We then tested how much the presence of animal features that can be considered as diagnostic of the presence of an animal in a photograph could influence performance. In particular, we were interested in the relative role played by various animal body and face parts. One potentially important diagnostic feature for the presence of an animal could be the presence of eyes in the pictures. Note that since no pictures of humans were included as distractors, presence of eyes really would be good evidence for the presence of a target. We divided the images into two groups, one in which the animal’s eyes were visible and one in which they were not (we did not find any significant differences between images containing one or more eyes so they were pooled together). Even when an eye was only one pixel in size, we considered that the eye was visible. We also studied how the presence or absence of the animal’s mouth (muzzle or beak) could influence performance. Finally we considered the influence of the number of limbs. Although we tried many combinations, performance scores were found most significantly different when considering separately stimuli displaying exactly four limbs and those with more or less than four limbs.
For all these diagnostic features of animal presence, an effect was found both on accuracy and speed of performance. Accuracy was higher when the animal target on the picture included at least one eye, mouth or four limbs (respectively 96.5%, 96.9%, 98.3%) than when these features were absent (respectively 93.2%, 89.4%, 95.2%). The mean RT was also shorter when eyes, mouth, and four limbs were present (respectively 394, 395, 381 ms) than when they were absent (401, 402, 397 ms). The effect on performance speed was found significant for the presence of eye(s) (p < 0.02) and of four limbs (p < 0.001). Figure 5 shows and compares the RT distributions when a given feature is either present or absent. Thus, the effects on performance accuracy ranged from 3.1% to 7.5% of correct responses and the effect on median RT ranged between 7 and 16 ms. This seems to indicate a crucial importance of this type of information for fast categorization.
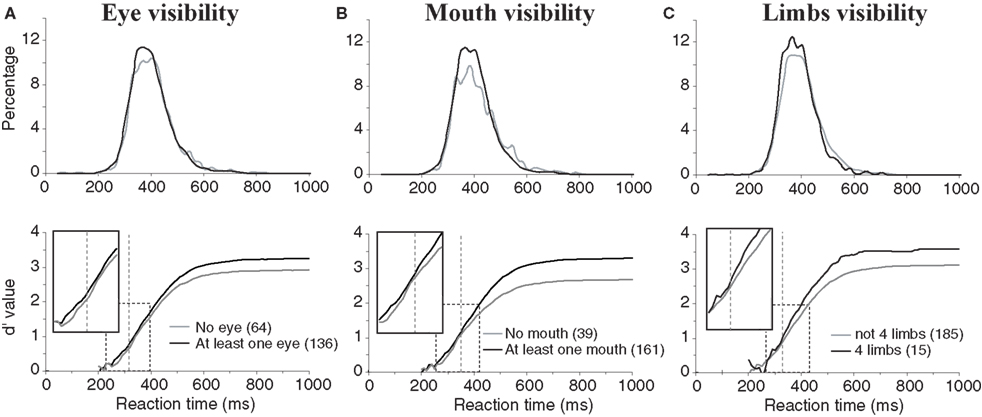
Figure 5. Influences of diagnostic animal features on performance. (A) Presence of eyes. (B) Presence of a mouth (muzzle or beak according to the type of animal). (C) presence of four limbs in the photograph (only considers animals with legs). On the top row, reaction time distributions are represented (20-ms time bins). On the bottom row, the accuracy cumulated across time is represented for the presence or absence of a given characteristic. Vertical dotted lines indicate the earliest latency at which the χ2 test became significant (315 for eyes; 351 for mouths; 328 for four limbs). Boxes show close-up views of the d′ curves within the dashed rectangles to better show the shift of the curves towards longer latencies in absence of the animal feature(s).
As also illustrated in Figure 5 , the divergence of the sensitivity d′ curves was observed early on and shows that the presence of these features affected the accuracy of short latency responses. Looking at the dynamic processing of such features the d′ curves comparing absence and presence of a given “animal” feature diverged first with the presence of eyes (at 315-ms response latency) then with the presence of four limbs (328 ms) and finally with the presence of a mouth (351 ms). The effects were thus observed when less than 15% of the responses had been produced in the case of eyes and limbs, and when 23% of the response had already been produced when the mouth was visible.
One obvious objection to the type of analysis we performed concerns the possibility of interactions between different animal features or configurations. For instance, whenever the eyes are visible it is likely that the mouth will also be visible. To address this problem, we choose to use non-parametric statistics, which are not sensitive to the data distributions. Using a multidimensional space with seven features (eyes, animal view…), two values per feature (presence or absence for eyes, side view or not) and principal component analysis, we showed (Figure 6 ) that several features tended to be grouped (manually circled for easier readability): the presence of eye(s) co-occurs with the presence of mouth(s) in one single visible animal for which four limbs are visible or not. Thus, different configurations tend to be grouped together with typical postures being grouped with side views images and totally visible images. As expected, each pair of opposite features has a mirror position with respect to the origin.
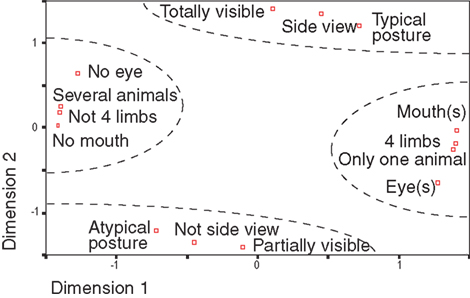
Figure 6. Classes of animal features were decomposed in a multidimensional space using principal component analysis. For each class, the distance with other classes correspond to the proportion of common images between the two classes. All classes have thus coordinates in a multidimensional space and PCA extracts the two first principal dimensions. This representation makes it possible to estimate distance between classes (i.e. the rate of co-occurrence of image characteristics). Complementary classes of characteristics (“partially visible”/“Totally visible” for example) are symmetrical compared to the origin in this space. Very clearly four groups, manually separated in dotted lines, are profiled. This representation only depends on image statistics.
Because of the influence of isolated features on performance, it was interesting to analyze how performance was affected by feature co-occurrence with a special attention to the effect induced by adding a diagnostic animal feature. Fourteen paired groups of images were built based on whether they contained a given feature or not. Although the panel of images was varied enough that even eyes and mouths could be considered separately, some pairs of features could not be considered separately because the image set to consider was too small (especially for the “four limbs” feature) to allow satisfactory statistics. All median RTs computed for the analysis shown Table 2 were computed on image sets that contained at least seven images (mean 58 ± 40), corresponding to around 280 RT values for the smallest set. Table 2 presents the gain in RT when feature B is added to feature A. Although results do not reach significant values in some cases because of the small set of images, a clear tendency to decreased RT is seen when diagnostic animal features (eyes, mouth, four limbs) are present in conjunction with other features. Another factor that tends to have a significant effect on RTs is the animal posture. Thus a RT speedup is seen with combinations of different diagnostic characteristic features.
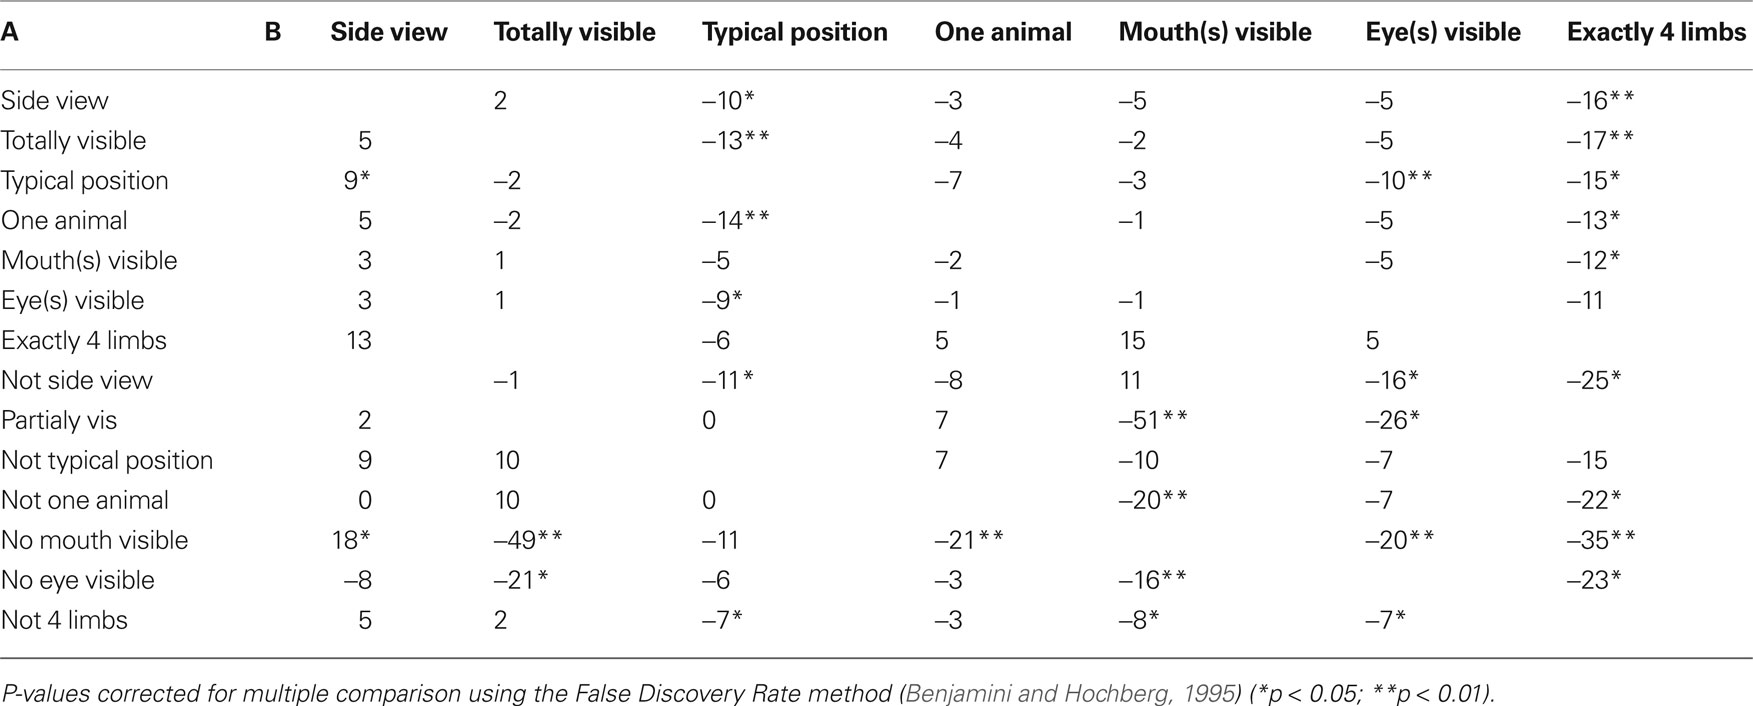
Table 2. Gain for conjunction of features A and B (in ms). Median reaction times were computed separately for the set of images containing feature A without feature B and the set of image containing both A + B. Then the median reaction time computed for the images containing A + B was subtracted from the median reaction time computed for the set of images containing A (without B). All negative values indicate that response was speedup when feature B was added to feature A. The values for A in conjunction with “non B” are opposite to the values of A in conjunction with B and have not been represented.
All the characteristics tested until now related to the configuration and physical characteristics of target images independently of their meanings. However, we may hypothesize that performance might be better for some classes of animals. For example, for humans it is possible that mammals might be considered the most archetypal animal. We thus attempted to estimate the influence of animal species on subjects’ performance by separating images into four groups (see Table 1 ): mammals (n = 112), fish (n = 26), reptiles (n = 22, five images of batrachians were placed in the same class as reptiles), and birds (n = 40). Figure 7 shows that subject’s accuracy is significantly higher for reptiles (99.2% correct) than for other types of images. Subject performance was intermediate for mammals (96.7% correct) and lowest for birds (91.7% correct) and fish (92.7% correct). Response latency was also shorter for reptiles (median RT 388 ms) than for the other three categories (396–397 ms). When only considering the five images of snakes, RT was not significantly shorter for snakes (386 ms) than for other reptiles (391 ms). Interestingly when comparing categorization performance for reptiles and mammals, the influence of species appears early: before 335 ms for accuracy, a time when only 15% of the responses have been produced. We verified that this effect was not due to the luminance or the size effect shown earlier. The luminance of reptile images (average 2.1 cd/m2) was not statistically different (bootstrap and non-parametric tests) from the luminance of the whole pool of target images (average 1.9 cd/m2). Regarding size, reptile images were split according to the four sets studied (very small, n = 5; small, n = 5; large, n = 7; and very large, n = 5) and compared to 10 sets of randomly selected images of same size mammals. The 10 comparisons all showed the “reptile” effect starting at 335 ms; but, due to reduced number of images, significance as defined in methods is reached around 400 ms. Note that we also differentiated between two subcategories of mammals: common mammals for which we know the name (horse, cow, tiger, lion…) and rarer animals that most people would find hard to identify (this included lemurs, atypical bovines, atypical coyotes…). In case of doubt, animals were classified in the rare animal class by experimenter AD. We failed to find any significant differences between the two groups of images for either accuracy or RTs. Although this result should be confirmed by a specific study addressing this question, the data suggest that reptiles might be categorized as an animal faster than any of the other animal groups tested here.
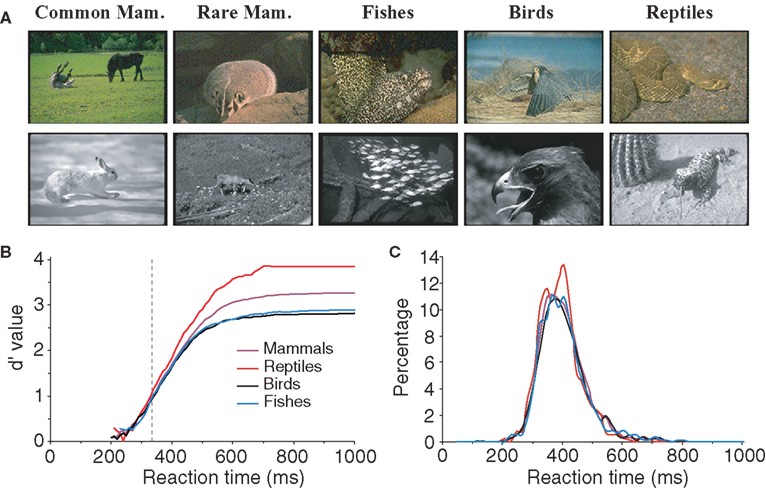
Figure 7. influences of animal specie on subject performance. (A) Various classes of animals: mammals, fish, birds and reptiles are represented for color and BW images. Mammals were first sub-divided into two groups, common mammals (Common Mam.) and rare mammals (Rare Mam.), but no significant difference could be shown (see text) so they were grouped together for later analysis. (B) Variation of subject accuracy with time for different classes of images. Accuracy is best for the reptile class. The vertical dotted line at 335 ms indicates the earliest latency at which the reptile category differs from the mammal category. (C) Reaction time distributions for the different classes of images.
Discussion
All along the ventral stream of visual processing, the retinal image is processed in a succession of cortical areas coding visual features of increasing complexity but it is still debated whether object recognition/categorization requires the complete processing of the object or whether it can rely on the recognition of some diagnostic partial (intermediate) object parts. Our analysis provides a number of clues about some of the image and target characteristics required by rapid categorization of natural images in the early processing of visual information. One important result of our study is that it reveals a top–down influence on the visual system when subjects are involved in categorizing animals in natural scenes. Performance is influenced by global target configuration such as the canonical aspect of the animal posture and by the presence of diagnostic animal parts. It seems thus that, in such rapid categorization tasks, the subjects might base their responses on the global aspect of the target and the processing of one or several intermediate features that are diagnostic of the target category. The subjects could prime the processing of pertinent intermediate features through top–down influences, and such biases could result in faster object processing.
As far as global image characteristics are concerned, the present study analyzed the effect of color, brightness, and relative target/background size. Whereas color is usually shown to play a crucial role in recognition memory paradigms such as delayed to matching task (Gegenfurtner and Rieger, 2000 ; Wichmann et al., 2002 ; Spence et al., 2006 ), its role is disputed in visual search in real-world cuing (Ehinger and Brockmole, 2008 ) and rapid categorization (Delorme et al., 2000 ; Fei-Fei et al., 2005 ). Here we reproduce the small effect of color removal in the rapid categorization task that was obtained both in man and monkey in Delorme et al. (2000) but with a much larger group of subjects. For fast responses, the absence of color information has no effect on response speed or categorization accuracy. The effects that do occur are seen later, starting for responses with latencies over 325 ms so that color could be used in late stage of processing (Yao and Einhauser, 2008 ; Elder and Velisavljevic, 2009 ). Regarding image luminance, the expected advantage for high luminance stimuli was seen for both color and BW stimuli but the effect was earlier and stronger on accuracy with BW stimuli. For low luminance chromatic stimuli, it is possible that color information could partially compensate the information missing in low luminance gray level stimuli.
One of our goals mentioned in the introduction was to try to determine how visual processing could be biased by image and target characteristics using d′ curves. A fixed shift of a d′ curve towards shorter latencies – present even for the earliest responses – could reveal the pre-activation of some feature detectors leading to lower target detection threshold. In contrast, an increase in the rate of information accumulation would result in a shift of the d′ speed accuracy trade-off curves which amplitude would vary with response latency, in other terms a change in the d′ curve slope. A clear shift of d′ curves towards shorter latencies was observed with high luminance stimuli when compared with low luminance stimuli (about 10 ms see Figure 2 ) and an even larger shift (about 20 ms see Figure 3 ) was seen with large target/scene size ratio compared with very small ones. The explanation for the difference observed between high and low luminance stimuli lies probably in the increased latency of neuronal responses with low luminance and low contrast stimuli (Bolz et al., 1982 ). But the optimal performance observed when the target-animal occupies about 20–30% of the total image may depend upon a conjunction of advantages.
The advantage for “large” animals is consistent with the literature, since a similar result was reported recently by Serre et al. (2007) in a backward masking protocol of rapid animal categorization. Both their feed-forward model and their behavioral experimental results showed best performance for “close-body” and worst performance for “far-body” images of animals. In our study the effect of target size on d′ curve is observed even on the earliest responses. Following our hypothesis, such early effect could reflect pre-activation of the visual system leading to lower threshold for target detection. This pre-activation could be due to the fact that human subjects are quite familiar with the processing of natural photographs. This expertise could also lead to implicit bias about the scale of an animal target within a natural scene. This idea of subject’s biased animal representation is further strengthened by the performance improvement obtained when the animal is seen in a canonical posture, which again might be expected by the subject.
Alternatively when processing canonical views and the targets at optimal scale, the visual system can rely both on global target shape and on the maximum number of diagnostic features present, producing a joint effect on the rate of information accumulation. This view is supported by the slight performance improvement observed when the animal is totally visible. However, the effects observed in terms of total visibility were small and affected performance relatively late, when most responses had already been produced (>80% of the responses). This paradoxically small effect could be explained by certain confound such as the fact that very small animal – hardly detectable – would be included in the pool of “totally visible animals” thus masking the role of global shape. Finally, because we use natural scenes, the optimal target/background size ratio might also result from contextual facilitation. Optimal processing of a target-object might be obtained when other contextual objects that usually co-occur with the target are also present such as trees, rocks, grass, flowers… (Bar, 2004 ; Davenport, 2007 ; Oliva and Torralba, 2007 ; Joubert et al., 2008 ).
With the exception of global stimulus luminance, target/background size ratio, and target canonical views, other global image characteristics had only small effects on categorization performance. On the other hand, an effect on both accuracy and speed of performance was seen for each of the diagnostic animal parts that were studied, namely, the eyes, mouth, and limbs and was increased when features appeared in conjunction. The presence of such animal parts appears to play a crucial role. Faster response speed (median RTs were shorter by 7–16 ms when present) was also associated with higher accuracy: an accuracy increase of 3.1–3.6% is observed when all four limbs can be seen or when an eye is visible and the effect reaches 7.5% with the presence of a mouth (muzzle, beak). Moreover the presence of such features can influence accuracy even for fast responses. The sensitivity d′ curves processed in the absence or presence of animal features diverge early when most response still have to be initiated. With the presence of an eye or when all four limbs are visible, d′ curves diverge around 315–328 ms when only 8–12% of the responses have been produced. The effect obtained with an animal mouth (or equivalent) became significant later, at 351 ms but still influenced over 77% of the responses that occurred after that latency. Considering the behavioral effect induced by the presence of animal parts, a shift of the d′ curves towards shorter latencies (10–20 ms) in the “feature present” condition is observed early but not from the very beginning. Since neural mechanisms selective for such features of intermediate complexity are probably not found before V4 or even IT, it might be that the effect we observed results from top–down priming of detection mechanisms, resulting in faster accumulation of information (Ullman, 2007 ).
The fact that target characteristics have a large influence on accuracy and speed of categorization argues in favor of categorization mechanisms based on elements that are diagnostic for the animal targets (Schyns, 1999 ; Humphreys and Forde, 2000 ). This means that the subject might be able to respond using features of intermediate complexity (Rousselet et al., 2003 , 2004b ). This also suggests that visual processing could depend on the task at hand. In the case of animal fast detection, the presence of a diagnostic part of an animal, for instance the presence of eyes, could be sufficient. In fact, target detection is more difficult when targets and distractors share some intermediate features. Accuracy drops for animal detection (and not for vehicle detection) when humans are used as distractors (Evans and Treisman, 2005 ), and speed of response is much slower for dog or bird detection when other animals are used as distractors (Macé et al., 2009 ). The role of such intermediate features in classification tasks has been clearly emphasized by Ullman et al. (2002) and Ullman (2007) . Ullman and colleagues looked for which fragments of image were considered when maximizing incoming information. Informative object fragments for faces included the region of the eye(s), nose, and mouth; for cars they included wheels and windows and for horses they included head, four legs, and neck among others. Rapid categorization of animals could be based on a rich set of such pertinent features. Such features of intermediate complexity based on object fragments have also been shown to emerge with unsupervised learning in a network presented with natural images (Masquelier and Thorpe, 2007 ). In a feed-forward network of spiking neurons presented with a large set of faces or/and a large set of motorbikes, Masquelier and Thorpe (2007) showed that the use of a temporal code associated with a simple spike time dependant plasticity rule allows the emergence of object fragments that are similar to those found by Ullman et al. (2002) and Ullman (2007) . The results obtained in the present study on the role of animal diagnostic features are thus in agreement with these recent modeling studies. In his recent review, Ullman (2007) proposed that “classification performance will increase with fragment-class mutual information”. Extrapolating from Ullman’s model, the presence of different diagnostic fragments should lead to better performance. Indeed our results show that although the presence of four limbs is very informative for detecting an animal, the presence of another animal feature such as an eye or a mouth had an additional effect to reduce response latencies.
However categorization cannot be based only on the presence of some critical object parts: for example the absence of eyes in images containing animals did not prevent subjects from categorizing them. The fact that most animal target characteristics affect the performance of early responses (at about 320 ms) argues for the existence of mechanisms involving massively parallel visual processing of a large set of animal parts or features, the absence of some features being compensated by the presence of others. The early influence of such critical features argues for top–down influences based on task requirements that would bias visual processing in specific populations of neurons selective to pertinent animal feature(s). This top down biases could originate in the prefrontal or even the parietal cortex (Desimone and Duncan, 1995 ; Miller et al., 1996 ). Such evidence has been found both at the level of IT and earlier in the ventral pathway in V4 (Vogels, 1999 ; Sigala and Logothetis, 2002 ; Bichot et al., 2005 ) with a change in baseline activity that depends on task requirements (Mirabella et al., 2007 ). Neural activity is affected by the pertinent target features all over the visual field (Bichot et al., 2005 ), and non-pertinent features could be filtered out (Mirabella et al., 2007 ).
In addition, global shape and relative spatial configuration of diagnostic features might also influence performance. Indeed, some studies have shown that scrambled images of objects that contain object parts but without the appropriate global shape or spatial organization of features are categorized slower and with lower accuracy both in man (Cave and Kosslyn, 1993 ) and monkey (Vogels, 1999 ). This aspect of spatial configuration is particularly important in face perception and even more in face recognition for which the relative distance between the eyes and the mouth is critical (Cooper and Wojan, 2000 ; Leder and Bruce, 2000 ). The fact that in the presence of animal parts (mouth, eye, four limbs) response latencies are shortened when animal targets are presented in a canonical view (Table 2 ) might reflect the use of spatial animal configuration in expected posture.
The last aspect that was found to influence categorization performance was the animal type, with reptiles being classified better (99% correct) and faster than any of the other animal groups (median RT 388 ms only the set of 15 “4 limbs” pictures induced a shorter med RT of 381 ms). One could have thought that the general abstract prototypes of animals that we build over the years are more likely to have been strongly influenced by the appearance of mammals. The fact that accuracy on reptiles is higher than for mammals (99.2% vs. 96.7%) and affect responses that are triggered over 335 ms (around 85% of the responses) could be related to innate aversive reactions in primates (Cook and Mineka, 1990 ) and could suggest an inbuilt representation of “dangerous animals” that evolved gradually in human. Indeed this has been recently suggested in a study using change blindness (New et al., 2007 ), in which the authors showed that changes involving animals or humans where detected faster and with a higher accuracy than changes involving other objects. Even vehicles that moves and are potentially dangerous – alike animals – were not detected as fast and as accurately. It might be biologically critical for survival to be able to process reptiles as fast as possible. Although these results did not depend from the luminance or the size effect, additional experiments will be necessary to reach a strong conclusion about the faster categorization of reptiles.
It is important to emphasize that our study addresses the integration time needed to process specific visual characteristics (Vo and Henderson, 2010 ) when subjects are shown briefly flashed unmasked stimuli and are under strong temporal constraints to produce a response. Even taking into account image persistence, the amount of time allowed for information uptake and processing is quite restricted and we have shown previously using masked stimuli that maximal performance could be reached with only 40-ms SOA in such speeded response task (Bacon-Macé et al., 2005 ). When more time is allowed to gather and process visual information, using longer stimulus duration and requiring responses free from temporal constraints (Elder and Velisavljevic, 2009 ), the relative use of visual information might differ.
Rapid categorization might not even necessarily require conscious perception of the image. Although attention, memory, and conscious perception might be object centered (Mitchell et al., 2004 ), we have shown that fast categorization could be based on lower cues and features of intermediate complexity that do not rely directly on higher cognitive processes. This is consistent with experiments from our group showing that animals can be categorized even when flashed at eccentricities over 50° when subjects report to have no conscious knowledge of the objects that have been presented (Thorpe et al., 2001 ).
Conflict of Interest Statement
The authors declare that the research was conducted in the absence of any commercial or financial relationships that could be construed as a potential conflict of interest.
Acknowledgment
This research was supported by the CNRS and by the University of Toulouse III. The authors wish to thank Simon Thorpe for his fruitful comments on the manuscript.
References
Bacon-Macé, N., Macé, M. J., Fabre-Thorpe, M., and Thorpe, S. J. (2005). The time course of visual processing: backward masking and natural scene categorisation. Vision Res. 45, 1459–1469.
Benjamini, Y., and Hochberg, Y. (1995). Controlling the false discovery rate: a practical and powerful approach to multiple testing. J. R. Stat. Soc. Series B. Stat. Methodol. 57, 289–300.
Bichot, N. P., Rossi, A. F., and Desimone, R. (2005). Parallel and serial neural mechanisms for visual search in Macaque area V4. Science 308, 529–534.
Bolz, J., Rosner, G., and Wassle, H. (1982). Response latency of brisk-sustained (X) and brisktransient (Y) cells in the cat retina. J. Physiol. (Lond.) 328, 171–190.
Cave, C. B., and Kosslyn, S. M. (1993). The role of parts and spatial relations in object identification. Perception 22, 229–248.
Cook, M., and Mineka, S. (1990). Selective associations in the observational conditioning of fear in rhesus monkeys. J. Exp. Psychol. Anim. Behav. Process. 16, 372–389.
Cooper, E. E., and Wojan, T. J. (2000). Differences in the coding of spatial relations in face identification and basic-level object recognition. J. Exp. Psychol. Learn Mem. Cogn. 26, 470–488.
Delorme, A., Richard, G., and Fabre-Thorpe, M. (2000). Ultra-rapid categorisation of natural scenes does not rely on colour cues: a study in monkeys and humans. Vision Res. 40, 2187–2200.
Delorme, A., and Thorpe, S. J. (2001). Face identification using one spike per neuron: resistance to image degradations. Neural. Netw. 14, 795–803.
Desimone, R., and Duncan, J. (1995). Neural mechanisms of selective visual attention. Annu. Rev. Neurosci. 18, 193–222.
Ehinger, K. A., and Brockmole, J. R. (2008). The role of color in visual search in real-world scenes: evidence from contextual cuing. Percept. Psychophys. 70, 1366–1378.
Elder, J. H., and Velisavljevic, L. (2009). Cue dynamics underlying rapid detection of animals in natural scenes. J. Vis. 9, 7.
Evans, K. K., and Treisman, A. (2005). Perception of objects in natural scenes: is it really attention free? J. Exp. Psychol. Hum. Percept. Perform. 31, 1476–1492.
Fabre-Thorpe, M., Delorme, A., Marlot, C., and Thorpe, S. (2001). A limit to the speed of processing in ultra-rapid visual categorization of novel natural scenes. J. Cogn. Neurosci. 13, 171–180.
Fei-Fei, L., VanRullen, R., Koch, C., and Perona, P. (2005). Why does natural scene categorization require little attention? Exploring attentional requirements for natural and synthetic stimuli. Vis. Cogn. 12, 893–924.
Gegenfurtner, K. R., and Rieger, J. (2000). Sensory and cognitive contributions of color to the recognition of natural scenes. Curr. Biol. 10, 805–808.
Gross, C. G., Rocha-Miranda, C. E., and Bender, D. B. (1972). Visual properties of neurons in inferotemporal cortex of the Macaque. J. Neurophysiol. 35, 96–111.
Humphreys, G. W., and Forde, E. M. E. (2000). Category-specific deficits: a review and presentation of the Hierarchical Interactive Theory (HIT). Behav. Brain Sci. 24, 480–481.
Jiang, Y., and Chun, M. M. (2001). Selective attention modulates implicit learning. Q. J. Exp. Psychol. 54A, 1105–1124.
Joubert, O. R., Fize, D., Rousselet, G. A., and Fabre-Thorpe, M. (2008). Early interference of context congruence on object processing in rapid visual categorization of natural scenes. J. Vis. 8, 1–18.
Joubert, O. R., Rousselet, G. A., Fize, D., and Fabre-Thorpe, M. (2007). Processing scene context: fast categorization and object interference. Vision Res. 47, 3286–3297.
Leder, H., and Bruce, V. (2000). When inverted faces are recognized: the role of configuration information in face recognition. Q. J. Exp. Psychol. 53A, 513–536.
Luce, R. (1986). Response Times: Their Role in Inferring Elementary Mental Organization. New York: Oxford University Press.
Macé, M. J., Delorme, A., Richard, G., and Fabre-Thorpe, M. (2010). Spotting animals in natural scenes: efficiency of humans and monkeys at very low contrasts. Anim. Cogn. 13, 405–418.
Macé, M. J., Joubert, O. R., Nespoulous, J. L., and Fabre-Thorpe, M. (2009). The time-course of visual categorizations: you spot the animal faster than the bird. PLoS ONE 4, e5927. doi: 10.1371/journal.pone.0005927.
Macé, M. J., Thorpe, S. J., and Fabre-Thorpe, M. (2005). Rapid categorization of achromatic natural scenes: how robust at very low contrasts? Eur. J. Neurosci. 21, 2007–2018.
Macmillan, N. A., and Creelman, C. D. (2005). Detection Theory: A User’s Guide, 2nd Edn. Mahwah, NJ: Lawrence Erlbaum Associates.
Masquelier, T., and Thorpe, S. J. (2007). Unsupervised learning of visual features through spike timing dependent plasticity. PLoS Comput. Biol. 3, e31. doi: 10.1371/journal.pcbi.0030031.
Miller, E. K., Erickson, C. A., and Desimone, R. (1996). Neural mechanisms of visual working memory in prefrontal cortex of the macaque. J. Neurosci. 16, 5154–5167.
Mirabella, G., Bertini, G., Samengo, I., Kilavik, B. E., Frilli, D., Della Libera, C., and Chelazzi, L. (2007). Neurons in area V4 of the macaque translate attended visual features into behaviorally relevant categories. Neuron 54, 303–318.
Mitchell, J. F., Stoner, G. R., and Reynolds, J. H. (2004). Object-based attention determines dominance in binocular rivalry. Nature 429, 410–413.
New, J., Cosmides, L., and Tooby, J. (2007). Category-specific attention for animals reflects ancestral priorities, not expertise. Proc. Natl. Acad. Sci. U.S.A. 104, 16598–16603.
Oliva, A., and Torralba, A. (2007). The role of context in object recognition. Trends Cogn. Sci. (Regul. Ed.) 11, 520–527.
Perrett, D. I., Rolls, E. T., and Caan, W. (1982). Visual neurones responsive to faces in the monkey temporal cortex. Exp. Brain Res. 47, 329–342.
Poynton, C. (2003). Digital Video and HDTV. Algorithms and Interfaces. San Francisco: Morgan Kaufmann Publishers, 736.
Rousselet, G. A., Macé, M. J., and Fabre-Thorpe, M. (2003). Is it an animal? Is it a human face? Fast processing in upright and inverted natural scenes. J. Vis. 3, 440–455.
Rousselet, G. A., Thorpe, S. J., and Fabre-Thorpe, M. (2004a). How parallel is visual processing in the ventral pathway? Trends Cogn. Sci. 8, 363–370.
Rousselet, G. A., Thorpe, S. J., and Fabre-Thorpe, M. (2004b). Processing of one, two or four natural scenes in humans: the limits of parallelism. Vision Res. 44, 877–894.
Schyns, P. G. (1999). “Diagnostic recognition: task constraints, object information and their interactions,” in Object Recognition in Man, Monkey and Machine, eds M. J. Tarr and H. H. Bülthoff (Cambridge, MA: MIT Press).
Serre, T., Oliva, A., and Poggio, T. (2007). A feedforward architecture accounts for rapid categorization. Proc. Natl. Acad. Sci. U.S.A. 104, 6424–6429.
Sigala, N., Gabbiani, F., and Logothetis, N. K. (2002). Visual categorization and object representation in monkeys and humans. J. Cogn. Neurosci. 14, 187–198.
Sigala, N., and Logothetis, N. K. (2002). Visual categorization shapes feature selectivity in the primate temporal cortex. Nature 415, 318–320.
Sowden, P. T., and Schyns, P. G. (2006). Channel surfing in the visual brain. Trends Cogn. Sci. (Regul. Ed.) 10, 538–545.
Spence, I., Wong, P., Rusan, M., and Rastegar, N. (2006). How color enhances visual memory for natural scenes. Psychol. Sci. 17, 1–6.
Tanaka, K. (2003). Columns for complex visual object features in the inferotemporal cortex:clustering of cells with similar but slightly different stimulus selectivities. Cereb. Cortex 13, 90–99.
Thorpe, S. J., and Fabre-Thorpe, M. (2001). Neuroscience. Seeking categories in the brain. Science 291, 260–263.
Thorpe, S. J., Fize, D., and Marlot, C. (1996). Speed of processing in the human visual system. Nature 381, 520–522.
Thorpe, S. J., Gegenfurtner, K. R., Fabre-Thorpe, M., and Bulthoff, H. H. (2001). Detection of animals in natural images using far peripheral vision. Eur. J. Neurosci. 14, 869–876.
Ullman, S. (2007). Object recognition and segmentation by a fragment-based hierarchy. Trends Cogn. Sci. (Regul. Ed.) 11, 58–64.
Ullman, S., Vidal-Naquet, M., and Sali, E. (2002). Visual features of intermediate complexity and their use in classification. Nat. Neurosci. 5, 1–6.
VanRullen, R., and Thorpe, S. J. (2001). The time course of visual processing: from early perception to decision-making. J. Cogn. Neurosci. 13, 454–461.
VanRullen, R., and Thorpe, S. J. (2002). Surfing a spike wave down the ventral stream. Vision Res. 42, 2593–2615.
Vo, M. L., and Henderson, J. M. (2010). The time course of initial scene processing for eye movement guidance in natural scene search. J. Vis. 10, 14.11–14.13.
Vogels, R. (1999). Categorization of complex visual images by rhesus monkeys. Part 1: behavioural study. Eur. J. Neurosci. 11, 1223–1238.
Wachsmuth, E., Oram, M. W., and Perrett, D. I. (1994). Recognition of objects and their component parts: responses of single units in the temporal cortex of the macaque. Cereb. Cortex 4, 509–522.
Wichmann, F. A., Sharpe, L. T., and Gegenfurtner, K. R. (2002). The contributions of color to recognition memory for natural scenes. J. Exp. Psychol. Learn. Mem. Cogn. 28, 509–520.
Wilcox, R. R. (2005). Introduction to Robust Estimation and Hypothesis Testing, 2nd Edn. New York: Academic Press.
Keywords: reaction time, rapid categorization, animal, processing dynamics, visual features
Citation: Delorme A, Richard G and Fabre-Thorpe M (2010) Key visual features for rapid categorization of animals in natural scenes. Front. Psychology 1:21. doi: 10.3389/fpsyg.2010.00021
This article was submitted to Frontiers in Perception Science, a specialty of Frontiers in Psychology.
Received: 02 March 2010;
Paper pending published: 10 March 2010;
Accepted: 26 May 2010;
Published online: 23 June 2010
Edited by:
Guillaume A. Rousselet, University of Glasgow, UKReviewed by:
Gyula Kovács, University of Regensburg, Germany; Budapest University of Technology and Economics, HungaryPiers D. L. Howe, Harvard Medical School, USA
Copyright: © 2010 Delorme, Richard and Fabre-Thorpe. This is an open-access article subject to an exclusive license agreement between the authors and the Frontiers Research Foundation, which permits unrestricted use, distribution, and reproduction in any medium, provided the original authors and source are credited.
*Correspondence: Arnaud Delorme, Centre de Recherche Cerveau et Cognition, UMR 5549, Faculté de Médecine de Rangueil, 133 route de Narbonne, 31062 Toulouse Cedex 9, France. e-mail: arnaud.delorme@cerco.ups-tlse.fr