 Raj Kumar1,2
 Vinay Kumar Sharma1
 Sagar Krushnaji Rangari1,2
 Uday Chand Jha3
 Aakash Sahu1Pronob J. Paul2,4Shreshth Gupta1
 Sunil S. Gangurde5Himabindu Kudapa2
 Reyazul Rouf Mir6Pooran M. Gaur2†
 Rajeev K. Varshney7
 Dinakaran Elango8
 Mahendar Thudi1,9*
- 1Department of Agricultural Biotechnology and Molecular Biology, Dr. Rajendra Prasad Central Agricultural University (RPCAU), Pusa, Bihar, India
- 2Research Program-Accelerated Crop Improvement, International Crops Research Institute for the Semi-Arid Tropics (ICRISAT), Patancheru, Telangana, India
- 3Indian Council for Agricultural Research (ICAR)- Indian Institute of Pulses Research (IIPR), Kanpur, Uttar Pradesh, India
- 4Rice Breeding Innovations, International Rice Research Institute (IRRI), South Asia-Hub, Patancheru, Telangana, India
- 5Department of Plant Pathology, University of Georgia, Tifton, GA, United States
- 6Faculty of Agriculture, Sher-e-Kashmir University of Agricultural Sciences and Technology (SKUAST), Sopore, India
- 7Centre for Crop & Food Innovation, WA State Agricultural Biotechnology Centre, Food Futures Institute, Murdoch University, Murdoch, WA, Australia
- 8Department of Agronomy, Iowa State University, Ames, IA, United States
- 9Center for Crop Health, University of Southern Queensland, Toowoomba, QLD, Australia
The rising global temperatures seriously threaten sustainable crop production, particularly the productivity and production of heat-sensitive crops like chickpeas. Multiple QTLs have been identified to enhance the heat stress tolerance in chickpeas, but their successful use in breeding programs remains limited. Towards this direction, we constructed a high-density genetic map spanning 2233.5 cM with 1069 markers. Using 138 QTLs reported earlier, we identified six Meta-QTL regions for heat tolerance whose confidence interval was reduced by 2.7-folds compared to the reported QTLs. Meta-QTLs identified on CaLG01 and CaLG06 harbor QTLs for important traits, including days to 50% flowering, days to maturity, days to flower initiation, days to pod initiation, number of filled pods, visual score, seed yield per plant, biological yield per plant, chlorophyll content, and harvest index. In addition, key genes identified in Meta-QTL regions like Pollen receptor-like kinase 3 (CaPRK3), Flowering-promoting factor 1 (CaFPF1), Flowering Locus C (CaFLC), Heat stress transcription factor A-5 (CaHsfsA5), and Pollen-specific leucine-rich repeat extensins (CaLRXs) play an important role in regulating the flowering time, pollen germination, and growth. The consensus genomic regions, and the key genes reported in this study can be used in genomics-assisted breeding for enhancing heat tolerance and developing heat-resilient chickpea cultivars.
Introduction
Heat stress is becoming a significant obstacle in achieving sustainable agricultural production in the context of global climate change, putting food security at risk. According to predictions of the Inter-governmental Panel on Climate Change (IPCC), the global average temperature rise of 0.2°C per decade may reach up to 1.5°C between 2030 and 2052 (https://www.bbc.com/news/newsbeat-4894757). The cool season legumes like pea (Pisum sativum L.), lentil (Lens culinaris Medik.), faba bean (Vicia faba L.), and chickpea (Cicer arietinum L.) are more affected by the heat stress compared to warm season legumes (Sita et al., 2017). Small holder farmers in the arid and semi-arid regions across the globe cultivate chickpea on the residual soil moisture in over 50 countries (Roorkiwal et al., 2020). According to FAOSTAT (2020), chickpea is the second most important legume crop in the world, after dry beans, with an area under cultivation of 14.5 million hectares and an annual production of 14.7 million tonnes and average seed yield of 1.014 tonnes ha-1. Reproductive stage heat stress adversely affects the production and productivity of chickpea, and average temperatures of 20-28°C are optimal for chickpea production (Devasirvatham et al., 2012). During critical stages of chickpea growth, like flower initiation and pod filling, temperatures over 32°C result in flower drop, pollen sterility, and pod abortion and thus lead to significant yield losses (Kaushal et al., 2013; Gaur et al., 2019; Devi et al., 2022). A brief exposure to chickpea over critical limits especially during the reproductive phase leads to irreversible damage (Kalra et al., 2008; Jha et al., 2021). Furthermore, it has been observed that temperatures ≥35°C under field conditions resulted in yield losses of up to 39% (Devasirvatham et al., 2015). However, the severity of heat stress depends on its intensity, temperature, and the process impacted by the crops.
An in-depth understanding of genetic variability is a pre-requisite for trait improvement. Towards this direction, several efforts were made to understand the genetic variability among the germplasm of chickpea. For instance, a large-scale variation for heat stress tolerance among the chickpea reference set genotypes was reported by Krishnamurthy et al. (2011). Further, in a set of 35 early maturing genotypes assessed for their sensitivity to heat stress, the genotypes ICC 13124, ICC 14284, ICC 14368, and ICC 14653 were reported to be heat stress tolerant and high-yielding (Upadhyaya et al., 2011). Most recently, 39 chickpea genotypes grown in normal-sown and late-sown environments were assessed for their response in relation to influence on seven physiological and four yield and yield-related traits. As a result, it was reported that GNG 1969, GNG 1488, PantG 186, RSG 888, CSJ 315, and GNG 1499 genotypes can be used as donors for enhancing heat tolerance in chickpea cultivars (Devi et al., 2022). Genetic variability was also evaluated among the recombinant inbred line (RIL) populations (Paul et al., 2018a; Kushwah et al., 2021a). A set of 121 genotypes was evaluated at two different locations (India and Ethiopia) and the genetic relationships were assessed at both phenotypic and genotypic levels (Getahun et al., 2021).
Besides assessment of the genetic variability in respect of tolerance to heat stress, some efforts were also made to identify the genomic regions responsible for heat tolerance. QTLs for number of filled pods, total number of seeds per plot, grain yield per plot and % pod setting were reported using RIL population developed from ICC 4567 (heat sensitive) × ICC 15614 (heat tolerant) (Paul et al., 2018b). Using SSR markers, QTLs for primary branch number and chlorophyll content were reported in F2 population derived from DCP 92-3 × ICCV 92944 (Jha et al., 2019). Additionally, Kushwah et al. (2021b) reported QTLs for heat tolerance using an inter-specific RIL population derived from the cross GPF 2 (heat tolerant) × ILWC 292 (heat sensitive). The related traits associated with QTLs are days to germination, days to flower initiation, days to 50% flowering, days to 100% flowering, plant height, grain yield, and membrane permeability index. Nevertheless, major QTLs for heat tolerance related traits were also reported using RIL population derived from DCP 92-3 (heat sensitive) and ICCV 92944 (heat tolerant). In addition, to QTLs, markers associated with the trait were also reported (Thudi et al., 2014; Varshney et al., 2019). However, only a few QTLs have been validated for their utilization in marker-assisted selection (MAS).
The Meta-QTL approach plays a pivotal role in precisely identifying stable QTLs across multiple studies for highlighting the consistency of location and effect for different QTLs of the same trait. The Meta-QTL analysis approach developed by Goffinet and Gerber (2000) can assist in narrowing down QTL regions with the of stringent selection of precise QTL (Soriano et al., 2021). Ultimately, it determines the “actual” number of QTLs affecting a trait and estimate their “actual” positions in the genome. Meta-QTL analysis has been applied to many cereals (maize, Kaur et al., 2021; rice, Sandhu et al., 2021; wheat, Ma et al., 2022) and legumes (pea, Klein et al., 2020; common bean, Arriagada et al., 2023), but not used for heat tolerance related traits in chickpea till now. In this study, we reported the identification of consensus genomic regions and associated key genes deploying Meta-QTL analyses. Consequently, the identified Meta-QTLs and associated key genes can be used for developing heat stress tolerant chickpea varieties.
Materials and methods
Compilation of reported QTLs for heat tolerance
All the QTLs associated with heat stress tolerance related traits were retrieved from four independent studies reported between 2018 to 2021. The reported QTLs were associated with 28 different heat stress tolerance related traits. The QTLs were re-grouped into four major trait categories (i) morphological (primary branches number, PB; plant height, PH), (ii) phenological (days to flower initiation, DFI; days to maturity, DM; days to 50% flowering, DFF; days to 100% flowering, DHF; and pollen viability, PV) (iii) Physiological (days to germination, DG; chlorophyll content, CHL; nitrogen balance index, NBI; cell membrane stability, CMS; normalized difference vegetation index, NDVI; membrane permeability index, MPI and relative leaf water content, RLWC) and (iv) yield and yield related traits (days to pod initiation, DPI; days to pod formation, DPF; number of filled pods, FPod; 100 seed weight, 100SW; seed yield per plant, SYPP; biological yield per plant, BYPP; harvest index, HI; pod setting percentage, % Podset; total number of seeds per plot, TS; grain yield, GY; visual score, VS; number of pods per plant, NPP; biomass, BIO and yield, YLD). Among 138 reported QTLs, 59 major (PVE ≥ 10%) and 79 minor QTLs (PVE < 10%) were categorized. We compiled the information on (i) population type and size of the mapping population (ii) QTL ID with closely linked flanking markers (iii) LOD score (iv) phenotypic variation explained (PVE) or R2 value (v) position of the peak and associated confidence interval (CI). The missing CI values were calculated by using two different equations proposed by Darvasi and Soller (1997) for different mapping populations. The formula used for F2 and BC population is CI = 530/N × R2 but for RILs CI = 163/N × R2, wherein N denotes size of mapping population and R2 denotes PVE for each QTL; the numerical value 530 and 163 are the population-specific constants obtained from different simulation. If the peak position was missing in any case, the mean of two flanking markers position was considered as the QTL peak.
Construction of consensus map
Consensus map was constructed by using four genetic maps from different studies to represent all markers associated with QTLs in a single map with the help of R package based LPMerge algorithm (Endelman and Plomion, 2014). LP merge in R constructs consensus maps using the root mean square error (RMSE) value, which is based on the linear programming method. In order to determine the optimal consensus map, the model with the least map size and least RMSE value was chosen and accepted as a final map for performing Meta-QTL analysis. Ultimately, the dense consensus map was constructed based on F2 and RIL populations using 1771 markers.
QTL projection
The QTLs explaining at least 10% of phenotypic variation for the target trait were projected on the consensus map using BioMercator Version 4.2.3 (Arcade et al., 2004), and associated information for each QTL such as confidence interval (95%), peak position, LOD score and PVE (Sosnowski et al., 2012). In order to project QTLs, only the QTLs having the same flanking markers in the consensus map were used (Soriano et al., 2021).
Meta-QTL analysis
As a result of the projection, Meta-QTL analyses were performed on QTL cluster for each chromosome individually using the two-step algorithm proposed by Veyrieras et al. (2007) in BioMercator Version 4.2.3 (Arcade et al., 2004). In the first step, the best Meta-QTL model was selected out of many models available in the software by using selection criteria as Akaike information criterion (AIC), AIC corrected (AICc), AIC model 3 (AIC3), Bayesian information criterion (BIC), and Average weight of evidence (AWE). In order to select a Meta-QTL model, at least three models must achieve the lowest values of the selection criteria. In the second step, meta-QTLs were generated using best Meta-QTL model, which ensures that the number is generally less than the number of projected QTLs. While performing QTL meta-analysis, it is necessary to have independent QTLs for the same trait from different mapping populations, different locations, and different environmental conditions (Goffinet and Gerber, 2000).
Detecting candidate genes underlying the Meta-QTL region
In order to retrieve the candidate genes in Meta-QTL regions, the physical position of flanking markers was used as an input using the https://cegresources.icrisat.org database with the help of chickpea assembly (Varshney et al., 2013). The function associated with each gene was determined as per Thudi et al. (2021).
Results and discussion
Heat stress is one of the major constraints among abiotic stresses in chickpea. During the flowering stage, elevated temperatures (> 35°C) hamper pollen germination on the stigma and tube growth inside style, preventing it from reaching up to female gametes, and thus it leads to flower drop, pod abortion or abnormal pod setting (Devasirvatham et al., 2012; Devasirvatham et al., 2015; Devasirvatham and Tan, 2018). Efforts were made to identify the heat tolerant germplasm as well as map the genomic regions using both linkage mapping (Paul et al., 2018b; Jha et al., 2019 and Jha et al., 2021; Kushwah et al., 2021b) and linkage disequilibrium mapping (Thudi et al., 2014; Varshney et al., 2019). Nevertheless, the genomic regions reported in different studies were large for use in genomics-assisted breeding programs. To reduce the genomic intervals and identify the consensus genomics regions for heat tolerance, we have used Meta-QTL analysis approach in this study.
QTLs identified for heat stress tolerance
In case of chickpea, to date, a total of four independent studies reported QTLs for heat tolerance related traits. Among these studies, two studies used SNPs based on genotyping by sequencing approach, one study used SNP based on double digest restriction-site associated DNA sequencing approach while the other study used SSR markers. Among three RIL populations, two were intra-specific (ICC 4567 × ICC 15614, DCP 92-3 × ICCV 92944) and another one was inter-specific (GPF 2 × ILWC 292). Using advanced generations of DCP 92-3 × ICCV 92944, QTLs were mapped at F2 and F7 stages by Jha and colleagues in 2019 and 2021 respectively. The size of the mapping populations ranged from 184 to 292 lines (Table 1). In total, 138 QTLs were reported earlier for 28 different traits. Further, among 138 QTLs reported earlier, 59 and 79 were major (≥10% phenotypic variation explained, PVE) and minor QTLs (<10% PVE), respectively. The confidence intervals of these QTLs ranged from 2 - 44.29 cM with an average of 9.2 cM (Supplementary Table 1).
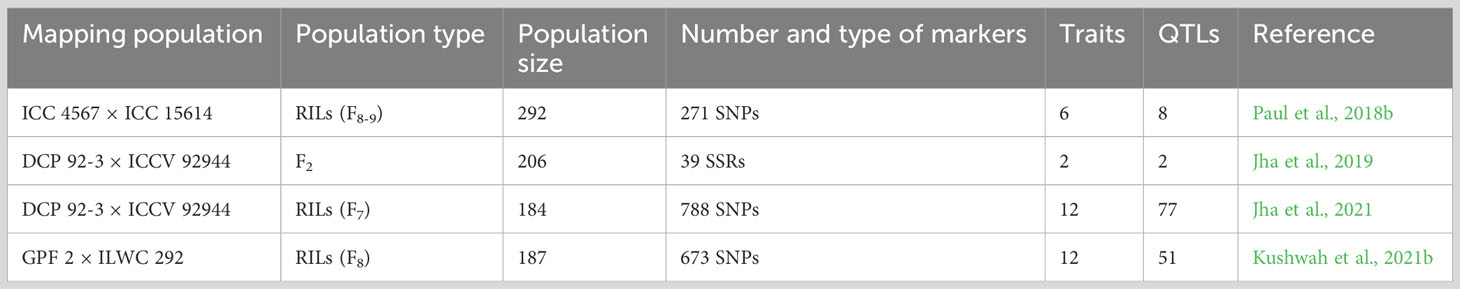
Table 1 Summary of QTLs for heat tolerance related traits reported between 2018-21.
QTLs on the consensus map
For projection of all QTLs, a dense consensus map comprising of 1069 markers spanning a total genetic distance of 2233.5 cM was constructed. Nevertheless, individual genetic maps reported 39 (Jha et al., 2019) to 788 markers (Jha et al., 2021). The length of each linkage group varied between 68.1- 497.7 cM, with an average distance of 279.19 cM (Supplementary Table 2). Compared to Kushwah et al. (2021a; 2021b) genetic map (4569.09 cM), a reduction of 2.04 folds genetic distance was observed in the consensus map developed in the present study. Drastic reduction in the genetic distance of consensus map indicated the robustness of consensus map for identification of more precise Meta-QTLs. The number of markers per linkage group ranged from 68 (on CaLG08) to 253 (on CaLG06). The densest map was observed for the linkage group CaLG08 with a marker density of 0.9 marker/cM. Amongst 138 QTLs, 65.21% (90) QTLs could be projected on consensus genetic map we developed. This could be due to lack of common markers for mapping all the QTLs.
Meta-QTLs identified
Of 90 QTLs projected onto the consensus map, 22 were grouped into six Meta-QTL regions, comprising QTLs from at least two different studies (Table 2; Figure 1). The remaining 68 QTLs were either singletons or had a very high confidence interval, and for different traits of same study which could not be considered as Meta-QTL by the Meta-QTL clustering algorithm. The six Meta-QTLs were founded, and distributed on four linkage groups of chickpea (CaLG01, CaLG03, CaLG06, and CaLG07; Figure 2). A maximum of two (on CaLG01 and CaLG06) and a minimum of one (on CaLG03 and CaLG07) Meta-QTLs were identified on linkage groups. The number of QTLs in each Meta-QTL varied from two to six (Table 2). Interestingly, Meta-QTL4 contained six QTLs clustered for four different traits (FPOD, VS, SYPP and BYPP). Similarly, Meta-QTL5 contained five QTLs clustered for three different traits (CHL, BYPP and HI). The average number of QTLs in each Meta-QTL regions was 3.66 QTLs per Meta-QTL. The confidence interval at 95% of each Meta-QTL ranged from 2.97 cM for Meta-QTL4 on CaLG06 to 6.23 cM for Meta-QTL3 on CaLG03. The average confidence interval for the Meta-QTL was 4.49 cM. The Meta-QTLs identified from the QTL clusters were found to have significantly low confidence interval compared to the original projected QTLs. A graphical representation of CI of Meta-QTL and original QTL on each of the chickpea chromosome has been presented in Figure 2. The average CI fold reduction of Meta-QTL compared to original QTLs was computed to be 2.7 folds. These results signify that the Meta-QTLs identified in the present study are highly stable and have reduced confidence interval; thereby enhancing the detection of candidate genes and providing high mapping resolution.
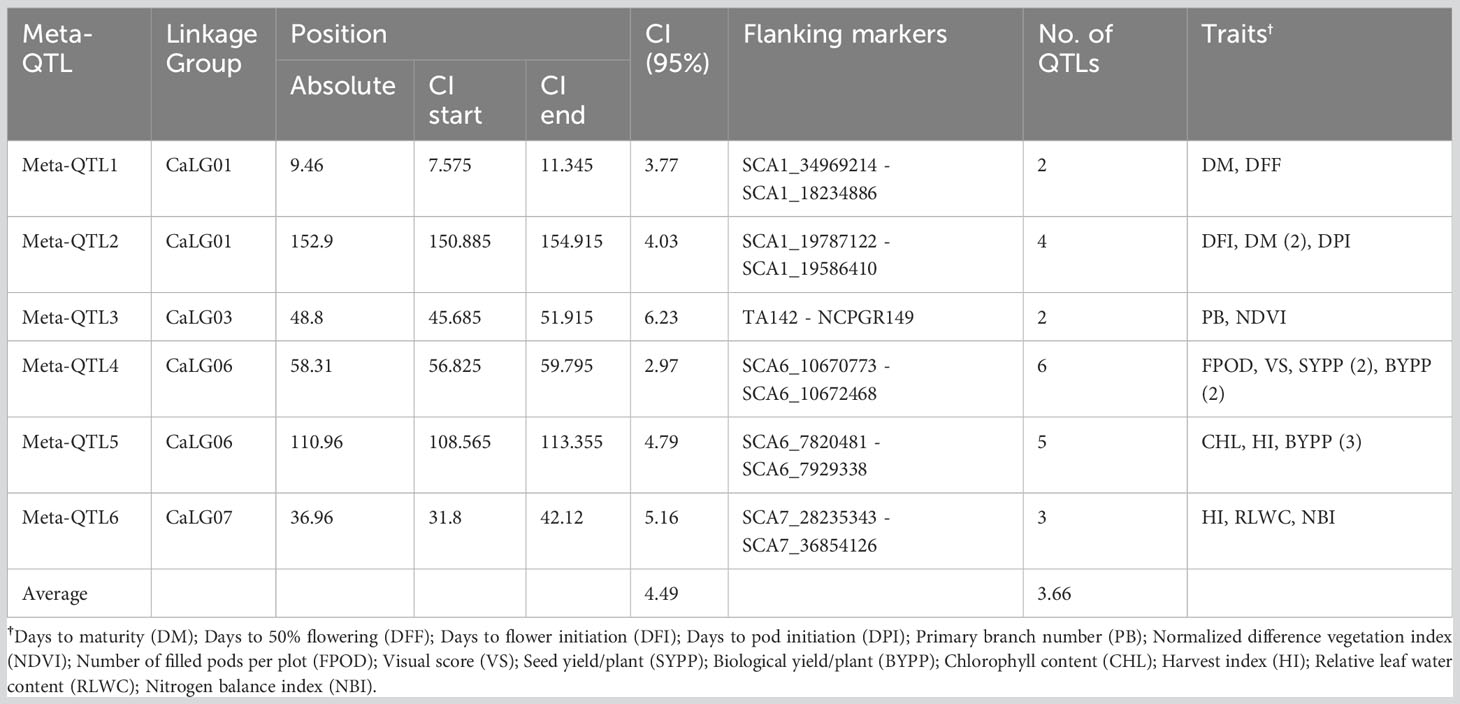
Table 2 Details of Meta-QTLs identified for heat tolerance related traits in chickpea.
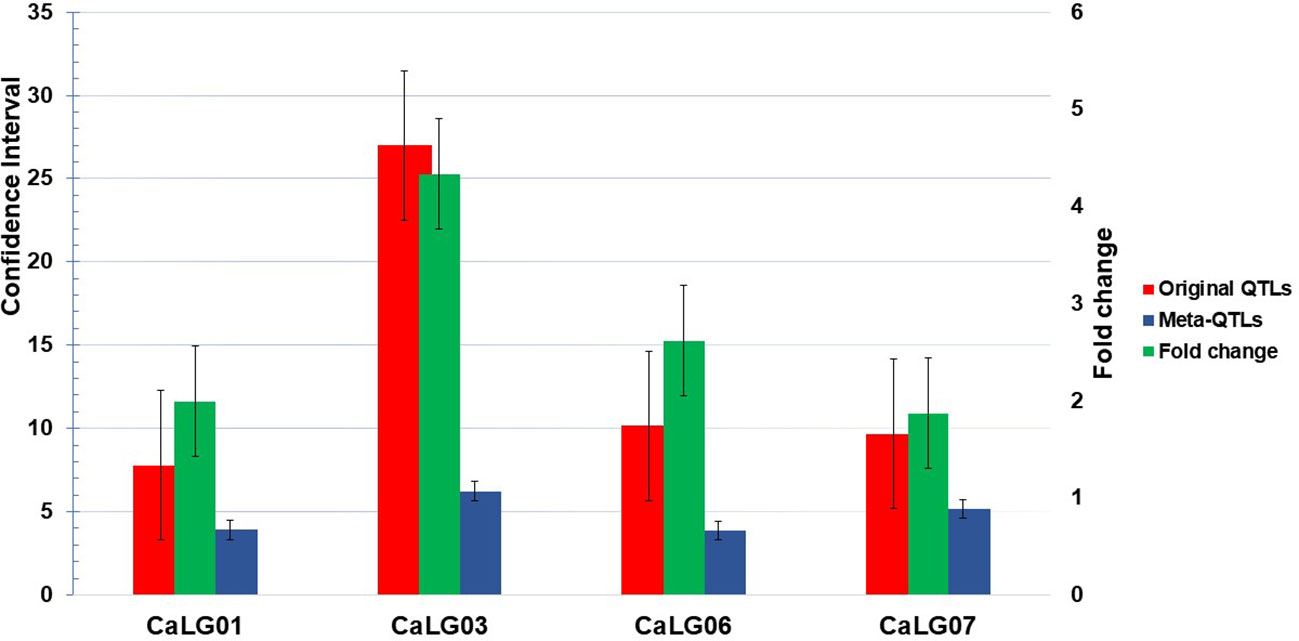
Figure 1 Comparison of confidence interval (CI) between original QTL and Meta-QTL; CaLG03 shown maximum reduction in CI (four times against original QTL) but CaLG07 shown minimum reduction in CI.
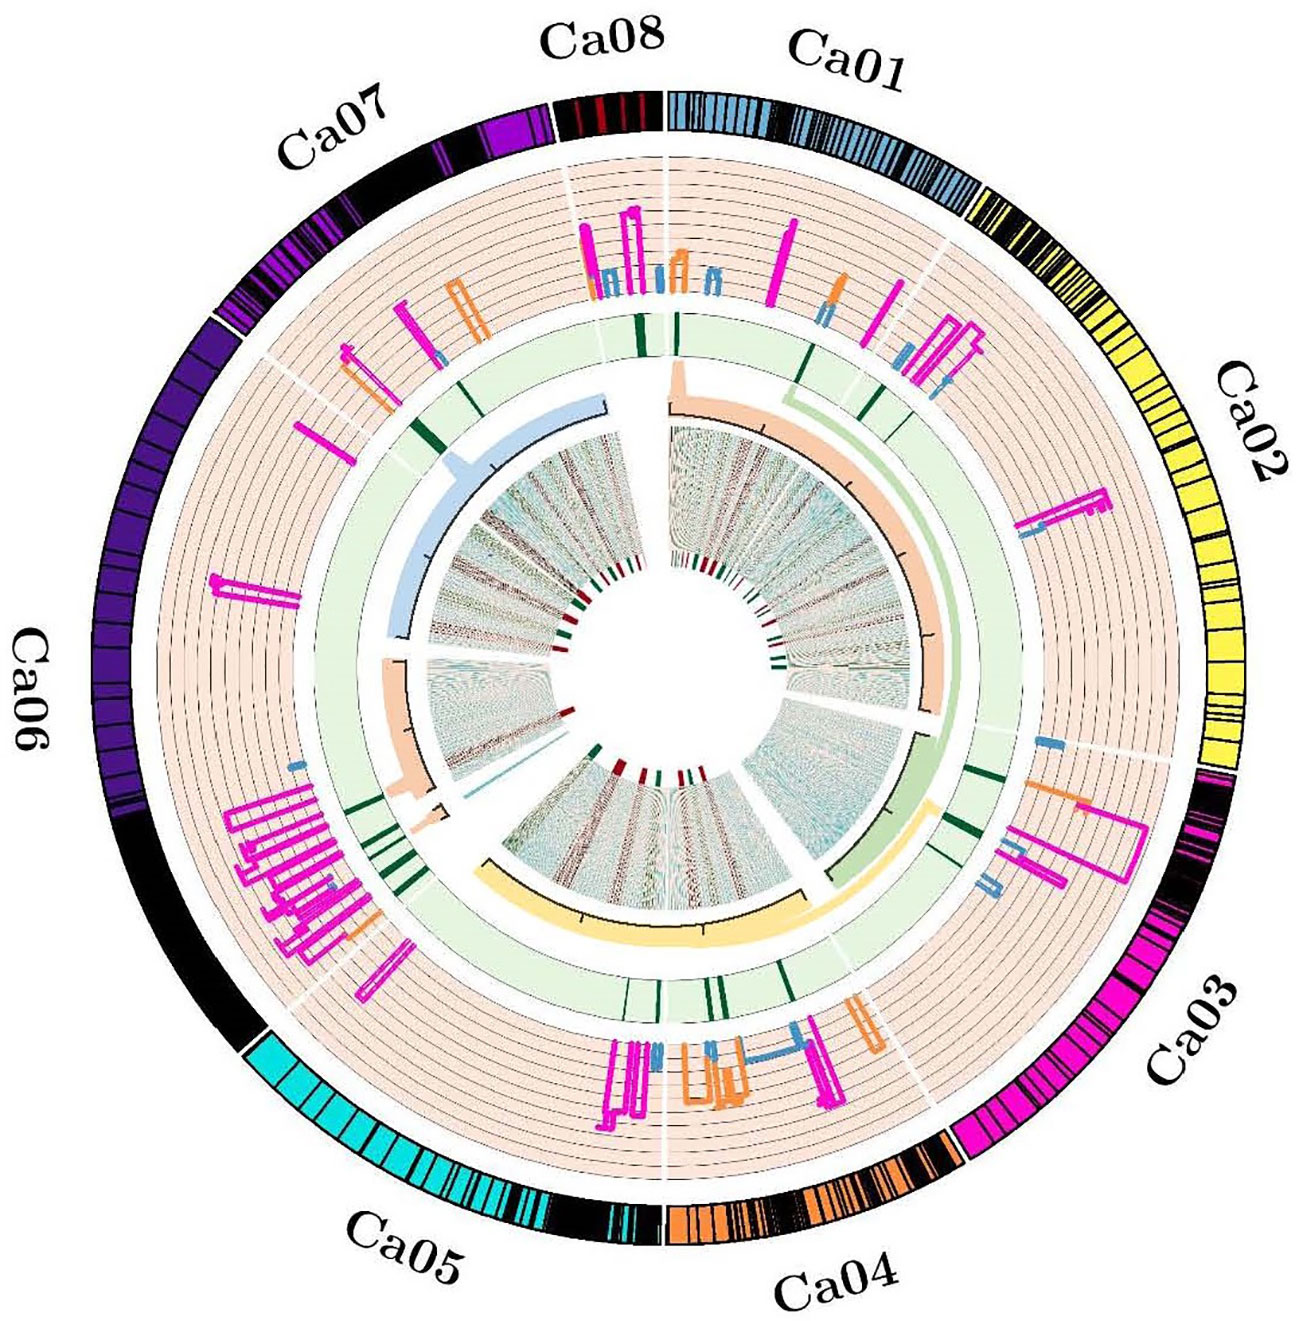
Figure 2 Circos indicating the projected QTLs, Meta-QTLs and genes. From outside to inside, Track 1 representing ideogram of linkage groups and black bands are showing marker density; Track 2 representing the histogram of projected QTLs and width of histogram is showing the confidence interval; Track 3 representing heatmap of identified Meta-QTLs and width of heatmap is indicating the reduction in confidence interval of Meta-QTLs; Track 4 representing magnified view of accepted Meta-QTL regions into the redundant physical interval; Track 5 representing the density map of identified candidate genes.
Key genes in Meta-QTL regions
We identified a total of 1346 genes among 6 Meta-QTL regions (Supplementary Table 3). On annotation, 55 genes belonged to a wide range of gene-families that are directly or indirectly related to abiotic stress tolerance especially heat tolerance (Table 3) and 1291 genes were either putative or uncharacterized. Among 6 Meta-QTL regions, the Meta-QTL6 on CaLG07 harbored maximum number of genes (24 genes) with known functions followed by Meta-QTL1 on CaLG01 (23 genes), Meta-QTL3 on CaLG03 (7 genes) and Meta-QTL4 on CaLG06 harbored single gene with known function (Table 3). A total of 11, six, four and one genes were found to code for ethylene responsive transcription factor, leucine rich repeat extension like protein, DnaJ heat shock protein and pollen receptor kinase respectively. Alternatively, some genes encoding proteins like peroxidase and superoxidase dismutase have a role in defying oxidative stress and recovering plants from heat stress damage (Table 3).
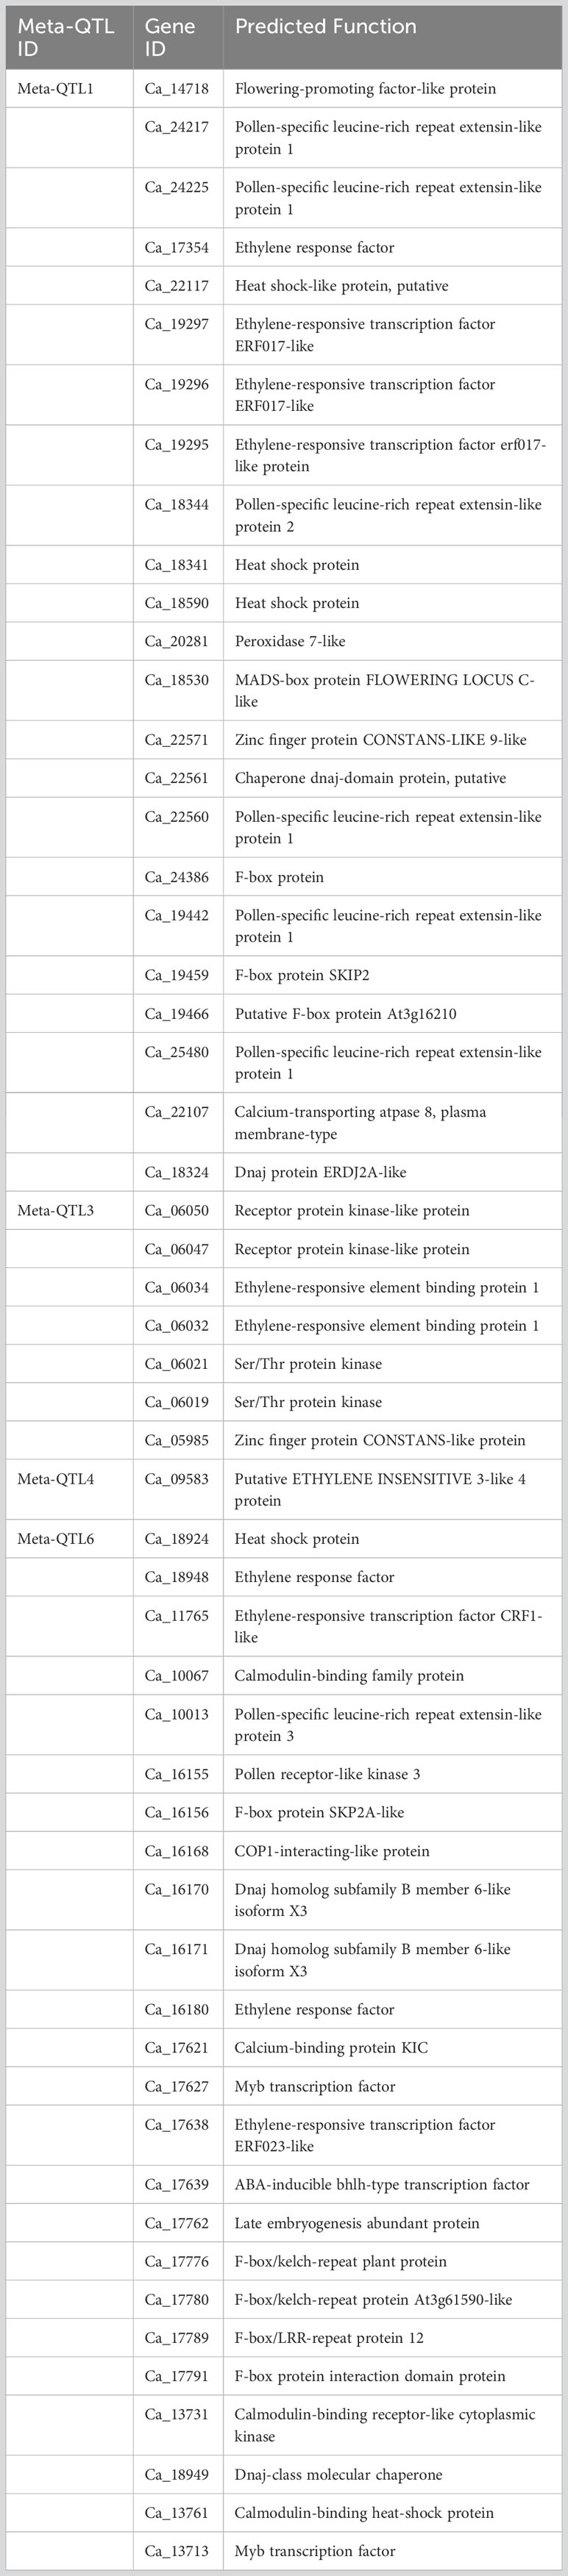
Table 3 Summary of key genes underlying in Meta-QTLs regions with known functions.
In chickpea, completion of the process of pollen germination and growth of the pollen tube is essential for successful fertilization. In Meta-QTL1, five genes namely Ca_24217, Ca_24225, Ca_22560, Ca_19442, and Ca_25480 encode for pollen-specific leucine-rich repeat extensin-like protein 1 and the gene Ca_18344 codes for pollen-specific leucine-rich repeat extensin-like protein 2. While in case of Meta-QTL6 the gene Ca_10013 codes for pollen-specific leucine-rich repeat extensin-like protein 3. Pollen-specific leucine-rich repeat extensin (LRXs), harbor a leucine-rich repeat domain and an extensin domain, are essential for pollen germination and growth in Arabidopsis (Wang et al., 2018). In addition, like the LePRK2 gene in tomato (Solanum lycopersicum), we identified a gene (Ca_16155; referred as CaPRK2; Ca stands for Cicer arietinum) that encodes pollen receptor kinase, which has been implicated in signaling during pollen germination and tube growth as well as in mediating pollen (tube)-pistil communication. In case of tomato, it was demonstrated that LePRK2 positively regulates pollen germination and tube growth (Zhang et al., 2008).
We also identified important genes like Flowering-promoting factor 1-like protein 1 (Ca_14718; referred as CaFPF1) and MADS-box protein FLOWERING LOCUS C (Ca_18530; referred as CaFLC) in Meta-QTL1 genomic region. In addition, we identified a gene Ca_14718 that encodes FPF1 (Flowering-promoting factor 1) reported to be involved in the genetic control of flowering time in plants. For instance, in case of rice, it was demonstrated that the OsFPFL4 gene was involved in modulating the root and flower development by affecting auxin and ROS homeostasis (Guo et al., 2020). However, MADS-box transcription factors (TFs), FLOWERING LOCUS C (FLC) along with SHORT VEGETATIVE PHASE (SVP) have been reported to form a complex to repress the expression of genes that initiate flowering in Arabidopsis (Mateos et al., 2015). This indicates that the Meta-QTL1 harbor genes that control both flower initiation as well as repression of the flowering. In general, the genotypes with early flowering feature record higher yield by escaping the reproductive stage heat stress as well as end season drought (Manchikatla et al., 2021). In Meta-QTL1 and 6, we identified genes (Ca_18341, Ca_18590 and Ca_18924), that code for heat shock proteins or heat stress transcription factor A-5 referred as CaHsfsA5. Among 20 heat stress transcription factors (Hsfs), Hsfs A4 and A5 form a group with distinguished gene activity as A4 Hsfs are potent activators of heat stress gene expression, whereas A5 Hsfs act as specific repressor of HsfA4 activity (Baniwal et al., 2007). Another gene, referred as CaERN3 that encodes ethylene-responsive transcription factor ERN3 was reported to repress the ERN1/ERN2-dependent transcription activation in legumes. This Meta-QTL region habors QTLs for NBI and CHL. Reduction of nitrogen balance index and chlorophyll content is the common phenomenon in plants and it was reported in maize during post flowering heat stress (Bheemanahalli et al., 2022).
Conclusions
Meta-QTL analysis for the traits related to heat stress tolerance is an effective approach of unravelling the concise and precise QTLs from many QTLs reported earlier. In the present study, the CI of the identified Meta-QTLs is reduced by 2.7 folds against the original QTL CI. In addition, key genes like Pollen receptor-like kinase 3 (CaPRK3), Flowering-promoting factor 1 (CaFPF1), FLOWERING LOCUS C (CaFLC), Heat stress transcription factor A-5 (CaHsfsA5), and Pollen-specific leucine-rich repeat extensin (LRXs), identified in the Meta-QTL regions are known to play key role in regulating the flowering, pollen germination and growth etc, which can be further explored in detail. Large-scale germplasm sequence information (Thudi et al., 2016a; Thudi et al., 2016b; Varshney et al., 2019; Varshney et al., 2021; Thudi et al., 2023) and phenotypic data in public domain can be used for haplo-pheno analysis and identify superior haplotypes for use in heat tolerance breeding. The Meta-QTLs with reduced confidence interval as well as key genes reported in the study can be used in chickpea breeding programs for developing heat resilient chickpea varieties.
Data availability statement
The original contributions presented in the study are included in the article/Supplementary Material. Further inquiries can be directed to the corresponding authors.
Author contributions
RK: Data curation, Methodology, Writing – original draft. VKS: Resources, Writing – review & editing. SKR: Formal Analysis, Methodology, Writing – review & editing. UCJ: Resources, Writing – review & editing. AS: Formal Analysis, Writing – review & editing. PJP: Resources, Writing – review & editing. SG: Formal Analysis, Methodology, Writing – review & editing. SSG: Resources, Writing – review & editing. HK: Resources, Writing – review & editing. RRM: Resources, Writing – review & editing. PMG: Resources, Writing – review & editing. RKV: Resources, Writing – review & editing. DE: Writing – review & editing. MT: Conceptualization, Supervision, Writing – review & editing.
Funding
The author(s) declare that no financial support was received for the research, authorship, and/or publication of this article.
Acknowledgments
RK acknowledges the Department of Biotechnology and RPCAU, Pusa for the DBT-JRF and university fellowship to his Ph.D.
Conflict of interest
The authors declare that the research was conducted in the absence of any commercial or financial relationships that could be construed as a potential conflict of interest.
The reviewer RS declared a shared affiliation with the authors PG, HK to the handling editor at the time of review.
The author(s) declared that they were an editorial board member of Frontiers, at the time of submission. This had no impact on the peer review process and the final decision.
Publisher’s note
All claims expressed in this article are solely those of the authors and do not necessarily represent those of their affiliated organizations, or those of the publisher, the editors and the reviewers. Any product that may be evaluated in this article, or claim that may be made by its manufacturer, is not guaranteed or endorsed by the publisher.
Supplementary material
The Supplementary Material for this article can be found online at: https://www.frontiersin.org/articles/10.3389/fpls.2023.1274759/full#supplementary-material
Supplementary Table 2 | Marker order and their position on the consensus genetic map developed using four genetic mapping studies.
References
Arcade, A., Labourdette, A., Falque, M., Mangin, B., Chardon, F., Charcosset, A., et al. (2004). BioMercator: Integrating genetic maps and QTL towards discovery of candidate genes. Bioinform 20, 14. doi: 10.1093/bioinformatics/bth230
Arriagada, O., Arévalo, B., Cabeza, R. A., Carrasco, B., Schwember, A. R. (2023). Meta-QTL analysis for yield components in common bean (Phaseolus vulgaris L.). Plants 12, 1. doi: 10.3390/plants.2023.12010117
Baniwal, S., Chan, K. Y., Scharf, K. D., Nover, L. (2007). Role of heat stress transcription factor HsfA5 as specific repressor of HsfA4. J. Biol. Chem. 282, 6. doi: 10.1074/jbc.M609545200
Bheemanahalli, R., Vennam, R. R., Ramamoorthy, P., Reddy, K. R. (2022). Effects of post-flowering heat and drought stresses on physiology, yield, and quality in maize (Zea mays L.). Plant Stress. 6, 100106. doi: 10.1016/j.stress.2022.100106
Darvasi, A., Soller, M. (1997). A simple method to calculate resolving power and confidence interval of QTL map location. Behav. Genet. 27, 10. doi: 10.1023/A:1025685324830
Devasirvatham, V., Gaur, P. M., Mallikarjuna, N., Tokachichu, R. N., Trethowan, R. M., Tan, D. K. Y. (2012). Effect of high temperature on the reproductive development of chickpea genotypes under controlled environments. Funct. Plant Biol. 39, 12. doi: 10.1071/FP12033
Devasirvatham, V., Gaur, P. M., Raju, T. N., Trethowan, R. M., Tan, D. K. Y. (2015). Field response of chickpea (Cicer arietinum L.) to high temperature. Field Crops Res. 172, 10. doi: 10.1016/j.fcr.2014.11.017
Devasirvatham, V., Tan, D. K. Y. (2018). Impact of high temperature and drought stresses on chickpea production. Agronomy 8, 8. doi: 10.3390/agronomy8080145
Devi, P., Jha, U. C., Prakash, V., Kumar, S., Parida, S. K., Paul, P. J., et al. (2022). Response of physiological, reproductive function and yield traits in cultivated chickpea (Cicer arietinum L.) under heat stress. Front. Plant Sci. 13. doi: 10.3389/fpls.2022.880519
Endelman, J. B., Plomion, C. (2014). LPmerge: An R package for merging genetic maps by linear programming. Bioinform 30, 11. doi: 10.1093/bioinformatics/btu091
FAOSTAT (2020) Food and Agriculture Organization of the United Nations (FAO) statistical databases. www.fao.org.
Gaur, P. M., Samineni, S., Thudi, M., Tripathi, S., Sajja, S. B., Jayalakshmi, V., et al. (2019). Integrated breeding approaches for improving drought and heat adaptation in chickpea (Cicer arietinum L.). Plant Breed. 138, 4. doi: 10.1111/pbr.12641
Getahun, T., Negash, K., Chang, P. L., Wettberg, E., Carrasquilla-Garcia, N., Gaur, P. M., et al. (2021). Screening of heat-tolerant Ethiopian chickpea accessions: assessment of phenological and agro-morphological traits and genomic relationships. Agrosyst. Geosci. Environ. 4, 3. doi: 10.1002/agg2.20211
Goffinet, B., Gerber, S. (2000). Quantitative trait loci: a meta-analysis. Genetics 155, 1. doi: 10.1093/genetics/155.1.463
Guo, Y., Wu, Q., Xie, Z., Yu, B., Zeng, R., Min, Q., et al. (2020). OsFPFL4 is involved in the root and flower development by affecting auxin levels and ROS accumulation in rice (Oryza sativa). Rice 13, 1. doi: 10.1186/s12284-019-0364-0
Jha, U. C., Kole, P. C., Singh, N. P. (2019). QTL mapping for heat stress tolerance in chickpea (Cicer arietinum L.). Legume. Res. 44, 10. doi: 10.18805/LR-4121
Jha, U. C., Nayyar, H., Palakurthi, R., Jha, R., Valluri, V., Bajaj, P., et al. (2021). Major QTLs and potential candidate genes for heat stress tolerance identified in chickpea (Cicer arietinum L.). Front. Plant Sci. 12. doi: 10.3389/fpls.2021.655103
Kalra, N., Chakraborty, D., Sharma, A., Rai, H. K., Jolly, M., Chander, S., et al. (2008). Effect of temperature on yield of some winter crops in northwest India. Curr. Sci. 94, 82–88.
Kaur, S., Rakshit, S., Choudhary, M., Das, A. K., Kumar, R. R. (2021). Meta analysis of QTLs associated with popping traits in maize (Zea mays L.). PloS One 16, 8. doi: 10.1371/journal.pone.0256389
Kaushal, N., Awasthi, R., Gupta, K., Gaur, P., Siddique, K. H. M., Nayyar, H. (2013). Heat-stress-induced reproductive failures in chickpea (Cicer arietinum L.) are associated with impaired sucrose metabolism in leaves and anthers. Funct. Plant Biol. 40, 12. doi: 10.1071/FP13082
Klein, A., Houtin, H., Rond-Coissieux, C., Naudet-Huart, M., Touratier, M., Marget, P., et al. (2020). Meta-analysis of QTL reveals the genetic control of yield-related traits and seed protein content in pea. Sci. Rep. 10, 1. doi: 10.1038/s41598-020-72548-9
Krishnamurthy, L., Gaur, P. M., Basu, P. S., Chaturvedi, S. K., Tripathi, S., Vadez, V., et al. (2011). Large genetic variation for heat tolerance in the reference collection of chickpea (Cicer arietinum L.) germplasm. Plant Genet. Resour. 9, 1. doi: 10.1017/S1479262110000407
Kushwah, A., Bhatia, D., Singh, G., Singh, I., Bindra, S., Vij, S., et al. (2021a). Phenotypic evaluation of genetic variability and selection of yield contributing traits in chickpea recombinant inbred line population under high temperature stress. Physiol. Mol. Biol. Plants 27, 4. doi: 10.1007/s12298-021-00977-5
Kushwah, A., Bhatia, D., Singh, I., Thudi, M., Singh, G., Bindra, S., et al. (2021b). Identification of stable heat tolerance QTLs using inter-specific recombinant inbred line population derived from GPF 2 and ILWC 292. PloS One 16, 8. doi: 10.1371/journal.pone.0254957
Ma, J., Liu, Y., Zhang, P., Chen, T., Tian, T., Wang, P., et al. (2022). Identification of quantitative trait loci (QTL) and Meta-QTL analysis for kernel size related traits in wheat (Triticum aestivum L). BMC Plant Biol. 22, 1. doi: 10.1186/s12870-022-03989-9
Manchikatla, P., Kalavikatte, D., Mallikarjuna, B. P., Palakurthi, R., Khan, A. W., Jha, U. C., et al. (2021). MutMap approach enables rapid identification of candidate genes and development of markers associated with early flowering and enhanced seed size in chickpea (Cicer arietinum L.). Front. Plant Sci. 12. doi: 10.3389/fpls.2021.688694
Mateos, J. L., Madrigal, P., Tsuda, K. (2015). Combinatorial activities of short vegetative phase and flowering locus c define distinct modes of flowering regulation in Arabidopsis. Genome Biol. 16, 1. doi: 10.1186/s13059-015-0597-1
Paul, P. J., Samineni, S., Sajja, S. B. (2018a). Capturing genetic variability and selection of traits for heat tolerance in a chickpea recombinant inbred line (RIL) population under field conditions. Euphytica 27, 2. doi: 10.1007/s10681-018-2112-8
Paul, P. J., Samineni, S., Thudi, M., Sajja, S. B., Rathore, A., Das, R. R., et al. (2018b). Molecular mapping of QTLs for heat tolerance in chickpea. Int. J. Mol. Sci. 19, 8. doi: 10.3390/ijms19082166
Roorkiwal, M., Bharadwaj, C., Barmukh, R., Dixit, G. P., Thudi, M., Gaur, P. M., et al. (2020). Integrating genomics for chickpea improvement: achievements and opportunities. Theor. Appl. Genet. 133, 5. doi: 10.1007/s00122-020-03584-2
Sandhu, N., Pruthi, G., Prakash, Raigar, O., Singh, M. P., Phagna, K., et al. (2021). Meta-QTL analysis in rice and cross-genome talk of the genomic regions controlling nitrogen use efficiency in cereal crops revealing phylogenetic relationship. Front. Genet. 12. doi: 10.3389/fgene.2021.807210
Sita, K., Sehgal, A., HanumanthaRao, B., Nair, R. M., Prasad, P. V., Kumar, S., et al. (2017). Food legumes and rising temperatures: effects, adaptive functional mechanisms specific to reproductive growth stage and strategies to improve heat tolerance. Front. Plant Sci. 8. doi: 10.3389/fpls.2017.01658
Soriano, J. M., Colasuonno, P., Marcotuli, I., Gadaleta, A. (2021). Meta-QTL analysis and identification of candidate genes for quality, abiotic and biotic stress in durum wheat. Sci. Rep. 11, 1. doi: 10.1038/s41598-021-91446-2
Sosnowski, O., Charcosset, A., Joets, J. (2012). BioMercator V3: An upgrade of genetic map compilation and quantitative trait loci meta-analysis algorithms. Bioinform 28, 15. doi: 10.1093/bioinformatics/bts313
Thudi, M., Chen, Y., Pang, J., Kalavikatte, D., Bajaj, P., Roorkiwal, M., et al. (2021). Novel genes and genetic loci associated with root morphological traits, phosphorus-acquisition efficiency and phosphorus-use efficiency in chickpea. Front. Plant Sci. 12. doi: 10.3389/fpls.2021.636973
Thudi, M., Chitikineni, A., Liu, X., He, W., Roorkiwal, M., Yang, W., et al. (2016a). Recent breeding programs enhanced genetic diversity in both desi and kabuli varieties of chickpea (Cicer arietinum L.). Sci. Rep. 16, 1. doi: 10.1038/srep38636
Thudi, M., Khan, A. W., Kumar, V., Gaur, P. M., Katta, A. V. S. K., Garg, V., et al. (2016b). Whole genome re-sequencing reveals genome wide variations among parental lines of mapping populations in chickpea (Cicer arietinum). BMC Plant Biol. 16 (Suppl1), 10. doi: 10.1186/s12870-015-0690-3
Thudi, M., Samineni, S., Li, W., Boer, M. P., Roorkiwal, M., Yang, Z., et al. (2023). Whole genome resequencing and phenotyping of MAGIC population for high resolution mapping of drought tolerance in chickpea. Plant Genome 30, e20333. doi: 10.1002/tpg2.20333
Thudi, M., Upadhyaya, H. D., Rathore, A., Gaur, P. M., Krishnamurthy, L., Roorkiwal, M. (2014). Genetic dissection of drought and heat tolerance in chickpea through genome-wide and candidate gene-based association mapping approaches. PloS One 9, 5. doi: 10.1371/journal.pone.0096758
Upadhyaya, H. D., Dronavalli, N., Gowda, C. L. L., Singh, S. (2011). Identification and evaluation of chickpea germplasm for tolerance to heat stress. Crop Sci. 51, 5. doi: 10.2135/cropsci2011.01.0018
Varshney, R. K., Roorkiwal, M., Sun, S., Bajaj, P., Chitikineni, A., Thudi, M., et al. (2021). A chickpea genetic variation map based on the sequencing of 3,366 genomes. Nature 599, 622–627. doi: 10.1038/s41586-021-04066-1
Varshney, R. K., Song, C., Saxena, R. K., Azam, S., Yu, S., Sharpe, A. G., et al. (2013). Draft genome sequence of chickpea (Cicer arietinum) provides a resource for trait improvement. Nat. Biotechnol. 31, 3. doi: 10.1038/nbt.2491
Varshney, R. K., Thudi, M., Roorkiwal, M., He, W., Upadhyaya, H. D., Yang, W., et al. (2019). Resequencing of 429 chickpea accessions from 45 countries provides insights into genome diversity, domestication and agronomic traits. Nat. Genet. 51, 5. doi: 10.1038/ng41588-019-0401-3
Veyrieras, J. B., Gofnet, B., Charcosset, A. (2007). MetaQTL: A package of new computational methods for the meta-analysis of QTL mapping experiments. BMC Bioinform. 8, 1. doi: 10.1186/1471-2105-8-49
Wang, X., Wang, K., Yin, G., Liu, X., Liu, M., Cao, N., et al. (2018). Pollen-Expressed Leucine-Rich Repeat Extensins are essential for pollen germination and growth. Plant Physiol. 176, 3. doi: 10.1104/pp.17.01241
Keywords: candidate genes, confidence interval, heat stress, Meta-QTLs, recombinant inbred lines
Citation: Kumar R, Sharma VK, Rangari SK, Jha UC, Sahu A, Paul PJ, Gupta S, Gangurde SS, Kudapa H, Mir RR, Gaur PM, Varshney RK, Elango D and Thudi M (2023) High confidence QTLs and key genes identified using Meta-QTL analysis for enhancing heat tolerance in chickpea (Cicer arietinum L.). Front. Plant Sci. 14:1274759. doi: 10.3389/fpls.2023.1274759
Received: 08 August 2023; Accepted: 25 September 2023;
Published: 20 October 2023.
Edited by:
Hui Song, Qingdao Agricultural University, ChinaReviewed by:
Hatice Sari, Akdeniz University, TürkiyeRafat Sultana, International Crops Research Institute for the Semi-Arid Tropics (ICRISAT), India
Dayong Cui, Qilu Normal University, China
Copyright © 2023 Kumar, Sharma, Rangari, Jha, Sahu, Paul, Gupta, Gangurde, Kudapa, Mir, Gaur, Varshney, Elango and Thudi. This is an open-access article distributed under the terms of the Creative Commons Attribution License (CC BY). The use, distribution or reproduction in other forums is permitted, provided the original author(s) and the copyright owner(s) are credited and that the original publication in this journal is cited, in accordance with accepted academic practice. No use, distribution or reproduction is permitted which does not comply with these terms.
*Correspondence: Mahendar Thudi, mahendar.thudi@gmail.com
†Present address: Pooran M. Gaur, The UWA Institute of Agriculture, University of Western Australia, Perth, WA, Australia