 Simon Obermeyer1
 Richard Stöckl1Tobias Schnekenburger1Christoph Moehle2Uwe Schwartz3
 Klaus D. Grasser1*
- 1Cell Biology & Plant Biochemistry, Biochemistry Centre, University of Regensburg, Regensburg, Germany
- 2Center of Excellence for Fluorescent Bioanalytics (KFB), University of Regensburg, Regensburg, Germany
- 3NGS Analysis Centre, Biology and Pre-Clinical Medicine, University of Regensburg, Regensburg, Germany
Transcript elongation by RNA polymerase II (RNAPII) is dynamic and highly regulated, thereby contributing to the implementation of gene expression programs during plant development or in response to environmental cues. The heterohexameric polymerase-associated factor 1 complex (PAF1C) stabilizes the RNAPII elongation complex promoting efficient transcript synthesis. In addition, PAF1C links transcriptional elongation with various post-translational histone modifications at transcribed loci. We have exposed Arabidopsis mutants deficient in the PAF1C subunits ELF7 or CDC73 to elevated NaCl concentrations to provoke a transcriptional response. The growth of elf7 plants was reduced relative to that of wildtype under these challenging conditions, whereas cdc73 plants exhibited rather enhanced tolerance. Profiling of the transcriptional changes upon NaCl exposure revealed that cdc73 responded similar to wildtype. Relative to wildtype and cdc73, the transcriptional response of elf7 plants was severely reduced in accord with their greater susceptibility to NaCl. The data also imply that CDC73 is more relevant for the transcription of longer genes. Despite the fact that both ELF7 and CDC73 are part of PAF1C the strikingly different transcriptional response of the mutants upon NaCl exposure suggests that the subunits have (partially) specific functions.
Introduction
In eukaryotic cells, hundreds of proteins regulate the transcription of genes by RNA polymerase II (RNAPII). The majority of these proteins control transcriptional initiation via interaction with promoter regions. Functionally distinct so-called transcript elongation factors (TEFs) modulate the efficiency of mRNA synthesis by different mechanisms after the initiation stage. Some TEFs act as histone modifiers, histone chaperones or chromatin remodelers, manipulating properties of the nucleosomal template, whereas others adjust the catalytic activity of RNAPII directly (Sims et al., 2004; Kwak and Lis, 2013; Chen et al., 2018). A remarkable example of a regulator of transcriptional elongation by RNAPII is the multifunctional polymerase-associated factor 1 complex (PAF1C) that originally was discovered and characterized in Saccharomyces cerevisiae (Wade et al., 1996; Mueller and Jaehning, 2002). Yeast PAF1C is composed of five subunits Paf1, Ctr9, Leo1, Rtf1 and Cdc73 and it interacts directly with elongating RNAPII (Jaehning, 2010). In mammals, PAF1C contains an additional subunit WDR61 (Ski8), while RTF1 appears to be less stably associated (Francette et al., 2021). Recent cryo-electron microscopy studies revealed detailed structural insight into the architecture and molecular interactions of elongation competent RNAPII associated with PAF1C and other TEFs (Vos et al., 2018; Vos et al., 2020). The structural information suggests that association of PAF1C with RNAPII allosterically contributes to the stabilization of the elongation complex, which is in line with its stimulation of productive transcript synthesis (Rondón et al., 2004; Hou et al., 2019). Moreover, PAF1C links transcript elongation with various post-translational histone modifications over transcribed regions, including H2B mono-ubiquitination (Wood et al., 2003; Xiao et al., 2005), H3K4me2/3 and H3K79me2/3 (Krogan et al., 2003; Ng et al., 2003; Wood et al., 2003), as well as H3K36me3 (Chu et al., 2007). Thus, PAF1C acts at the interface of transcription and chromatin, modulating the progression of RNAPII during elongation.
In plants, PAF1C is conserved and was initially recognized because of its role in the transition from vegetative to reproductive development (van Lijsebettens and Grasser, 2014). The PAF1C subunits were named after the Arabidopsis mutants, whose analysis for their developmental phenotype led to identification of the genes encoding the respective subunits (He et al., 2004; Oh et al., 2004). Accordingly, most of the subunits based on the mutants were termed early flowering (elf) and/or vernalization independence (vip): PAF1 (At-ELF7), CTR9 (At-ELF8, At-VIP6), LEO1 (At-VIP4), RTF1 (At-VIP5), WDR61/SKI8 (At-VIP3) and CDC73 (At-CDC73, At-PHP) (He et al., 2004; Oh et al., 2004; Park et al., 2010). Co-immunoprecipitation and affinity-purification in combination with mass spectrometry analyses revealed that in common with mammals, Arabidopsis PAF1C consists of these six subunits (Oh et al., 2004; Antosz et al., 2017). Arabidopsis mutants deficient in PAF1C subunits VIP3, VIP4, VIP5, VIP6/ELF8 and ELF7 exhibit marked early flowering phenotypes that are commonly associated by reduced expression of the floral repressor FLC (and paralogs) (Zhang and van Nocker, 2002; Zhang et al., 2003; He et al., 2004; Oh et al., 2004). Moreover, these mutants are significantly smaller than wild type and often exhibit defects in inflorescence and flower morphology (Zhang and van Nocker, 2002; Zhang et al., 2003; He et al., 2004; Fal et al., 2017). Mutants defective in the CDC73/PHP subunit share the early flowering phenotype (and reduced FLC expression), but are of wild type size and display normal flower development (Park et al., 2010; Yu and Michaels, 2010). The decreased expression of FLC in mutants lacking PAF1C subunits is likely mediated by altered levels and distribution of histone H3 methylation marks at the FLC locus (e.g. H3K4me3, H3K27me3, H3K36me2) (He et al., 2004; Oh et al., 2008; Xu et al., 2008; Park et al., 2010; Yu and Michaels, 2010). PAF1C also modulates the temperature-responsive transition to flowering (Nasim et al., 2022). Beyond that PAF1C is required for plant response to repeated touch stimuli, as Arabidopsis mutants deficient in VIP3, VIP5 and VIP6 did not react to the mechanical stimulation as the wild type. VIP3 proved necessary for the touch-induced upregulation of the TCH3 and TCH4 mRNAs, a characteristic feature of the response to mechanical stimulation (Jensen et al., 2017).
The diversity of phenotypes associated with deficiency of PAF1C subunits in various organisms can be attributed to the misexpression of target genes and downstream processes. In yeast and mammals, there is accumulating evidence that inactivation of different PAF1C subunit genes to some extent causes distinct phenotypes, arguing for subunit specificity (Francette et al., 2021). This aspect has not been addressed in plants under transcriptional challenging conditions. Since chromatin-based reprogramming in reaction to environmental cues is crucial for plant growth (Kim, 2021), we studied here the transcriptional response of Arabidopsis PAF1C subunit mutants upon exposure to elevated NaCl concentrations.
Materials and methods
Plant cultivation and documentation
Seeds of Arabidopsis thaliana Col-0 were sown on solid 0.5x MS medium (Murashige and Skoog, 1962) and after stratification for 48h at 4°C in the dark, the plates were transferred to a plant incubator (PolyKlima) with long day settings (16h light (110 µmol·m-2·s-1) at 21°C and 8h darkness at 18°C. In some experiments the 0.5x MS medium was supplemented with 50 or 100 mM NaCl and for root growth assays plants were grown on vertically oriented 0.5x MS plates. Plant phenotypes including root growth were documented as previously described (Dürr et al., 2014; Antosz et al., 2020). Seeds of T-DNA insertion lines were obtained from the Arabidopsis stock centre (http://arabidopsis.info/): elf7-2, elf7-3, elf8-1 (He et al., 2004); cdc73-1, cdc73-2 (Park et al., 2010; Yu and Michaels, 2010) and GK_270G12 harboring a T-DNA insertion in exon 14 of ELF8 (At2g06210) (Kleinboelting et al., 2012) termed elf8-4. Plant genotypes were examined by PCR analysis of genomic DNA isolated from leaves as previously described (Dürr et al., 2014; Antosz et al., 2020) using gene- and insertion-specific primers (Table S1).
Isolation of RNA and cDNA synthesis
Nuclei were isolated from aerial parts of 7 days after stratification (DAS) plants as previously described (Pfab et al., 2017) and analyzed by fluorescence microscopy and immunoblotting as previously described (Antosz et al., 2017; Pfab et al., 2018). RNA was extracted from frozen nuclei using the TRIzol method (Invitrogen). After DNase treatment reverse transcription was performed using 1.5 µg of RNA, random hexameric primers and 200 U Reverse Transcriptase (Thermo Fisher Scientific) as previously described (Pfaff et al., 2018).
RT-qPCR analyses
Amplification with cDNA as a template was performed using the Kapa SYBR FAST system (ThermoFisher Scientific) and gene-specific primers (Table S1) with a Mastercycler ep realplex 2 (Eppendorf) as previously described (Antosz et al., 2017). The qPCR measurements were analyzed using the ΔΔCt method implemented with the ‘pcr’ package (Ahmed and Kim, 2018).
Transcript profiling by RNA-seq
Nuclear RNA isolated using the TRIzol method (Invitrogen) was further purified and DNase-treated using the Monarch RNA Cleanup Kit (New England Biolabs). Library preparation and RNA-seq were performed at the Genomics Core Facility (University of Regensburg, www.kfb-regensburg.de), employing the following modules: NuGEN Universal Plus RNA-Seq with NuQuant User Guide v3 (Tecan Genomics) in combination with Arabidopsis rRNA AnyDeplete module, the Illumina NextSeq 2000 System (Illumina), and the KAPA Library Quantification Kit-Illumina/ABI Prism (Roche Sequencing Solutions). To judge final library complexities (vs. PCR duplicates) unique molecular tags were used (Smith et al., 2017). Equimolar amounts of each library were sequenced on an Illumina NextSeq 2000 instrument controlled by the NextSeq 2000 Control Software (NCS, v1.4.0.39521), using 50 cycles P3 Flow Cell with the dual index, paired-end run parameters. Image analysis and base calling were done by the Real Time Analysis Software (RTA, v3.9.2). The resulting ‘.cbcl’ files were converted into ‘.fastq’ files with the bcl2fastq (v2.20) software.
RNA-seq data analysis
Quality control was performed using fastQC (v0.11.9) and multiQC (v1.11) (Ewels et al., 2016). After the initial quality assessment, the molecular tag data was recorded in the header for each read via umi_tools (v1.1) (Smith et al., 2017). Reads with low base quality and adapter contaminations were removed using trimmomatic (v0.39, ‘ILLUMINACLIP : NGS_contaminants.fa:2:30:10 LEADING:3 TRAILING:3 SLIDINGWINDOW:4:15 MINLEN:36’) (Bolger et al., 2014). The remaining reads were mapped to the TAIR10 genome (Lamesch et al., 2012) using STAR (v2.7.9a, ‘–outFilterType BySJout –outFilterMultimapNmax 20 –alignSJoverhangMin 8 –alignSJDBoverhangMin 1
–outFilterMismatchNmax 999 –alignIntronMin 10 –alignIntronMax 1000000
–outFilterMismatchNoverReadLmax 0.04 –outSAMmultNmax 1 –outMultimapperOrder Random’). The resulting ‘.bam’ files were filtered to only include alignments with MAPQ score ≥ 10, sorted, and indexed using samtools (v1.3) (Danecek et al., 2021). Finally, the molecular tag data was used in conjunction with the alignments to remove technical duplicates using umi_tools (v1.1).
For the differential gene expression analysis, the resulting files from the pipeline outlined above were used to create a count table using the featureCounts function of the rsubread package (v2.4.3) (Liao et al., 2019), which was then analyzed using DESeq2 (v1.30.1) (Love et al., 2014) and the tidybulk package (v1.2.1) (Mangiola et al., 2021).
Differential splicing analysis was performed using DEXSeq v1.40 (Anders et al., 2012; Reyes et al., 2013). First, the exon annotation was prepared using the provided python script dexseq_prepare_annotation.py with the option ‘-r no’. Next, the read coverage of each exon was calculated using the dexseq_count.py script. Finally, salt stress-induced alternative splicing of either Col-0 or cdc73-2 samples was tested using default settings and an FDR of 0.05.
ChIP sequencing
Chromatin immunoprecipitation (ChIP) was essentially performed as previously described (Antosz et al., 2020; Michl-Holzinger et al., 2022). Plants (14-DAS in vitro grown) were crosslinked with formaldehyde and used for isolation of nuclei, before chromatin was sheared using a Bioruptor pico device (Diagenode). Immunoprecipitation was performed using antibodies directed against RNAPII-S2P (abcam, ab5095). For ChIP-seq, libraries were generated using NEBNext Ultra II DNA Library Prep Kit for Illumina (New England BioLabs) and the final libraries (3 replicates each) were sequenced by the Genomics Core Facility at the University of Regensburg using NextSeq 2000 (Illumina). Reads were aligned to the TAIR10 genome (https://www.arabidopsis.org/) using Bowtie2 (Langmead and Salzberg, 2012) and coverage tracks were calculated with deeptools “bamCoverage”. Downstream analysis was mainly performed using the deepTools2 suite (version 3.5.0) (Ramírez et al., 2016) and quality control was performed at several steps using FastQC (Ewels et al., 2016). Reads were mapped against the TAIR10 genome and regions with aberrant coverage or low sequence complexity were removed (Quadrana et al., 2016). After confirming high pairwise correlations, the biological replicates were merged and CPM normalized.
Results
Various PAF1C subunit mutants respond differently when exposed to elevated NaCl concentrations
Based on preliminary tests with different environmental stress conditions we focused on elevated NaCl concentrations to provoke transcriptional reprogramming in PAF1C subunit mutants. Initially, seeds of the T-DNA insertion lines elf7-2, elf7-3, elf8-1, elf8-4, cdc73-1, cdc73-2 and of the wild type of Col-0 were sown on MS medium containing 100 mM NaCl and on MS control medium. In presence of 100 mM NaCl after 14d all genotypes showed reduced growth, when compared with plants grown on control medium (Figure 1A). Compared to Col-0, the elf7 and elf8 mutants were affected to a greater extent, while the cdc73 mutants grew rather better than Col-0. These observations were reassessed with plants grown on control medium for seven days, before transfer onto control medium or onto medium containing 100 mM NaCl. The growth of the transferred plants confirmed the previous finding that elf7-2/3 and elf8-1/4 plants were more strongly affected by NaCl than Col-0, while cdc73-1/2 were affected less than Col-0 (Figure 1B). The aerial parts of the different genotypes were quantified after growth in presence or absence of 100 mM NaCl. Only minor differences between the genotypes were observed on control medium regarding rosette diameter and fresh weight (Figures 1C, D). However, when grown in presence of 100 mM NaCl, rosette diameter and fresh weight of elf7 and elf8 plants were significantly reduced, while cdc73 were somewhat bigger than Col-0. Furthermore, the relative growth of the primary root of the different genotypes was monitored on vertically oriented plates, comparing root elongation in presence of 100 mM NaCl with that of the same genotype on control medium (Supplementary Figure S1). Quantification of root length revealed that the roots of Col-0 and cdc73 grew comparably, whereas the relative root growth of elf7 and elf8 plants was clearly decreased (Figure 1E). Thus, compared to the Col-0 wild type, exposure to 100 mM NaCl has a profound negative effect on the growth of elf7 and elf8, while the lack of CDC73 apparently has no adverse effect on the tolerance to NaCl.
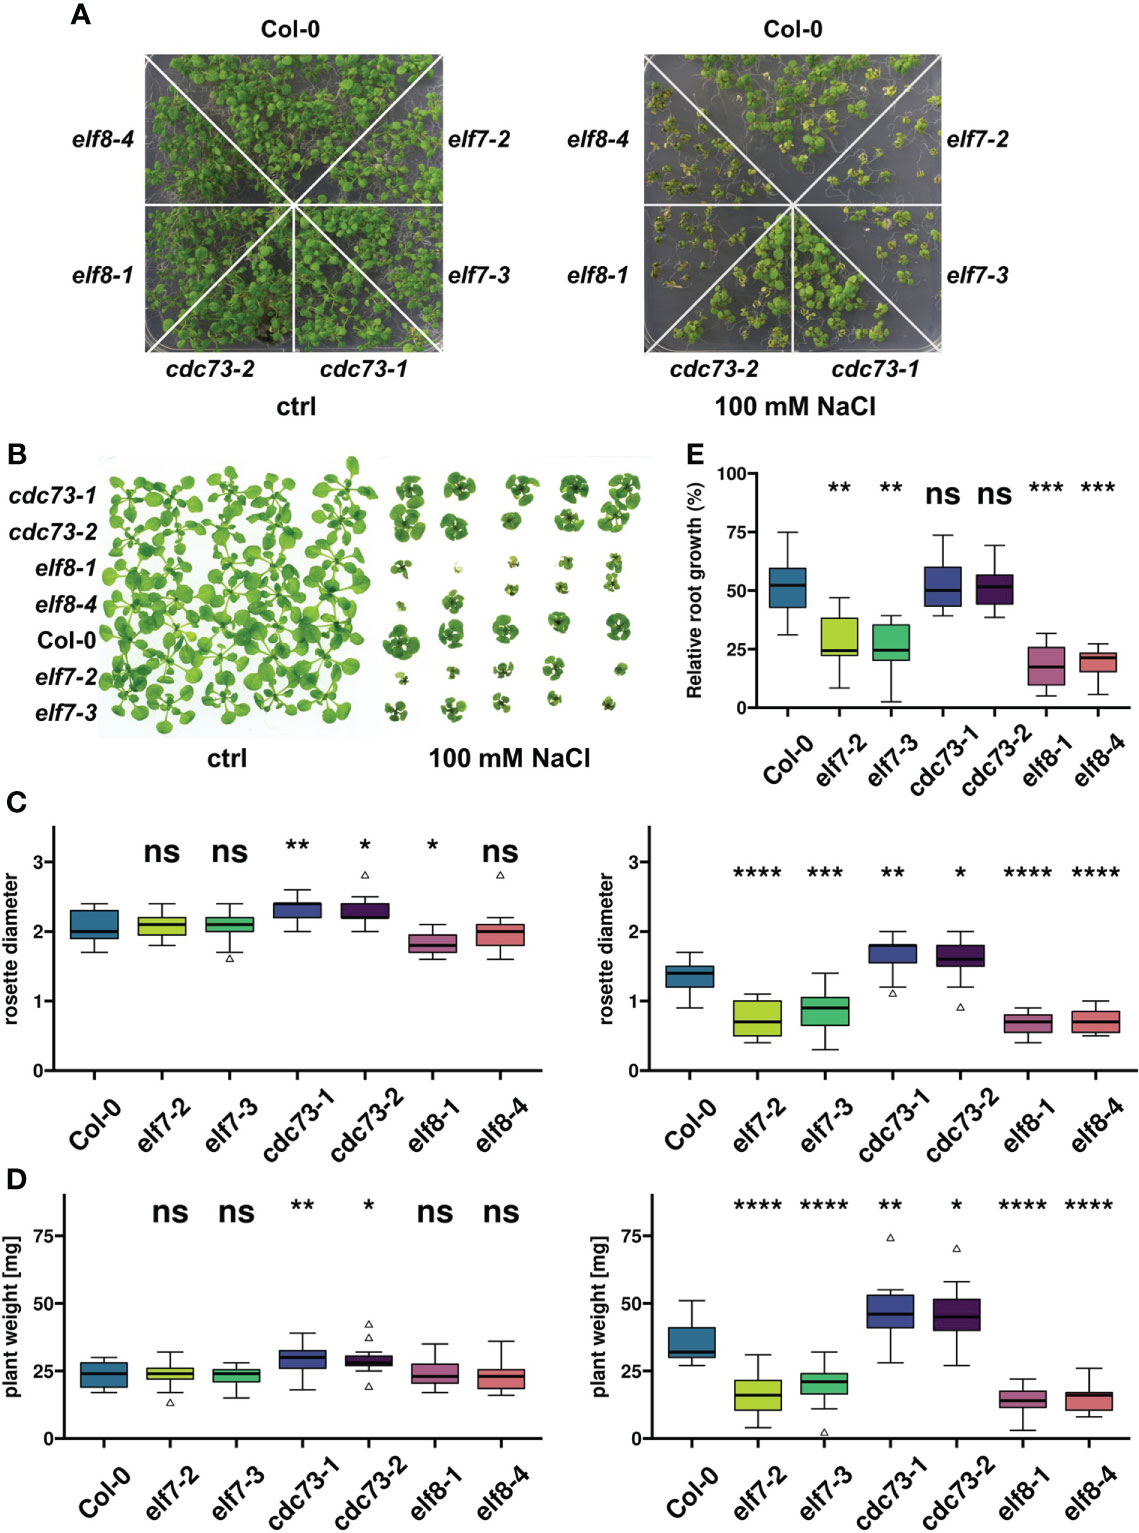
Figure 1 Growth of PAF1C subunit mutants is differentially affected by exposure to elevated NaCl concentrations. (A) Seeds of the indicated genotypes were sown on solid MS medium containing 100 mM NaCl or control medium (ctrl), and the resulting plants were documented at 14 days after stratification (14 DAS). (B) After growth on solid MS medium for 7 DAS, plants of the indicated genotypes were transferred to control medium or to medium containing 100 mM NaCl. Plants were documented after additional 18d (ctrl) or 21d (100 mM NaCl) of growth. (C, D) 7 DAS plants were grown in absence or presence of 100 mM NaCl for another 11d (ctrl, left) or 14d (100 mM NaCl, right), before rosette diameter [cm] (C) or fresh weight [mg] (D) was determined (n = 15). (E) Plants were grown on vertical MS plates for 7 DAS, before they were transferred to control medium or medium containing 100 mM NaCl. Length of the primary roots was recorded directly after transfer (0h) and 96h after transfer (n = 8). Growth after 96h in presence of NaCl is depicted as percentage of growth of the same genotype on control medium. The relative growth of each genotype was compared to Col-0 using Wilcoxon signed-rank test (ns, not significant; *, p ≤ 0.05; **, p ≤ 0.01; ***, p ≤ 0.001; ****, p ≤ 0.0001).
To figure out the time it takes in our experimental setup until transcriptional induction is traceable, we determined the levels of the LTP4 mRNA that is strongly up-regulated in Arabidopsis plants in response to NaCl (Winter et al., 2007). Using RT-qPCR, the LTP4 transcript was quantified (relative to transcripts of three housekeeping genes) at different times after transfer of Col-0 plants onto medium containing 100 mM NaCl or control medium. Consistent with the induction kinetics of other studies (Kilian et al., 2007), the LTP4 transcript, but not the two controls, were clearly up-regulated in our setup after 3h and 9h of exposure to 100 mM NaCl, while after 1h no induction was detected (Figure 2). For the following analyses addressing transcriptomic changes upon NaCl exposure, we focused on the three genotypes Col-0, elf7-3 and cdc73-2.
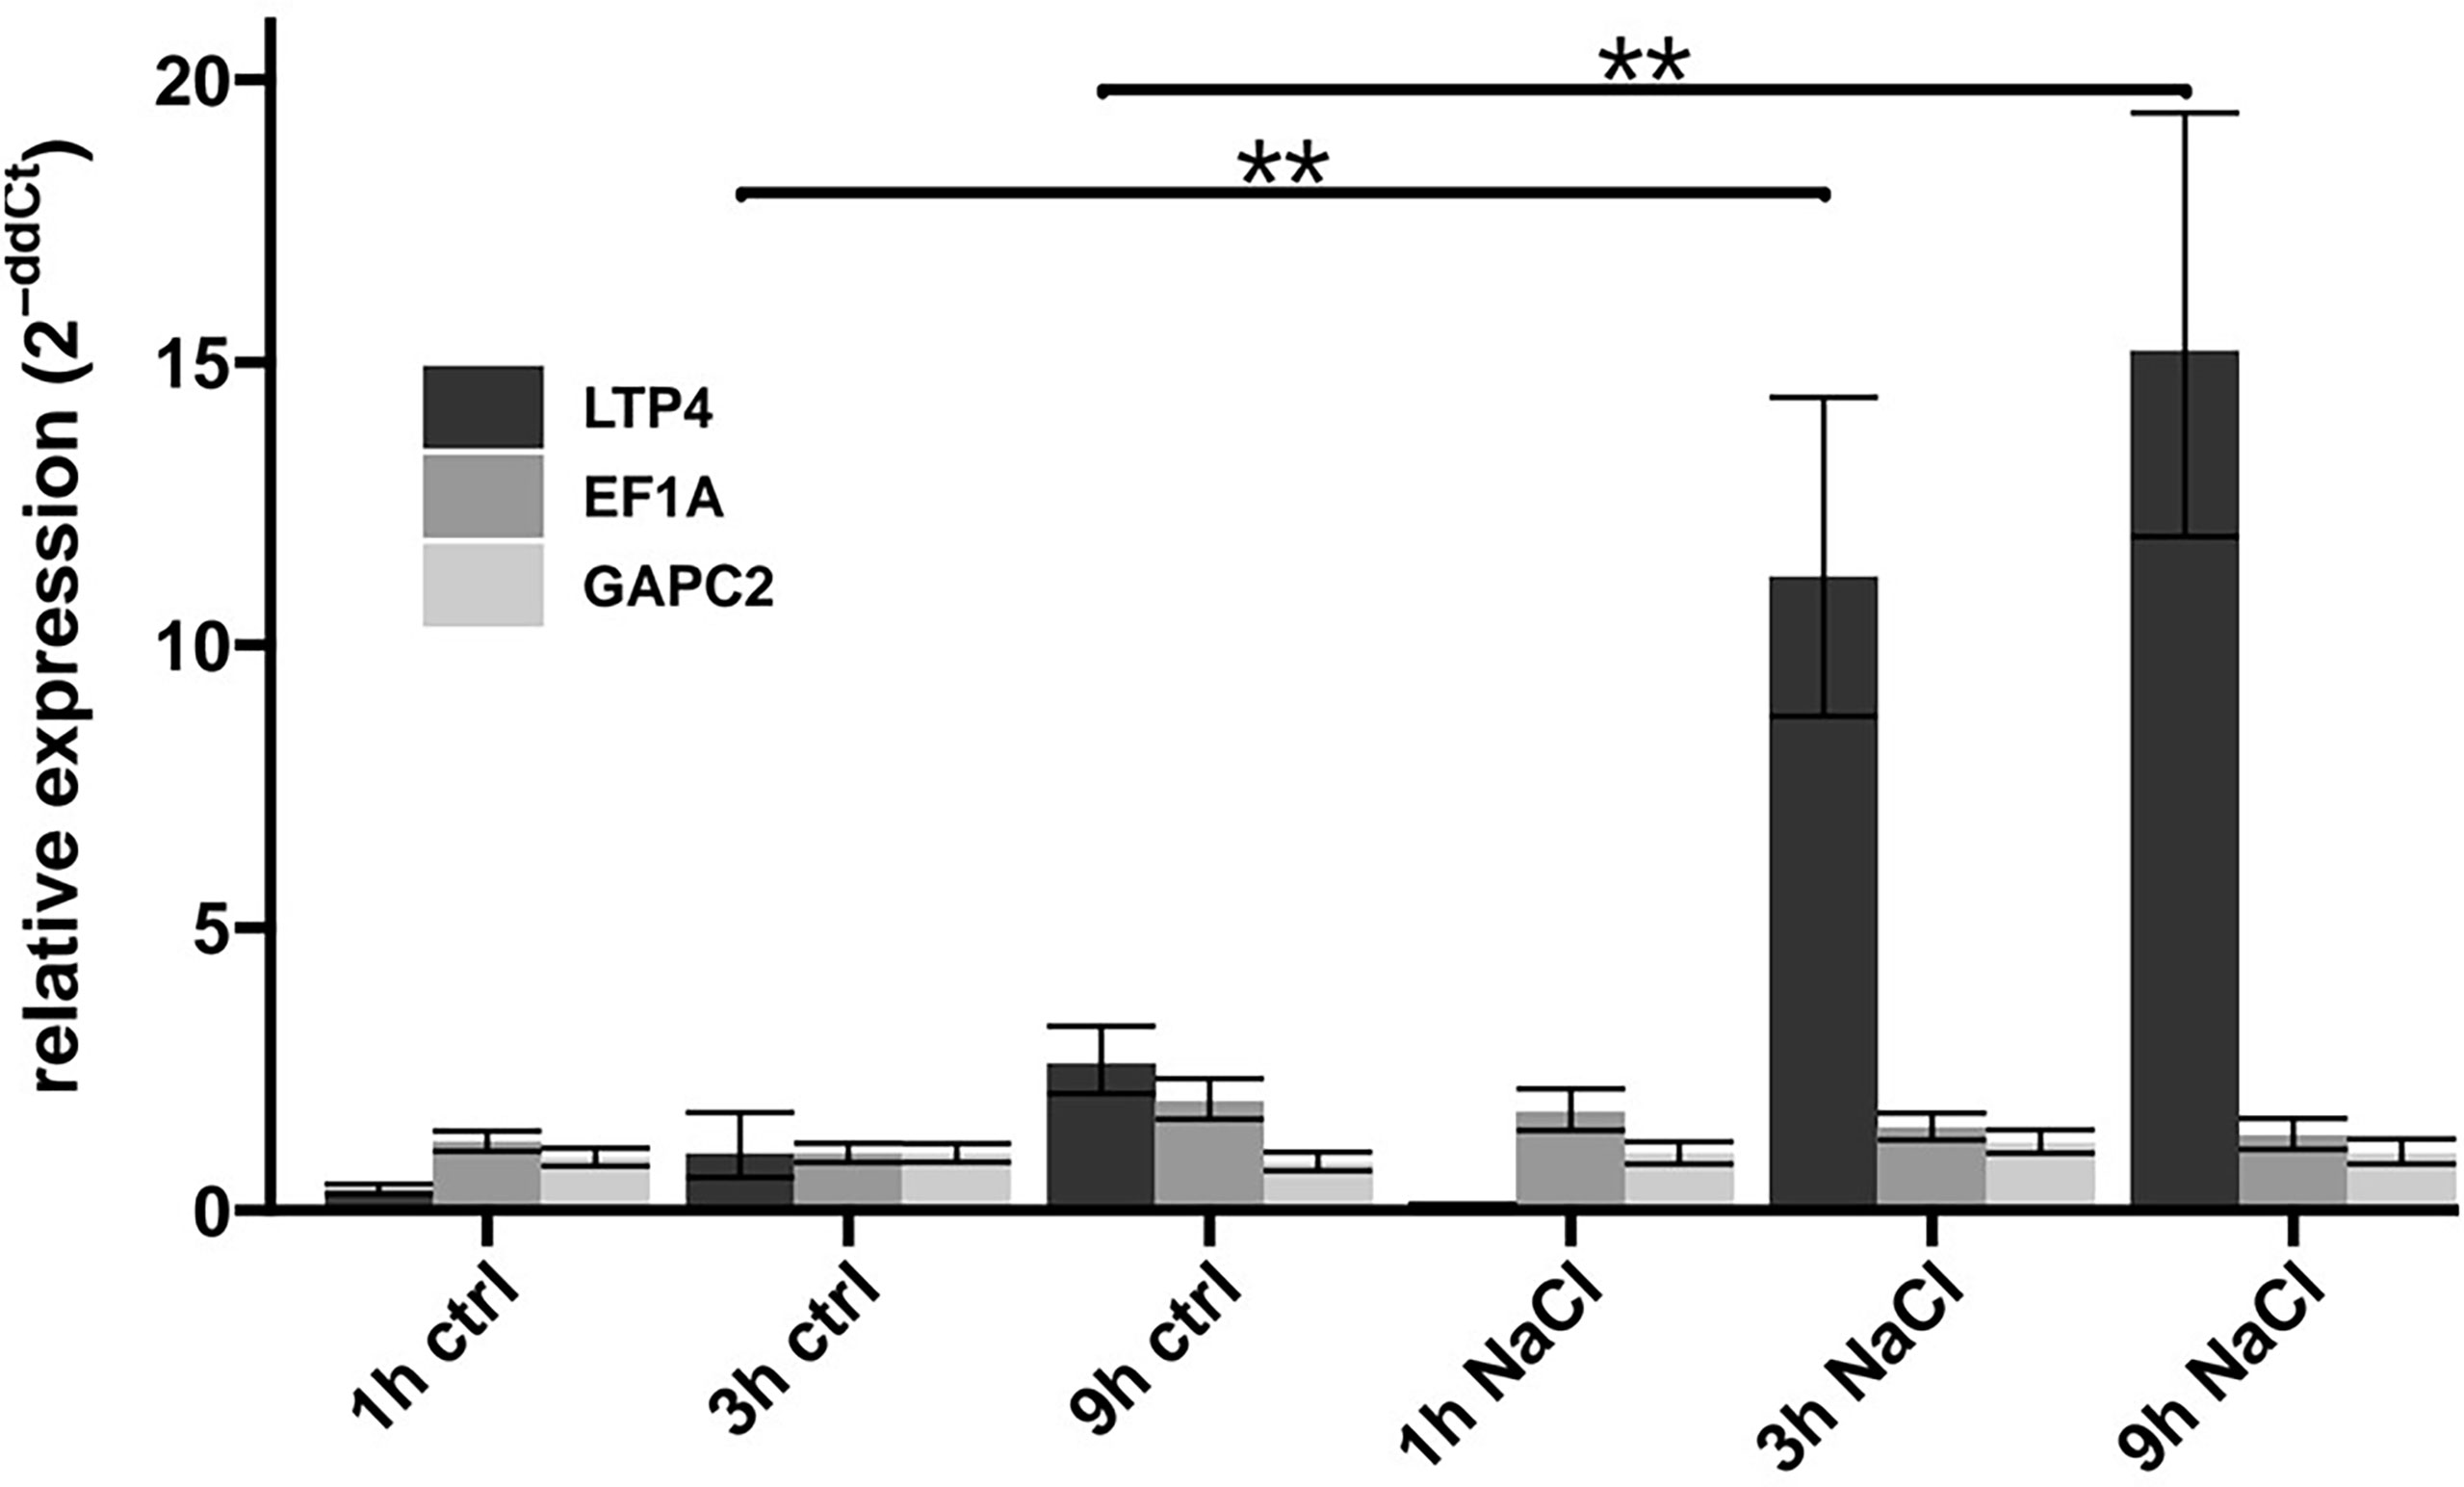
Figure 2 Changes in transcript levels upon exposure to NaCl. After growth on solid MS medium for 7 DAS, Col-0 plants were transferred to control medium (ctrl) or to medium containing 100 mM NaCl (NaCl). After different periods of the indicated treatment, RNA was isolated and the transcript levels of LTP4 and reference genes (EF1A, GAPC2, ACT2) quantified by RT-qPCR. The depicted relative expression was normalised to the level of ACT2 transcript in Col-0. The bars represent the mean relative expression of three technical replicates and error bars represent SD. The relative expression of LTP4 was compared between control and NaCl treated condition of the same timepoints using Wilcoxon´s signed-rank test indicated by brackets (**, p ≤ 0.01).
ELF7 is required for efficient transcriptional response upon NaCl exposure
To learn whether the differential response to NaCl exposure of elf7-3 relative to Col-0 and cdc73-2 is paralleled by distinct transcriptional changes, we performed genome-wide transcript profiling of these three genotypes using RNA-seq. We intended to generate information on transcriptional output (freshly synthesized unspliced/spliced mRNAs including nascent transcripts) rather than steady-state mRNA levels obtained with total poly(A) mRNA (Zaghlool et al., 2013; Dhaliwal and Mitchell, 2016). Therefore, we (i) isolated nuclear RNA (rather than total RNA) (Supplementary Figure S2), (ii) used rRNA depletion (rather than poly(A) enrichment) and (iii) made use of low RNA size cut-off (≥25 nt). Four biological replicates of RNA of each genotype with or without 3h exposure to 100 mM NaCl were used for preparation of sequencing libraries. Analysis of the RNA-seq data revealed >35 million unique reads per genotype (Table S2) and that the biological replicates of the analyzed genotypes/conditions yielded robust results (Supplementary Figure S3), except for one of the elf7-3/NaCl samples that was removed as outlier. Analysis of genes differentially expressed in elf7-3 or cdc73-2 compared to Col-0 under control conditions identified 12 and 722 differentially expressed genes (DEGs) in cdc73-2 and elf7-3, respectively (Supplementary Figure S4). Gene ontology (GO) term analysis of the DEGs in elf7-3 identified genes responsive to salt stress as a prominent term (Supplementary Figure S5), while due to the small number of DEGs in cdc73-2 the analysis showed no significant enrichment. The differential expression of only subsets of genes is in general agreement with Arabidopsis mutants deficient in other TEFs (van Lijsebettens and Grasser, 2014), although the transcriptomic difference to wild type is remarkably low in case of cdc73-2.
Analysis of differential gene expression with or without NaCl treatment for the genotypes separately revealed numerous significantly up- or down-regulated genes in Col-0 and cdc73-2 (Figures 3A, B). In contrast, a clearly lower number of DEGs with mostly smaller expression changes was detected in elf7-3 (Figure 3C). Principal component analysis (PCA) revealed a strict clustering of the samples according to NaCl treatment and control treatment (Supplementary Figure S6) that together with the observed Pearson correlation (Supplementary Figure S3) indicates the reproducibility of the obtained data. The transcriptomic analysis illustrates that 926 and 831 nuclear-encoded genes are differentially expressed upon NaCl treatment in Col-0 and cdc73-2, respectively (Figure 3D). A major part (568 genes) of the DEGs appears to be equally regulated in both genotypes. Moreover, a greater number of genes is up-regulated in both genotypes (675 and 507 for Col-0 and cdc73-2, respectively) when compared to the down-regulated genes (251 and 324 for Col-0 and cdc73-2, respectively) (Figures 3D, E). In elf7-3, 338 DEGs are detected upon NaCl treatment, of which 225 and 113 are up- and downregulated, respectively.
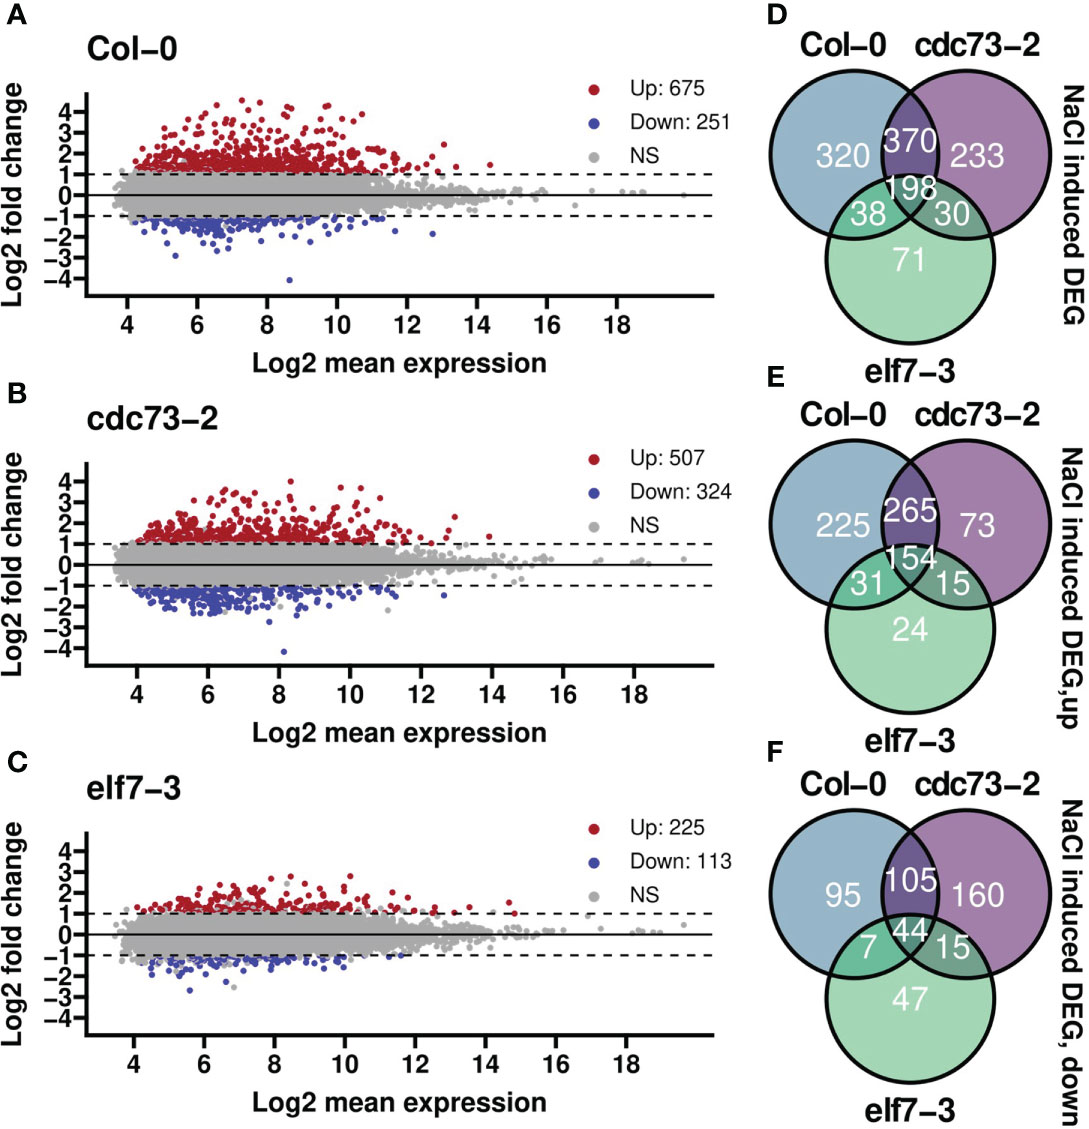
Figure 3 Differential gene expression analysis of elf7-3 and cdc73-2 relative to Col-0 upon NaCl treatment. (A–C) differential gene expression between treatment and control groups for each genotype separately. Highlighted in red are genes that are significantly upregulated after salt stress (log-fold change, LFC≥ 1 and padjusted ≤ 0.05), while in blue are genes that are significantly downregulated upon NaCl exposure (LFC≤ −1 and padjusted ≤ 0.05). NS = not significant. Numbers in the legends represent the gene counts in that group. (D, E) Venn diagrams summarising the number of differentially expressed genes in the different genotypes (as in A–C) upon NaCl treatment with total number of differentially expressed genes (D), upregulated (E) or downregulated (F) genes. ns, not significant.
Hierarchical clustering analysis of the 500 genes that showed most variable transcript levels upon exposure to NaCl was visualized as a heatmap. Here, in agreement with the PCA (Supplementary Figure S6), predominantly two clusters are apparent, representing the two different conditions “control” and “NaCl” (Figure 4). As shown above, compared to Col-0 and cdc73-2, elf7-3 exhibit decreased changes in transcript levels upon exposure to NaCl. Further analysis revealed that both the potential of elf7-3 plants to induce and to repress transcription is decreased (Supplementary Figure S7). The NaCl-induced transcriptomic changes, occurring in Col-0 upon exposure to NaCl (926 DEGs) were further examined by GO term analysis. As expected (Golldack et al., 2014; Yang and Guo, 2018), this analysis demonstrated predominant enrichment of the GO term “response to salt stress” in all three genotypes (Supplementary Figure S8).
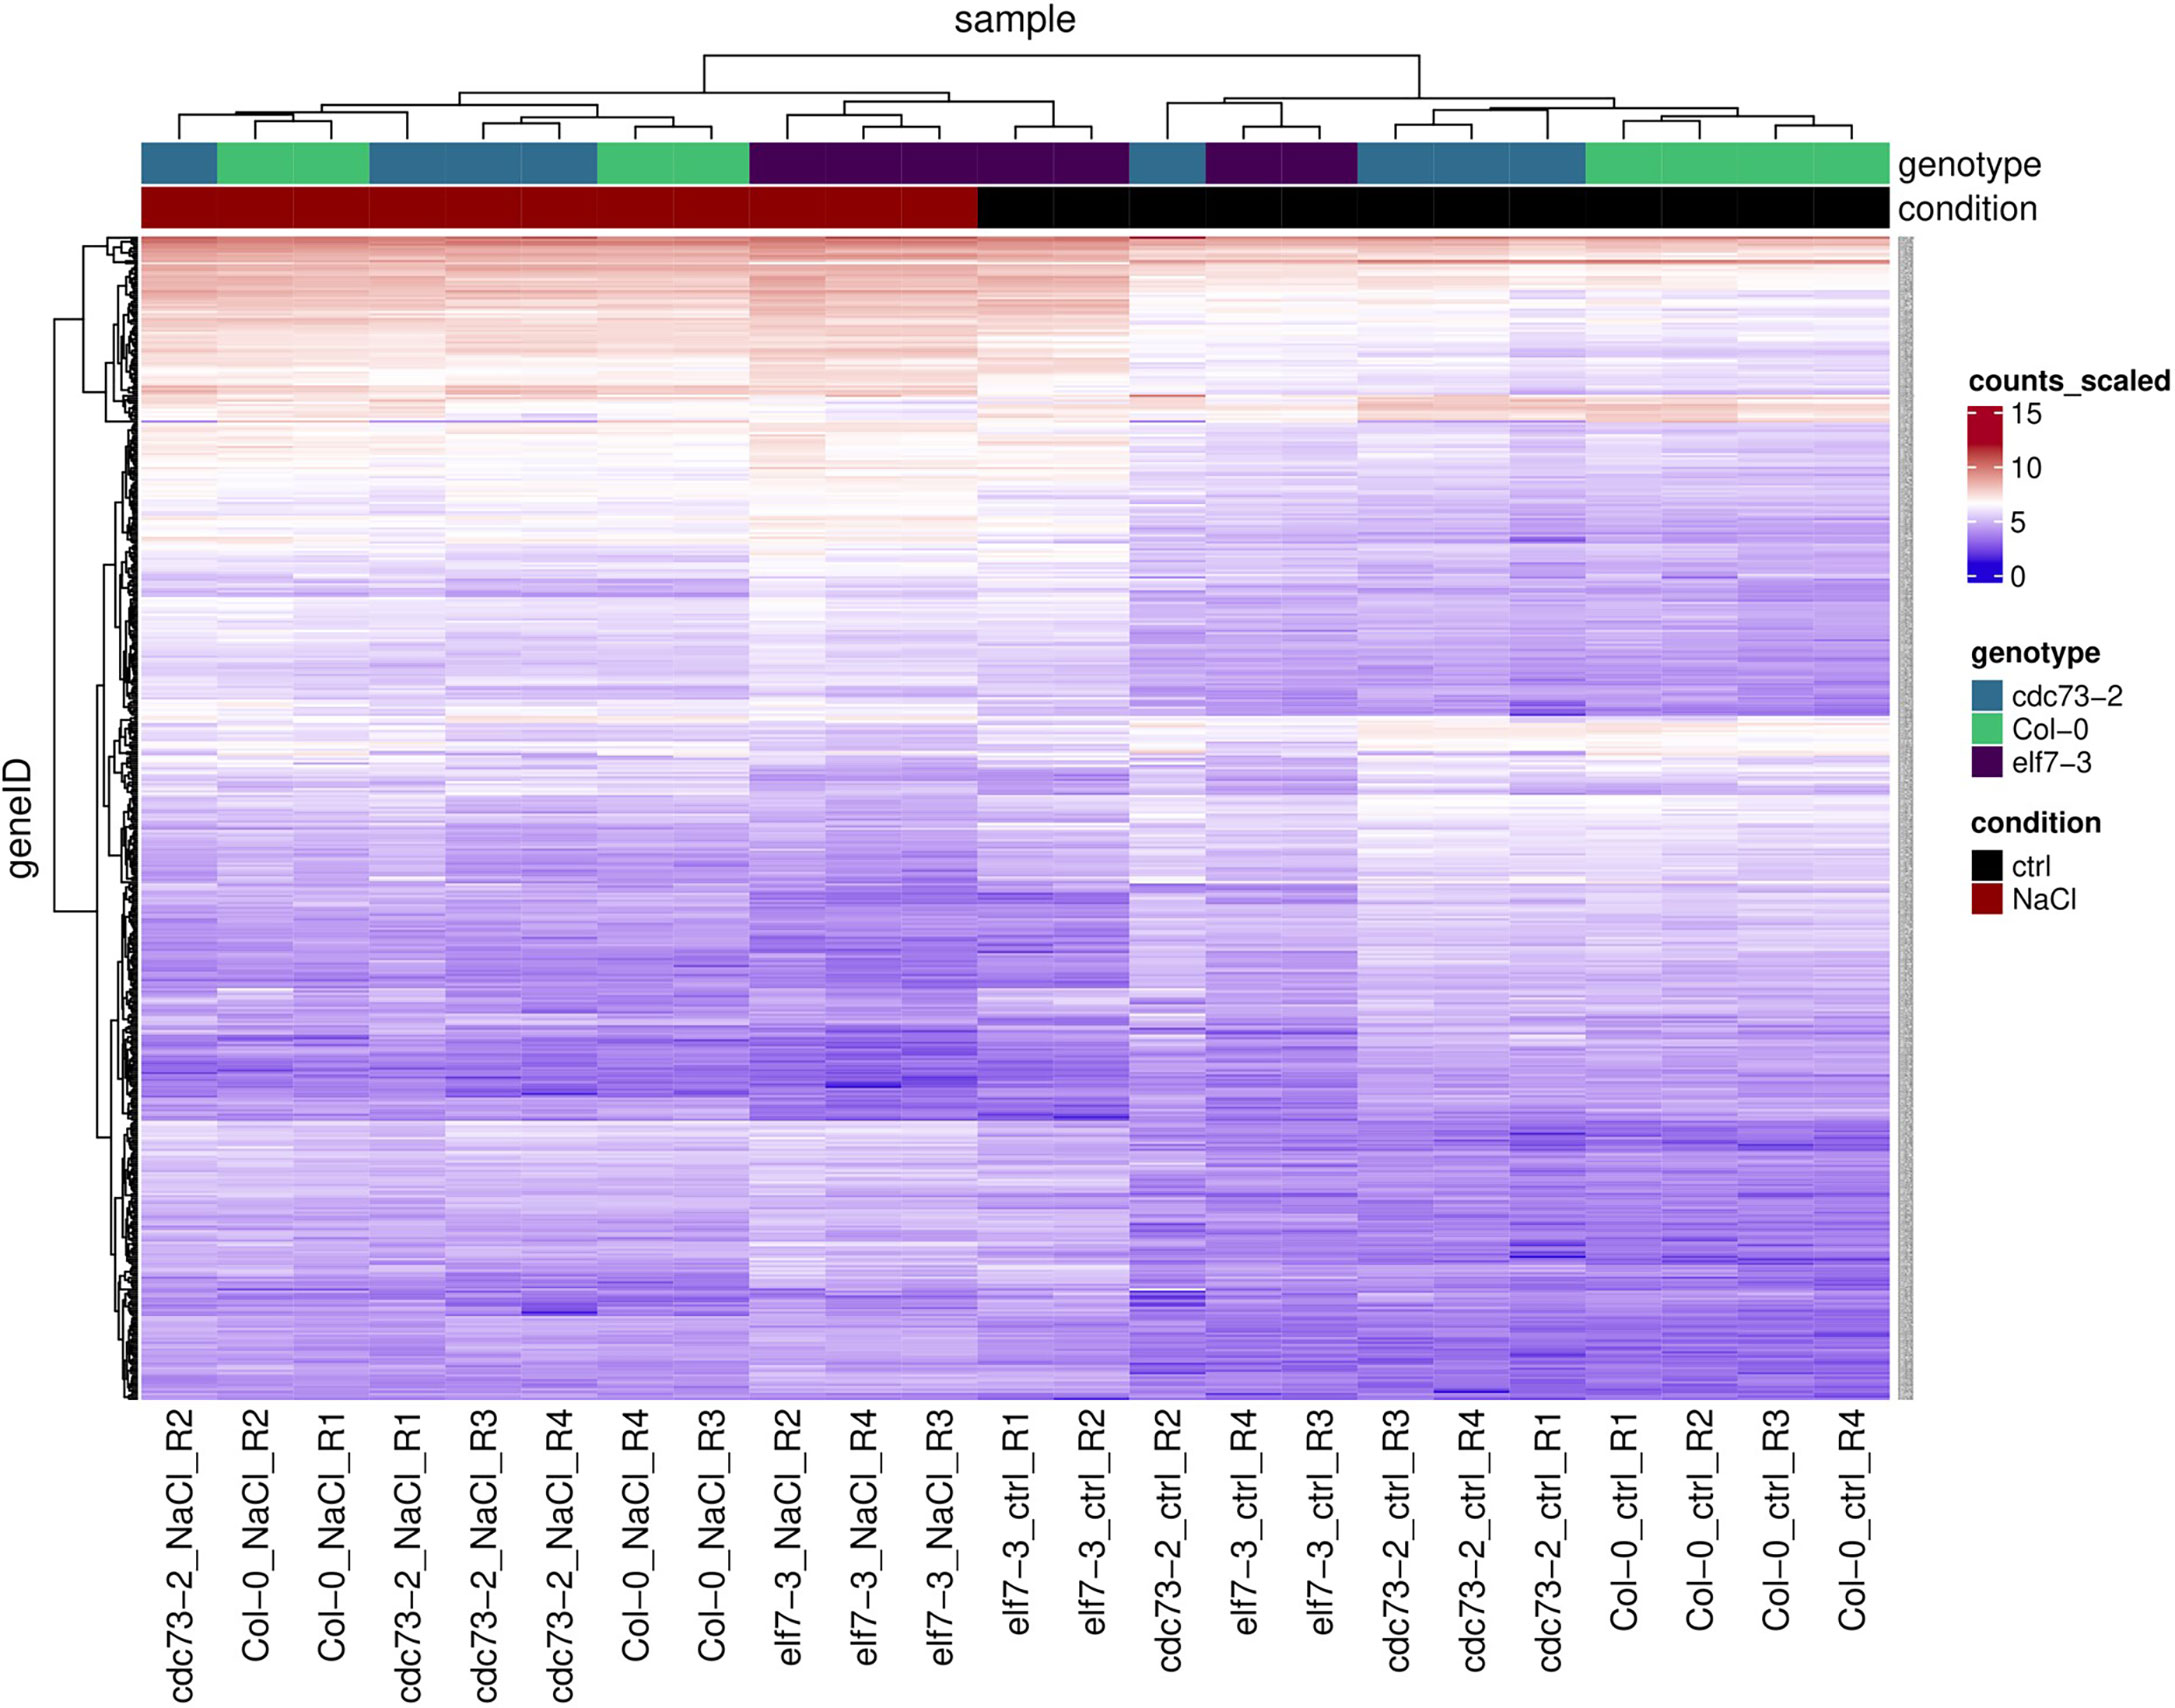
Figure 4 Heatmap and hierarchical clustering of the 500 most variable genes identified by transcript profiling of elf7-3 and cdc73-2 relative to Col-0 upon NaCl treatment. These genes were selected from the scaled counts of the count table using the subread package “featureCounts” and the count table includes the counts for all replicates, conditions and genotypes. Relative transcript abundance is shown as heatmap using the indicated scale (LFC of scaled counts). Genotypes and condition (ctrl: control; NaCl: 3h 100 mM NaCl) are colour-coded on top.
The differential transcriptional response observed with the different genotypes is also evident at the level of individual genes. As exemplified by the NaCl-inducible wax synthase/acyl-CoA:diacylglycerol acyltransferase (WSD1) gene, which plays a critical role in wax ester synthesis (Abdullah et al., 2021). Upon NaCl exposure substantially increased transcript levels of WSD1 are detected in Col-0 and cdc73-2, while expression of the gene is hardly altered in elf7-3 (Figure 5A). Another situation is observed for NaCl-repressed DISEASE RELATED NONSPECIFIC LIPID 26 TRANSFER PROTEIN 1 (DRN1) gene, required for defense against pathogens as well as for normal seedling growth under salinity stress (Dhar et al., 2020). The DRN1 transcript levels are reduced in presence of NaCl in Col-0 and cdc73-2, but not in elf7-3 (Figure 5B). In case of the ICL gene encoding isocitrate lyase that plays a role in plant salt tolerance through the glyoxylate cycle (Yuenyong et al., 2019), no transcriptional change occurs in response to NaCl. However, relative to Col-0 and elf7-3 distinctly elevated ICL transcript levels are detected in cdc73-2 (Figure 5C). As discussed below, the differential transcriptional response might provide an explanation for the major difference of the three genotypes regarding their tolerance towards NaCl.
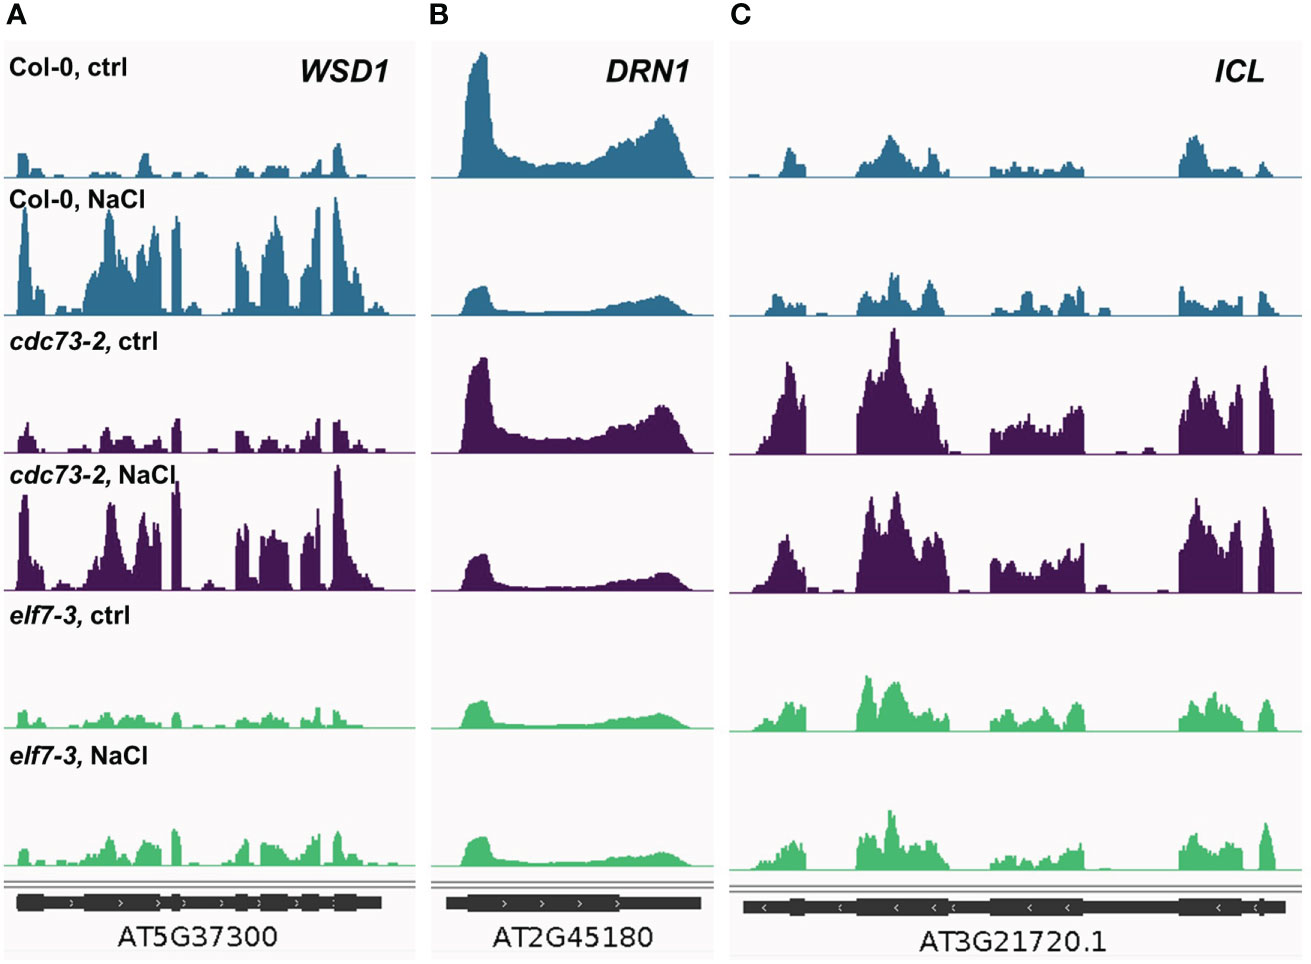
Figure 5 Changes in transcript levels in the different genotypes at individual loci dependent on the presence of NaCl. Coverage of merged RNA-seq samples was normalised to the effective Arabidopsis genome size and visualised using the Integrative Genomics Viewer. (A) coverage of WSD1 (At5g37300), a gene induced by elevated salt concentrations. (B) coverage of DRN1 (At2g45180), a gene repressed by elevated salt concentrations. (C) coverage of ICL (At3g21720), a gene, whose expression enhances salt tolerance.
Further evaluation of genes specifically up- or down-regulated upon NaCl treatment in Col-0 or cdc73-2 revealed that in Col-0 the average length of up-regulated transcripts is greater than that of the down-regulated transcripts, whereas the inverse is seen in cdc73-2 (Figure 6A). The number of exons in these genes is higher in genes down-regulated in cdc73-2 relative to the up-regulated genes, while regarding number of exons there is no significant difference among the DEGs specifically regulated in Col-0 (Figure 6B). Together these findings suggest that in the absence of CDC73 the processivity of RNAPII is decreased, which is particularly relevant for the transcription of longer genes. Analysis of differential splicing events induced upon NaCl exposure in either cdc73-2 or Col-0 revealed only very few events (Supplementary Figure 9). This suggests that the greater length of down-regulated genes does not correlate with differential splicing events, but rather with a reduced transcriptional processivity, albeit the sequencing depth and read length of the experimental setup was not sufficient for a comprehensive spicing analysis.
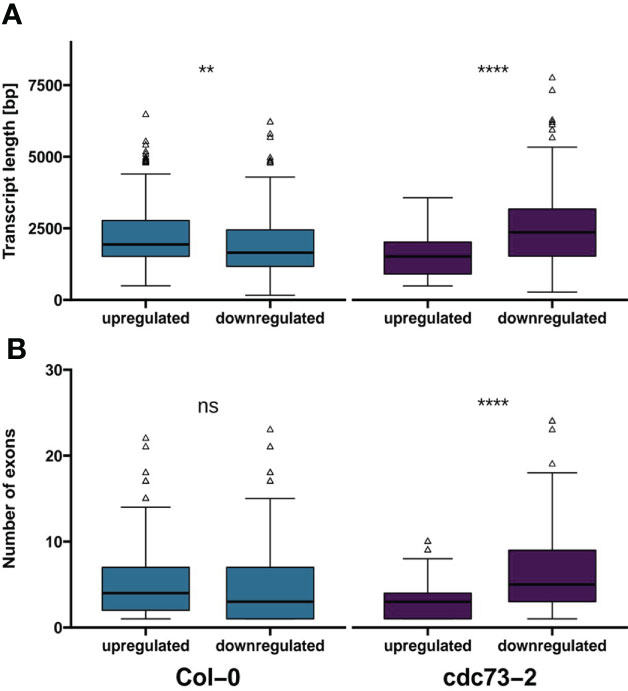
Figure 6 Transcript length and number of exons of genes uniquely differentially expressed in Col-0 or cdc73-2. (A) average transcript length of genes differentially expressed either in Col-0 or cdc73-2. (B) number of exons of genes differentially expressed either in Col-0 or cdc73-2. Data was evaluated using Wilcoxon signed-rank test (**, p ≤ 0.01; ****, p ≤ 0.0001; ns, not significant).
Chromatin immunoprecipitation (ChIP) in combination with high throughput sequencing (ChIP-seq) was employed to examine the distribution of RNAPII over genes, whose expression is dependent on the presence/absence of ELF7. Chromatin of Col-0 and elf7-3 was analyzed with an antibody specific for elongating RNAPII (RNAPII-S2P). Analyses of the ChIP-seq data revealed 12.3-18.8 million high quality reads per genotype and the biological replicates show robust correlation (Supplementary Figure S10). RNAPII coverage was compared for genes up- or downregulated in elf7-3 vs. Col-0 under standard conditions or upon exposure to NaCl. For upregulated genes RNAPII coverage is mildly increased, whereas for downregulated genes RNAPII coverage is clearly reduced in elf7-3 (Figure 7). The genes with highly reduced RNAPII coverage include, for instance, also the above-mentioned DRN1 gene (cf. Figure 5), whose expression is required for salt tolerance (Dhar et al., 2020). Therefore, ELF7 is particularly necessary for transcription of genes mis-regulated in elf7-3 and transcriptional upregulation appears to depend more strongly on ELF7 (cf. Supplementary Figure S4).
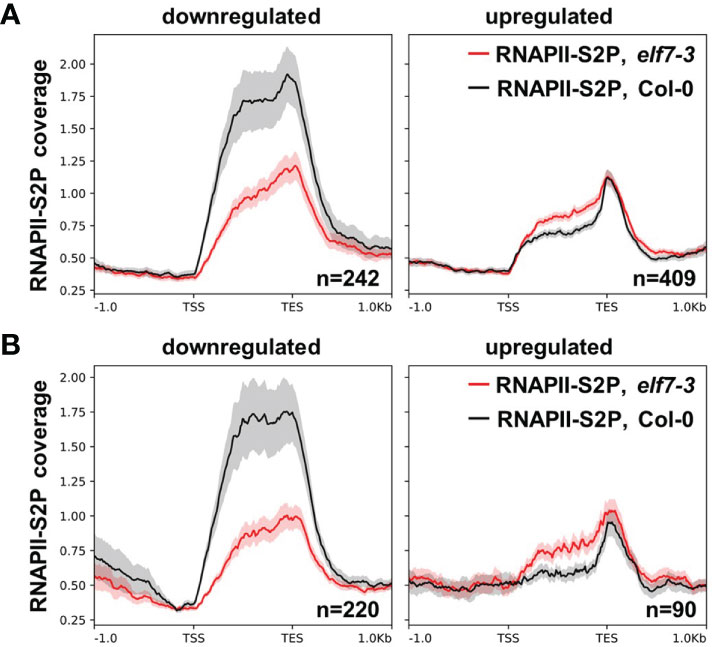
Figure 7 RNAPII coverage over genes up- and downregulated in elf7-3. Metagene plots of ChIP-seq analysis of Col-0 and elf7-3 using an antibody directed against RNAPII-S2P over DEGs elf7-3/Col-0 under standard condtions (A) or upon exposure to NaCl (B). Mean signals of the three biological replicates were averaged (line) and the shaded area represents the SEM for the three replicates at each position. The tracks were scaled over transcribed regions from transcriptional start site (TSS) to transcriptional end site (TES).
Discussion
PAF1C travels with RNAPII to regulate transcript elongation and to modulate chromatin structure of transcribed regions (Jaehning, 2010; Francette et al., 2021). In plants, so far mainly the role of PAF1C in developmental processes was studied (He et al., 2004; Oh et al., 2004; Park et al., 2010; Yu and Michaels, 2010; Fal et al., 2017). In few cases the observed mutant phenotype(s) could be correlated with misexpressed target genes, such as the above-mentioned link between FLC expression and time of flowering (Zhang et al., 2003; He et al., 2004; Oh et al., 2004; Xu et al., 2008; Park et al., 2010). Generally, Arabidopsis mutants deficient in various TEFs (e.g. Elongator, SPT4-SPT5, TFIIS) exhibit differential expression of only subsets of genes (Nelissen et al., 2005; Grasser et al., 2009; Dürr et al., 2014). Likewise, relative to wild type under normal growth conditions, based on microarray hybridization experiments (Park et al., 2010) or RNA-seq of total mRNA (Nasim et al., 2022), several hundreds of DEGs were observed for mutants deficient in PAF1C subunits, except for cdc73, whose transcriptome was similar to that of wildtype. Consistently, using high-throughput sequencing of nuclear mRNAs, we identified 12 and 722 DEGs in cdc73-2 and elf7-3, respectively. Although it is difficult to directly compare transcriptomics datasets obtained with different techniques and analyzed using distinct statistical methods, the results in general support the emerging view that in plants TEFs are required for the correct transcription of only subsets of genes (van Lijsebettens and Grasser, 2014).
Recently, PAF1C (i.e. VIP3, VIP5, VIP6) was also identified as a critical factor in the plant response to repeated mechanic stimulation (Jensen et al., 2017) and in temperature-responsive flowering (Nasim et al., 2022). We have comparatively exposed different PAF1C subunit mutants to elevated concentrations of NaCl to provoke transcriptional response. In presence of NaCl, elf7 and elf8 displayed more severe decrease in growth of the aerial parts than Col-0, whereas the rosette size of cdc73 rather exceeded that of Col-0. Growth of the primary root upon NaCl exposure was similarly decreased in Col-0 and cdc73-1/cdc73-2, whereas root growth of elf7-2/elf7-3 and elf8-1/elf8-4 was considerably more strongly reduced. Recently, it was reported – based on a similar, albeit not identical experimental setup – that the root growth of elf7-3 in presence of 100 mM NaCl was comparable to that of Col-0 (Li et al., 2019). In view of that we accurately measured the relative root growth of both elf7 alleles in presence of NaCl relative to their growth on control medium, taking into consideration the distinct growth of the mutants compared to Col-0 in absence of NaCl. Thereby, compared to the other genotypes we determined significantly decreased root growth of elf7-2 and elf7-3 (and elf8-1/elf8-4) in presence of NaCl.
To record rather early transcriptional responses, we profiled the transcriptomes of elf7-3 and cdc73-2 in comparison to Col-0 after 3h of NaCl exposure, analyzing nuclear mRNAs including nascent transcripts. Col-0 and to a slightly lesser extent cdc73-2 exhibited clear transcriptomic changes upon NaCl exposure, whereas elf7-3 showed a comparatively clearly decreased response to this stress condition (Figure 3) that is also reflected by an altered RNAPII coverage in elf7-3 (Figure 7). A major part of the genes differentially expressed in Col-0 upon NaCl exposure were also differentially expressed in cdc73-2, illustrating that both genotypes respond similarly to the presence of NaCl. With elf7-3 plants, the presence of NaCl resulted in distinctly lower transcriptional response, indicating that ELF7 plays an important role in the response to elevated NaCl concentrations. In agreement with our findings, a recent study concluded that Col-0 and cdc73 Arabidopsis plants grown at 23°C have a similar transcriptome, and that elf7 and vip3/4/5/6 share a large number of DEGs (Nasim et al., 2022). In yeast as well as in mammals, PAF1C subunit mutants are also associated with a range of phenotypes suggesting (partial) subunit specificity (Betz et al., 2002; Akanuma et al., 2007; Chu et al., 2007; Cheung et al., 2008; Wang et al., 2008). Furthermore, yeast PAF1C subunit mutants exhibit various defects in the tolerance to environmental stress conditions (Shi et al., 1996; Betz et al., 2002; García et al., 2016). Particularly, inactivation of PAF1 and CTR9 result in severe mutant phenotypes in accord with their central structural role within PAF1C (Kim et al., 2010; Chu et al., 2013; Vos et al., 2020). Moreover, the different PAF1C subunits are involved to a variable extent in modulating the genomic distribution of a range of histone marks including H2B mono-ubiquitination and various transcription-related H3 methylations (Jaehning, 2010; Francette et al., 2021).
Analysis of the genes that are differentially expressed upon exposure of Arabidopsis plants to NaCl demonstrated that a greater part of the DEGs is comparably regulated in Col-0 and cdc73-2, illustrating that a similar transcriptional response occurs in both genotypes. In contrast, a comparatively lower transcriptional response can be observed with elf7-3, suggesting that ELF7 is crucial for this type of stress response, and accordingly elf7-3 (and elf7-2) plants are rather susceptible to NaCl. At the same time the above-mentioned finding that the expression of salt-responsive genes is altered in elf7-3 plants under control conditions, may influence the adaptability of these plants upon exposure to NaCl, although the mechanism, how the lack of ELF7 influences gene expression under these conditions remains unknown. Interestingly, the tolerance to NaCl of cdc73-2 plants is even more pronounced than that of Col-0. Elevated expression of gene(s) that enhance the tolerance to NaCl such as the ICL gene (Yuenyong et al., 2019) could contribute to the improved performance of cdc73 plants under conditions of increased salt concentrations. The ICL transcript is not regulated by the presence of NaCl, but there are significantly elevated levels of the transcript in cdc73-2 relative to Col-0 and elf7-3 (Figure 5C) that may augment the resistance of cdc73-2 to NaCl. However, several non-overlapping DEGs in cdc73-2 represent salt-responsive genes (Supplementary Figure S11) that may also contribute to the salt tolerance of cdc73-2. Examination of DEGs that are specifically regulated in Col-0 or cdc73-2 revealed a greater average length of the transcripts down-regulated in cdc73-2 compared to Col-0. In line with that the genes down-regulated in cdc73-2 contain a greater number of exons. Our comparative analysis of alternative splicing events in Col-0 and cdc73-2 revealed only few events, but we consider this outcome rather inconclusive. Together these findings suggest that in the absence of CDC73 the processivity of RNAPII is decreased, which is particularly relevant for the transcription of longer genes. In line with that, depletion of PAF1C in mouse cells results in decreased RNAPII processivity and reduced elongation rate (Hou et al., 2019). In conclusion, our study demonstrates that the Arabidopsis PAF1C subunit mutants deficient in ELF7 and CDC73 respond very distinctly to NaCl, which is reflected by the different transcriptional response. Plants lacking CDC73 transcriptionally respond to NaCl similar to Col-0, but still – likely because of altered expression of certain gene(s) – exhibit increased tolerance to NaCl. In contrast, the transcriptional response of plants lacking ELF7 is decreased and consequently the plants are markedly sensitive to NaCl exposure. Therefore, our analyses provide evidence for PAF1C subunit specificity in plant response to environmental conditions.
Data availability statement
The data presented in the study are deposited in the Sequence Read Archive (SRA) repository, accession number PRJNA816434 (https://www.ncbi.nlm.nih.gov/bioproject/PRJNA8164).
Author contributions
SO, RS, and TS performed the experimental procedures; SO, RS, US, and CM analyzed the next-generation sequencing data; SO, CM, and KDG designed the research; KDG wrote the manuscript and all authors approved the submitted version. All authors contributed to the article and approved the submitted version.
Funding
This research was supported by the German Research Foundation (DFG) through grants Gr1159/14-2 and SFB960/A6 to KDG.
Acknowledgments
We thank Mathias Gradl for contributions to the project and the Nottingham Arabidopsis Stock Centre (NASC) for providing Arabidopsis T-DNA insertion lines.
Conflict of interest
The authors declare that the research was conducted in the absence of any commercial or financial relationships that could be construed as a potential conflict of interest.
The reviewer IL declared a past co-authorship with one of the authors KDG to the handling editor.
Publisher’s note
All claims expressed in this article are solely those of the authors and do not necessarily represent those of their affiliated organizations, or those of the publisher, the editors and the reviewers. Any product that may be evaluated in this article, or claim that may be made by its manufacturer, is not guaranteed or endorsed by the publisher.
Supplementary material
The Supplementary Material for this article can be found online at: https://www.frontiersin.org/articles/10.3389/fpls.2022.974625/full#supplementary-material
References
Abdullah, H. M., Rodriguez, J., Salacup, J. M., Castañeda, I. S., Schnell, D. J., Pareek, A., et al. (2021). Increased cuticle waxes by overexpression of WSD1 improves osmotic stress tolerance in arabidopsis thaliana and camelina sativa. Int.J.Mol.Sci. 22, 5173. doi: 10.3390/ijms22105173
Ahmed, M., Kim, D. R. (2018). Pcr: an r package for quality assessment, analysis and testing of qPCR data. PeerJ. 6, e4473. doi: 10.7717/peerj.4473
Akanuma, T., Koshida, S., Kawamura, A., Kishimoto, Y., Takada, S. (2007). Paf1 complex homologues are required for notch-regulated transcription during somite segmentation. EMBO Rep. 8, 858–863. doi: 10.1038/sj.embor.7401045
Anders, S., Reyes, A., Huber, W. (2012). Detecting differential usage of exons from RNA-seq data. Genome Res. 22, 2008–2017. doi: 10.1101/gr.133744.111
Antosz, W., Deforges, J., Begcy, K., Bruckmann, A., Poirier, Y., Dresselhaus, T., et al. (2020). Critical role of transcript cleavage in arabidopsis RNA polymerase II transcriptional elongation. Plant Cell 32, 1449–1463. doi: 10.1105/tpc.19.00891
Antosz, W., Pfab, A., Ehrnsberger, H. F., Holzinger, P., Köllen, K., Mortensen, S. A., et al. (2017). The composition of the arabidopsis RNA polymerase II transcript elongation complex reveals the interplay between elongation and mRNA processing factors. Plant Cell 29, 854–870. doi: 10.1105/tpc.16.00735
Betz, J. L., Chang, M., Washburn, T. M., Porter, S. E., Mueller, C. L., Jaehning, J. A. (2002). Phenotypic analysis of Paf1/RNA polymerase II complex mutations reveals connections to cell cycle regulation, protein synthesis, and lipid and nucleic acid metabolism. Mol. Genet. Genomics 268, 272–285. doi: 10.1007/s00438-002-0752-8
Bolger, A. M., Lohse, M., Usadel, B. (2014). Trimmomatic:a flexible trimmer for illumina sequence data. Bioinformatics 30, 2114–2120. doi: 10.1093/bioinformatics/btu170
Chen, F. X., Smith, E. R., Shilatifard, A. (2018). Born to run: control of transcription elongation by RNA polymerase II. Nat. Rev. Mol. Cell Biol. 19, 464–478. doi: 10.1038/s41580-018-0010-5
Cheung, V., Chua, G., Batada, N. N., Landry, C. R., Michnick, S. W., Hughes, T. R., et al. (2008). Chromatin- and transcription-related factors repress transcription from within coding regions throughout the saccharomyces cerevisiae genome. PLoS Biol. 6, e277. doi: 10.1371/journal.pbio.0060277
Chu, X., Qin, X., Xu, H., Li, L., Wang, Z., Li, F., et al. (2013). Structural insights into Paf1 complex assembly and histone binding. Nucleic Acids Res. 41, 10619–10629. doi: 10.1093/nar/gkt819
Chu, Y., Simic, R., Warner, M. H., Arndt, K. M., Prelich, G. (2007). Regulation of histone modification and cryptic transcription by the Bur1 and Paf1 complexes. EMBO J. 26, 4646–4656. doi: 10.1038/sj.emboj.7601887
Danecek, P., Bonfield, J. K., Liddle, J., Marshall, J., Ohan, V., Pollard, M. O., et al. (2021). Twelve years of SAMtools and BCFtools. Gigascience 10, giab008. doi: 10.1093/gigascience/giab008
Dhaliwal, N. K., Mitchell, J. A. (2016). Nuclear RNA isolation and sequencing. Methods Mol. Biol. 1402, 63–71. doi: 10.1007/978-1-4939-3378-5_7
Dhar, N., Caruana, J., Erdem, I., Raina, R. (2020). An arabidopsis DISEASE RELATED NONSPECIFIC LIPID TRANSFER PROTEIN 1 is required for resistance against various phytopathogens and tolerance to salt stress. Gene 753, 144802. doi: 10.1016/j.gene.2020.144802
Dürr, J., Lolas, I. B., Sørensen, B. B., Schubert, V., Houben, A., Melzer, M., et al. (2014). The transcript elongation factor SPT4/SPT5 is involved in auxin-related gene expression in arabidopsis. Nucleic Acids Res. 42, 4332–4347. doi: 10.1093/nar/gku096
Ewels, P., Magnusson, M., Lundin, S., Käller, M. (2016). MultiQC: summarize analysis results for multiple tools and samples in a single report. Bioinformatics 32, 3047–3048. doi: 10.1093/bioinformatics/btw354
Fal, K., Liu, M., Duisembekova, A., Refahi, Y., Haswell, E. S., Hamant, O. (2017). Phyllotactic regularity requires the Paf1 complex in arabidopsis. Development 144, 4428–4436. doi: 10.1242/dev.154369
Francette, A. M., Tripplehorn, S. A., Arndt, K. M. (2021). The Paf1 complex: A keystone of nuclear regulation operating at the interface of transcription and chromatin. J. Mol. Biol. 433, 166979. doi: 10.1016/j.jmb.2021.166979
García, P., Del Encinar Dedo, J., Ayté, J., Hidalgo, E. (2016). Genome-wide screening of regulators of catalase expression: Role of a transcription complex and histone and tRNA modification complexes on adaptation to stress. J. Biol. Chem. 291, 790–799. doi: 10.1074/jbc.M115.696658
Golldack, D., Li, C., Mohan, H., Probst, N. (2014). Tolerance to drought and salt stress in plants: Unraveling the signaling networks. Front. Plant Sci. 5. doi: 10.3389/fpls.2014.00151
Grasser, M., Kane, C. M., Merkle, T., Melzer, M., Emmersen, J., Grasser, K. D. (2009). Transcript elongation factor TFIIS is involved in arabidopsis seed dormancy. J. Mol. Biol. 386, 598–611. doi: 10.1016/j.jmb.2008.12.066
He, Y., Doyle, M. R., Amasino, R. M. (2004). PAF1-complex-mediated histone methylation of FLOWERING LOCUS c chromatin is required for the vernalization-responsive, winter-annual habit in arabidopsis. Genes Dev. 18, 2774–2784. doi: 10.1101/gad.1244504
Hou, L., Wang, Y., Liu, Y., Zhang, N., Shamovsky, I., Nudler, E., et al. (2019). Paf1C regulates RNA polymerase II progression by modulating elongation rate. Proc. Natl. Acad. Sci. U.S.A. 116, 14583–14592. doi: 10.1073/pnas.1904324116
Jaehning, J. A. (2010). The Paf1 complex: platform or player in RNA polymerase II transcription? Biochim. Biophys. Acta 1799, 279–388. doi: 10.1016/j.bbagrm.2010.01.001
Jensen, G. S., Fal, K., Hamant, O., Haswell, E. S. (2017). The RNA polymerase-associated factor 1 complex is required for plant touch responses. J. Exp. Bot. 68, 499–511. doi: 10.1093/jxb/erw439
Kilian, J., Whitehead, D., Horak, J., Wanke, D., Weinl, S., Batistic, O., et al. (2007). The AtGenExpress global stress expression data set: Protocols, evaluation and model data analysis of UV-b light, drought and cold stress responses. Plant J. 50, 347–363. doi: 10.1111/j.1365-313X.2007.03052.x
Kim, J.-H. (2021). Multifaceted chromatin structure and transcription changes in plant stress response. Int.J.Mol.Sci. 22, 2013. doi: 10.3390/ijms22042013
Kim, J., Guermah, M., Roeder, R. G. (2010). The human PAF1 complex acts in chromatin transcription elongation both independently and cooperatively with SII/TFIIS. Cell 140, 491–503. doi: 10.1016/j.cell.2009.12.050
Kleinboelting, N., Huep, G., Kloetgen, A., Viehoever, P., Weisshaar, B. (2012). GABI-kat SimpleSearch: New features of the arabidopsis thaliana T-DNA mutant database. Nucleic Acids Res. 40, D1211–D1215. doi: 10.1093/nar/gkr1047
Krogan, N. J., Dover, J., Wood, A., Schneider, J., Heidt, J., Boateng, M. A., et al. (2003). The Paf1 complex is required for histone H3 methylation by COMPASS and Dot1p: Linking transcriptional elongation to histone methylation. Mol. Cell 11, 721–729. doi: 10.1016/s1097-2765(03)00091-1
Kwak, H., Lis, J. T. (2013). Control of transcriptional elongation. Ann. Rev. Genet. 47, 483–508. doi: 10.1146/annurev-genet-110711-155440
Lamesch, P., Berardini, T. Z., Li, D., Swarbreck, D., Wilks, C., Sasidharan, R., et al. (2012). The arabidopsis information resource (TAIR): Improved gene annotation and new tools. Nucleic Acids Res. 40, D1202–D1210. doi: 10.1093/nar/gkr1090
Langmead, B., Salzberg, S. L. (2012). Fast gapped-read alignment with bowtie 2. Nat. Meth. 9, 357–359. doi: 10.1038/nmeth.1923
Liao, Y., Smyth, G. K., Shi, W. (2019). The r package rsubread is easier, faster, cheaper and better for alignment and quantification of RNA sequencing reads. Nucleic Acids Res. 47, e47. doi: 10.1093/nar/gkz114
Li, Y., Yang, J., Shang, X., Lv, W., Xia, C., Wang, C., et al. (2019). SKIP regulates environmental fitness and floral transition by forming two distinct complexes in arabidopsis. New Phytol. 224, 321–335. doi: 10.1111/nph.15990
Love, M. L., Huber, W., Anders, S. (2014). Moderated estimation of fold change and dispersion for RNA-seq data with DESeq2. Genome Biol. 15, 550. doi: 10.1186/s13059-014-0550-8
Mangiola, S., Molania, R., Dong, R., Doyle, M. A., Papenfuss, A. T. (2021). Tidybulk: an r tidy framework for modular transcriptomic data analysis. Genome Biol. 22, 42. doi: 10.1186/s13059-020-02233-7
Michl-Holzinger, P., Obermeyer, S., Markusch, H., Pfab, A., Ettner, A., Bruckmann, A., et al. (2022). Phosphorylation of the FACT histone chaperone subunit SPT16 affects chromatin at RNA polymerase II transcriptional start sites in arabidopsis. Nucleic Acids Res. 50, 5014–5028. doi: 10.1093/nar/gkac293
Mueller, C. L., Jaehning, J. A. (2002). Ctr9, Rtf1, and Leo1 are components of the Paf1/RNA polymerase II complex. Mol.Cell.Biol. 22, 1971–1980. doi: 10.1128/MCB.22.7.1971-1980.2002
Murashige, T., Skoog, F. (1962). A revised medium for rapid growth and bioassay with tobacco tissue cultures. Physiol.Plant. 15, 473–497. doi: 10.1111/j.1399-3054.1962.tb08052.x
Nasim, Z., Susila, H., Jin, S., Youn, G., Ahn, J. H. (2022). Polymerase II-associated factor 1 complex-regulated FLOWERING LOCUS c-clade genes repress flowering in response to chilling. Front. Plant Sci. 13. doi: 10.3389/fpls.2022.817356
Nelissen, H., Fleury, D., Bruno, L., Robles, P., de Veylder, L., Traas, J., et al. (2005). The elongata mutants identify a functional elongator complex in plants with a role in cell proliferation during organ growth. Proc. Natl. Acad. Sci. U.S.A. 102, 7754–7759. doi: 10.1073/pnas.0502600102
Ng, H. H., Robert, F., Young, R. A., Struhl, K. (2003). Targeted recruitment of Set1 histone methylase by elongating pol II provides a localized mark and memory of recent transcriptional activity. Mol. Cell 11, 709–719. doi: 10.1016/s1097-2765(03)00092-3
Oh, S., Park, S., van Nocker, S. (2008). Genic and global functions for Paf1C in chromatin modification and gene expression in arabidopsis. PLoS Genet. 4, e1000077. doi: 10.1371/journal.pgen.1000077
Oh, S., Zhang, H., Ludwig, P., van Nocker, S. (2004). A mechanism related to the yeast transcriptional regulator Paf1c is required for expression of the arabidopsis FLC/MAF MADS box gene family. Plant Cell 16, 2940–2953. doi: 10.1105/tpc.104.026062
Park, S., Oh, S., Ek-Ramos, J., van Nocker, S. (2010). PLANT HOMOLOGOUS TO PARAFIBROMIN is a component of the PAF1 complex and assists in regulating expression of genes within H3K27ME3-enriched chromatin. Plant Physiol. 153, 821–831. doi: 10.1104/pp.110.155838
Pfab, A., Antosz, W., Holzinger, P., Bruckmann, A., Griesenbeck, J., Grasser, K. D. (2017). Analysis of in vivo chromatin and protein interactions of arabidopsis transcript elongation factors. Methods Mol. Biol. 1629, 105–122. doi: 10.1007/978-1-4939-7125-1_8
Pfab, A., Grønlund, J. T., Holzinger, P., Längst, G., Grasser, K. D. (2018). The arabidopsis histone chaperone FACT: Role of the HMG-box domain of SSRP1. J. Mol. Biol. 430, 2747–2759. doi: 10.1016/j.jmb.2018.06.046
Pfaff, C., Ehrnsberger, H. F., Flores-Tornero, M., Sørensen, B. B., Schubert, T., Längst, G., et al. (2018). ALY RNA-binding proteins are required for nucleocytosolic mRNA transport and modulate plant growth and development. Plant Physiol. 177, 226–240. doi: 10.1104/pp.18.00173
Quadrana, L., Bortolini Silveira, A., Mayhew, G. F., LeBlanc, C., Martienssen, R. A., Jeddeloh, J. A., et al. (2016). The arabidopsis thaliana mobilome and its impact at the species level. Elife 5, e15716. doi: 10.7554/eLife.15716
Ramírez, F., Ryan, D. P., Grüning, B., Bhardwaj, V., Kilpert, F., Richter, A. S., et al. (2016). deepTools2: a next generation web server for deep-sequencing data analysis. Nucleic Acids Res. 44, W160–W165. doi: 10.1093/nar/gkw257
Reyes, A., Anders, S., Weatheritt, R. J., Gibson, T. J., Steinmetz, L. M., Huber, W. (2013). Drift and conservation of differential exon usage across tissues in primate species. Proc. Natl. Acad. Sci. U.S.A. 110, 15377–15382. doi: 10.1073/pnas.1307202110
Rondón, A. G., Gallardo, M., García-Rubio, M., Aguilera, A. (2004). Molecular evidence indicating that the yeast PAF complex is required for transcription elongation. EMBO Rep. 5, 47–53. doi: 10.1038/sj.embor.7400045
Shi, X., Finkelstein, A., Wolf, A. J., Wade, P. A., Burton, Z. F., Jaehning, J. A. (1996). Paf1p, an RNA polymerase II-associated factor in saccharomyces cerevisiae, may have both positive and negative roles in transcription. Mol.Cell.Biol. 16, 669–676. doi: 10.1128/MCB.16.2.669
Sims, R. J., Belotserkovskaya, R., Reinberg, D. (2004). Elongation by RNA polymerase II: the short and long of it. Genes Dev. 18, 2437–2468. doi: 10.1101/gad.1235904
Smith, T., Heger, A., Sudbery, I. (2017). UMI-tools: modeling sequencing errors in unique molecular identifiers to improve quantification accuracy. Genome Res. 27, 491–499. doi: 10.1101/gr.209601.116
van Lijsebettens, M., Grasser, K. D. (2014). Transcript elongation factors: shaping transcriptomes after transcript initiation. Trends Plant Sci. 19, 717–726. doi: 10.1016/j.tplants.2014.07.002
Vos, S. M., Farnung, L., Boehning, M., Wigge, C., Linden, A., Urlaub, H., et al. (2018). Structure of activated transcription complex pol II-DSIF-PAF-SPT6. Nature 560, 607–612. doi: 10.1038/s41586-018-0440-4
Vos, S. M., Farnung, L., Linden, A., Urlaub, H., Cramer, P. (2020). Structure of complete pol II-DSIF-PAF-SPT6 transcription complex reveals RTF1 allosteric activation. Nat. Struct. Mol. Biol. 27, 668–677. doi: 10.1038/s41594-020-0437-1
Wade, P. A., Werel, W., Fentzke, R. C., Thompson, N. E., Leykam, J. F., Burgess, R. R., et al. (1996). A novel collection of accessory factors associated with yeast RNA polymerase II. Protein Expr. Purif. 8, 85–90. doi: 10.1006/prep.1996.0077
Wang, P., Bowl, M. R., Bender, S., Peng, J., Farber, L., Chen, J., et al. (2008). Parafibromin, a component of the human PAF complex, regulates growth factors and is required for embryonic development and survival in adult mice. Mol.Cell.Biol. 28, 2930–2940. doi: 10.1128/MCB.00654-07
Winter, D., Vinegar, B., Nahal, H., Ammar, R., Wilson, G. V., Provart, N. J. (2007). An "Electronic fluorescent pictograph" browser for exploring and analyzing large-scale biological data sets. PLoS One 2, e718. doi: 10.1371/journal.pone.0000718
Wood, A., Schneider, J., Dover, J., Johnston, M., Shilatifard, A. (2003). The Paf1 complex is essential for histone monoubiquitination by the Rad6-Bre1 complex, which signals for histone methylation by COMPASS and Dot1p. J. Biol. Chem. 278, 34739–34742. doi: 10.1074/jbc.C300269200
Xiao, T., Kao, C.-F., Krogan, N. J., Sun, Z.-W., Greenblatt, J. F., Osley, M. A., et al. (2005). Histone H2B ubiquitylation is associated with elongating RNA polymerase II. Mol.Cell.Biol. 25, 637–651. doi: 10.1128/MCB.25.2.637-651.2005
Xu, L., Zhao, Z., Dong, A., Soubigou-Taconnat, L., Renou, J. P., Steinmetz, A., et al. (2008). Di- and tri- but not monomethylation on histone H3 lysine 36 marks active transcription of genes involved in flowering time regulation and other processes in arabidopsis thaliana. Mol.Cell.Biol. 28, 1348–1360. doi: 10.1128/MCB.01607-07
Yang, Y., Guo, Y. (2018). Unraveling salt stress signaling in plants. J.Integr.Plant Biol. 60, 796–804. doi: 10.1111/jipb.12689
Yuenyong, W., Sirikantaramas, S., Qu, L.-J., Buaboocha, T. (2019). Isocitrate lyase plays important roles in plant salt tolerance. BMC Plant Biol. 19, 472. doi: 10.1186/s12870-019-2086-2
Yu, X., Michaels, S. D. (2010). The arabidopsis Paf1c complex component CDC73 participates in the modification of FLOWERING LOCUS c chromatin. Plant Physiol. 153, 1074–1084. doi: 10.1104/pp.110.158386
Zaghlool, A., Ameur, A., Nyberg, L., Halvardson, J., Grabherr, M., Cavelier, L., et al. (2013). Efficient cellular fractionation improves RNA sequencing analysis of mature and nascent transcripts from human tissues. BMC Biotechnol. 13, 99. doi: 10.1186/1472-6750-13-99
Zhang, H., Ransom, C., Ludwig, P., van Nocker, S. (2003). Genetic analysis of early flowering mutants in arabidopsis defines a class of pleiotropic developmental regulator required for expression of the flowering-time switch flowering locus c. Genetics 164, 347–358. doi: 10.1093/genetics/164.1.347
Keywords: Arabidopsis thaliana, chromatin, histone modifications, PAF1C, RNA polymerase II, transcript elongation
Citation: Obermeyer S, Stöckl R, Schnekenburger T, Moehle C, Schwartz U and Grasser KD (2022) Distinct role of subunits of the Arabidopsis RNA polymerase II elongation factor PAF1C in transcriptional reprogramming. Front. Plant Sci. 13:974625. doi: 10.3389/fpls.2022.974625
Received: 21 June 2022; Accepted: 05 September 2022;
Published: 29 September 2022.
Edited by:
Sara Farrona, National University of Ireland Galway, IrelandReviewed by:
Rafal Archacki, University of Warsaw, PolandInna Lermontova, Leibniz Institute of Plant Genetics and Crop Plant Research (IPK), Germany
Copyright © 2022 Obermeyer, Stöckl, Schnekenburger, Moehle, Schwartz and Grasser. This is an open-access article distributed under the terms of the Creative Commons Attribution License (CC BY). The use, distribution or reproduction in other forums is permitted, provided the original author(s) and the copyright owner(s) are credited and that the original publication in this journal is cited, in accordance with accepted academic practice. No use, distribution or reproduction is permitted which does not comply with these terms.
*Correspondence: Klaus D. Grasser, Klaus.Grasser@ur.de