 Gulbar Yisilam
 Chen-Xi Wang3
 Hans Peter Comes
 Pan Li
 Xin-Min Tian
- 1Xinjiang Key Laboratory of Biological Resources and Genetic Engineering, College of Life Science and Technology, Xinjiang University, Urumqi, China
- 2Xinjiang Key Laboratory of Special Species Conservation and Regulatory Biology, Key Laboratory of Plant Stress Biology in Arid Land, College of Life Science, Xinjiang Normal University, Urumqi, China
- 3Laboratory of Systematic & Evolutionary Botany and Biodiversity, College of Life Sciences, Zhejiang University, Hangzhou, China
- 4Department of Environment and Biodiversity, University of Salzburg, Salzburg, Austria
Climactic oscillations during the Quaternary played a significant role in the formation of genetic diversity and historical demography of numerous plant species in northwestern China. In this study, we used 11 simple sequence repeats derived from expressed sequence tag (EST-SSR), two chloroplast DNA (cpDNA) fragments, and ecological niche modeling (ENM) to investigate the population structure and the phylogeographic history of Lycium ruthenicum, a plant species adapted to the climate in northwestern China. We identified 20 chloroplast haplotypes of which two were dominant and widely distributed in almost all populations. The species has high haplotype diversity and low nucleotide diversity based on the cpDNA data. The EST-SSR results showed a high percentage of total genetic variation within populations. Both the cpDNA and EST-SSR results indicated no significant differentiation among populations. By combining the evidence from ENM and demographic analysis, we confirmed that both the last interglacial (LIG) and late-glacial maximum (LGM) climatic fluctuations, aridification might have substantially narrowed the distribution range of this desert species, the southern parts of the Junggar Basin, the Tarim Basin, and the eastern Pamir Plateau were the potential glacial refugia for L. ruthenicum during the late middle Pleistocene to late Pleistocene Period. During the early Holocene, the warm, and humid climate promoted its demographic expansion in northwestern China. This work may provide new insights into the mechanism of formation of plant diversity in this arid region.
Introduction
Global climate has fluctuated greatly during the Quaternary Period, leading to the alternation of glacial and interglacial periods (Hewitt, 2000, 2004). During glacial periods, cold, arid climates caused large-scale species extinction or migration to refugial locations. During interglacial periods, however, warm, moist climates promoted the rapid range expansion and recolonization of species (Hewitt, 1996; Muellner-Riehl, 2019). An inescapable consequence of these climatic oscillations for most species is great changes in their geographical distribution (Hewitt, 2000). Several phylogeographical studies have indicated that Quaternary climatic oscillations resulted in the expansions and intraspecific divergences in most plant species in China (Qiu et al., 2011; Liu et al., 2012a) such as Picea crassifolia (Meng et al., 2007), Allium przewalskianum (Wu et al., 2010), Pteroceltis tatarinowii (Li et al., 2012).
In the past, most plant phylogeographical studies in China have focused on the Hengduan Mountains and adjacent regions, in the southeast of the Qinghai-Tibetan Plateau (QTP; Meng et al., 2007; Cun and Wang, 2010). This area is referred to as the core of the greatest concentrations of biodiversity in the world (Myers et al., 2000). In recent years, several studies paid attention to the phylogeographic patterns and demographical history of desert plants near the northern edge of the QTP in the arid northwestern area of China. However, few studies have been undertaken concerning the roles of the Quaternary geology and the climatic oscillations in driving the population evolutionary history of plant species in arid northwestern China (Meng et al., 2015).
Ice sheets did not cover northwestern China, and the evolution of desert plant species, such as Caragana (Zhang and Fritsch, 2010), Nitraria sphaerocarpa (Su and Zhang, 2013), Ribes meyeri (Xie and Zhang, 2013) and Aconitum nemorum (Jiang et al., 2014), have been impacted by significant climatic oscillations (Li, 1998; Meng et al., 2015). Previous phylogeographical studies showed that the uplift of the QTP since the Cenozoic is one of the most important geological events, which has changed the global climate and intensified the aridification of northwestern China (Liu et al., 2014a, 2019). During the Pleistocene (ca. after 2.6 million years ago: Mya), continuous uplift of the QTP, the Tianshan, and the Himalayas coupled with weakening of the southwest monsoon and intensification of the plateau winter monsoon caused extreme drought and low temperatures (Willis and Niklas, 2004; Meng and Zhang, 2013; Liu et al., 2014a). Intensification of the East Asian winter monsoon intensified aridification and thus profoundly changed the hydrology and climate of this area (An et al., 2001; Guo et al., 2002; Miao et al., 2012). Hence, it notably led to accelerating the range expansion of the deserts such as the Gurbantunggut Desert of the Junggar Basin, Taklamakan Desert of the Tarim Basin, and Badain Jaran–Tengger desert to the north of the Hexi Corridor (Meng and Zhang, 2013; Yin et al., 2015). Climatic fluctuations, aridification, and desert expansion that developed in the Quaternary appear to have played a significant role in determining the phylogeographic patterns and demographical history of numerous desert plants species in these areas (Chen et al., 2008a; Su et al., 2016; Wang et al., 2016a; Zhao et al., 2019; Zhang et al., 2020). For example, the divergence of Larix sibirica at approximately 1.6 mya in the Altai Mountains and the eastern Tianshan correlates to enhanced aridity in the Asian interior and the desert expansion in the Junggar Basin during the early Pleistocene (Zhang et al., 2014). Additionally, during the glacial periods, many species in these arid regions have retreated to refugial locations such as the southwestern margin of Junggar Basin, the Tarim Basin, and the Tianshan Mountains. These basins and mountains provided suitable living environments for desert plants such as Libanotis buchtormensis (Wang et al., 2016a), and Atraphaxis frutescens (Xu and Zhang, 2015).
Lycium ruthenicum Murr. (Solanaceae) is diploid, monoecious, and cross-pollinated and its root propagates via clones (Chen et al., 2008b; Kuang and Lu, 2011; Dai et al., 2013). It is widely distributed in the saline deserts, sands, and roadsides of northwestern China (Zheng et al., 2011; Zhao et al., 2021). Lycium ruthenicum produces relatively small, fleshy blackish fruits and its seeds are dispersed by wind, birds and rodents (Hitchcock, 1932; Alitong et al., 2013; Levin and Miller, 2021). Lycium ruthenicum berries have anti-cancer, anti-inflammatory, antioxidant, radioprotective, anti-aging, anti-fatigue, cardioprotective, neuroprotective, hepatoprotective, and hypolipidemic efficacy (Hu et al., 2014; Liu et al., 2014b; Duan et al., 2015; Tian et al., 2021; Wang et al., 2021). It has been overexploited and its wild resources are being destroyed. For these reasons, L. ruthenicum is now on the list of National Key Protected Wild Plants in China.1 This salt- and drought-tolerant shrub has high medicinal value and confers environmental protection in the arid western region of China (Lei et al., 2021). Thus, its distribution and biological characteristics make it an ideal candidate for phylogeographical studies. Studies on the genetics and conservation of L. ruthenicum have already been conducted (Liu et al., 2012b; Chen et al., 2014, 2017). Nevertheless, these prior works only used relatively less representative sequence-related amplified polymorphism (SRAP) markers, cpDNA and small sample sizes that did not suffice to elucidate the phylogeography of L. ruthenicum across its entire distribution range.
The aim of this study was to clarify the phylogeography of the taxa by determining how the distribution of L. ruthenicum changed during the Quaternary period. To this end, we used ecological niche modeling (ENM) and phylogeographical analyses based on the simple sequence repeats (SSRs) derived from expressed sequence tag (EST-SSR) and chloroplast DNA (cpDNA) fragments (rps16–trnK and trnH–psbA). We investigated the genetic diversity patterns of L. ruthenicum in northwestern China, established its historical population demography in response to climatic oscillations, and provided critical genetic information required to conserve it. The present work will serve as an empirical model for the study of desert plant phylogeography in northwestern China.
Materials and Methods
Population Sampling
Fresh, healthy leaves of 563 individuals, from 50 populations of L. ruthenicum in Xinjiang, Qinghai, Gansu, and Inner Mongolia, China, were collected and dried with silica gel (Table 1; Supplementary Table S1). Voucher specimens were deposited at the Herbarium of Xinjiang Normal University (XJNU). As this species can propagate by clonal growth, individuals >50 m apart were collected to avoid inadvertently harvesting clones (Wang et al., 2019).
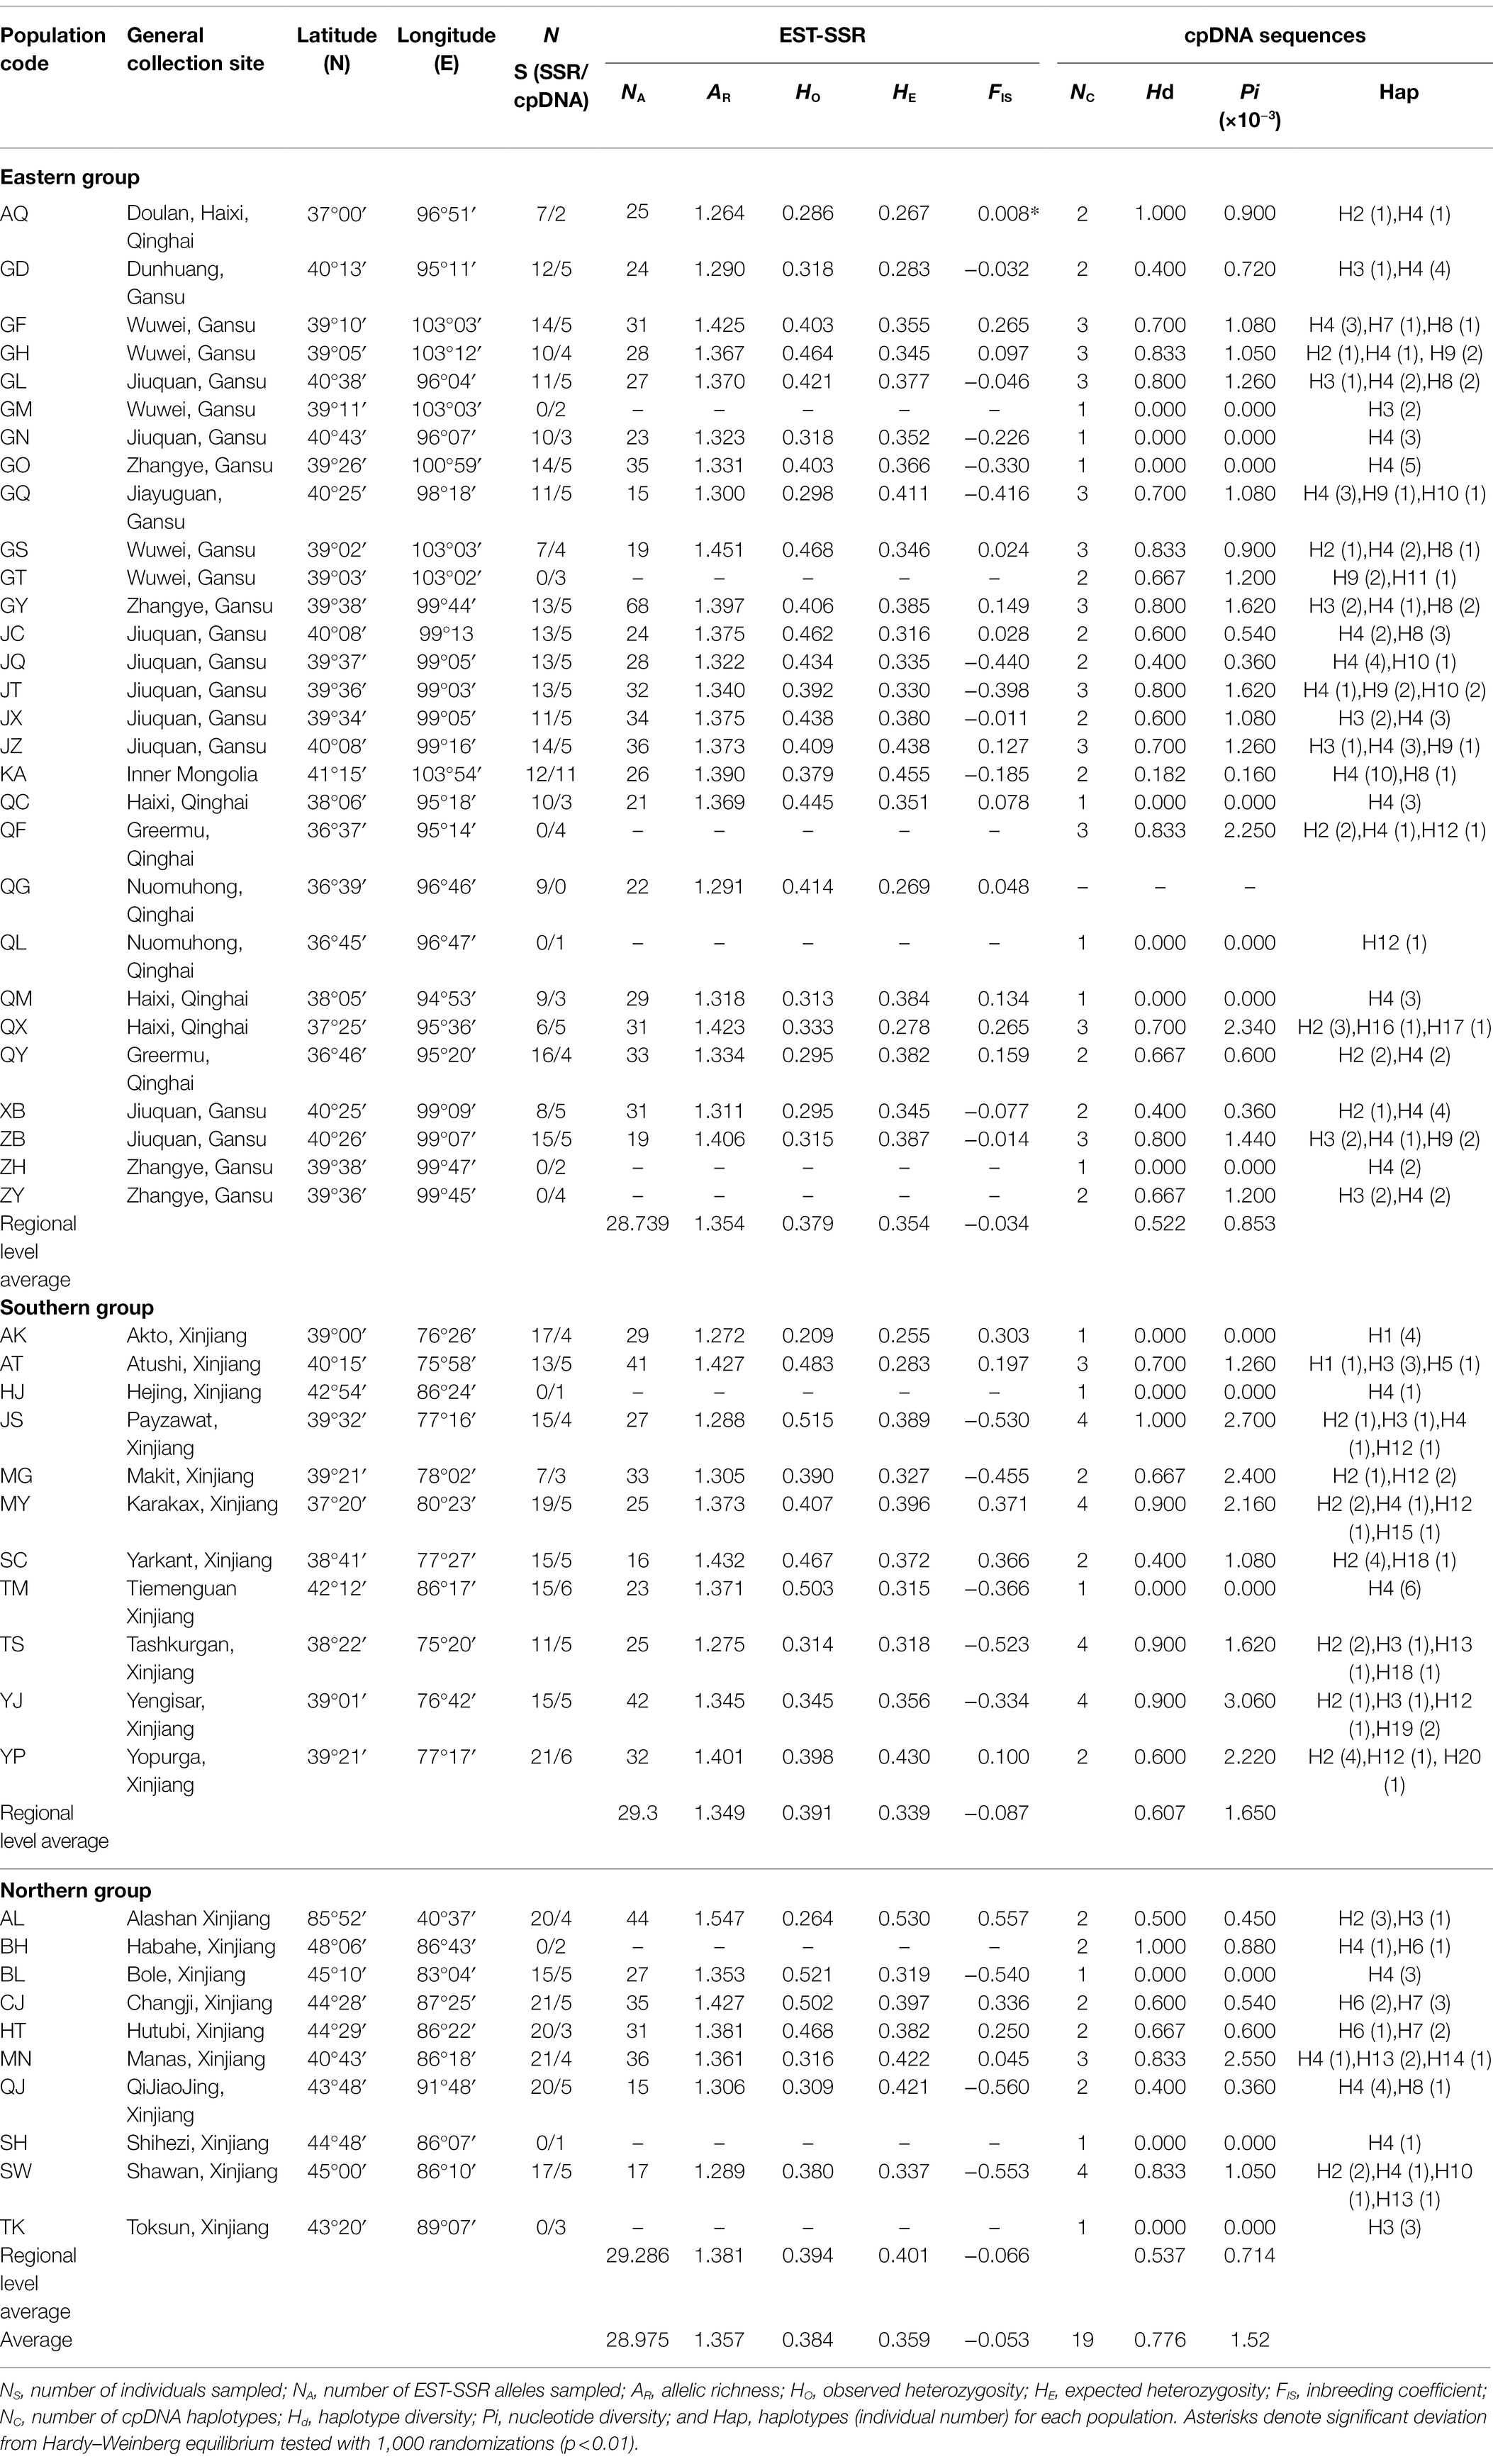
Table 1. Details of sample localities for the 50 Lycium ruthenicum populations studied.
DNA Extraction, PCR Amplification, and Sequencing
Total DNA was extracted with DNA PLANTzol Reagent (Invitrogen, Carlsbad, CA, United States) according to the manufacturer’s protocol. DNA product quality and concentration were evaluated by 1% agarose gel electrophoresis. The DNA was stored at −20°C until use. For the EST-SSR, 11 polymorphic EST-SSR markers were screened and their corresponding primer pairs were developed for 540 individuals (Table 1; Supplementary Table S2). The primer sequences and amplification conditions for each primer set were previously described (Chen et al., 2017). For all loci, a forward primer was synthesized with the M13 sequence (5’-TGTAAAACGACGGCCAGT-3′) at the 5′ end and universal M13 primers (5’-TGTAAAACGACGGCCAGT-3′) were labeled with a fluorophore (FAM, TAMRA, HEX, or ROX) during PCR amplification (Tsingke Biotech Co., Beijing, China). Whole primers were used for two-step PCR amplification on 540 individuals from 40 populations (Schuelke, 2000). In the first step, the PCR was performed in a 15 μl reaction volume consisting of 1 μl template DNA, 7.5 μl of 2 × PCR Master Mix (Tsingke Biotech Co., Beijing, China), 5.5 μl deionized water, and 0.5 μl of each forward and reverse primer synthesized with M13. The PCR conditions involved an initial denaturation at 95°C for 5 min followed by 35 cycles at 95°C for 30 s, a locus-specific annealing temperature (Supplementary Table S2) for 30 s, 72°C for 30 s, and a final extension at 72°C for 10 min. In the second PCR step, the reaction volume of 30 μl consisted of ~3 μl product from the first PCR step, 15 μl of 2 × PCR Master Mix, 10 μl deionized water, 1 μl forward primer, and 1 μl fluorophore-labeled (FAM, ROX, HEX, or TAMRA) 18-bp M13 primer. The PCR conditions involved an initial denaturation at 94°C for 2 min followed by 35 cycles at 94°C for 60 s, 59°C for 45 s, 72°C for 1 min, and a final extension at 72°C for 10 min. The final fragment lengths of the PCR products were analyzed on an ABI 3730xl DNA Analyzer (Applied Biosystems, Foster City, CA, United States) using GeneScan 500 LIZ (Applied Biosystems) as an internal reference. Alleles and genotypes were identified with GeneMarker v. 2.2.0 (SoftGenetics, State College, PA, United States).
For the cpDNA, the primer pairs rps16–trnK, trnH–psbA, matK, and rp132 from representative samples of L. ruthenicum were used in preliminary screening to detect variations in the cpDNA fragments (Shaw et al., 2005). Only the chloroplast intergenic fragments rps16–trnK and trnH–psbA had comparatively high levels of variation. Hence, they were examined in the subsequent analysis. The trnH–psbA and rps16–trnK for 206 samples from 49 populations were amplified and sequenced according to the methods of Shaw et al. (2005, 2007). The PCR conditions involved an initial denaturation at 94°C for 2 min followed by 38 cycles at 94°C for 1 min, a locus-specific annealing temperature (Supplementary Table S3) for 45 s, 72°C for 1 min, and a final extension at 72°C for 10 min. PCR products were sequenced by the Tsingke Biological Technology Co. (Beijing).
Microsatellite Diversity and Population Structure Analyses
The number of alleles, allelic richness (AR), observed heterozygosity (HO), expected heterozygosity (HE), and inbreeding coefficient (FIS) for each population were calculated by FSTAT v. 2.9.3.2 (Goudet, 2001).2 The significance of the Hardy–Weinberg equilibrium was tested by 1,000 randomizations and the resulting values of p were subjected to Bonferroni correction in FSTAT v. 2.9.3.2 (Goudet, 2001). The population structure analysis was performed in STRUCTURE v. 2.3.3.3 The model supporting population admixture and correlated allele frequency was applied (Gilbert et al., 2012). The K values were in the range of 1–10 and there were 10 permutations per K value. STRUCTURE was run with 1,000,000 burn-in generations followed by 1,000,000 MCMC iterations. The ∆K-value was obtained by the method of Evanno et al. (2005) to estimate the optimal genetic cluster (K) value. To this end, the online program STRUCTURE HARVESTER was used.4
Haplotype Genealogy Analyses
All cpDNA (rps16–trnK and trnH–psbA) sequences were assembled and manually checked in Geneious v. 11.0.2.5 The sequences were aligned with MAFFT v. 7.450 (Katoh and Standley, 2013).6 Lycium dasystemum was sequenced and served as the outgroup in the chloroplast genealogy analysis (GenBank accession numbers, rps16–trnK: ON055439, trnH–psbA: ON055440). Haplotypes were determined using DnaSP v. 5.1 (Librado and Rozas, 2009).7 Then, the genealogical relationships among the cpDNA haplotypes were inferred by a median-joining network (Bandelt et al., 1999) with Network v. 10.2.8 In the analysis, each indel and inversion were treated as a single mutation event. The geographical distribution of the cpDNA haplotypes was mapped with ArcMap v. 10.6 (ESRI, Redlands, CA, United States). All L. ruthenicum haplotype sequences were deposited in GenBank under accession numbers ON390854–ON390893.
Genetic Diversity and Population Genetic Structure Analyses
The nucleotide diversity based on the cpDNA sequences was estimated with DnaSP v. 5.1. Permut v.1.2.1 was used to compare GST and NST for the population phylogeographical structure based on 1,000 random permutations (Pons and Petit, 1996). NST > > GST strongly supported the presence of phylogeographical structure. The levels of variation within and among populations, and population differentiation statistics (FST) values (Wright’s fixation index) were calculated by analyses of molecular variance (AMOVA) in Arlequin v. 3.1 (Excoffier and Lischer, 2010).9 Significance was tested using 10,000 permutations.
Population Divergence and Dynamic Analyses
Divergence times estimation of the cpDNA haplotypes lineages were performed using BEAST v. 1.8 (Drummond et al., 2012).10 We downloaded the same chloroplast sequences from GenBank for L. cestroides (FJ189707, FJ189609) and Atropa belladonna (NC004561) species. Lycium dasystemum, L. cestroides, and A. belladonna served as the outgroups. An uncorrelated lognormal relaxed clock model with a Yule process was used for the speciation model. The GTR + I model was selected by jModelTest v. 2.1.5 (Darriba et al., 2019) and was used as the substitution model.11 As no fossil records were available for Lycium, each node was constrained by using the divergence times of L. ruthenicum and L. dasystemum (2.16 Mya) and L. dasystemum and L. cestroides (4.85 Mya) as secondary calibration points (Särkinen et al., 2013). For each BEAST analysis, Markov Chain Monte Carlo (MCMC) runs were performed on each of 1.0 × 10⁷ generations with sampling every 1,000 generations. The estimates and the convergence of the effective sample sizes (ESS; >200) for all parameters were tested by Tracer v. 1.5 (Drummond et al., 2012).12 A maximum clade credibility tree was compiled with Tree Annotator v. 1.7.513 (Drummond et al., 2012) and FigTree v. 1.3.114 was used to check the result.
The selective neutrality indices Tajima’s D (Tajima, 1989) and Fu’s FS (Fu, 1997) were estimated to detect L. ruthenicum population growth and expansion. A mismatch distribution analysis (MDA) was applied to measure population expansion for all samples. All expansion tests were implemented in Arlequin v. 3.1 (Excoffier and Lischer, 2010) which disclosed any evidence of recent demographic expansion. Unimodal pairwise distributions indicated demographic population expansions whereas stable populations exhibited bimodal or multimodal distributions. Goodness-of-fit was tested with the sum of squared deviation (SSD) between the observed and expected mismatch distributions as well as Harpending’s raggedness index (HRag; Rogers and Harpending, 1992) using 1,000 parametric bootstrap replicates. When an expansion event was confirmed, the expansion time was calculated using the formula T = τ/2μkg (Rogers and Harpending, 1992) where μ is the substitution rate in substitutions/site/year (s/s/y) units, k is the average sequence length used for the analyses (L. ruthenicum: 1,110 bp), and g is the generation time in years (g = 2 for L. ruthenicum; Chen et al., 2014). For L. ruthenicum, the average cpDNA mutation rate (μ) set to 3.0 × 10⁻⁹ s/s/y was used for the estimation (Wolfe et al., 1987). The changes in effective population size for the cpDNA sequences were calculated using Bayesian skyline plots (BSP) in BEAST2 v. 2.615 (Bouckaert et al., 2014) and the foregoing cpDNA sequence substitution parameters. For the cpDNA sequences, the MCMC chains were run for 5.0 × 10⁷ generations under the GTR + I substitution model. Both the MCMC convergence and the ESS (>200) were tested using Tracer v. 1.5.
Potential Distribution Modeling
Ecological niche modeling was conducted using MAXENT v. 3.4.416 (Phillips et al., 2006) to predict species occurrence under the last interglacial (LIG; ca. 0.13–0.14 Mya BP), the late-glacial maximum (LGM; ca. 0.02 Mya BP), the Mid-Holocene (MID; ca. 0.006 Mya BP), and current conditions (1970–2000). It was based on 7 years (2013–2019) of geographical distribution records for the L. ruthenicum populations included in the present study (Table 1) as well as those from the Chinese Virtual Herbarium,17 the Global Biodiversity Information Facility,18 previously published papers, and additional surveys during 2016–2019 (Chen et al., 2014, 2017). The number of location records of species within 12 km from other location records was removed to reduce the effects of spatial autocorrelation. Finally, 69 points were filtered from 113 distribution points for subsequent analysis (Supplementary Table S5), which was completed by using the ArcMap v. 10.6 (ESRI, Redlands, CA, United States). The Community Climate System Model (CCSM)19 was used to predict LGM and MID. Nineteen bioclimatic variables were obtained from the WorldClim database (Hijmans et al., 2005) at a resolution of 2.5 arcmin.20
SPSS v. 13.0 (IBM Corp., Armonk, NY, United States) was used to select eight climate factors with Pearson’s correlation coefficient < 0.8 for the subsequent modeling (Khanum et al., 2013; Promnun et al., 2021). The parameters chosen included (3) minimum temperature in the coldest month, (4) mean temperature in the driest quarter, (6) precipitation in the driest month, (9) mean temperature in the driest quarter, (10) mean temperature in the warmest quarter, (15) precipitation seasonality, (18) precipitation in the warmest quarter, and (19) precipitation in the coldest quarter. The model was generated with a randomly selected 75% training data, and the remaining 25% of the data was used for testing. Then, model validation was performed on 20 independent replicates, and other parameters with the default setting. The accuracy of each model prediction was tested by running a receiver operating characteristic (ROC) curve (Fawcett, 2006) analysis in MAXENT v. 3.4.4. Areas under the ROC curve (AUC) > 0.9 indicated good model fit (Swets, 1988).
Results
Microsatellite Diversity and Population Structure
The characteristics of 11 polymorphic microsatellite loci were identified in 540 L. ruthenicum individuals. The average number of alleles (NA), allelic richness (AR), observed heterozygosity (HO), expected heterozygosity (HE), and inbreeding coefficient (FIS) values are listed in Table 1. The mean species-range NA, AR, HO, HE, and FIS were 28.975, 1.357, 0.384, 0.359, and − 0.053, respectively. The highest genetic diversity was found in the AL (Alashan) population (NA = 44; AR = 1.547; HO = 0.264; HE = 0.530) located in the northern parts of the Tianshan Mountains. AL was followed by GS (Minqin; NA = 19; AR = 1.451; HO = 0.468; HE = 0.346) and SC (Yarkant; NA = 16; AR = 1.432; HO = 0.467; HE = 0.372) populations located in the eastern and southern proportions of the range of the species (namely, the areas around the Qilian Mountains, the Qaidam Basin, and north of the Kunlun Mountains), respectively.
The STRUCTURE analysis results indicate that ∆K reached its maximum value at K = 3 (Figures 1A,B). Though we selected K = 3 for the final analysis, the clusters were not geographically associated. Therefore, the STRUCTURE analysis did not detect any geographically meaningful genetic cluster (Figures 1C,D).
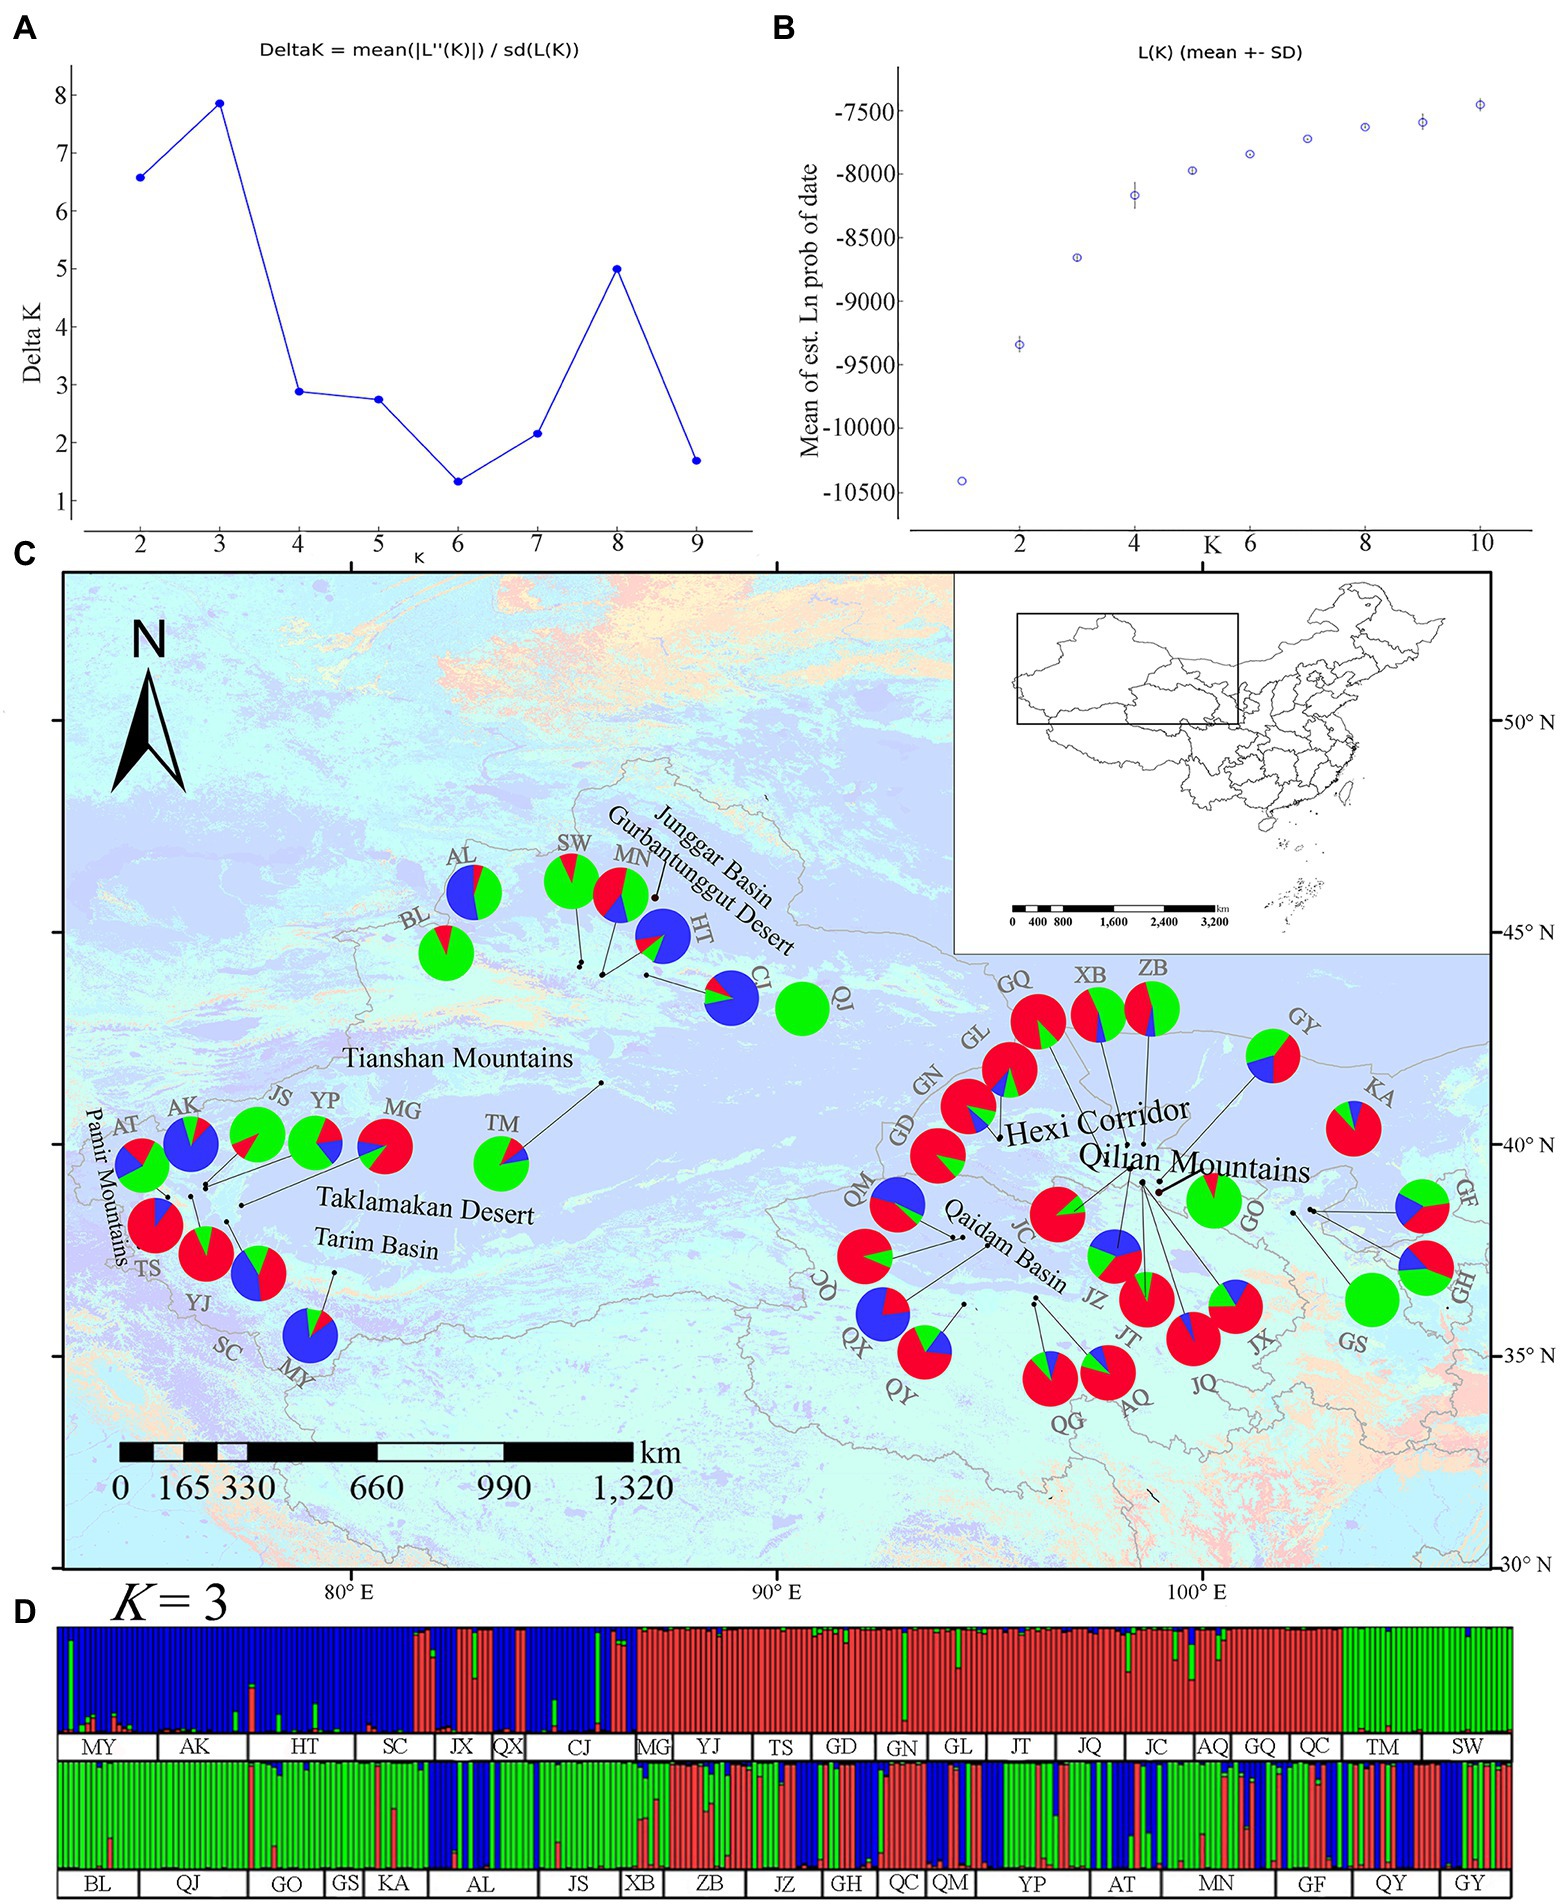
Figure 1. Genetic divergence in 40 Lycium ruthenicum populations based on 11 EST-SSR datasets. (A) Log-likelihood values. Ln P (K) as a function of K calculated for 10 replicates. (B) Second-order changes in the log-likelihood values. (Delta K) as a function of K calculated for 10 replicates. (C) Geographical distribution of three genetic clusters (K = 3) and genetic cluster composition in each population. (D) Proportion of genetic clusters at K = 3 for each of 540 individuals. Smallest vertical bars represent individuals.
Chloroplast Haplotype Variation and Distribution
Alignment of the cpDNA sequences for 206 L. ruthenicum individuals yielded a consensus sequence 1,110 bp long, namely, 728 bp for rps16–trnK and 382 bp for trnH–psbA, respectively. Twenty haplotypes were identified in 49 populations. There were 20 variable sites, 13 nucleotide substitutions, six indels, and one inversion 29 bp long in the trnH–psbA region (Supplementary Table S4). Haplotypes H2 and H4 had the widest distributions followed by H3. Haplotypes H5, H11, H14, H15, H16, H17, H19, and H20 were observed in the AT (Atushi), GT (Minqin), MN (Manas), MY (Moyu), QX (Haixi), QX, YJ (Yengisar), and YP (Yopurga) populations, respectively (see Supplementary Table S1 for more details). H4, H2, and H3 were detected in 88, 31, and 23 samples, respectively. They were the dominant haplotypes and widely distributed in the Tarim Basin, the Junggar Basin, the Hexi Corridor, the Qaidam Basin, Ningxia, and parts of Inner Mongolia (Table 1; Figure 2A).
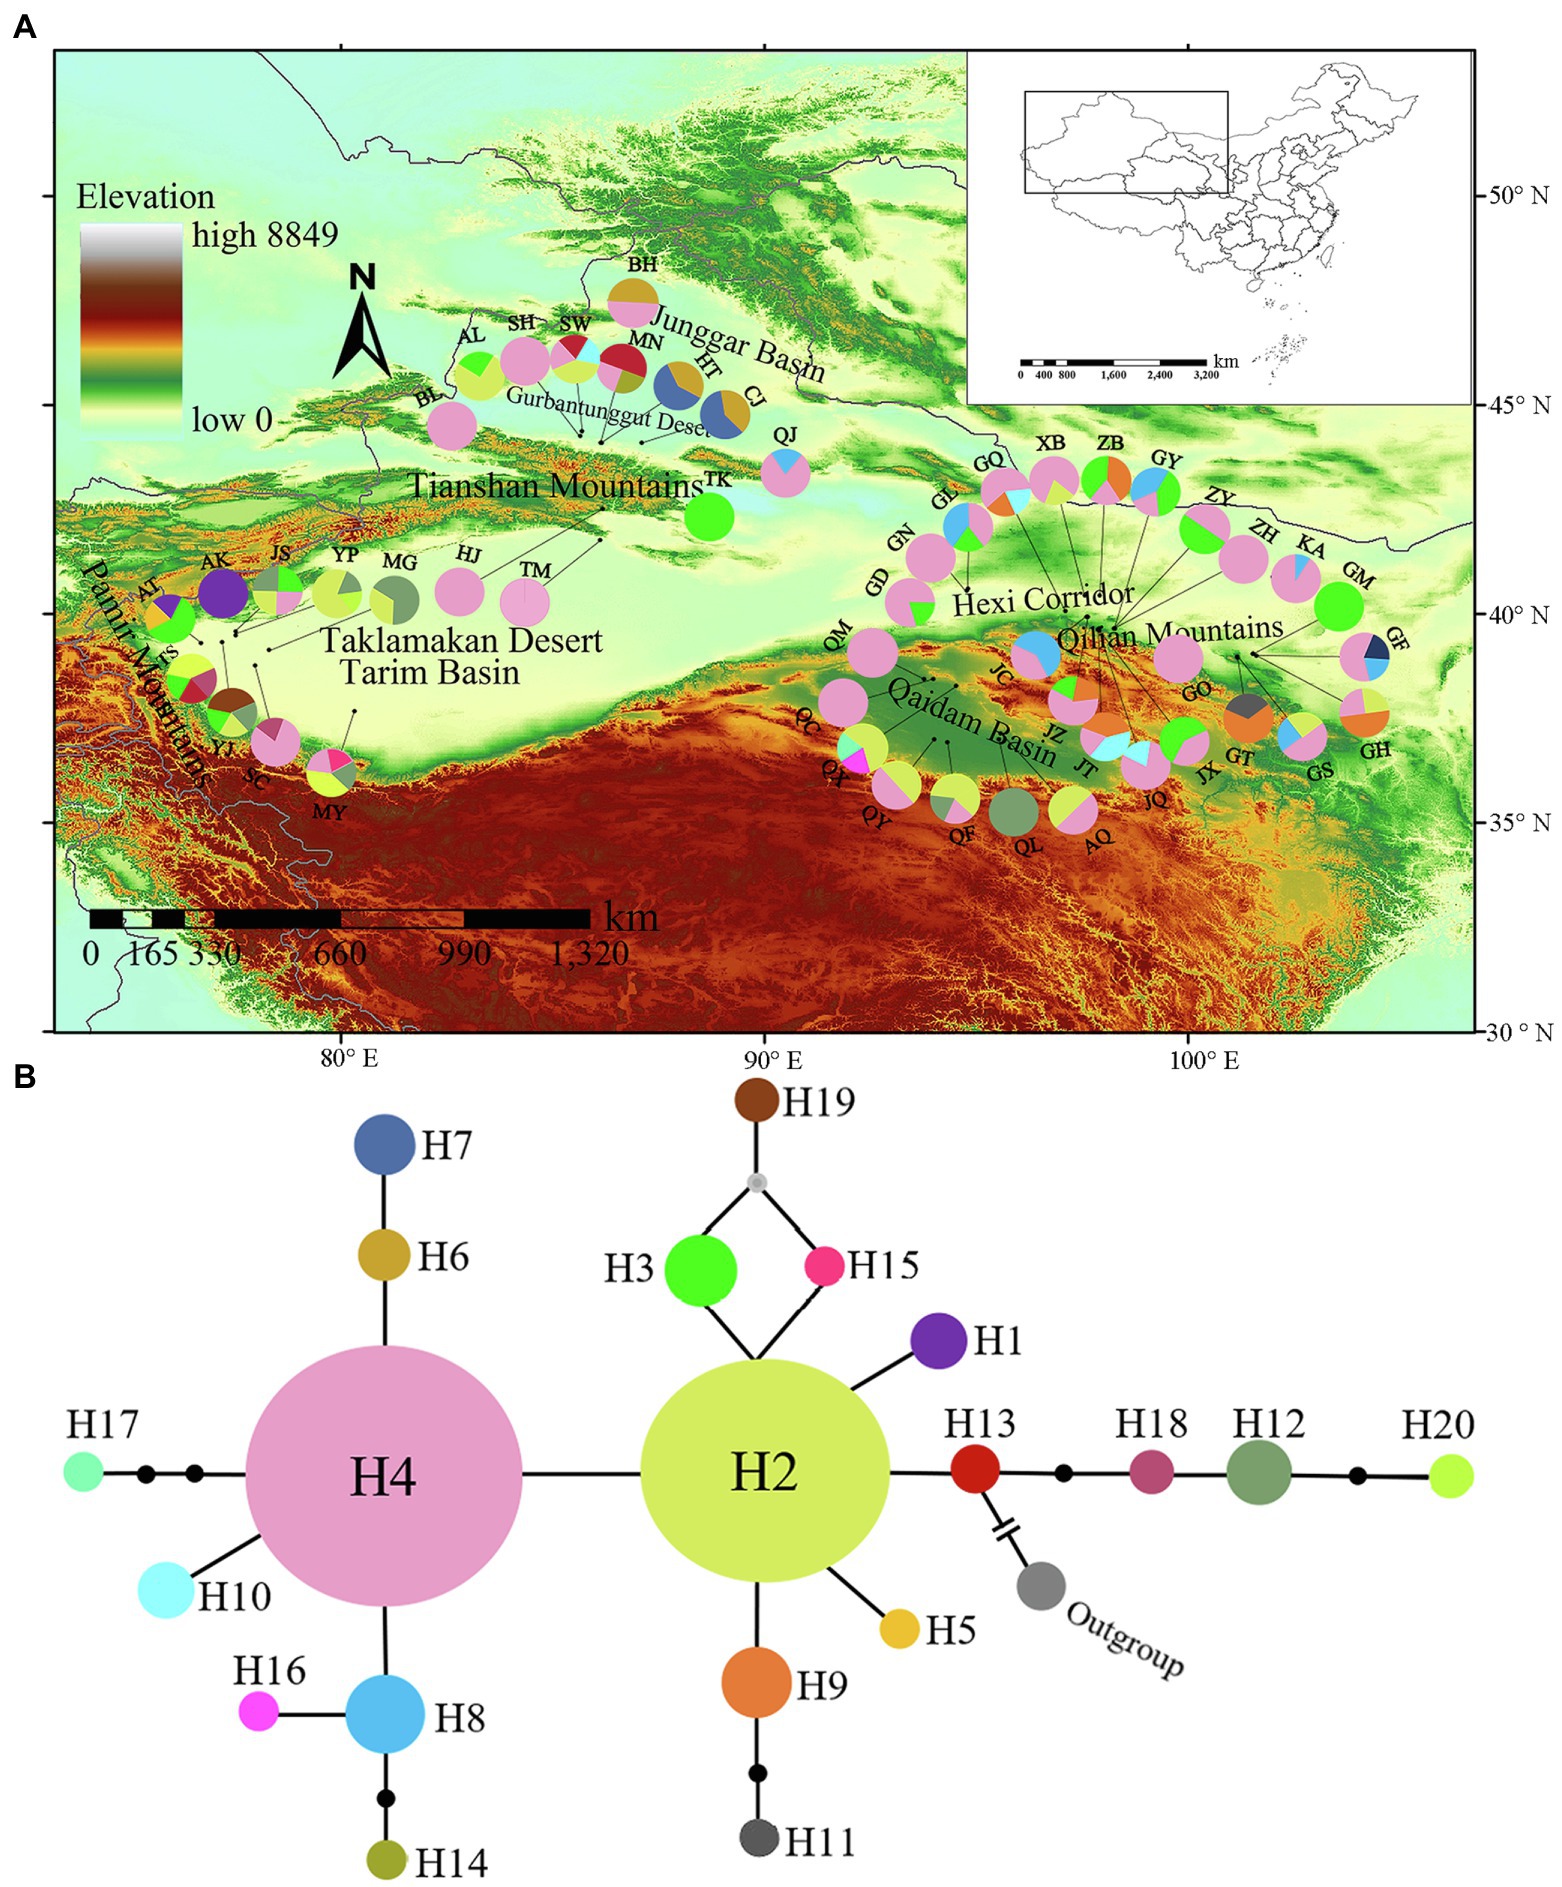
Figure 2. Analysis of cpDNA fragment (rps16–trnK and trnH–psbA) haplotypes of Lycium ruthenicum. (A) Geographical distributions of cpDNA haplotypes. (B) Statistical parsimony network of cpDNA haplotypes. Circle sizes are roughly proportional to individual numbers (n) of haplotypes. Smallest circles represent n = 1 while largest circles represent n = 88. Solid lines represent mutational steps interconnecting two haplotypes. Each line represents 1 step.
A median-joining network analysis was used to determine the relationships among the cpDNA haplotypes (Figure 2B). The haplotypes relationships revealed that H13 was the ancestral haplotype. It was distributed in the northern Tianshan Mountains (Manas: MN, Shawan: SW) and the eastern Pamir Mountains (Tashkurgan: TS; Figures 2A,B).
Genetic Diversity and Population Genetic Structure
Among all populations, the species-level cpDNA haplotype and nucleotide diversity values were h = 0.776 and Pi = 0.00152, respectively (Table 1). The foregoing results indicated that the L. ruthenicum populations had high species-level haplotype diversity (h = 0.776) and low species-level nucleotide diversity (Pi = 0.00152). The phylogeographic structure between haplotypes did not significantly contribute to population differentiation (GST = 0.308; NST = 0.226; GST > NST; p > 0.05). Hence, the species had no significant phylogeographical structure. The results of AMOVA showed that a large proportion of the variation (65.64%) occurred within population; this result was consistent with the high genetic differentiation within population of this species (FST = 0.35; p < 0.001; Table 2).
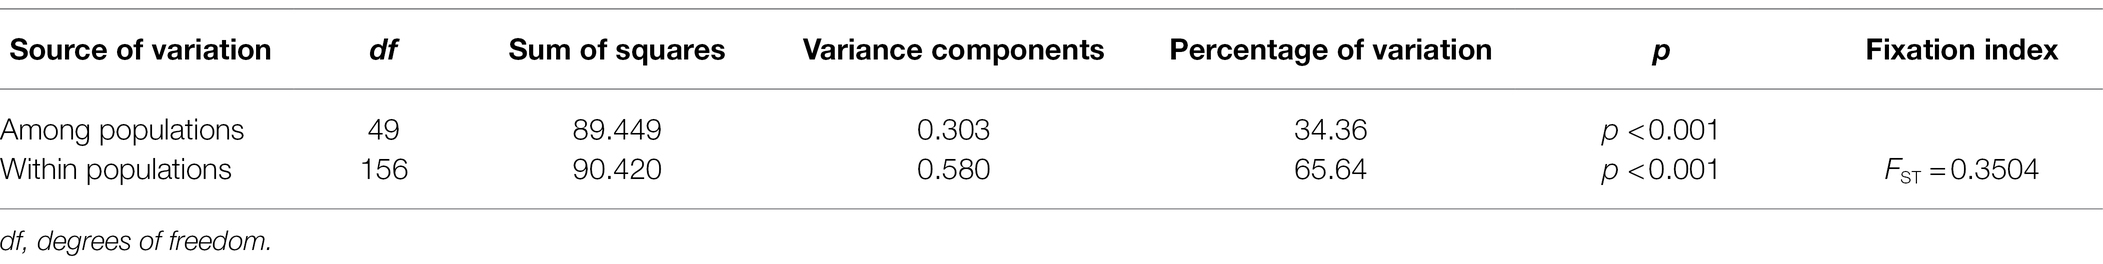
Table 2. Results of analysis of molecular variance (AMOVA) of Lycium ruthenicum populations.
Demographic History and Divergence Times Estimation
BEAST was used to estimate the divergence times. When L. dasystemum, L. cestroides, and A. belladonna were used as outgroups, the phylogenetic tree showed that all L. ruthenicum haplotypes formed a monophyletic group. It was estimated that the differentiation times among these 20 haplotypes ranged from the early Pleistocene [1.95 Mya; 95% highest posterior density (HPD) = 1.17–2.74 Mya] to the middle Pleistocene (0.22 Mya; 95% HPD = 0.005–0.730 Mya; Figure 3).
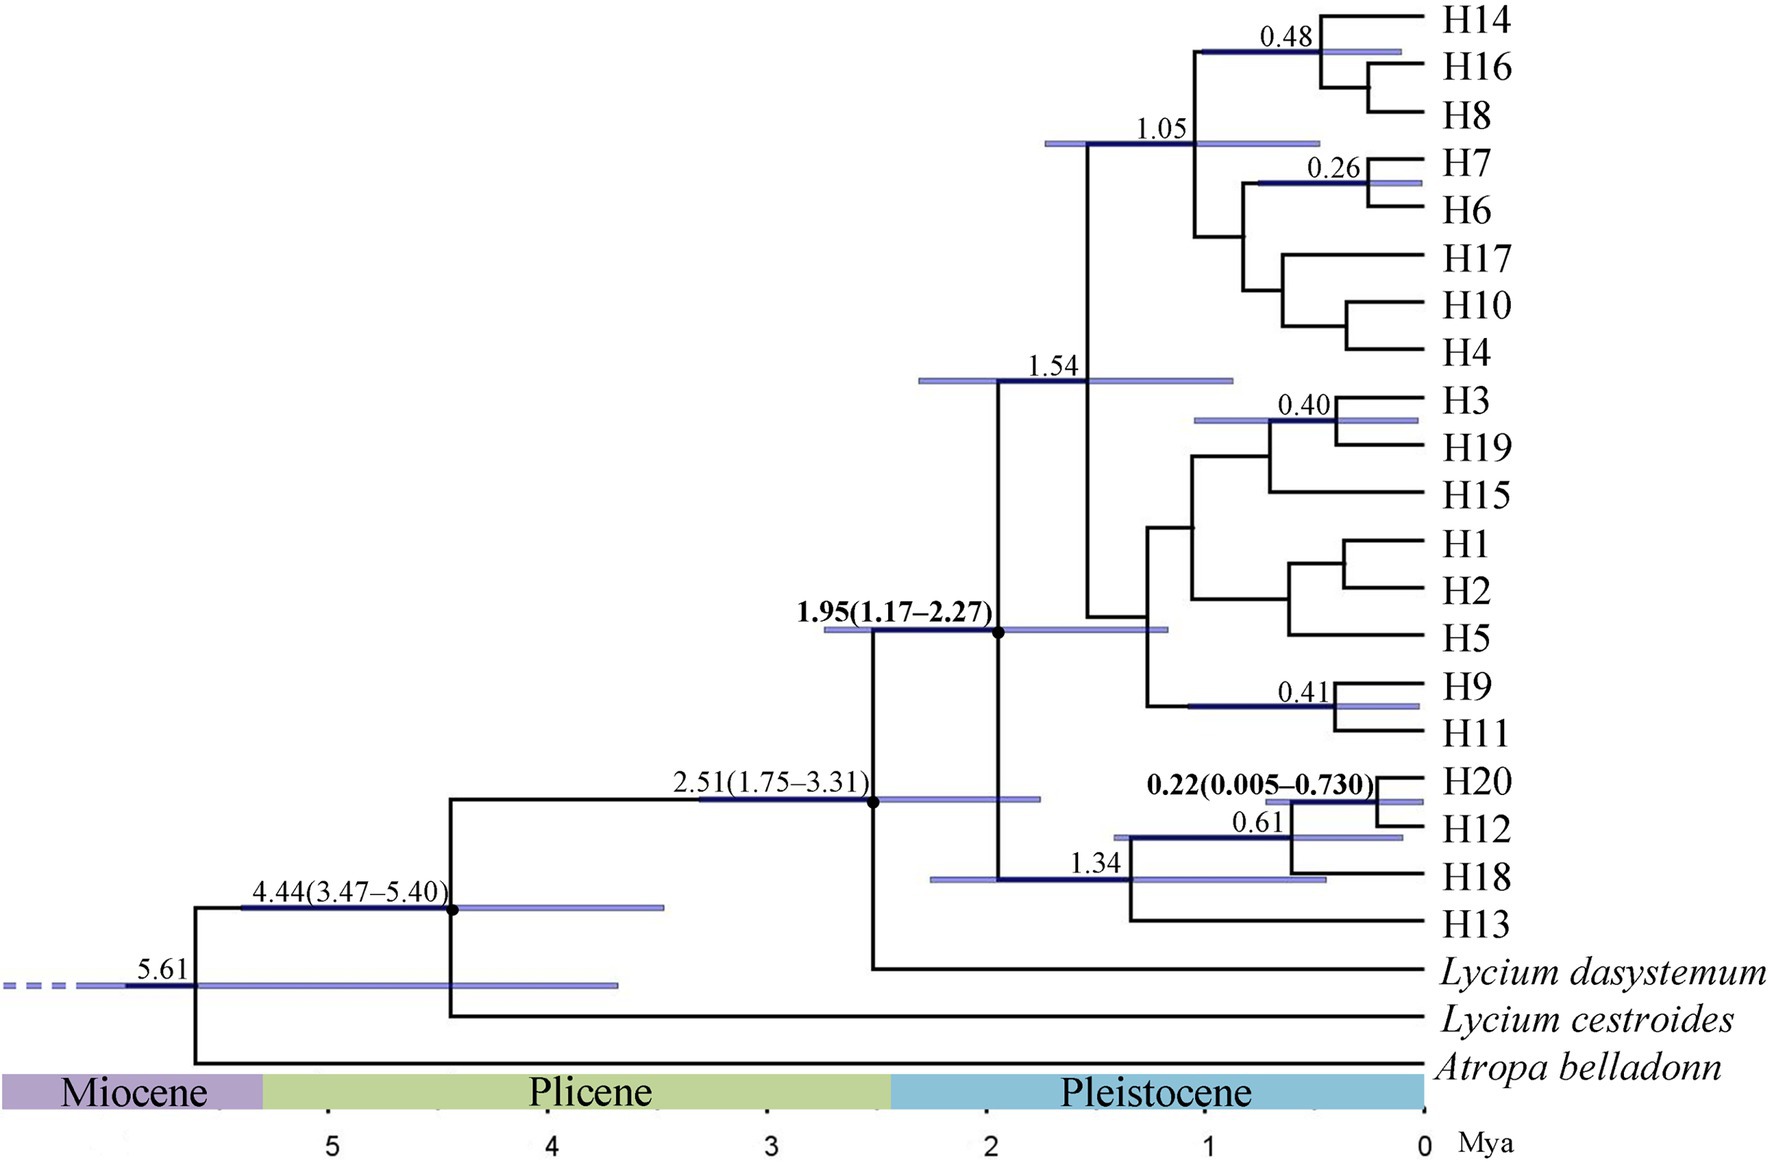
Figure 3. Phylogenetic tree of 20 haplotypes constructed by Bayesian analysis of Lycium ruthenicum. Divergence times (millions of years ago; Mya) of nodes with 95% ranges of highest posterior density (95% HPD) are shown above branches. Blue horizontal bars indicate 95% HPD of node age.
For all L. ruthenicum groups, the neutrality test statistics revealed significantly negative Tajima’s D (D = −1.443; p = 0.037) and Fu’s FS (FS = −8.877; p = 0.009). The unimodal mismatch distribution, the positive SSD values (SSD = 0.008; p = 0.170), and the HRag (0.048; p = 0.570; Table 3; Figure 4A) consistently suggested a past demographic expansion event.
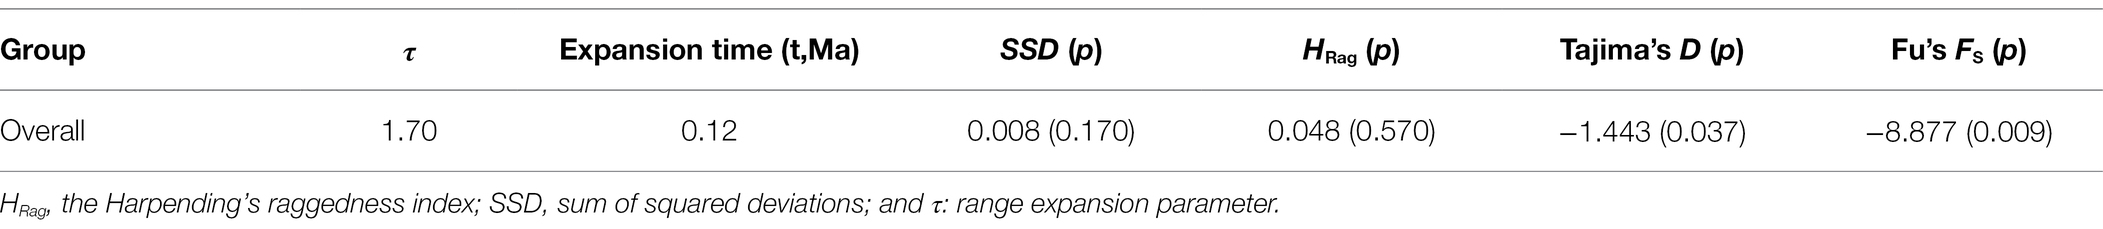
Table 3. Results of neutrality tests and mismatch distribution analysis for Lycium ruthenicum populations.
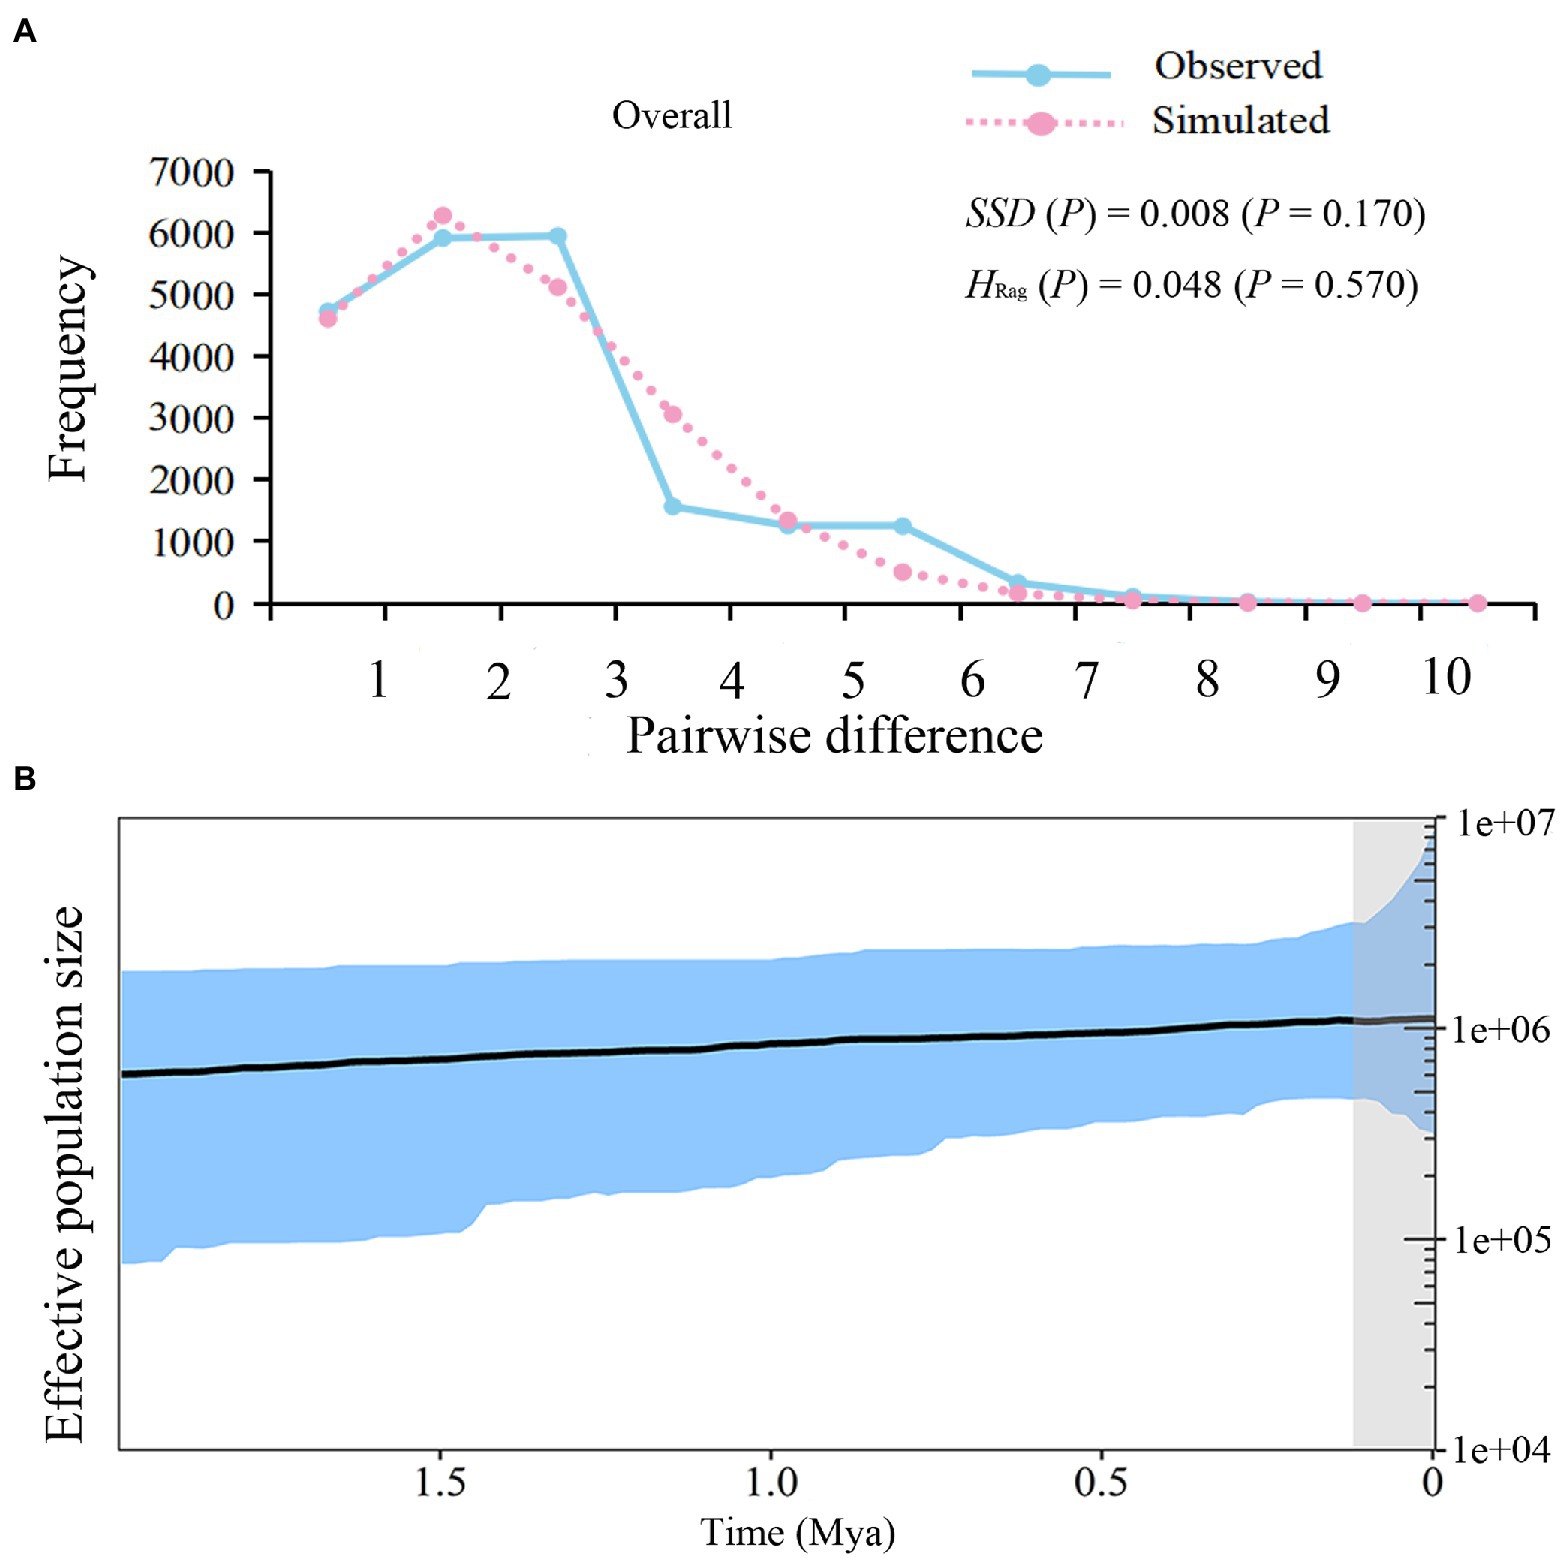
Figure 4. Demographic Analysis of Lycium ruthenicum. (A) Pairwise mismatch distributions of cpDNA sequences. (B) Bayesian skyline plot (BSP) based on cpDNA for effective population size fluctuation over time. Black line is median estimation. Area between blue lines is 95% CI.
The unimodal mismatch distribution and relatively low SSD and HRag values indicated past species-level expansion events. The estimated expansion time was ca. 0.12 Mya. A Bayesian skyline plot (BSP) displayed a steady growth between ca. 1.95 and 0.12 Mya while the species-level rapid expansion events occurred since the past ca. 0.12 Mya (Figure 4B).
Ecological Niche Modeling
The AUC values for L. ruthenicum ENM were > 0.90 for all four periods. The predictive model performed well. The predicted distribution of the species under current conditions is generally similar to its actual distribution in northwestern China. The suitable habitats of the L. ruthenicum populations were narrower and more fragmented during the Last Interglacial (LIG) and Late Glacial Maximum (LGM) than they are at present (Figures 5A,B). The ENM predicted that the potential distribution areas in LIG and LGM were near the Junggar Basin, the Pamir Plateau, the western part of Tarim Basin, the Qaidam Basin, and the Hexi Corridor, and the small areas of the Tianshan Mountains. Interestingly, however, the distribution range of L. ruthenicum in the LIG period seems to have been less than the LGM (Figures 5A,B). The MID and current distribution areas of L. ruthenicum greatly expanded near the Pamir Plateau and in the Tianshan Mountains, Tarim Basin, Junggar Basin, the Qaidam Basin, and Hexi Corridor, and parts of Inner Mongolia (Figures 5C,D).
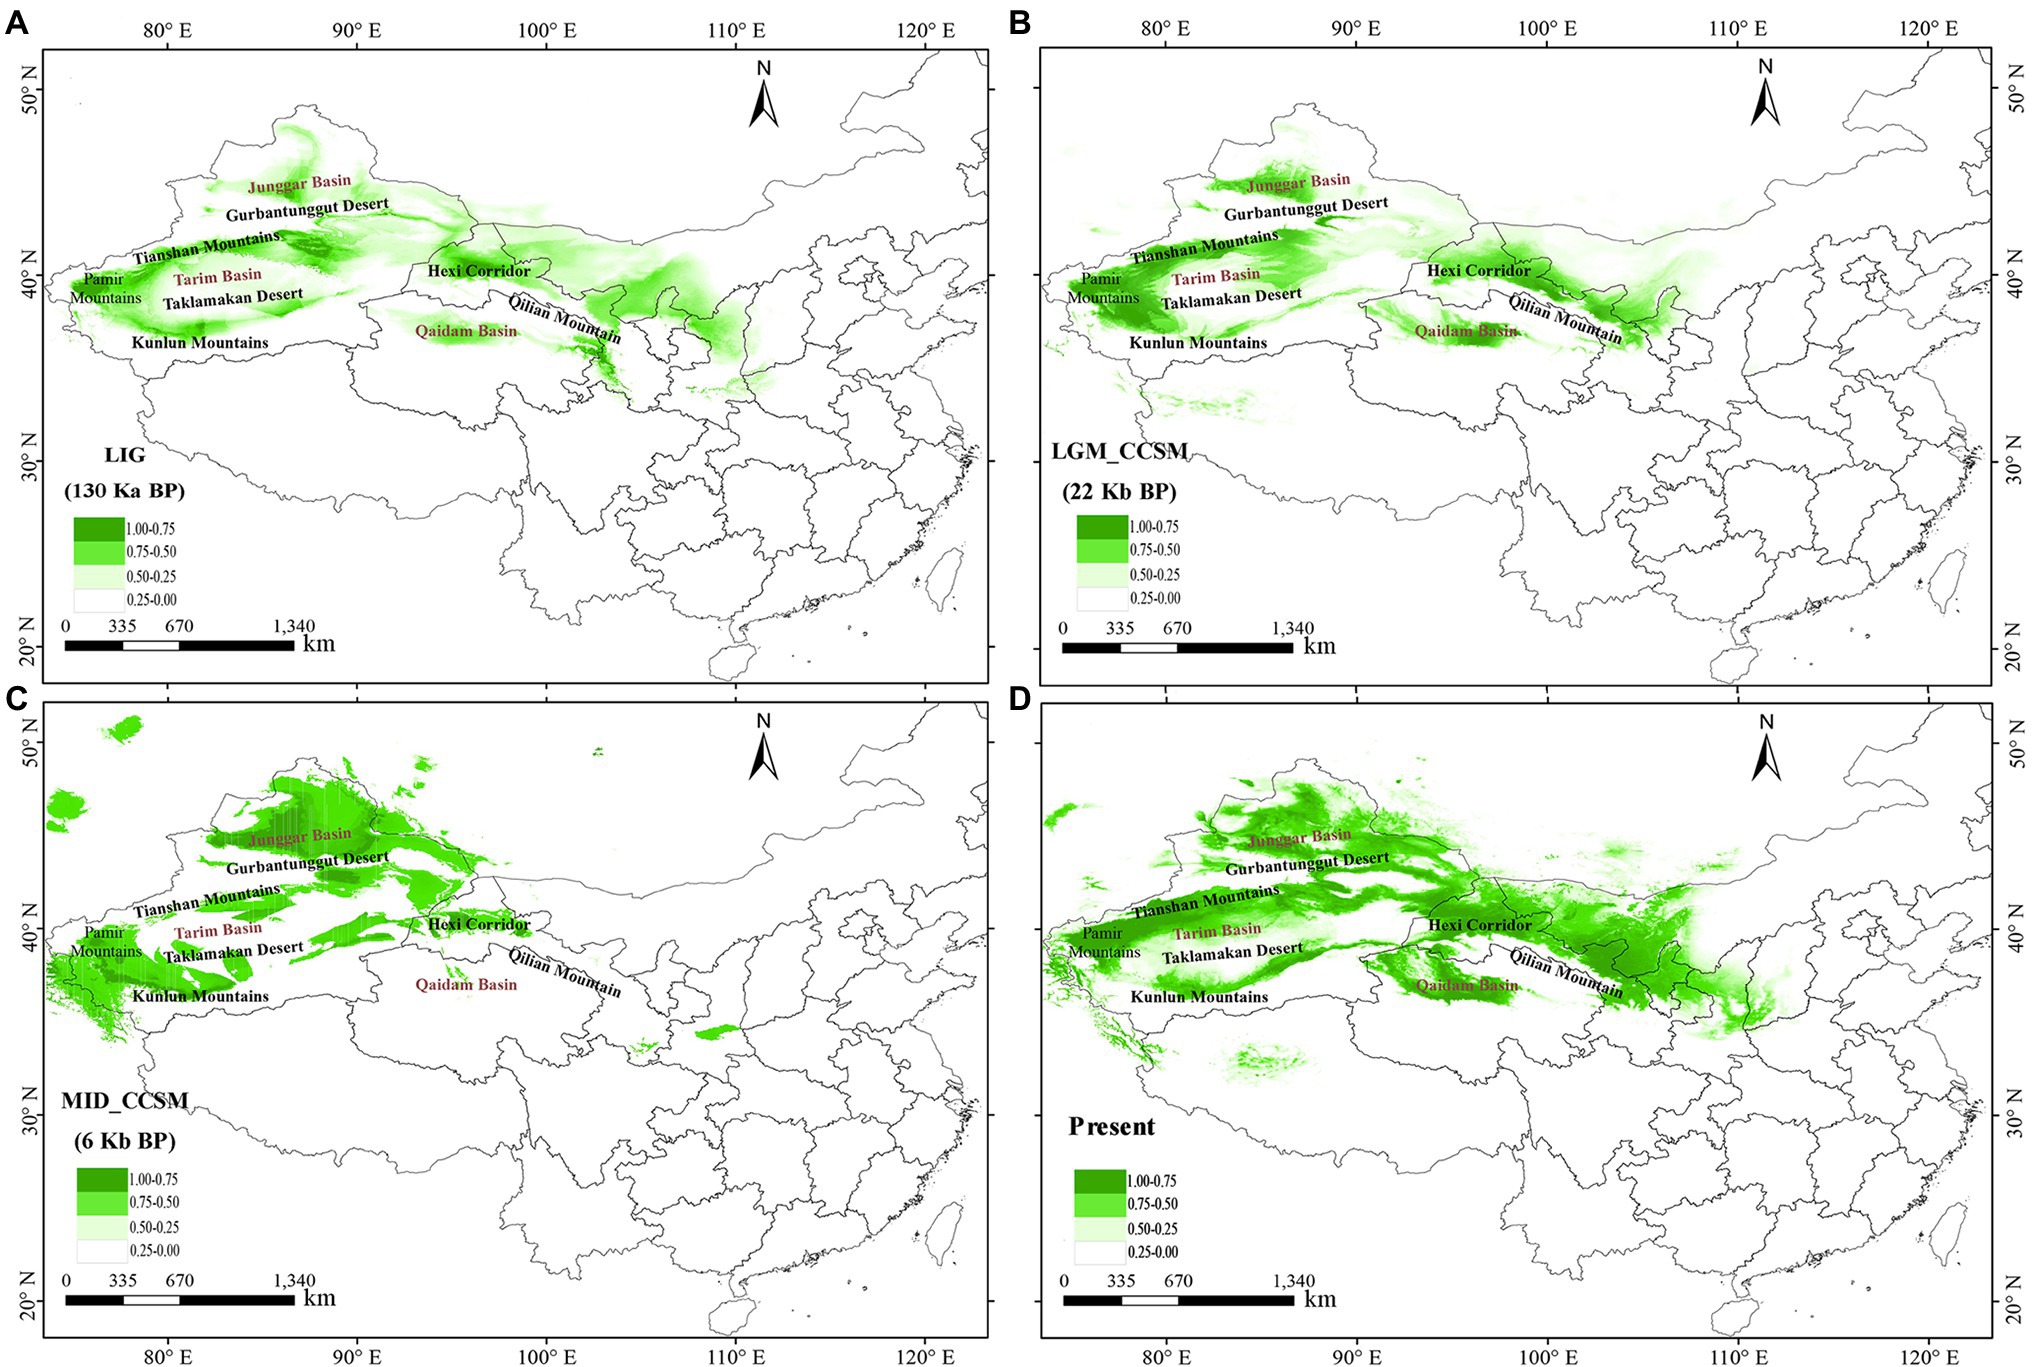
Figure 5. Model of areas climatically suitable for Lycium ruthenicum at different times. (A) Last interglacial (LIG; ca. 0.13–0.14 Mya BP). (B) Last glacial maximum (LGM; ca. 0.02 Mya BP) under Community Climate System Model (CCSM). (C) Mid Holocene (MID; ca. 0.006 Mya BP) under CCSM. (D) Present time (1970–2000).
Discussion
Genetic Diversity and Genetic Structure
The two chloroplast intergenic fragments rps16–trnK and trnH–psbA indicated high species-level haplotype diversity (h = 0.776) but low species-level nucleotide diversity (Pi = 0.00152) for L. ruthenicum (Table 1). A previous cpDNA analysis reported similar results (Chen et al., 2014). During the long evolutionary process of species expansion, new haplotypes accumulated through mutations whereas nucleotide sequence diversity did not (Avise, 2000). This phenomenon may be explained by the low nucleotide substitution rate and highly conserved genomic structure of the chloroplast genome (Daniell et al., 2016). Similar results were reported for the desert plants Lagochilus ilicifolius (h = 0.8824, Pi = 0.0016; Meng and Zhang, 2011) and Zygophyllum xanthoxylon (h = 0.535, Pi = 0.0049; Shi and Zhang, 2015) in northwestern China. AMOVA demonstrated that a large proportion of the variations occurred within populations (Table 2). In contrast, the genetic variation among populations was relatively low. Thus, there was a high level of gene flow among populations. The opposite results were reported for other shrub species in northwestern China such as Lagochilus (Meng and Zhang, 2013) and Gymnocarpos przewalskii (Ma et al., 2012).
The chloroplast and microsatellite marker assays did not significantly differentiate among L. ruthenicum populations (Figures 1, 2). Previous SRAP and ISSR analyses reported similar observations (Liu et al., 2012b; Alitong et al., 2013). The reasons for the lack of phylogeographical structure in L. ruthenicum may be complex. Firstly, L. ruthenicum outcrosses and has partial self-incompatibility (Hitchcock, 1932; Savage and Miller, 2006; Kuang and Lu, 2011). Outcrossing usually enhances progeny viability and establishes and maintains high overall genetic diversity in plants (Hamrick, 1982; Borba and Shepherd, 2001). The pollination of L. ruthenicum is mediated by wind and insects (Hedrick, 2004), and the small seeds of L. ruthenicum are contained in fleshy, bright black fruits and are spread by the birds and rodents that ingest them (Hitchcock, 1932). Lycium ruthenicum seeds mature in mid-October and are dispersed to deserts via wind and dust storm (Liu et al., 2012b). Secondly, Lycium ruthenicum is salt- and drought-tolerant, most individuals are long-lived, and the root of L. ruthenicum is propagated via clones (Dong et al., 2008; Dai et al., 2013). Finally, the geographical distribution of a species may also influence its genetic diversity. As a rule, genetic variation is comparatively higher in widely distributed species (Hamrick and Godt, 1996). The abovementioned factors might explain the high genetic diversity of L. ruthenicum.
Potential Glacial Refugia
Ice sheets did not cover most of northwestern China, but significant Quaternary climatic oscillations nonetheless occurred (Meng et al., 2015). During the Pleistocene glaciations, extreme drought and low temperatures fragmented desert plant habitats. However, the warmer, wetter conditions of the interglacial period might have promoted desert plant expansion. Nevertheless, the ENM estimated that both the LIG and LGM (Figures 5A,B) climatic fluctuations might have substantially narrowed the range of this desert species compared to its current range. Thus, we propose that the relatively drought and temperatures conditions of the LIG period (ca. 0.13–0.14 Mya) were not conducive to the expansion of L. ruthenicum. For this reason, this species retreated to the refugia situated on the edges of the Junggar Basin, the Tarim Basin, the Tianshan Mountains, the Pamir Plateau, the Qaidam Basin, and near the Qilian Mountains during the LIG and LGM (Figures 5A,B). Similar expansion patterns were found in another desert plant, Populus euphratica (Zeng et al., 2018).
During the Pleistocene, drastic climatic fluctuation caused the migration and extinction of large plants. Harsh cold and dry climates caused them to retreat to refugia (Hewitt, 2000; Shen et al., 2002). These refugia also became starting points for rapid range expansion and recolonization of species after the glacial periods (Comes and Kadereit, 1998; Taberlet et al., 1998; Liu et al., 2012a). Glacial refugia have unique geographical conditions and are suitable living environments. Therefore, they harbor high levels of genetic diversity and ancestral and unique haplotypes. The Junggar Basin, the Tianshan Mountains, the western Tarim Basin, the eastern Pamir Plateau, the Qaidam Basin, and the Hexi Corridor are glacial refugia for certain desert plants in northwestern China (Zhang and Zhang, 2012; Zhang et al., 2016).
Our ENM predicted that the potential distribution areas of L. ruthenicum in the LIG (Figure 5A) were located near the Junggar Basin, the Pamir Plateau, and the Hexi Corridor whereas those during the LGM (Figure 5B) were mainly localized to the western edge of the Tarim Basin, the Junggar Basin and the northern part of the Tianshan Mountains, the Qaidam Basin, and the Hexi Corridor. Thus, based on ancestral haplotype distribution and ENM analysis results, we hypothesize that L. ruthenicum had two possible refugia during the Pleistocene Period of which one was situated in the southern part of the Junggar Basin and the northern part of the Tianshan Mountains. The genetic diversity of the northern populations in this area (NA = 29.286; AR = 1.381; HO = 0.394; HE = 0.401; Table 1) was higher than those of the southern and eastern populations. Moreover, the populations located in the southern parts of the Junggar Basin and the northern part of the Tianshan Mountains included one ancestral haplotype (H13 in the MN and SW populations) and one unique haplotype (H6 in the CJ (Changji), BH (Habahe), and HT (Hutubi) populations; Table 1). The northern branches of the Tianshan Mountains and the Junggar Basin comprise a biodiversity hotspot in northwestern China (Meng et al., 2015). This region was relatively wet and a suitable environment for desert plants during the glacial period. Hence, it was also a potential refugium of L. ruthenicum. The results align with those reported for phylogeographical studies on the desert plants Capparis spinosa (Wang et al., 2016b) and Zygophyllum xanthoxylon (Shi and Zhang, 2015).
Other putative refugia are located in the western Tarim Basin and the eastern Pamir Plateau. In these regions, there was one ancestral haplotype (H13 in the TS population) and five unique haplotypes (H5, H15, H18, H19, and H20 in the AT, MY, SC and TS, YJ, and YP populations, respectively; Table 1). The western areas of the Tarim Basin and the eastern areas of the Pamir Plateau were supplied with meltwater from the snow and glacial ice on the mountains (Meng et al., 2015). Therefore, this area was conducive to L. ruthenicum’s survival. These putative refugia were identified in a previous study (Ma et al., 2012).
Demographic History of Lycium ruthenicum in the Quaternary
Significantly (p < 0.05) negative values for the neutrality test statistics, unimodal mismatch distribution, and relatively low SSD and HRag (p > 0.05; Table 3; Figure 4A) are all indicative of a past expansion event in this species (Hudson, 1990). The existence of widespread haplotypes (H2, H4), other star-like patterns of the haplotype network (Figure 2B), and the BSP (Figure 4B) are all evidence of the demographic expansion of L. ruthenicum (Hudson, 1990).
The rapid uplift of the Tianshan and other mountain ranges related to the QTP after ca. 2.6 Mya dramatically hindered local precipitation and hydrological circulation and intensified the aridification in northwestern China (Harrison et al., 1992; Spicer et al., 2003; Liu et al., 2014a). Simultaneous monsoon intensification might have had further enhanced the climatic aridification (Su et al., 2011). The BSP result showed that L. ruthenicum underwent rapid expansion over the past ca. 0.12 Mya (Figure 4B). The suitable habitats of the L. ruthenicum populations were narrower and more fragmented during the LIG (ca. 0.13–0.14 Mya) and LGM (ca. 0.02 Mya; Figures 5A,B). A study reported that northwestern China entered its largest glacial period at ca. 1.2–0.6 Mya (Cun and Wang, 2010). Furthermore, the Gonghe movement occurred during the past ca. 0.14 Mya changed the climate and intensified aridification in northwestern China. Therefore, the geological and climatic aridification of the LIG (Figure 5A) might have substantially narrowed the range of this desert species. During the LGM (Figure 5B), cold and dry climates caused the L. ruthenicum species to retreat to the edges of the Tarim Basin, the Junggar Basin, the Qaidam Basin, and the Hexi Corridor. Thus, the suitable habitats of the L. ruthenicum populations were narrower and more fragmented during the LIG and LGM than they are at present (Figure 5D).
Several recent studies reported that many arid land plants in northwestern China are more inclined to migrate along the edges of deserts during the interglacial periods (Xu and Zhang, 2015). During the late Pleistocene (ca. 0.126–0.012 Mya), the climate of northwestern China has fluctuated between humid and dry conditions, resulting in the enlargement of deserts while the desert margin (e.g., Taklamakan Desert of the Tarim Basin and Gurbantunggut Desert of the Junggar Basin, Badain Jaran–Tengger desert to the north of the Hexi Corridor) and arid piedmont grassland areas seem to have provided stable habitats for desert plants (Su and Zhang, 2014). Although L. ruthenicum is generally adapted to drought, its habitats do not occur within the climatically extreme desert interior. Thus, the relatively humid desert margin areas seem to provide relatively stable habitats for this species (Dai et al., 2013). Subsequently, during the early Holocene (ca. 0.01 Mya) period, snow and glacial ice melted off the Tianshan, the Altai, the Kunlun Mountains, and Qilian Mountains surrounding the Junggar, Tarim Basins, and Qaidam Basin irrigating the surrounding deserts and increased the humidity on the edge of these regions (Yang and Scuderi, 2010; Meng et al., 2015). It is, therefore, possible that under these warm conditions the L. ruthenicum species could thrive and expand outwards along the edges of the Gurbantunggut and Taklamakan Deserts and migrated westward via the Hexi Corridor. These migration patterns are consistent with putative colonization routes in Hexi Corridor proposed by Meng et al. (2015) in the review about the plant phylogeography in arid northwestern China, and similar results have been found in other desert plants, e.g., Zygophyllum xanthoxylon (Shi and Zhang, 2015). The foregoing results support the hypothesis that under warm climate conditions following the LGM period (Figure 5B), the geographical range of L. ruthenicum greatly increased and the species became widely distributed in northwestern China. This postulate aligns with the present distribution pattern of L. ruthenicum in this region. Our results were similar to those reported for other desert plants such as Hexinia polydichotoma (Su and Zhang, 2014), and Reaumuria soongarica (Yin et al., 2015). Nevertheless, the results support that compared with alpine plants, the response of drought-tolerant desert plants to the geology and climatic oscillations in the Pleistocene might not be consistent with the expansion and contraction of high latitude ice sheets, but rather, the expansion of species range mainly depended on the temperature and relative humidity on the edge of the desert and adjacent areas (Meng and Zhang, 2013; Meng et al., 2015).
Conservation Insights
Genetic diversity is vital for a species to be able to maintain its life cycle, reproduce, resist disease, and adapt to changing environmental conditions (Avise and Hamrick, 1996). The conservation of desert plant genetic resources is essential to mitigate any further degradation of fragile arid and semi-arid ecosystems and maintain desert biodiversity. Lycium ruthenicum is an important medicinal plant with high economic and ecological value. For this reason, the protection of this wild resource is imperative.
Populations with high genetic diversity should be prioritized for conservation measures. Here, the northern part of the Tianshan Mountains had higher genetic diversity than the eastern and southern regions within the range of L. ruthenicum. Thus, the northern populations of this species require protection. The refugial populations MN, SW, CJ, and BH are at particularly high risk and merit conservation. The southern refugial populations TS, AT, MN, MY, SC, YJ, and YP in the western Tarim Basin and eastern Pamir Plateau also need protection. Conservation of these populations is crucial for the preservation of the genetic diversity of this species in the face of future climate change. We propose that cultivated L. ruthenicum should substitute for wild resources in commercial applications and a horticultural system should be established to protect existing wild populations.
Conclusion
The present study clarified the influence of climatic oscillations events upon the geographical distribution and the demographic history of the salt- and drought-tolerant desert plant Lycium ruthenicum in the Quaternary. By combining the evidence from both ENM and molecular data, we first confirmed that the present spatial genetic structure of L. ruthenicum in northwestern China resulted from the combined effects of expansion and contraction from refugia after the LGM. This event was predominantly driven by the Pleistocene extreme drought and low temperatures resulting from the rapid uplifting of QTP and other mountains. The evidence indicated an overall consensus between the present geographical distribution of L. ruthenicum and the effects of the geological events, climatic fluctuations, and aridification during the Quaternary in northwestern China. The two molecular data assays indicated that L. ruthenicum had high genetic diversity and there was no significant differentiation among its populations. Hence, we propose that breeding systems, long-term seed dispersal, and postglacial range expansion may have increased the genetic diversity and diluted the regional differentiation of this species. In addition, protecting the natural wild plant populations of L. ruthenicum will help to mitigate wind erosion, and maintain the integrity of the desert ecosystem in the study region. These findings have implications for thinking about the refugia of other drought-tolerant desert plants in northwestern China as well as provide new insight into the demographic expansion of plants and maintaining high species diversity in this arid region.
Data Availability Statement
The data presented in the study are deposited in the National Center for Biotechnology Information (NCBI) repository, accession numbers, ON055439, ON055440, ON390854–ON390893.
Author Contributions
JL, PL, and X-MT conceived the ideas. GY and JL contributed to the sampling. GY performed the experiments and analyzed the data. GY, PL, and X-MT wrote the manuscript. C-XW, M-QX, and HC revised the manuscript and provided useful suggestions. All authors contributed to the article and approved the submitted version.
Funding
This research was supported by the National Natural Science Foundation of China (grant nos. 31970225 and 31760102), the Zhejiang Provincial Natural Science Foundation (LY19C030007), the “Xinjiang Key Laboratory of Special Species Conservation and Regulatory Biology,” and the “13th Five-Year” Plan for Key Discipline Biology, Xinjiang Normal University.
Conflict of Interest
The authors declare that the research was conducted in the absence of any commercial or financial relationships that could be construed as a potential conflict of interest.
Publisher’s Note
All claims expressed in this article are solely those of the authors and do not necessarily represent those of their affiliated organizations, or those of the publisher, the editors and the reviewers. Any product that may be evaluated in this article, or claim that may be made by its manufacturer, is not guaranteed or endorsed by the publisher.
Acknowledgments
We thank Wu-Qin Xu from Zhejiang University for helping with the analyses.
Supplementary Material
The Supplementary Material for this article can be found online at: https://www.frontiersin.org/articles/10.3389/fpls.2022.915526/full#supplementary-material
Footnotes
1. ^http://www.gov.cn/zhengce/zhengceku/2021-09/09/content_5636409.htm
2. ^https://www2.unil.ch/popgen/softwares/fstat.htm
3. ^https://web.stanford.edu/group/pritchardlab/structure_software/release_versions/v2.3.3/html/structure.html
4. ^http://taylor0.biology.ucla.edu/structureHarvester/
6. ^https://mafft.cbrc.jp/alignment/software
7. ^http://www.ub.edu/dnasp/index_v5.html
8. ^http://www.fluxus-engineering.com
9. ^http://cmpg.unibe.ch/software/arlequin3/
10. ^https://beast.community/2016-06-17_BEAST_v1.8.4_released.html
11. ^https://github.com/ddarriba/jmodeltest2/release/
12. ^https://github.com/beast-dev/tracer/
13. ^https://github.com/krmanik/Anki-xiehanzi/tree/v1.7.5
14. ^https://figtree-1-3-1.software.informer.com/1.3/
15. ^https://github.com/CompEvol/beast2/release/
16. ^https://biodiversityinformatics.amnh.org/open_source/maxent/
References
Alitong, Q., Wang, Q. F., Yang, C. F., and Chen, J. M. (2013). ISSR analysis on genetic diversity of medically important Lycium ruthenicum Murr. in Xinjiang. Plant Sci. 31, 517–524. doi: 10.3724/sp.J.1142.2013.50517
An, Z. S., Kutzbach, J. E., Prell, W. L., and Porter, S. C. (2001). Evolution of Asian monsoons and phased uplift of the Himalaya-Tibetan plateau since Late Miocene times. Nature 411, 62–66. doi: 10.1038/35075035
Avise, J. C. (2000). Phylogeography: The History and Formation of Species. Cambridge, MA: Harvard University Press.
Avise, J. C., and Hamrick, J. L. (1996). Conservation genetics: case histories from nature. J. Appl. Ecol. 34, 829–830. doi: 10.2307/2404927
Bandelt, H. J., Forster, P., and Rohl, A. (1999). Median-joining networks for inferring intraspecific phylogenies. Mol. Biol. Evol. 16, 37–48. doi: 10.1093/oxfordjournals.molbev.a026036
Borba, E. L., and Shepherd, G. J. (2001). Self-incompatibility, inbreeding depression and crossing potential in five brazilian Pleurothallis (Orchidaceae) species. Ann. Bot. 88, 89–99. doi: 10.1006/anbo.2001.1435
Bouckaert, R., Heled, J., Kühnert, D., Vaughan, T., Wu, C. H., Xie, D., et al. (2014). BEAST2: a software platform for Bayesian evolutionary analysis. PLoS Comput. Biol. 10:e1003537. doi: 10.1371/journal.pcbi.1003537
Chen, H. K., Cao, J. M., Ren, X., Huang, S. P., and Zhang, S. (2008b). Karyotype analysis of the chromosome of Lycium ruthenicum Murr. North. Hortic. 7, 207–209.
Chen, F. H., Yu, Z. C., Yang, M. L., Ito, E., Wang, S. M., Madsen, D. B., et al. (2008a). Holocene moisture evolution in arid Central Asia and its out-of-phase relationship with Asian monsoon history. Quat. Sci. Rev. 27, 351–364. doi: 10.1016/j.quascirev.2007.10.017
Chen, H. K., Zeng, L. Y., Yonezawa, T., Ren, X., and Zhong, Y. (2014). Genetic population structure of the desert shrub species Lycium ruthenicum inferred from chloroplast DNA. Pak. J. Bot. 46, 2121–2130.
Chen, J. H., Zhang, D. Z., Zhang, C., Xu, M. L., and Yin, W. L. (2017). Physiological characterization, transcriptomic profiling, and microsatellite marker mining of Lycium ruthenicum. J. Zhejiang Univ-Sc. B. 18, 1002–1021. doi: 10.1631/jzus.B1700135
Comes, H. P., and Kadereit, J. W. (1998). The effect of quaternary climatic changes on plant distribution and evolution. Trends Plant Sci. 3, 432–438. doi: 10.1016/s1360-1385(98)01327-2
Cun, Y. Z., and Wang, X. Q. (2010). Plant recolonization in the Himalaya from the southeastern Qinghai-Tibetan plateau: geographical isolation contributed to high population differentiation. Mol. Phylogenet. Evol. 56, 972–982. doi: 10.1016/j.ympev.2010.05.007
Dai, G. L., Qin, K., Cao, Y. L., Jiao, E. N., and Zhang, B. (2013). Characteristic of floral dynamic and breeding system of Lycium ruthenicum. Guihaia 33, 126–132. doi: 10.3969/j.issn.1000-3142.2013.01.023
Daniell, H., Lin, C. S., Yu, M., and Cheng, W. J. (2016). Chloroplast genomes: diversity, evolution, and applications in genetic engineering. Genome Biol. 17, 134–129. doi: 10.1186/s13059-016-1004-2
Darriba, D., Posada, D., Kozlov, A. M., Stamatakis, A., Morel, B., and Flouri, T. (2019). ModelTest-NG: a new and scalable tool for the selection of DNA andprotein evolutionary models. Mol. Biol. Evol. 37, 291–294. doi: 10.1093/molbev/msz189
Dong, J. Z., Yang, J. J., and Wang, Y. (2008). Resources of Lycium species and related research progress. Chin. J. Chin. Mater. Med. 18, 2020–2027. doi: 10.3321/j.issn:1001-5302.2008.18.003
Drummond, A. J., Suchard, M. A., and Xie, D. (2012). Bayesian phylogenetics with BEAUti and the BEAST v1.7. Mol. Biol. Evol. 29, 1969–1973. doi: 10.1093/molbev/mss075
Duan, Y. B., Yao, X. C., Zhu, J. B., Wang, C., Chen, X. H., Zhang, J. L., et al. (2015). Protective effects of Lycium ruthenicum murr on irradiated mice. Med. Plant 6, 40–43.
Evanno, G., Regnaut, S., and Goudet, J. (2005). Detecting the number of clusters of individuals using the software STRUCTURE: a simulation study. Mol. Ecol. 14, 2611–2620. doi: 10.1111/j.1365-294X.2005.02553.x
Excoffier, L., and Lischer, H. E. L. (2010). Arlequin suite ver 3.5: a new series of programs to perform population genetics analyses under Linux and Windows. Mol. Ecol. Resour. 10, 564–567. doi: 10.1111/j.1755-0998.2010.02847.x
Fawcett, T. (2006). An introduction to ROC analysis. Pattern Recogn. Lett. 27, 861–874. doi: 10.1016/j.patrec.2005.10.010
Fu, Y. X. (1997). Statistical tests of neutrality of mutations against population growth, hitchhiking and background selection. Genetics 147, 915–925. doi: 10.1017/S0016672397002966
Gilbert, K. J., Andrew, R. L., Bock, D. G., Franklin, M., Kane, N. C., Jé, M., et al. (2012). Recommendations for utilizing and reporting population genetic analyses: the reproducibility of genetic clustering using the program STRUCTURE. Mol. Ecol. 21, 4925–4930. doi: 10.1111/j.1365-294X.2012.05754.x
Goudet, J. (2001). FSTAT, a program to estimate and test gene diversities and xation indices (version 2.9.3). Available at: http://www2.unil.ch/popgen/softwares/fstat.htm (Accessed June 1, 2021).
Guo, Z. T., Ruddiman, W. F., Hao, Q. Z., Wu, H. B., Qiao, Y. S., Zhu, R. X., et al. (2002). Onset of Asian desertification by 22 myr ago inferred from loess deposits in China. Nature 416, 159–163. doi: 10.1038/416159a
Hamrick, J. L. (1982). Plant population genetics and evolution. Am. J. Bot. 69, 1685–1693. doi: 10.1002/j.1537-2197.1982.tb13421.x
Hamrick, J. L., and Godt, M. J. W. (1996). Effects of life history traits on genetic diversity in plant species. Philos. Trans. R Soc. Lond. B Biol. Sci. 351, 1291–1298. doi: 10.2307/56204
Harrison, T. M., Copeland, P., Kidd, W. S. F., and Yin, A. (1992). Raising Tibet. Science 255, 1663–1670. doi: 10.1126/science.255.5052.1663
Hedrick, P. W. (2004). Recent developments in conservation genetics. For. Ecol. Manag. 197, 3–19. doi: 10.1016/j.foreco.2004.05.002
Hewitt, G. M. (1996). Some genetic consequences of ice ages, and their role in divergence and speciation. Biol. J. Linn. Soc. 58, 247–276. doi: 10.1111/j.1095-8312.1996.tb01434.x
Hewitt, G. M. (2000). The genetic legacy of the quaternary ice ages. Nature 405, 907–913. doi: 10.1038/35016000
Hewitt, G. M. (2004). Genetic consequences of climatic oscillations in the quaternary. Philos. Trans. R Soc. Lond. B Biol. Sci. 359, 183–195. doi: 10.1098/rstb.2003.1388
Hijmans, R. J., Cameron, S. E., Parra, J. L., Jones, P. G., and Jarvis, A. (2005). Very high resolution interpolated climate surfaces for global land areas. Int. J. Climatol. 25, 1965–1978. doi: 10.1002/joc.1276
Hitchcock, C. L. (1932). A monographic study of the genus Lycium of the western hemisphere. Ann. Missouri. Bot. Gard. 19, 179–374. doi: 10.2307/2394155
Hu, N., Zheng, J., Li, W. C., and Suo, Y. R. (2014). Isolation, stability and antioxidant activity of anthocyanins from Lycium ruthenicum Murray and Nitraria Tangutorum Bobr of Qinghai-Tibetan plateau. Sep. Sci. Technol. 49, 2897–2906. doi: 10.1080/01496395.2014.943770
Hudson, R. R. (1990). Gene genealogies and the coalescent process. Oxford Surv. Evol. Biol. 7, 1–44.
Jiang, X. L., Zhang, M. L., Zhang, H. X., and Sanderson, S. C. (2014). Phylogeographic patterns of the Aconitum nemorum species group (Ranunculaceae) shaped by geological and climatic events in the Tianshan Mountains and their surroundings. Plant Syst. Evol. 300, 51–61. doi: 10.1007/s00606-013-0859-x
Katoh, K., and Standley, D. M. (2013). MAFFT multiple sequence alignment software version 7: improvements in performance and usability. Mol. Biol. Evol. 30, 772–780. doi: 10.1093/molbev/mst010
Khanum, R., Mumtaz, A. S., and Kumar, S. (2013). Predicting impacts of climate change on medicinal asclepiads of Pakistan using Maxent modeling. Acta Oecol. 49, 23–31. doi: 10.1016/j.actao.2013.02.007
Lei, C. Y., Peng, M. Z., and Liu, C. (2021). The review of ecological and economic values of halophyte medicinal plant Lycium ruthenicum. Chinese Wild Plant Resour. 40, 55–60. doi: 10.3969/j.issn.1006–9690.2021.07.011
Levin, R. A., and Miller, J. S. (2021). Molecular signatures of long-distance oceanic dispersal and the colonization of Pacific islands in Lycium carolinianum. Am. J. Bot. 108, 694–710. doi: 10.1002/ajb2.1626
Li, X. H., Shao, J. W., Lu, C., Zhang, X. P., and Qiu, Y. X. (2012). Chloroplast phylogeography of a temperate tree Pteroceltis tatarinowii (Ulmaceae) in China. J. Syst. Evol. 50, 325–333. doi: 10.1111/j.1759-6831.2012.00203.x
Librado, P., and Rozas, J. (2009). DnaSP v5: a software for comprehensive analysis of DNA polymorphism data. Bioinformatics 25, 1451–1452. doi: 10.1093/bioinformatics/btp187
Liu, X. D., Dong, B. W., Yin, Z. Y., Smith, R. S., and Guo, Q. C. (2019). Continental drift, plateau uplift, and the evolutions of monsoon and arid regions in Asia, Africa, and Australia during the Cenozoic. Sci. China Earth Sci. 62, 1053–1075. doi: 10.1007/s11430-018-9337-8
Liu, J. Q., Duan, Y. W., Hao, G., Ge, X. J., and Sun, H. (2014a). Evolutionary history and underlying adaptation of alpine plants on the Qinghai–Tibet Plateau. J. Syst. Evol. 52, 241–249. doi: 10.1111/jse.12094
Liu, Z. G., Shu, Q. Y., Wang, L., Yu, M. F., Hu, Y. P., Zhang, H. G., et al. (2012a). Genetic diversity of the endangered and medically important Lycium ruthenicum Murr. revealed by sequence-related amplified polymorphism (SRAP) markers. Biochem. Syst. Ecol. 45, 86–97. doi: 10.1016/j.bse.2012.07.017
Liu, J. Q., Sun, Y. S., Ge, X. J., Gao, L. M., and Qiu, Y. X. (2012b). Phylogeographic studies of plants in China: advances in the past and directions in the future. J. Syst. Evol. 50, 267–275. doi: 10.1111/j.1759-6831.2012.00214.x
Liu, Y. L., Zeng, S. H., Sun, W., Wu, M., Hu, W. M., Shen, X. F., et al. (2014b). Comparative analysis of carotenoid accumulation in two goji (Lycium barbarum L. and L. ruthenicum murr.) fruits. BMC Plant Biol. 14, 269–282. doi: 10.1186/s12870-014-0269-4
Ma, S. M., Zhang, M. L., and Sanderson, S. C. (2012). Phylogeography of the rare Gymnocarpos przewalskii (Caryophyllaceae): indications of multiple glacial refugia in North-Western China. Aust. J. Bot. 60, 20–31. doi: 10.1071/BT11055
Meng, H. H., Gao, X. Y., Huang, J. F., and Zhang, M. L. (2015). Plant phylogeography in arid Northwest China: retrospectives and perspectives. J. Syst. Evol. 53, 33–46. doi: 10.1111/jse.12088
Meng, L. H., Yang, R., Abbott, R. J., Miehe, G., Hu, T. H., and Liu, J. Q. (2007). Mitochondrial and chloroplast phylogeography of Picea crassifolia Kom. (Pinaceae) in the Qinghai-Tibetan plateau and adjacent highlands. Mol. Ecol. 16, 4128–4137. doi: 10.1111/j.1365-294x.2007.03459.x
Meng, H. H., and Zhang, M. L. (2011). Phylogeography of Lagochilus ilicifolius (Lamiaceae) inrelation to quaternary climatic oscillation and aridification in northern China. Biochem. Syst. Ecol. 39, 787–796. doi: 10.1016/j.bse.2011.07.015
Meng, H. H., and Zhang, M. L. (2013). Diversification of plant species in arid Northwest China: species-level phylogeographical history of Lagochilus Bunge ex Bentham (Lamiaceae). Mol. Phylogenet. Evol. 68, 398–409. doi: 10.1016/j.ympev.2013.04.012
Miao, Y. F., Herrmann, M., Wu, F. L., Yan, X. L., and Yang, S. L. (2012). What controlled mid-late Miocene long-term aridification in Central Asia?—Global cooling or Tibetan Plateau uplift: A review. Earth Sci. Rev. 112, 155–172. doi: 10.1016/j.earscirev.2012.02.003
Muellner-Riehl, A. N. (2019). Mountains as evolutionary arenas: patterns, emerging approaches, paradigm shifts, and their implications for plant phylogeographic research in the Tibeto-Himalayan region. Front. Plant Sci. 10:195. doi: 10.3389/fpls.2019.00195
Myers, N., Mittermeier, R. A., Mittermeier, C. G., da Fonseca, G. A. B., and Kent, J. (2000). Biodiversity hotspots for conservation priorities. Nature 403, 853–858. doi: 10.1038/35002501
Phillips, S. J., Anderson, R. P., and Schapire, R. E. (2006). Maximum entropy modeling of species geographic distributions. Ecol. Model. 190, 231–259. doi: 10.1016/j.ecolmodel.2005.03.026
Pons, O., and Petit, R. J. (1996). Measuring and testing genetic differentiation with ordered versus unordered alleles. Genetics 144, 1237–1245. doi: 10.1093/genetics/144.3.1237
Promnun, P., Tandavanitj, N., Kongrit, C., Kongsatree, K., Kongpraphan, P., Dongkumfu, W., et al. (2021). Phylogeography and ecological niche modeling reveal evolutionary history of Leiolepis ocellata (Squamata, Leiolepidae). Ecol. Evol. 11, 2221–2233. doi: 10.1002/ece3.7186
Qiu, Y. X., Fu, C. X., and Comes, H. P. (2011). Plant molecular phylogeography in China and adjacent regions: tracing the genetic imprints of quaternary climate and environmental change in the world’s most diverse temperate flora. Mol. Phylogenet. Evol. 59, 225–244. doi: 10.1016/j.ympev.2011.01.012
Rogers, A. R., and Harpending, H. (1992). Population growth makes waves in the distribution of pairwise genetic differences. Mol. Biol. Evol. 9, 552–569. doi: 10.1093/oxfordjournals.molbev.a040727
Särkinen, T., Bohs, L., Olmstead, R. G., and Knapp, S. (2013). A phylogenetic framework for evolutionary study of the nightshades (Solanaceae): a dated 1000-tip tree. BMC Evol. Biol. 13, 214–215. doi: 10.1186/1471-2148-13-214
Savage, A. E., and Miller, J. S. (2006). Gametophytic self-incompatibility in Lycium parishii (Solanaceae): allelic diversity, genealogical structure, and patterns of molecular evolution at the S-RNase locus. Heredity 96, 434–444. doi: 10.1038/sj.hdy.6800818
Schuelke, M. (2000). An economic method for the fluorescent labeling of PCR fragments. Nat. Biotechnol. 18, 233–234. doi: 10.1038/72708
Shaw, J., Lickey, E. B., Beck, J. T., Farmer, S. B., Liu, W., Miller, J., et al. (2005). The tortoise and the hare ii: relative utility of 21 noncoding chloroplast DNA sequences for phylogenetic analysis. Am. J. Bot. 92, 142–166. doi: 10.3732/ajb.92.1.142
Shaw, J., Lickey, E., Schilling, E., and Small, R. (2007). Comparison of whole chloroplast genome sequences to choose noncoding regions for phylogenetic studies in angiosperms: the tortoise and the hare III. Am. J. Bot. 94, 275–288. doi: 10.3732/ajb.94.3.275
Shen, L., Chen, X. Y., Li, Y. Y., Shen, L., Chen, X. Y., and Li, Y. Y. (2002). Glacial refugia and postglacial recolonization patterns of organisms. Acta Ecol. Sin. 22, 1983–1990. doi: 10.3321/j.issn:1000-0933.2002.11.026
Shi, X. J., and Zhang, M. L. (2015). Phylogeographical structure inferred from cpDNA sequence variation of Zygophyllum xanthoxylon across north-west China. J. Plant Res. 128, 269–282. doi: 10.1007/s10265-014-0699-y
Spicer, R. A., Harris, N. B. W., Widdowson, M., Herman, A. B., Guo, S. X., Valdes, P. J., et al. (2003). Constant elevation of southern Tibet over the past 15 million years. Nature 421, 622–624. doi: 10.1038/nature01356
Su, Z. H., Lu, W., and Zhang, M. L. (2016). Phylogeographical patterns of two closely related desert shrubs, Nitraria roborowskii and N. sphaerocarpa (Nitrariaceae), from arid north-western China. Bot. J. Linn. Soc. 180, 334–347. doi: 10.1111/boj.12376
Su, Z., and Zhang, M. (2013). Evolutionary response to quaternary climate aridification and oscillations in north-western China revealed by chloroplast phylogeography of the desert shrub Nitraria sphaerocarpa (Nitrariaceae). Biol. J. Linn. Soc. 109, 757–770. doi: 10.1111/bij.12088
Su, Z. H., and Zhang, M. L. (2014). A range wide geographic pattern of genetic diversity and population structure of Hexinia polydichotoma (Asteraceae) in Tarim Basin and adjacent areas. Biochem. Syst. Ecol. 56, 49–59. doi: 10.1016/j.bse.2014.04.005
Su, Z. H., Zhang, M. L., and Sanderson, S. C. (2011). Chloroplast phylogeography of Helianthemum songaricum (Cistaceae) from northwestern China: implications for preservation of genetic diversity. Conserv. Genet. 12, 1525–1537. doi: 10.1007/s10592-011-0250-9
Swets, J. A. (1988). Measuring the accuracy of diagnostic systems. Science 240, 1285–1293. doi: 10.1126/science.3287615
Taberlet, P., Fumagalli, L., Wust-Saucy, A. G., and Cosson, J. F. (1998). Comparative phylogeography and postglacial colonization routes in Europe. Mol. Ecol. 7, 453–464. doi: 10.1046/j.1365-294x.1998.00289.x
Tajima, F. (1989). Statistical method for testing the neutral mutation hypothesis by DNA polymorphism. Genetics 123, 585–595. doi: 10.1101/gad.3.11.1801
Tian, B., Zhao, J., Zhang, M., Chen, Z., and Li, J. (2021). Lycium ruthenicum anthocyanins attenuate high-fat diet-induced colonic barrier dysfunction and inflammation in mice by modulating the gut microbiota. Mol. Nutr. Food Res. 65, e2000745–e2000716. doi: 10.1002/mnfr.202000745
Wang, M. Z., Li, Y. L., Liu, J. H., Zhang, L. F., Xiao-Rong, A., Zhou, J. J., et al. (2021). Effect of anthocyanidin of Lycium ruthenicum Murry from Qinghai Tibet plateau on the proliferation and autophagy of HepG2 cells. Nat. Prod. Res. Dev. 33, 79–88. doi: 10.16333/j.1001-6880.2021.1.011
Wang, P., Zhang, X. Z., Tang, N., Liu, J. J., Xu, L. R., and Wang, K. (2016a). Phylogeography of Libanotis buchtormensis (Umbelliferae) in disjunct populations along the deserts in Northwest China. PLoS One 11:e10159790. doi: 10.1371/journal.pone.0159790
Wang, Q., Zhang, M. L., and Yin, L. K. (2016b). Phylogeographic structure of a Tethyan relict capparis spinosa (Capparaceae) traces pleistocene geologic and climatic changes in the western Himalayas, Tianshan Mountains, and adjacent desert regions. Biomed. Res. Int. 2016:5792708. doi: 10.1155/2016/5792708
Wang, J., Zhao, B. H., Jing, M. Y., Shang, J., and Zhao, H. J. (2019). Rapid propagation system of wild Lycium ruthenicum. North. Hortic. 24, 118–123. doi: 10.11937/bfyy.20191641
Willis, K. J., and Niklas, K. J. (2004). The role of quaternary environmental change in plant macroevolution: the exception or the rule? Philos. Trans. R. Soc. B 359, 159–172. doi: 10.1098/rstb.2003.1387
Wolfe, K. H., Li, W. H., and Sharp, P. M. (1987). Rates of nucleotide substitution vary greatly among plant mitochondrial, chloroplast and nuclear DNAs. Proc. Natl. Acad. Sci. U. S. A. 84, 9054–9058. doi: 10.1073/pnas.84.24.9054
Wu, L. L., Cui, X. K., Milne, R. I., Sun, Y. S., and Liu, J. Q. (2010). Multiple autopolyploidizations and range expansion of Allium przewalskianum regel. (Alliaceae) in the Qinghai-Tibetan plateau. Mol. Ecol. 19, 1691–1704. doi: 10.1111/j.1365-294X.2010.04613.x
Xie, K. Q., and Zhang, M. L. (2013). The effect of quaternary climatic oscillations on Ribes meyeri (Saxifragaceae) in northwestern China. Biochem. Syst. Ecol. 50, 39–47. doi: 10.1016/j.bse.2013.03.031
Xu, Z., and Zhang, M. L. (2015). Phylogeography of the arid shrub Atraphaxis frutescens (Polygonaceae) in northwestern China: evidence from cpDNA sequences. J. Hered. 106, 184–195. doi: 10.1093/jhered/esu078
Yang, X., and Scuderi, L. A. (2010). Hydrological and climatic changes in deserts of China since the late Pleistocene. Quatern. Res. 73, 1–9. doi: 10.1016/j.yqres.2009.10.011
Yin, H. X., Yan, X., Shi, Y., Qian, C., Li, Z., Zhang, W., et al. (2015). The role of east Asian monsoon system in shaping population divergence and dynamics of a constructive desert shrub Reaumuria soongarica. Sci. Rep. 5, 1–14. doi: 10.1038/srep15823
Zeng, Y. F., Zhang, J. G., Abuduhamiti, B., Wang, W. T., and Jia, Z. Q. (2018). Phylogeographic patterns of the desert poplar in Northwest China shaped by both geology and climatic oscillations. BMC Evol. Biol. 18:75. doi: 10.1186/s12862-018-1194-1
Zhang, M. L., and Fritsch, P. W. (2010). Evolutionary response of Caragana (Fabaceae) to Qinghai-Tibetan plateau uplift and Asian interior aridification. Plant Syst. Evol. 288, 191–199. doi: 10.1007/s00606-010-0324-z
Zhang, H. X., Li, X. S., Wang, J. C., and Zhang, D. Y. (2020). Insights into the aridification history of central Asian mountains and international conservation strategy from the endangered wild apple tree. J. Biogeogr. 48, 332–344. doi: 10.1111/jbi.13999
Zhang, H. X., and Zhang, M. L. (2012). Genetic structure of the Delphinium naviculare species group tracks Pleistocene climatic oscillations in the Tianshan Mountains, arid Central Asia. Palaeogeogr. Palaeocl. 353-355, 93–103. doi: 10.1016/j.palaeo.2012.07.013
Zhang, H. X., Zhang, M. L., and Sanderson, S. C. (2016). Spatial genetic structure of forest and xerophytic plant species in arid eastern Central Asia: insights from comparative phylogeography and ecological niche modelling. Biol. J. Linn. Soc. 120, 612–625. doi: 10.1111/bij.12903
Zhang, H. X., Zhang, M. L., and Williams, D. M. (2014). Genetic evidence and species distribution modelling reveal the response of Larix sibirica and its related species to quaternary climatic and ancient historical events. Biochem. Syst. Ecol. 54, 316–325. doi: 10.1016/j.bse.2014.02.017
Zhao, S. S., Li, S., Luo, Z. H., and Zhou, Z. Q. (2021). Bioactive phenylpropanoid derivatives from the fruits of Lycium ruthenicum Murr. Bioorg. Chem. 116:105307. doi: 10.1016/j.bioorg.2021.105307
Zhao, Y. F., Zhang, H. X., Pan, B. R., and Zhang, M. L. (2019). Intraspecific divergences and phylogeography of Panzerina lanata (Lamiaceae) in Northwest China. Peer J. 7, 62–64. doi: 10.7717/peerj.6264
Keywords: phylogeography, desert plants, Lycium ruthenicum, genetic structure, quaternary
Citation: Yisilam G, Wang C-X, Xia M-Q, Comes HP, Li P, Li J and Tian X-M (2022) Phylogeography and Population Genetics Analyses Reveal Evolutionary History of the Desert Resource Plant Lycium ruthenicum (Solanaceae). Front. Plant Sci. 13:915526. doi: 10.3389/fpls.2022.915526
Edited by:
Daniel Pinero, National Autonomous University of Mexico, MexicoReviewed by:
Jinlong Zhang, Kadoorie Farm and Botanic Garden, Hong Kong SAR, ChinaEduardo Ruiz-Sanchez, University of Guadalajara, Mexico
Copyright © 2022 Yisilam, Wang, Xia, Comes, Li, Li and Tian. This is an open-access article distributed under the terms of the Creative Commons Attribution License (CC BY). The use, distribution or reproduction in other forums is permitted, provided the original author(s) and the copyright owner(s) are credited and that the original publication in this journal is cited, in accordance with accepted academic practice. No use, distribution or reproduction is permitted which does not comply with these terms.
*Correspondence: Jin Li, xjcjlj4@xjnu.edu.cn; Xin-Min Tian, tianxm06@lzu.edu.cn