 Jingyang Tong1
 Cong Zhao1
 Mengjing Sun1
 Luping Fu1Jie Song1Dan Liu1Yelun Zhang2Jianmin Zheng3Zongjun Pu3Lianzheng Liu4
 Awais Rasheed5,6
 Ming Li1
 Xianchun Xia1
 Zhonghu He1,5*
 Yuanfeng Hao1*
- 1Institute of Crop Sciences, Chinese Academy of Agricultural Sciences, Beijing, China
- 2The Key Laboratory of Crop Genetics and Breeding of Hebei Province, Institute of Cereal and Oil Crops, Hebei Academy of Agricultural and Forestry Sciences, Shijiazhuang, China
- 3Crop Research Institute, Sichuan Academy of Agricultural Sciences, Chengdu, China
- 4Research Institute of Grain Crops, Xinjiang Academy of Agricultural Sciences, Urumqi, China
- 5International Maize and Wheat Improvement Center (CIMMYT) China Office, Beijing, China
- 6Department of Plant Sciences, Quaid-i-Azam University, Islamabad, Pakistan
Biofortification is a sustainable strategy to alleviate micronutrient deficiency in humans. It is necessary to improve grain zinc (GZnC) and iron concentrations (GFeC) in wheat based on genetic knowledge. However, the precise dissection of the genetic architecture underlying GZnC and GFeC remains challenging. In this study, high-resolution genome-wide association studies were conducted for GZnC and GFeC by three different models using 166 wheat cultivars and 373,106 polymorphic markers from the wheat 660K and 90K single nucleotide polymorphism (SNP) arrays. Totally, 25 and 16 stable loci were detected for GZnC and GFeC, respectively. Among them, 17 loci for GZnC and 8 for GFeC are likely to be new quantitative trait locus/loci (QTL). Based on gene annotations and expression profiles, 28 promising candidate genes were identified for Zn/Fe uptake (8), transport (11), storage (3), and regulations (6). Of them, 11 genes were putative wheat orthologs of known Arabidopsis and rice genes related to Zn/Fe homeostasis. A brief model, such as genes related to Zn/Fe homeostasis from root uptake, xylem transport to the final seed storage was proposed in wheat. Kompetitive allele-specific PCR (KASP) markers were successfully developed for two major QTL of GZnC on chromosome arms 3AL and 7AL, respectively, which were independent of thousand kernel weight and plant height. The 3AL QTL was further validated in a bi-parental population under multi-environments. A wheat multidrug and toxic compound extrusion (MATE) transporter TraesCS3A01G499300, the ortholog of rice gene OsPEZ2, was identified as a potential candidate gene. This study has advanced our knowledge of the genetic basis underlying GZnC and GFeC in wheat and provides valuable markers and candidate genes for wheat biofortification.
Introduction
Zinc (Zn) and iron (Fe), serving as co-factors for a multitude of enzymes and regulatory peptides in critical metabolic processes, are essential micronutrients for the plant growth and human health (Hänsch and Mendel, 2009). Due to monotonous diet and heavy relying on cereal edible parts with suboptimal micronutrient levels, Zn and Fe deficiencies have become the most common public health problem in the world, especially for pregnant women and young children due to their increased demands for micronutrients (Bhati et al., 2016; Vasconcelos et al., 2017). Increasing intrinsic micronutrients in the edible parts of crops, known as biofortification, is regarded as the most cost-effective and sustainable intervention to alleviate Zn and Fe malnutrition in humans (Gómez-Galera et al., 2010). Common wheat (Triticum aestivum L.) as a staple food crop, supplying approximately 20% of daily calories and protein, and main source of essential micronutrients, such as Zn and Fe, is recognized as an attractive crop for biofortification (Ludwig and Slamet-Loedin, 2019). For nutritionally sufficient wheat Zn and Fe biofortification, the concentrations of Fe and Zn in whole grains have to, respectively, reach 37 and 59 mg/kg, about 50% higher than the average concentrations of popular wheat cultivars (Bouis et al., 2011). However, breeding elite cultivars with enhanced Zn/Fe content is quite challenging due to the obscurity of genetic architecture and molecular processes regulating the Zn/Fe homeostasis in wheat, which greatly hampers the implements of modern breeding technologies, such as marker-assisted selection (MAS) and genomic selection (GS) (Gupta et al., 2021).
To improve our understanding of the genetic basis of wheat grain Zn and Fe, identification of as many causal loci as possible is imperative (Tong et al., 2020). In recent years, diverse bi-parental populations have been used to identify quantitative trait locus/loci (QTL) associated with grain Zn (GZnC) and Fe concentrations (GFeC) in common wheat and its relative species (Tong et al., 2020; Gupta et al., 2021). These QTL from different studies have been integrated into a consensus map according to the physical positions of their linked markers, and provide a valuable resource for dissection of the genetic architecture underlying GZnC and GFeC (Tong et al., 2020). Nevertheless, the family based bi-parental populations usually have limited number of recombination events and low genetic diversity, thus low-mapping resolution and may be unable to provide a full genome-wide genetic landscape of complex traits (Korte and Farlow, 2013; Platten et al., 2019). As a complementary strategy to QTL mapping, a genome-wide association study (GWAS) is a powerful tool to detect the genetic regions underlying complex traits using the historical abundant crossovers and genetic variations accumulated in natural wheat germplasms (Hamblin et al., 2011). A number of genetic loci associated with GZnC and GFeC have been identified by GWAS in wheat recently (Tong et al., 2020; Gupta et al., 2021). However, large gaps in the genetic map due to low marker number and density were generally found, which greatly hindered precision in the dissection of the GZnC and GFeC traits (Korte and Farlow, 2013).
With the rapid development of next-generation sequencing (NGS) technology, high-density single nucleotide polymorphism (SNP) genotyping arrays have been developed in wheat (reviewed in Rasheed et al., 2017). For example, the Wheat Axiom 660K SNP array with more than half a million markers enables high marker resolution, large genome coverage, and low heterozygosity (Sun et al., 2020). GWAS using such high density SNPs will make it possible to obtain a large number of associated loci within very small intervals and consequently facilitate the candidate gene discovery and genetic dissection of complex traits (Yano et al., 2016; Pang et al., 2020). The mixed linear model (MLM), the fixed and random model circulating probability unification (FarmCPU), and the multiple loci mixed linear model (MLMM) in different strengths for each have been adopted to effectively control the population structure and to ensure the accuracy and reliability of significantly associated loci. It is appropriate to adopt multiple models simultaneously to conduct the GWAS for genetic dissection of complex traits (Peng et al., 2018; Alqudah et al., 2020).
In the current study, a diverse panel of 166 representative wheat accessions was chosen from elite germplasm and was genotyped with the wheat 660K and 90K SNP arrays. GWASs were carried out using three different models for GZnC and GFeC across multiple environments. Furthermore, plant height (PH), thousand kernel weight (TKW), and grain areas (GA) were investigated to study their associations with GZnC/GFeC and identify pleiotropic loci. The study aimed to (1) dissect the genetic architecture of GZnC and GFeC, (2) identify associated markers, loci, and candidate genes, and (3) develop high-throughput kompetitive allele-specific PCR (KASP) markers and validate the major QTL for wheat biofortification.
Materials and Methods
Plant Material and Field Trials
The association panel consists of 166 representative wheat cultivars, such as 144 accessions from Yellow and Huai Valley, the major wheat zone in China, and 22 from five other countries (Supplementary Table 1). The panel was used in our previous studies on black point (Liu et al., 2017), flour color and polyphenol oxidase (PPO) activity (Zhai et al., 2018, 2020), grain yield related traits (Li et al., 2019), and water-soluble carbohydrate contents (Fu et al., 2020). In this study, the panel was grown in randomized complete blocks with two replications in four environments comprising Beijing (39°56′N, 116°20′E), Gaoyi (37°33′N, 114°26′E), and Shijiazhuang (37°27′N, 113°30′E) in Hebei province, and Urumqi (42°45′N, 86°37′E) in Xinjiang province during the 2019–2020 cropping season. These environments were designated as 20BJ, 20GY, 20SJZ, and 20XJ hereafter, respectively. Each entry with approximately 40–50 grains was grown in 1.0 m long row with an inter-row spacing of 20.0 cm. Standard agronomic practices were performed at each location, along with soil application of 25 kg/ha ZnSO4.7H2O granular fertilizer (Sinochem Group Co., Ltd., Beijing, China) in 20GY and 20SJZ over three crop cycles prior to this experiment to enrich the available soil Zn and minimize heterogeneity. The green manure returning was routinely practiced in Beijing and field soil held sufficient Zn intrinsically, so that additional Zn fertilizer was not applied in 20BJ. To investigate GZnC and GFeC in a low-Zn environment, 20XJ was set without soil Zn fertilizer application.
Phenotype Determination and Statistical Analyses
Plant materials were hand-harvested in the field and completely dried grains were hand-threshed and cleaned carefully to avoid the potential contamination of mineral element. Approximately 15 g of each sample was subjected to GZnC and GFeC analyses with an X-ray fluorescence spectrometry (EDXRF) instrument (model X-Supreme 8000, Oxford Instruments plc.), following the protocol of high-throughput screening of micronutrients in whole-wheat grain (Paltridge et al., 2012). PH, TKW, and GA in all environments were investigated following Xu et al. (2019).
ANOVA, Pearson’s correlation analysis, and Student’s t-test were conducted using the SAS 9.4 software (SAS institute, Cary, NC, United States). Broad-sense heritabilities (H2) were calculated using the following equation (Holland et al., 2003):
where σ2g indicates the variance of genotypes, σ2ge and σ2ε represent the variances of genotype × environment interaction and errors, and e and r are the numbers of environments and replicates in each environment, respectively. For each trait, a best linear unbiased estimation (BLUE) using a linear model for each accession was calculated across environments by the QTL IciMapping v4.1 software (Yin et al., 2015).
Genotyping and Physical Map Construction
Genomic DNA was extracted following the CTAB method (Murray and Thompson, 1980) and the population was genotyped by the Illumina wheat 90K (such as, 81,587 SNPs) and Affymetrix wheat 660K (such as, 630,517 SNPs) SNP arrays by CapitalBio Technology Co., Ltd, Beijing, China.1 Markers with minor allele frequency (MAF) < 5.0% and missing data containing heterozygous genotypes > 20.0% were filtered out and the same final 373,106 high-quality polymorphic SNPs were obtained (Fu et al., 2020). These markers included 359,760 (96.4%) from the 660K and 13,346 (3.6%) from 90K SNP array, indicating SNPs in wheat 90K array have relatively low polymorphisms in Chinese cultivars. Flanking sequences of SNP markers were used for BLAST analysis against IWGSC RefSeq v.1.0,2 to obtain physical positions in accordance with the best BLAST hit results. Eventually these markers were integrated into one consensus map, covering a total physical distance of 13.7 Gb, accounting for about 95% of wheat whole genome sequences, and were further utilized for GWAS. Relevant information is available in our previous studies (Liu et al., 2017; Fu et al., 2020).
Genome-Wide Association Study
The 166 accessions were classified into three subpopulations by the population structure using Structure v2.3.4 (Liu et al., 2017). The average linkage disequilibrium (LD) decay distances for A, B, D, and whole genomes were approximately 6, 4, 11, and 8 Mb, respectively (Liu et al., 2017). In this study, GWAS was conducted for each environment and BLUE values of GZnC across 20GY, 20SJZ, and 20BJ. The site 20XJ was excluded from the analysis owning to relatively low Pearson’s correlation coefficients with other environments (data not shown). The low Pearson’s correlation was possibly attributed to soil Zn content heterogeneity in 20XJ with null Zn fertilizer application (Velu et al., 2018). As for GFeC, GWAS was carried out across all four environments and BLUE values. Three models, MLM (Q + K), FarmCPU, and MLMM, were employed for the GWAS in GAPIT a software package operating in R v3.5.13 (Tang et al., 2016). To maximize chances of identifying all possible QTL, a threshold of p = 1.0 × 10⁻³ (−log10 (p) = 3.0) was set for the significance of marker-trait associations (MTAs). To control the false discovery rate (FDR) at an appropriate level, those detected in three or more environments (BLUE value was regarded as one environment hereafter) by any of the three models were considered as reliable MTAs (Fu et al., 2020). MTAs detected in the same LD block or physically closely linked were grouped into a single QTL, and the distance between the two very far flanking markers was seen as the QTL interval. The most significant MTA with the lowest value of p across environments in this interval was selected as the representative marker, and its R2 output by MLM was used to reflect the proportion of phenotypic variance explained (Fu et al., 2020). Manhattan and quantile–quantile (Q–Q) plots were generated using the CMplot package in R v3.5.1 software.4
Candidate Gene Identification
According to the gene annotations from IWGSC RefSeq v.1.0 and putative homologs in the UniProt database,5 the genes located in or adjacent to the physical intervals of QTL identified in this study were subjected to be screened as follows. (1) Those related to the molecular processes in Zn/Fe homeostasis, such as metal uptake in the root, transport in the xylem and phloem, storage in seeds, and regulatory factors, were predicted to be potential candidates; (2) analysis of orthologs between wheat and model plants was carried out to obtain candidate genes in Triticeae-Gene Tribe browser6 (Chen et al., 2020) with most of the genes collected in Tong et al. (2020); (3) haplotype analysis was performed within Wheat SnpHub Portal7 for 641 accessions with known genome sequences (Hao et al., 2020; Wang et al., 2020), and the genes without sequence variation were removed from candidacy. The most promising candidate genes were eventually selected. The database expVIP8 was used to investigate spatio-temporal transcriptional dynamics of candidate genes, providing expression profiles of these genes across tissues and developmental stages (Ramírez-González et al., 2018).
Kompetitive Allele-Specific PCR Marker Development and Quantitative Trait Locus/Loci Validation
The representative markers for 3AL and 7AL QTL were chosen and converted to KASP markers. Chromosome-specific primers were designed using Polymarker9 (Ramirez-Gonzalez et al., 2015) and KASP assays were performed following Xu et al. (2020). The KASP markers were successfully converted when their genotypic results were the same as the original SNP arrays. The 146 F6 recombinant inbred lines (RILs) developed from a cross between two modern wheat cultivars Zhongmai 175 and Lunxuan 987 (shorten as ZM175/LX987) with significantly different GZnC were used as validation population for the target QTL. GZnC was determined in the bi-parental population in the same way as mentioned earlier in the natural population. Student’s t-tests were conducted to verify allelic effects based on the phenotypic data from the bi-parental population. For the candidate gene of QTL, its variations between ZM175 and LX987 were extracted from the genome resequencing database at Wheat SnpHub Portal (see text footnote 7; Hao et al., 2020; Wang et al., 2020).
Results
Phenotypic Variations
A wide range of continuous variations of GZnC and GFeC were observed for the 166 accessions across all environments with near-normal distributions (Supplementary Figures 1, 2). The BLUE values for GZnC and GFeC were 29.25–50.98 mg/kg and 39.86–54.66 mg/kg with mean values of 38.03 and 45.97 mg/kg, respectively (Table 1). In all the accessions, six cultivars with the highest values for GZnC and GFeC were selected with the BLUE values greater than 50 mg/kg and stable performance across the environments (Supplementary Figure 3). Yumai2 and Xinong1376 were the cultivars with both high GZnC and GFeC. Significant correlations (r) between environments were observed for both GZnC and GFeC (Supplementary Figure 4). The results of ANOVA revealed that the factors of genotypes, environments, and G × E interactions markedly affect the GZnC and GFeC (Supplementary Table 2). Broad sense heritabilities (H2) of GZnC and GFeC were 0.71 and 0.72, respectively, indicating a determinant role of genetic factors for phenotypic variations (Table 1). A significant and positive correlation was found between GZnC and GFeC based on BLUE values (r = 0.45, p < 0.0001). GFeC was positively correlated with PH (r = 0.35, p < 0.0001), whereas GZnC was not (Supplementary Figure 4). TKW was positively correlated with GA and negatively correlated with PH, and appeared not to be correlated with either GZnC or GFeC.
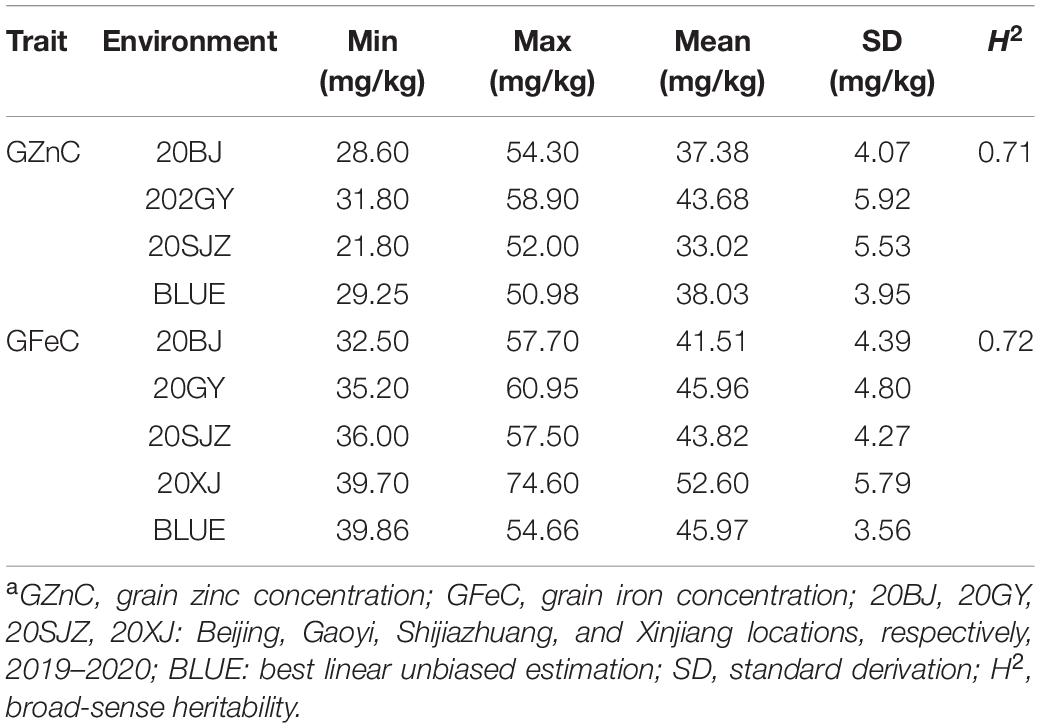
Table 1. The phenotypic variation and H2 of GZnC and GFeC in 166 wheat cultivars across different environmentsa.
Marker-Trait Associations and Pleiotropic Loci
The significant associations were identified between SNPs and GZnC and GFeC using MLM, FarmCPU, and MLMM based on the BLUE values (Figure 1) and the values in each environment (Supplementary Figures 5A, 6A). The Q–Q plots showed that the observed values of p were close to the expected distributions indicating the proper control of false positive in GWAS (Supplementary Figures 5B, 6B). Among the 2,214 and 1,340 significant MTAs for GZnC and GFeC, respectively, 154 and 72 corresponding to 25 and 16 different loci were identified in at least three environments. These 41 loci were considered as stable QTL and are summarized in Table 2. In total, 9, 11, and 8 QTL were only detected by MLM, MLMM, and FarmCPU, respectively; five QTL were identified by two models; eight were simultaneously detected through all the three models (Supplementary Figure 7), indicating the complementarity and reliability of the three models we employed.
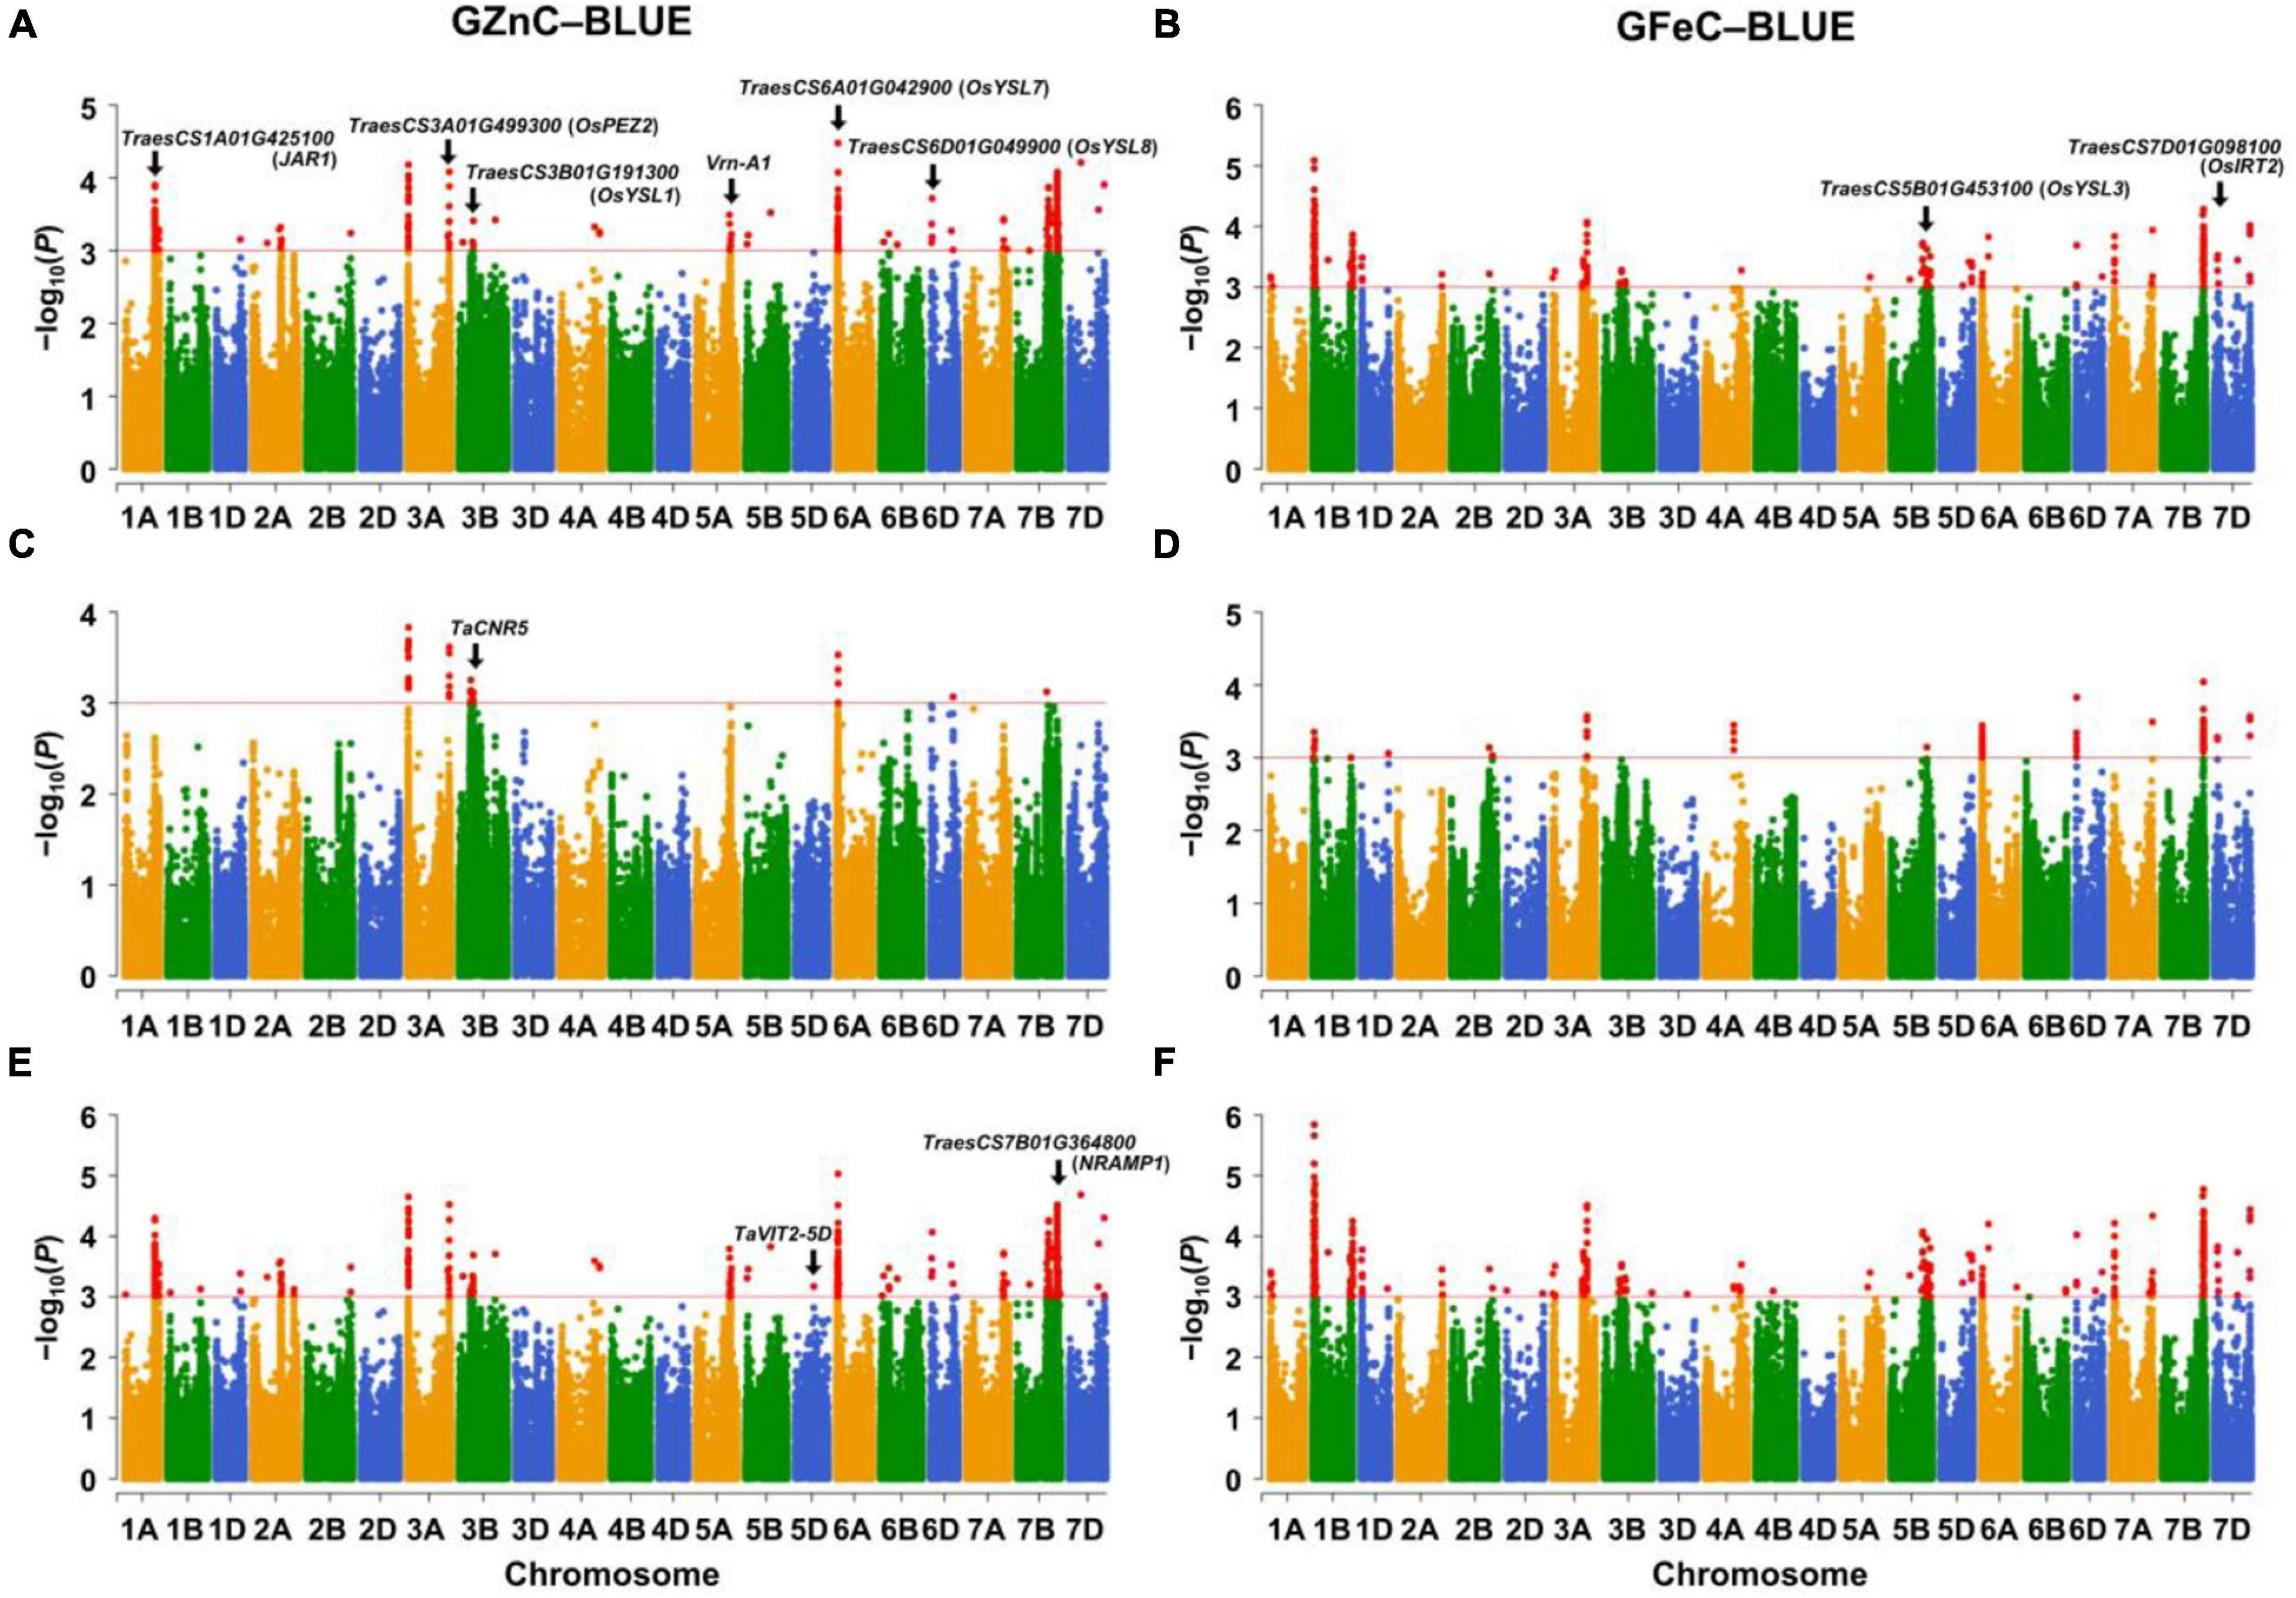
Figure 1. Manhattan plots for GZnC and GFeC analyzed by (A,B) the mixed linear model (MLM), (C,D) the fixed and random model circulating probability unification (FarmCPU), and (E,F) the multiple loci mixed linear model (MLMM). The threshold of p = 1.0 × 10⁻³ (–log10 (p) = 3.0) was used for calling significant marker-trait associations (MTAs). GZnC and GFeC indicate grain zinc and iron concentrations, respectively. BLUE indicates the best linear unbiased estimations across environments. The wheat gene ID indicates cloned wheat genes or wheat orthologs of known Zn/Fe-related genes in model plants.
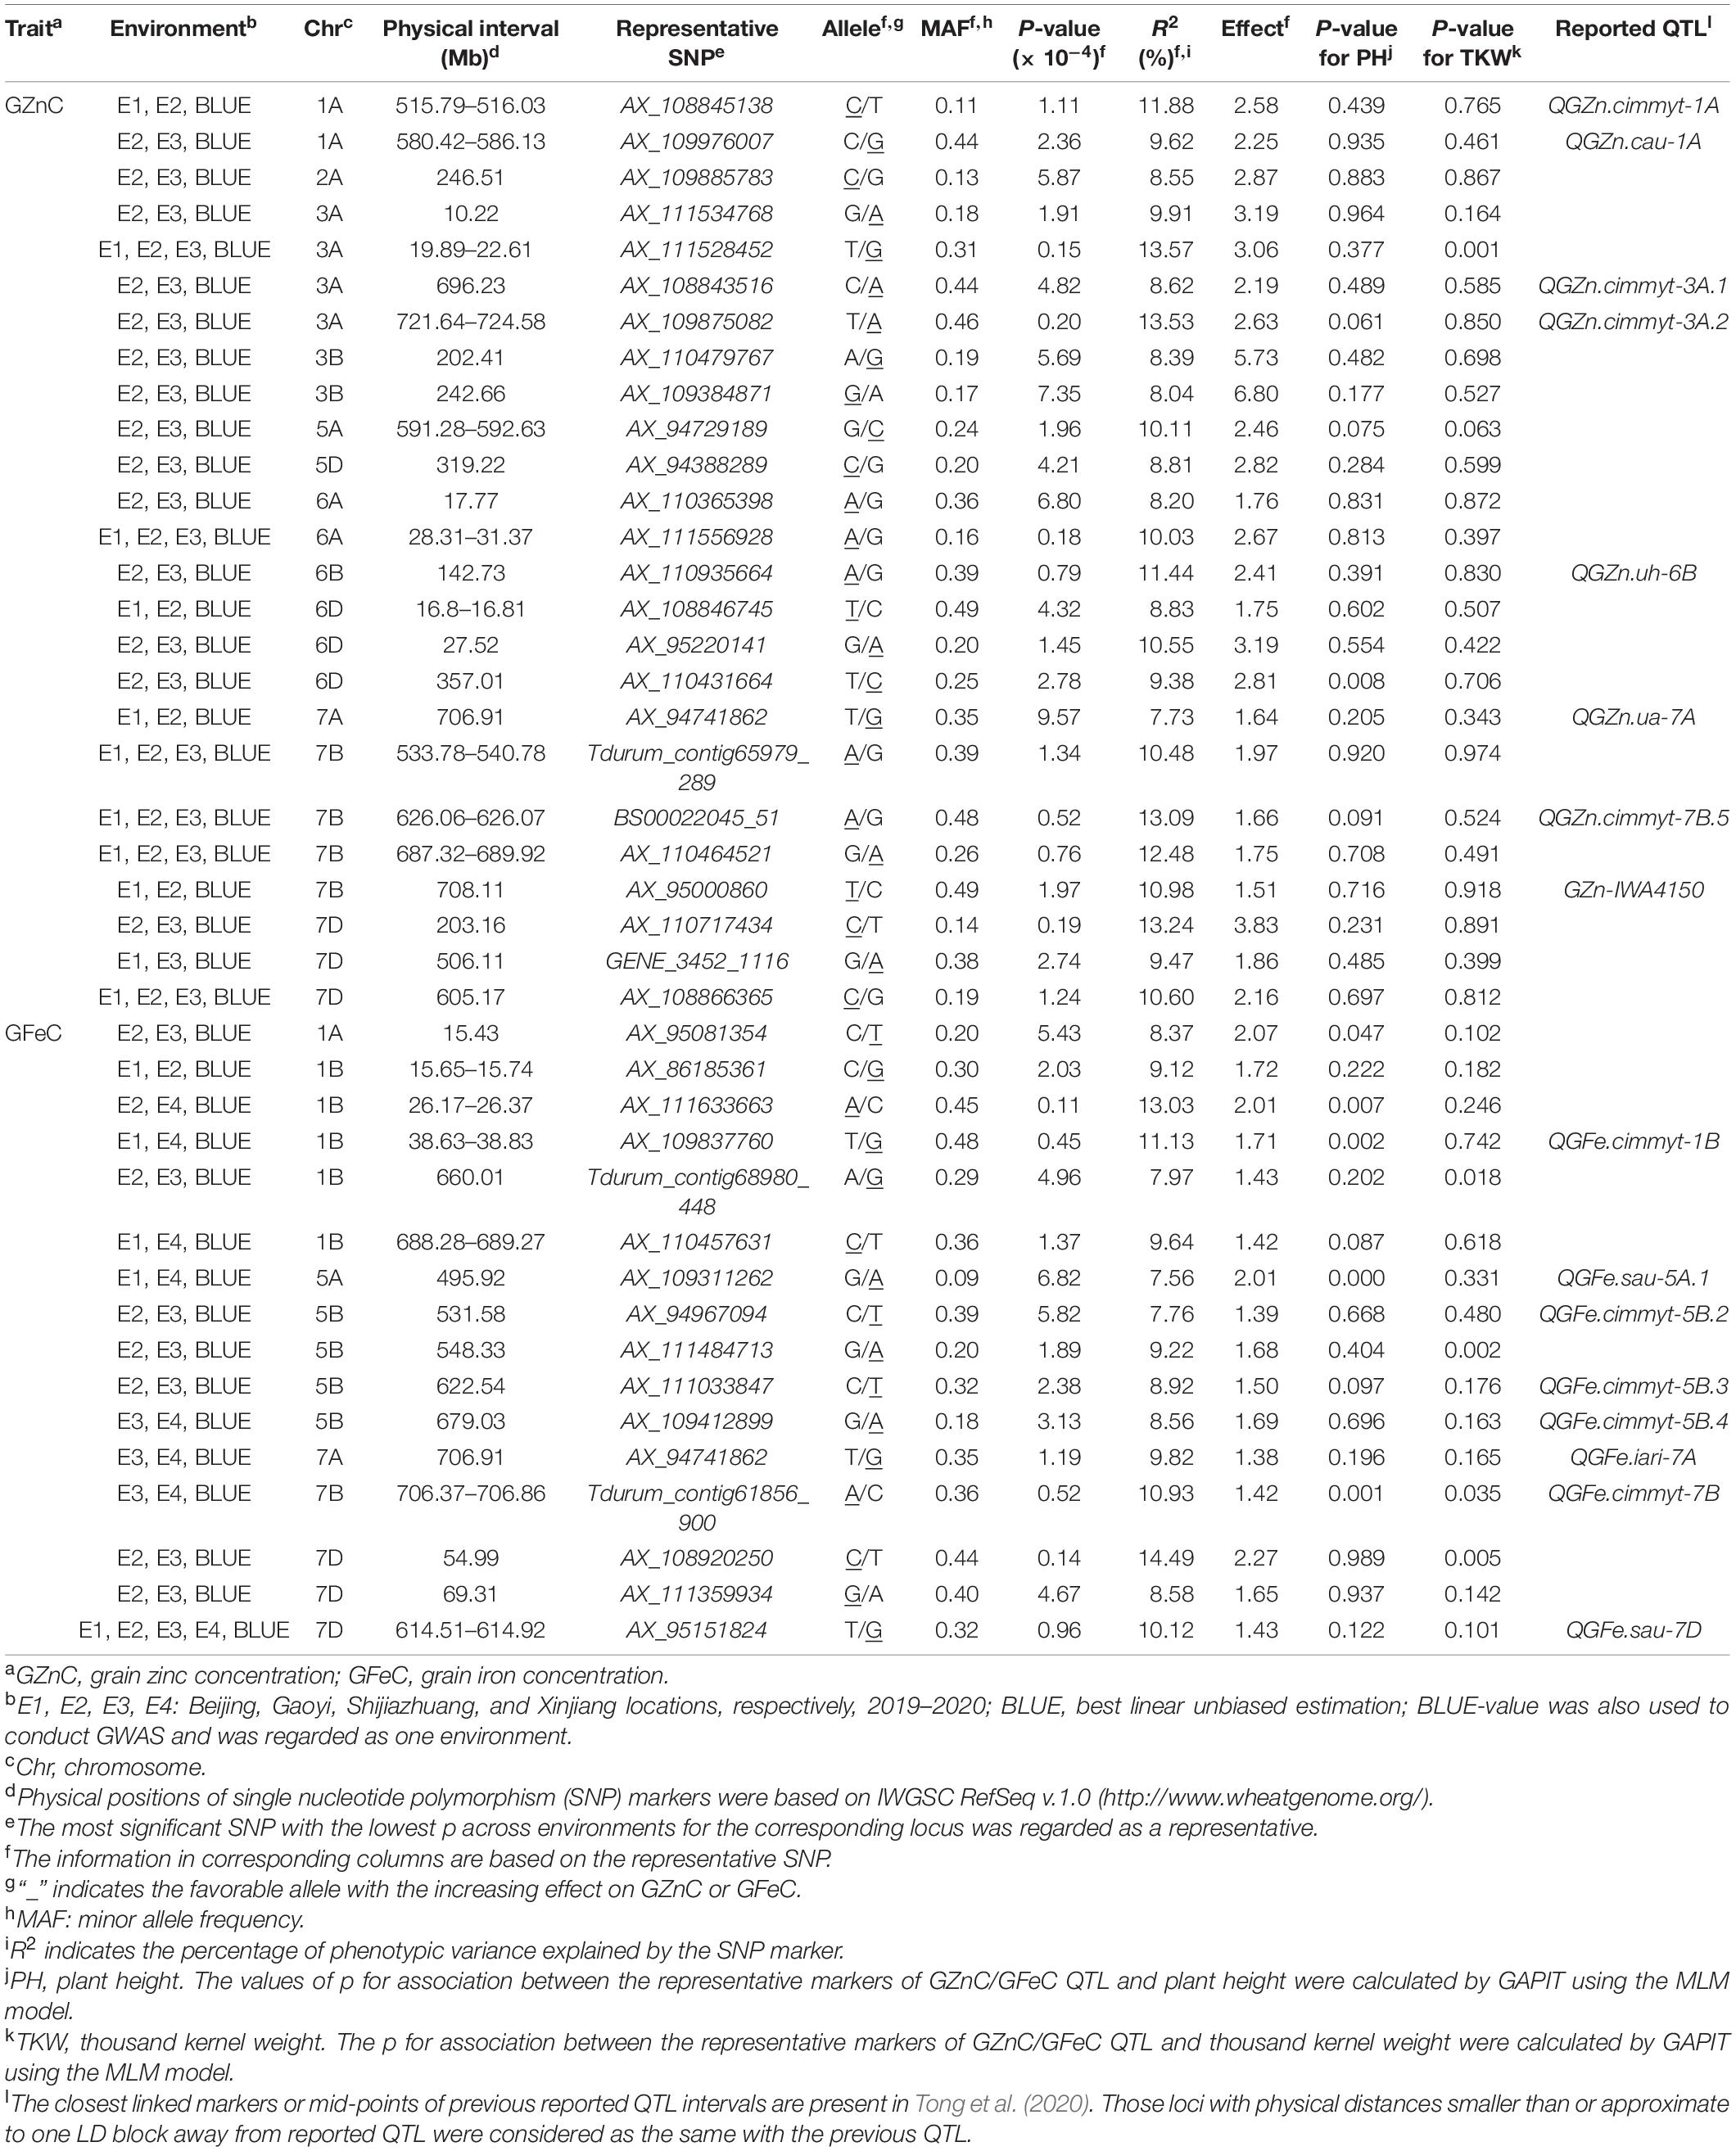
Table 2. Significant loci associated with GZnC and GFeC in at least three environments in 166 wheat accessions using three models in GAPIT.
For GZnC, 25 stable loci located on chromosomes 1A (2), 2A, 3A (4), 3B (2), 5A, 5D, 6A (2), 6B, 6D (3), 7A, 7B (4), and 7D (3) explained the phenotypic variation (R2-value) ranging from 7.73 to 13.57% (Table 2). Among these, six loci on chromosomal arms 3AS (AX_111528452, 19.89 Mb), 6AS (AX_111556928, 30.88 Mb), 7BL (Tdurum_contig65979_289, 539.22 Mb; BS00022045_51, 626.07 Mb; AX_11046452, 687.84 Mb), and 7DL (AX_108866365, 605.17 Mb) were the most stable and identified in all environments. The most significant marker was AX_111528452 on 3AS with a p at 1.5 × 10⁻⁵ and R2-value at 13.57%. For GFeC, we detected 16 stable QTL on chromosomes 1A, 1B (5), 5A, 5B (4), 7A, 7B, and 7D (3) with R2-values ranging from 7.56 to 14.49% (Table 2). One stable locus on the long arm of chromosome 7D (AX_95151824, 614.54 Mb) was detected in all five environments comprising BLUE values. The most significant QTL was identified on 1BS (AX_111633663) with a p at 1.1 × 10⁻⁵ in the genomic region of 26.17–26.37 Mb.
Four pleiotropic loci were identified by comparing their physical positions of stable MTAs for GZnC, GFeC, and PH (Table 2 and Supplementary Table 3). One locus on 7AL (AX_94741862, 706.91 Mb) was simultaneously associated with GZnC and GFeC while independent of PH and TKW, indicating its potential value in breeding for high grain zinc and iron. Two loci on 5AL (AX_109311262, 495.92 Mb) and 7BL (Tdurum_contig61856_900, 706.45 Mb) significantly increased GFeC and PH, suggesting that they might be useful when plant height is not an issue. The fourth pleiotropic locus located on 3AS (AX_111528452, 20.33 Mb) increased the GZnC but decreased the TKW. All the other 37 MTAs identified have no obvious pleiotropic effects and can be easily used in breeding for genetic improvement of either GZnC or GFeC (Table 2).
Candidate Genes Underlying Stable Loci
Twenty-eight promising candidate genes, located in or adjacent to the physical intervals of the QTL, were identified to be potentially involved in Zn/Fe uptake, transport, storage, and regulations (Table 3). They showed polymorphisms in 641 cultivars which were re-sequenced (data now shown). Among them, 17 genes were located within 2 Mb proximity of the representative markers, and nine genes were located less than 1 Mb from the marker (Table 3). The remaining 11 genes, mainly cloned wheat genes or wheat orthologs of known genes in model plants (7 out of 11), were likely to be causal genes for Zn/Fe homeostasis.
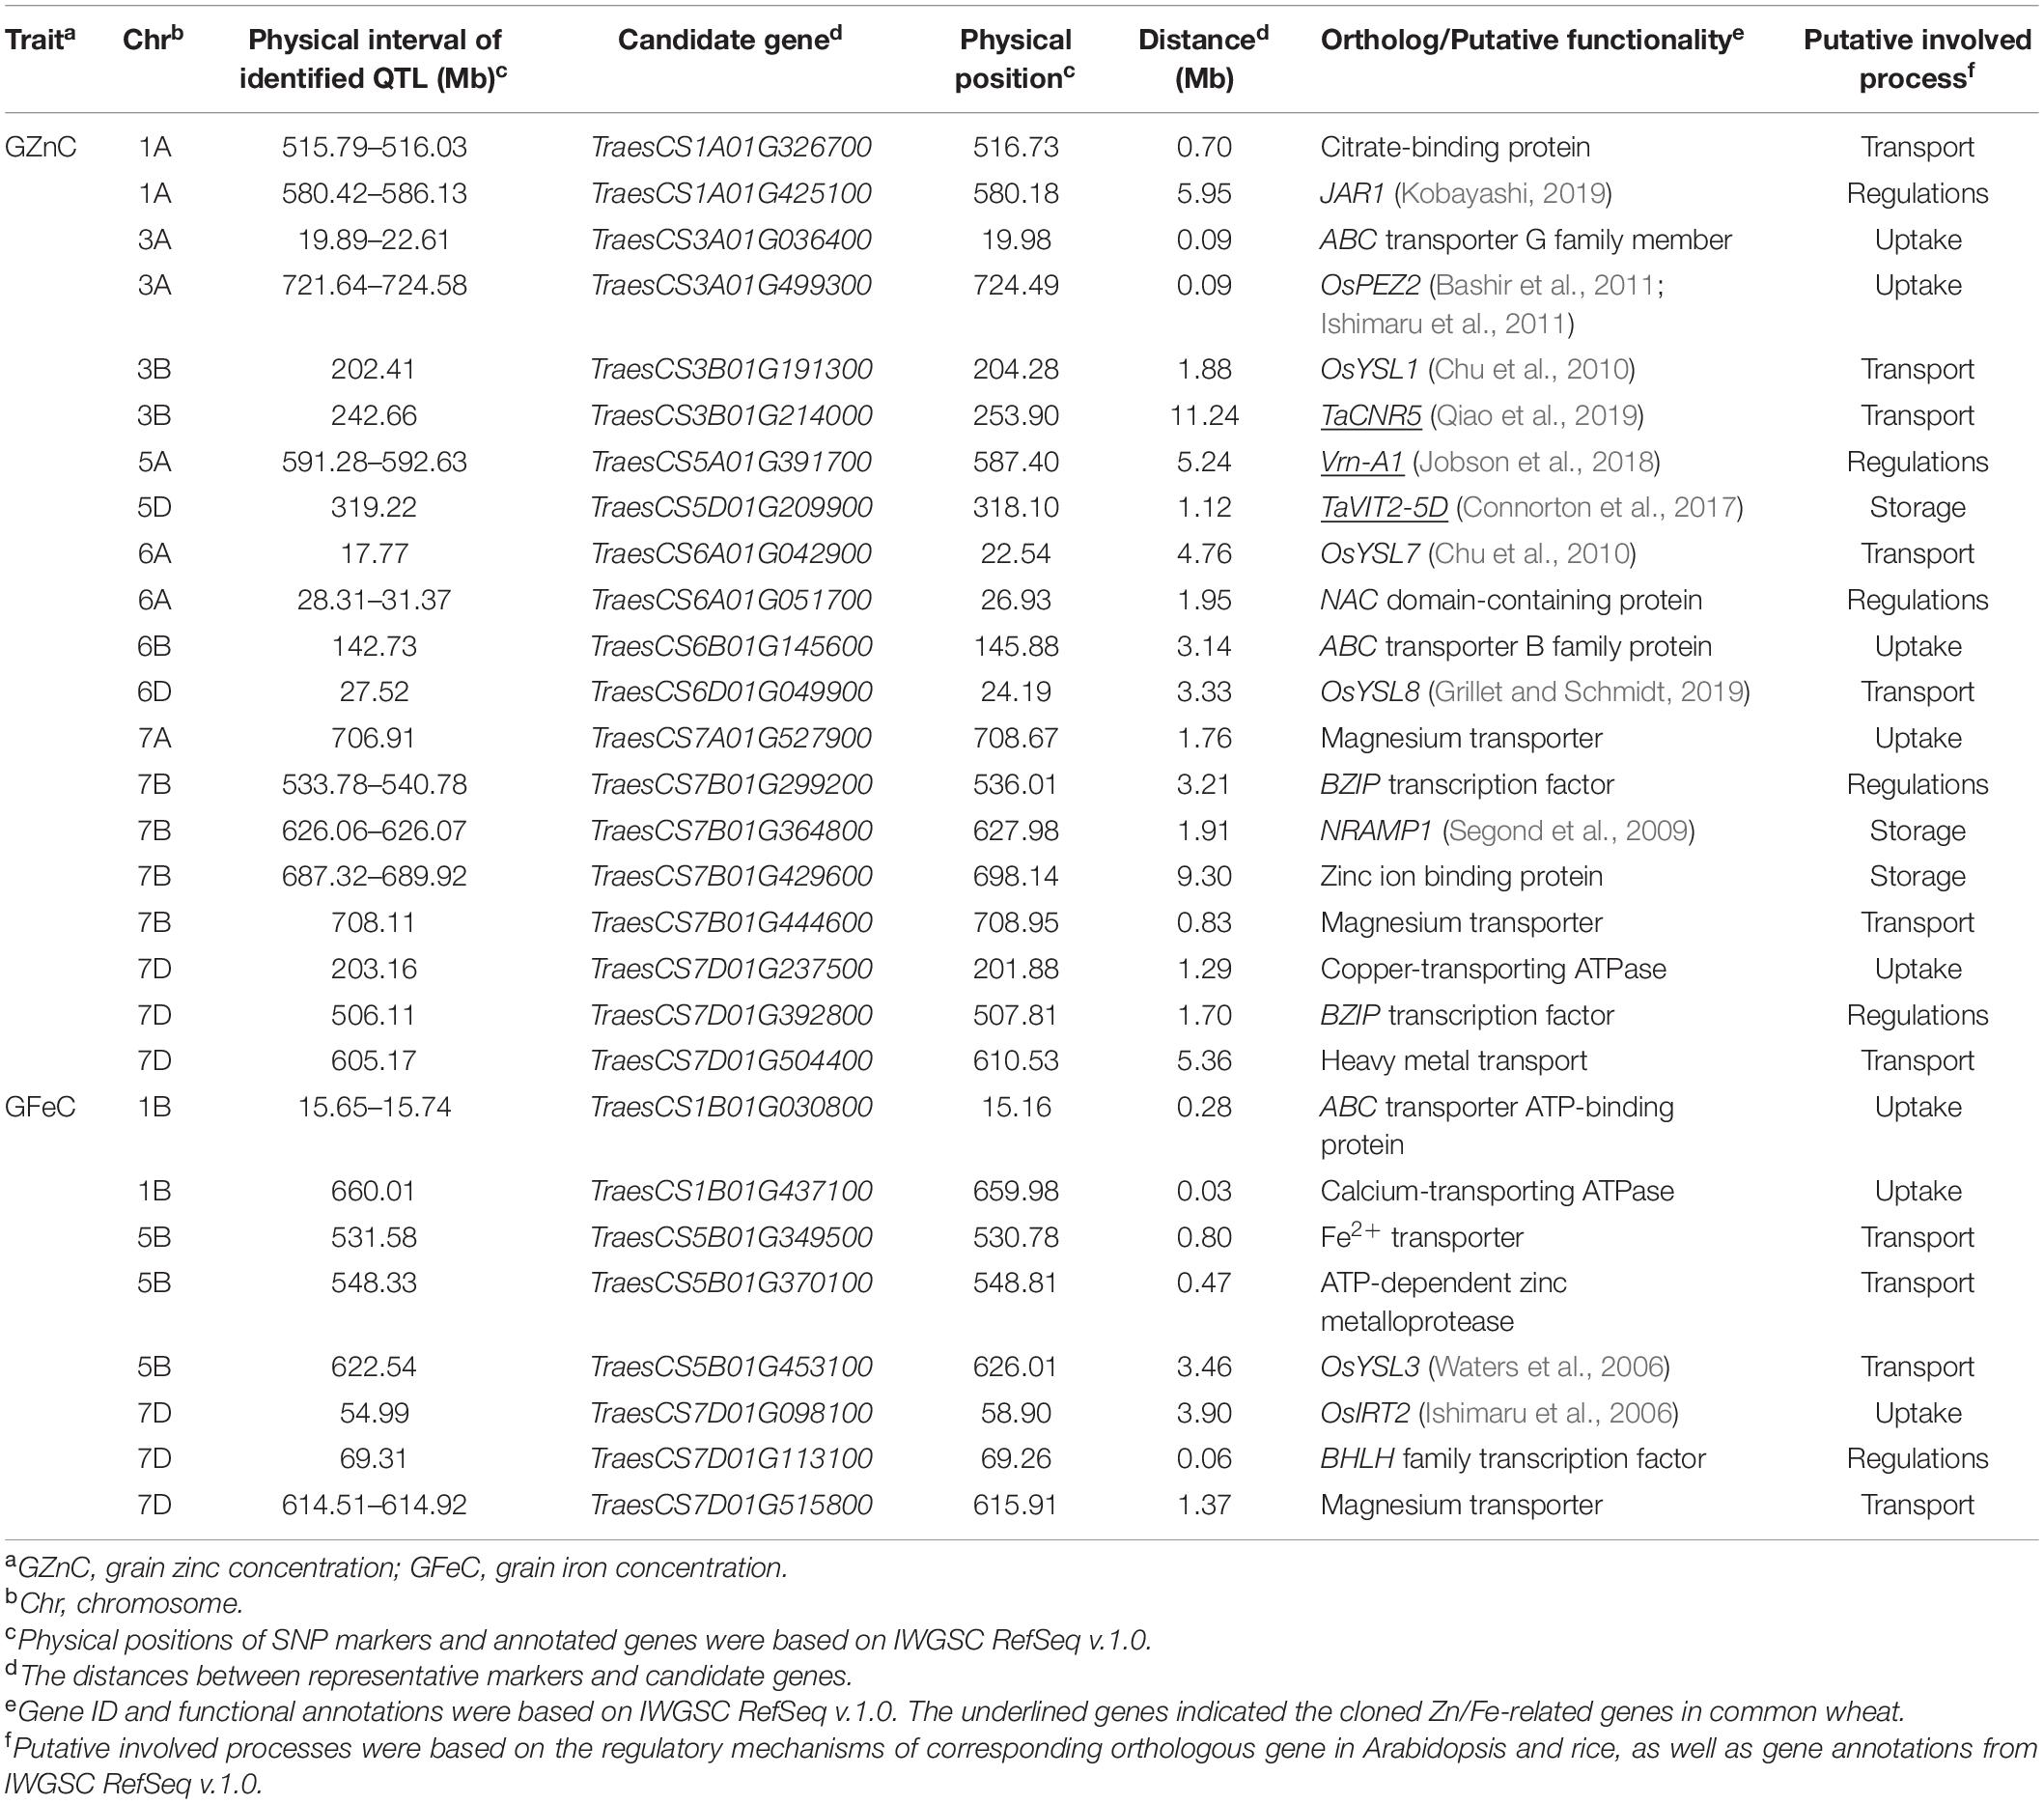
Table 3. Putative candidate genes underlying the loci associated with GZnC and GFeC.
For Zn/Fe uptake, generally proton ATPases, nicotianamine synthases, and phenolic compound transporter played key roles. At least eight candidate genes were identified, and two of them, TraesCS3A01G499300 and TraesCS7D01G098100, were wheat orthologs of rice genes OsPEZ2 (Bashir et al., 2011; Ishimaru et al., 2011) and OsIRT2 (Ishimaru et al., 2006) with known functions for Zn/Fe homeostasis. The expression profiles showed that all the above genes expressed at high levels in roots, further supporting their potential roles in Zn/Fe acquisition (Supplementary Figure 8). For Zn/Fe translocation, key transporters, such as citrate efflux transporter, yellow stripe-like (YSL) transporter, zinc-regulated transporter, and iron-regulated transporter-like protein (ZIP) transporter, were predominantly responsible for this process, and 11 putative genes were identified accordingly. Four genes were wheat orthologs of YSL genes (OsYSL1, OsYSL3, OsYSL7, and OsYSL8) in rice (Waters et al., 2006; Chu et al., 2010; Grillet and Schmidt, 2019), one was cloned gene (TaCNR5) in wheat (Qiao et al., 2019) related to zinc homeostasis, and the remaining six were possible wheat specific or yet to be discovered in model plants. These genes showed diverse expression patterns in different tissues and ages (Supplementary Figure 8). None or very little expression was detected in wheat grain, which partially supported their Zn/Fe transport roles in vegetative tissues (Kobayashi and Nishizawa, 2012).
The storage of metal into vacuoles in seeds was mainly mediated by vacuolar iron transporter (VIT) family members (Zhang et al., 2012), and the efflux of metal from the vacuolar to cytosol was mainly controlled by NRAMP family (Segond et al., 2009), which made TraesCS5D01G209900 (TaVIT2-5D) and TraesCS7B01G364800 (ortholog of AtNRAMP1) promising candidate genes responsible for the Zn/Fe storage in seeds (Segond et al., 2009; Connorton et al., 2017). TraesCS7B01G429600 encoding a zinc binding protein showed high expression in wheat grain and was also considered as a promising candidate gene involved in the Zn/Fe storage (Supplementary Figure 8). Additionally, six regulator genes, such as Vrn-A1, mainly known as transcriptional factors (TFs) regulating the plant development, were identified. TraesCS7B01G299200 and TraesCS7D01G392800, the bZIP TFs, TraesCS7D01G113100, the bHLH TF, TraesCS6A01G0517000, the NAC domain protein, and TraesCS1A01G425100, the wheat ortholog of jasmonic acid-amido synthetase (JAR1), were all putatively related to Zn/Fe homeostasis in wheat. Their spatio-temporal expression profiles are provided in Supplementary Figure 8.
Validation of 3AL Quantitative Trait Locus/Loci and the Underlying Gene
Among all the MTAs, we chose the major QTL on 3AL for GZnC (AX_109875082, 724.58 Mb) with high R2-value (13.53%) and the pleiotropic locus on 7AL for GZnC and GFeC (AX_94741862, 706.91 Mb) to develop high-throughput KASP markers (Table 2 and Supplementary Table 4). Both QTL were independent of TKW and PH (Table 2). Their representative SNPs were successfully converted to KASP assays after genotyping the association panel and the same genotypic data were obtained from the wheat 660K SNP array (data not shown). The marker information was presented in Supplementary Table 4. The two KASP markers were further used to test the ZM175/LX987 bi-parental population. For K_AX_109875082 on 3AL, a t-test showed a significant difference of GZnC between lines carrying favorable allele and lines with opposite allele across environments (Figure 2B). No polymorphism was detected for K_AX_94741862 on 7AL in this population. Those markers closely linked to these QTL could be further detected in the ZM175/LX987 bi-parental population.
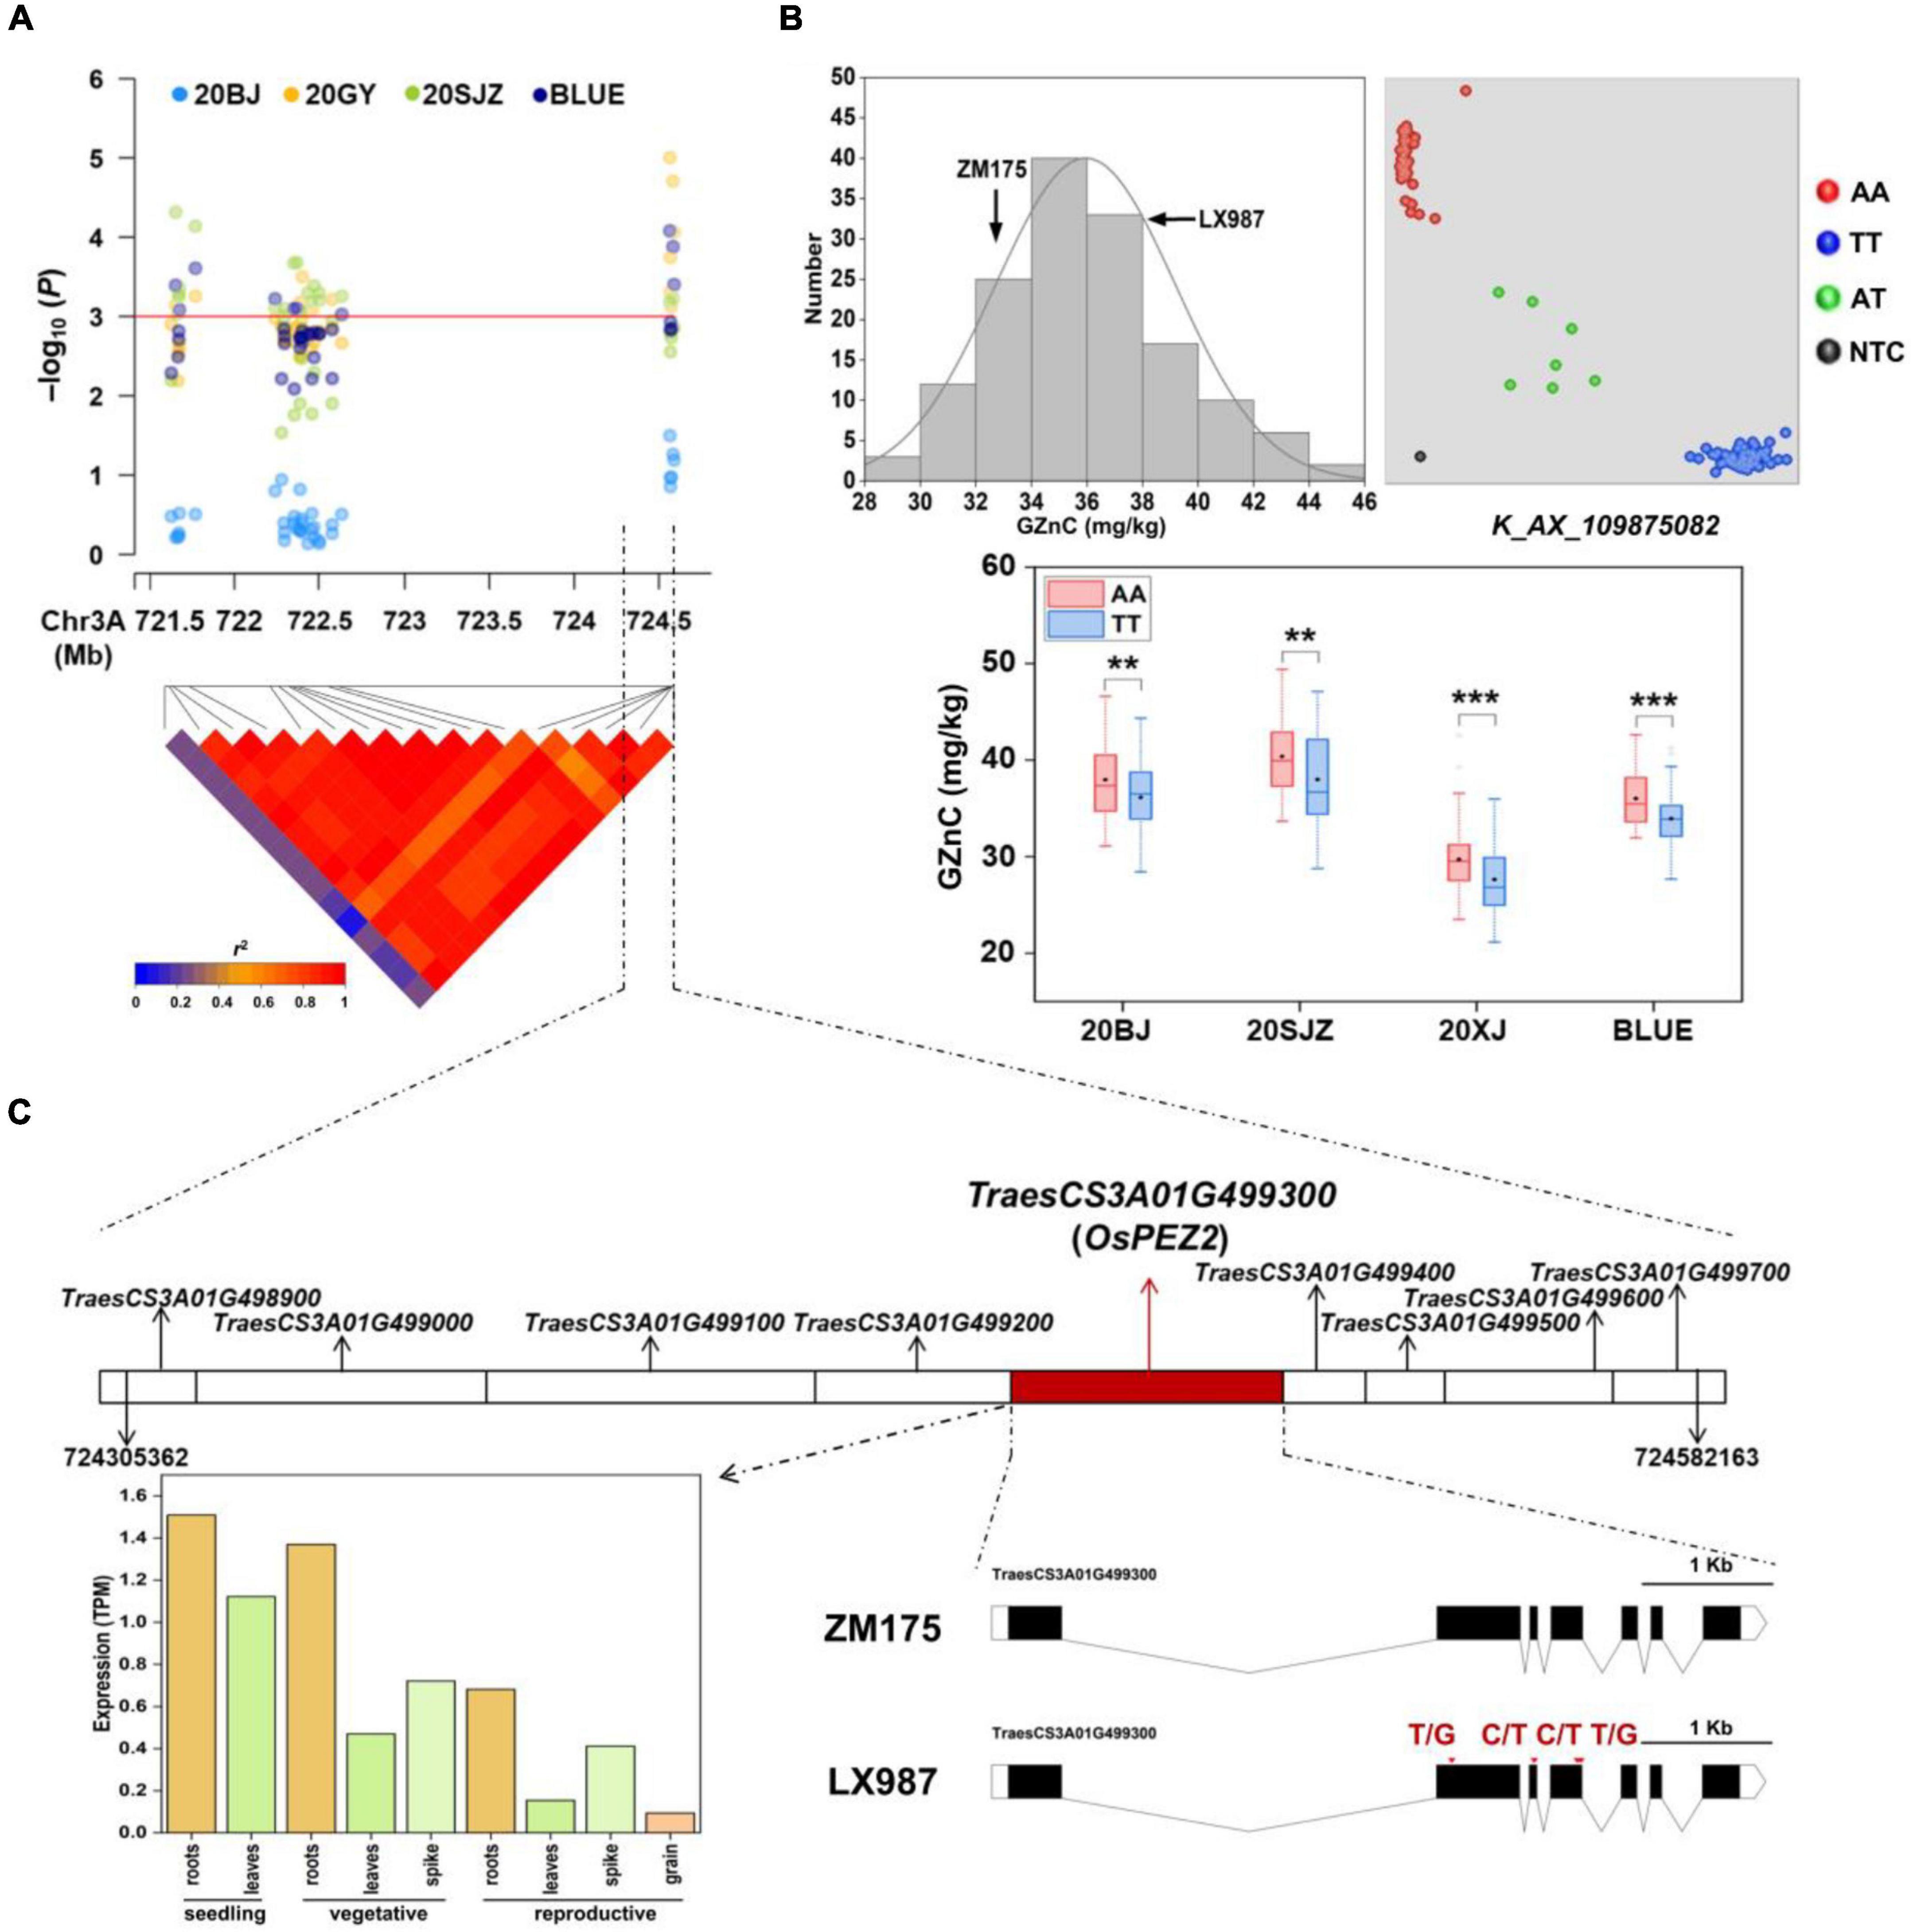
Figure 2. (A) Local Manhattan plot and linkage disequilibrium (LD) heatmap of single nucleotide polymorphisms (SNPs) within the 3AL quantitative trait loci (QTL) identified for grain zinc concentration (GZnC). 20BJ, 20GY, and 20SJZ: Beijing, Gaoyi, and Shijiazhuang locations, respectively, 2019–2020. BLUE: best linear unbiased estimations. (B) The validation of 3AL QTL in ZM175/LX987 RIL population. Histograms for GZnC in the population using BLUE values across three environments (top and left); genotype calling result of the kompetitive allele-specific PCR (KASP) markers for K_AX_109875082 in the population (top and right); allelic effects of K_AX_109875082 on GZnC in the population across 20BJ, 20SJZ, 20XJ, and BLUE (bottom). AA and TT indicate two homozygous genotypes for this marker from LX987 and ZM175, respectively. AT indicates the heterozygous genotype, and NTC represents no template control. 20XJ: Xinjiang location in during 2019–2020. The black diamond in each box indicates the mean. *p < 0.05; **p < 0.01; ***p < 0.001; ns: not significant. (C) The nine annotated genes identified close to AX_109875082 with the highest p in the 3AL QTL region (top); the spatio-temporal expression profiles of the candidate gene TraesCS3A01G499300 (bottom and left); the gene structure of TraesCS3A01G499300 containing four exons with missense variants between ZM175 and LX987 (bottom and right), and red arrows indicate the positions of the exon missense variants between ZM175 and LX987.
For the 3AL QTL, the most significant markers were located in the physical interval of 724,305,362–724,582,163 bp, where nine genes were annotated (Figures 2A,C). Sequence similarity analysis showed that TraesCS3A01G499300, annotated as a multidrug and toxic compound extrusion (MATE) family gene responsible for protein detoxification, had high amino acid sequence identity (87%) with OsPEZ2 (Tong et al., 2020). The gene OsPEZ2 played an important role in metal uptake and translocation in rice and pez2 mutant showed significantly reduced Fe concentration in root tips and xylem sap (Bashir et al., 2011; Ishimaru et al., 2011). TraesCS3A01G499300 is 5,562 bp long and consists of seven exons in coding region (Figure 2C). Further sequence analysis revealed that TraesCS3A01G499300 had abundant SNPs in its flanking and coding regions between ZM175 and LX987 (Supplementary Table 5), especially four missense SNPs within exons (Figure 2C), indicating TraesCS3A01G499300 is likely to be the causal gene underlying 3AL QTL. Gene expression data indicate that the gene is constitutively expressed and is uniformly highly expressed in wheat root throughout developmental stages, which further supports its candidacy (Figure 2C).
Discussion
Effects of Marker Density and Linear Models on Wheat Genome-Wide Association Study
In previous GWAS studies on wheat Zn/Fe, large gaps in the genetic map were generally found due to the low marker number and density as well as relatively long LD decays. In this study, GWAS was conducted using high-density markers, such as 373,106 SNPs, making it possible to change the LD pattern, thereby resulting in efficient identification of MTAs in many low-recombination regions on wheat chromosomes (Kim and Yoo, 2016). Forty-one loci for GZnC/GFeC were detected, and the number is much higher than the QTL detected in previous literature (Gupta et al., 2021). Out of the 41 representative significant MTAs, only five markers came from the 90K SNP array, and 36 were from the 660K array, indicating that high-resolution GWAS was achieved by high density markers (Fu et al., 2020; Pang et al., 2020).
In terms of population size, a relatively small collection was used in this study. Nevertheless, the 166 core accessions were selected from over 400 elite cultivars and represented much diverse wheat accessions in China’s major wheat growing regions. The same population has been used to conduct GWAS on many yield or quality-related traits and performed highly informative in our previous studies (Liu et al., 2017; Zhai et al., 2018, 2020; Li et al., 2019; Fu et al., 2020). MLM using Q + K as covariant might be over-fitted possibly due to the strict control of population structure and kinship, leading to false negatives (Korte and Farlow, 2013). The multiple testing corrections tended to be too stringent to detect sufficient both major and minor MTAs. Whereas, the model FarmCPU as a complement, could avoid over-corrected population structure to some extent by utilizing fixed and random effect models iteratively (Kusmec and Schnable, 2018). Using three models together, reliable loci for GZnC and GFeC detected were almost doubled than using an MLM alone in the present research.
Genetic Architecture Dissection by Comparing Current Loci With Known Quantitative Trait Locus/Loci
To date, hundreds of Fe/Zn-related QTL have been mapped on all wheat chromosomes except 6D by bi-parental linkage mapping and GWAS (Tong et al., 2020). For the 25 loci associated with GZnC in this study, eight have similar physical positions with known Zn-related QTL on 1AL (2), 3AL (2), 6BS, 7AL, and 7BL (2), respectively (Table 2 and Figure 3). As for GFeC, half of the 16 loci were identified to coincide with the documented QTL on 1BS, 5AL, 5BL (3), 7AL, 7BL, and 7DL, respectively. Major overlapping regions were observed on 5BL, where previous literatures reported a large number of Fe-related QTL by bi-parental mapping, confirming its importance for the gene discovery (Tong et al., 2020).
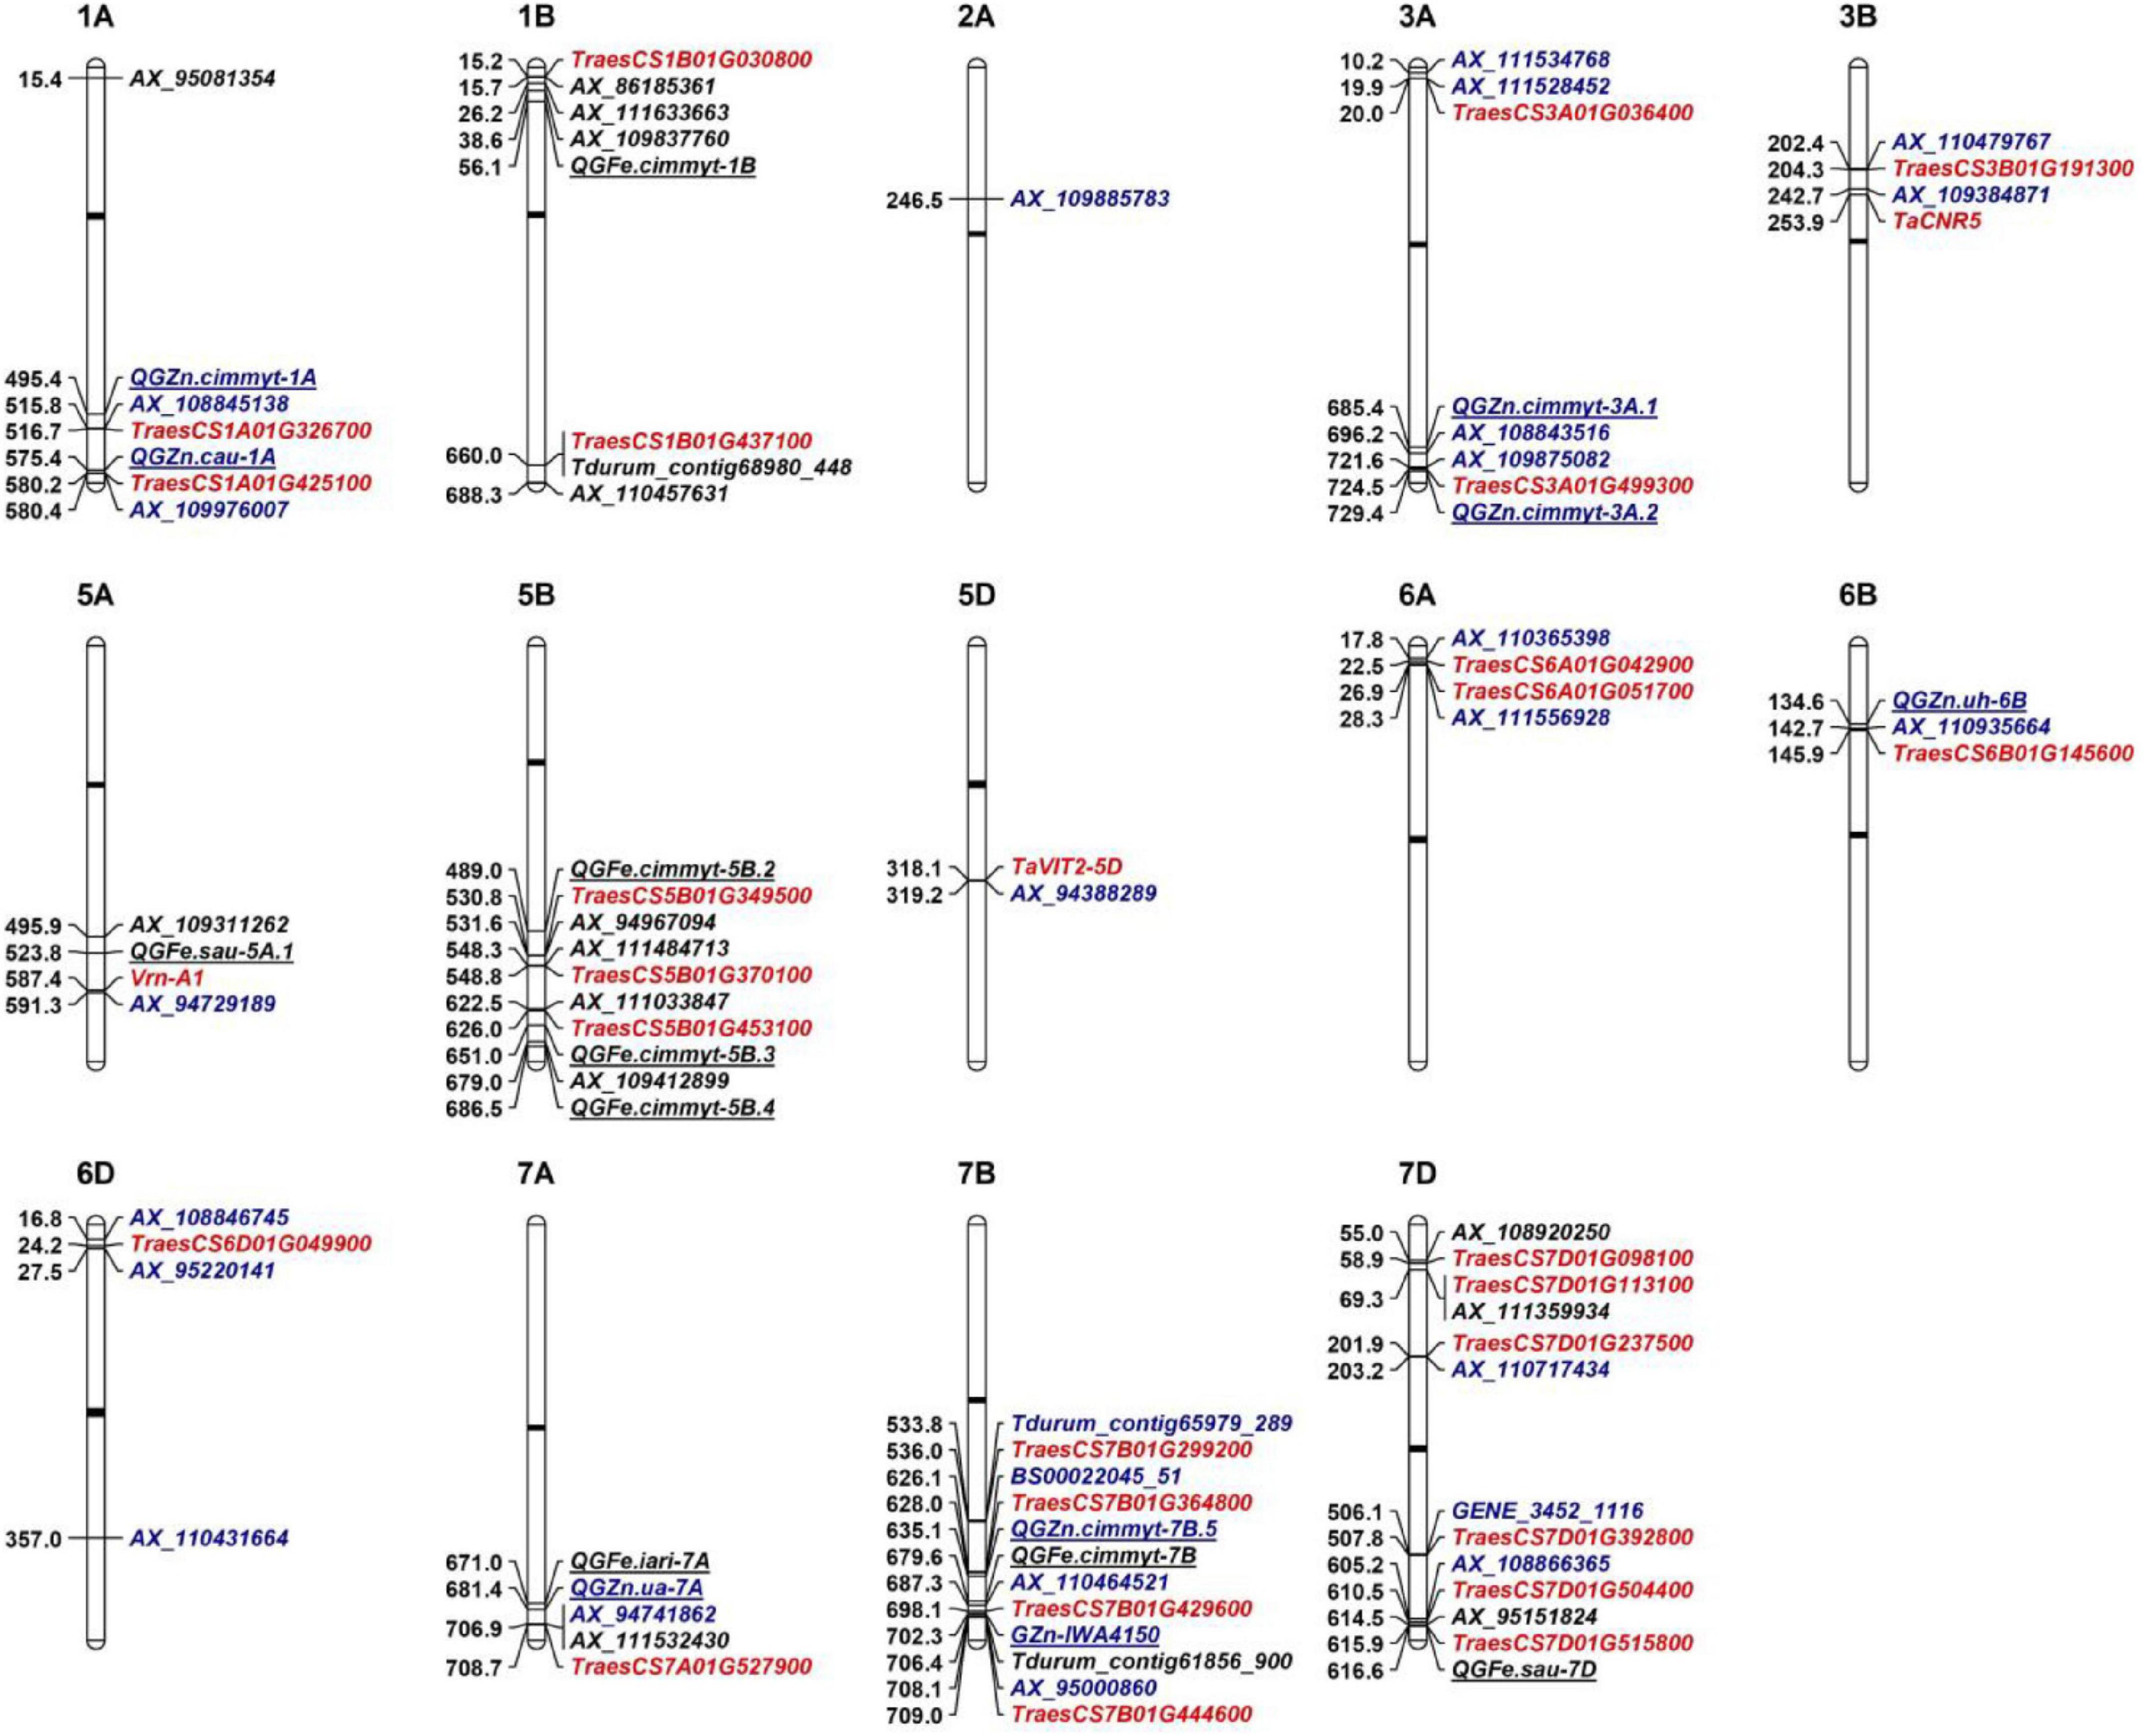
Figure 3. Genetic architectures of grain zinc and iron in wheat. The top of each graph indicates the chromosome number in wheat and the left shows the physical positions based on IWGSC RefSeq v.1.0. The loci identified to associate with GZnC and GFeC are shown with black and blue fonts, respectively. The representative markers (noted in Table 2) identified in this study were used to be compared with previous reported QTL that are underlined. The closest linked markers or mid-points of previous reported QTL intervals were from Tong et al. (2020). Promising candidate genes are highlighted as red color. Black bars indicate the locations of centromeres.
For the other 25 loci, comprising 17 loci for GZnC and 8 for GFeC, they were located in the chromosomal regions that were different from the QTL previously reported and are probably new loci (Table 2 and Figure 3). For example, three QTL on 6D (AX_108846745, 16.81 Mb; AX_95220141, 27.52 Mb; AX_110431664, 357.01 Mb) are highly likely to be novel since no Zn/Fe-related QTL has been previously mapped on this chromosome (Tong et al., 2020). Similarly, on chromosome 7D, there were only two Fe related QTL reported at 13.9 Mb and 616.6 Mb, so the three loci for GZnC (AX_110717434, 203.16 Mb; GENE_3452_1116, 506.11 Mb; and AX_108866365, 605.17 Mb) and two loci for GFeC (AX_108920250, 54.99 and AX_111359934, 69.31 Mb) were likely to be new. The new loci identified in this research have significantly enriched our understanding of the genetic basis of the complicated Zn and Fe traits in wheat.
Promising Candidate Genes Related to Grain Zinc Concentration and Grain Iron Concentration
To date, numerous genes involved in Zn and Fe homeostasis in model plants have been extensively studied (Tong et al., 2020; Gupta et al., 2021). Wheat gene annotations from the IWGSC RefSeq v.1.0 provided a useful tool to further investigate the candidate genes located in or adjacent to the QTL identified. In the current study, 28 candidate genes were identified for Zn/Fe homeostasis, such as uptake, transport, storage, and regulations (Figure 4). The spatio-temporal expression profiles were highly consistent with their putative functions, indicating their possible roles in wheat Zn/Fe homeostasis. Of them, 11 genes were putative wheat orthologs of known Arabidopsis and rice genes related to Zn/Fe homeostasis, partially supporting the authenticity of the detected loci.
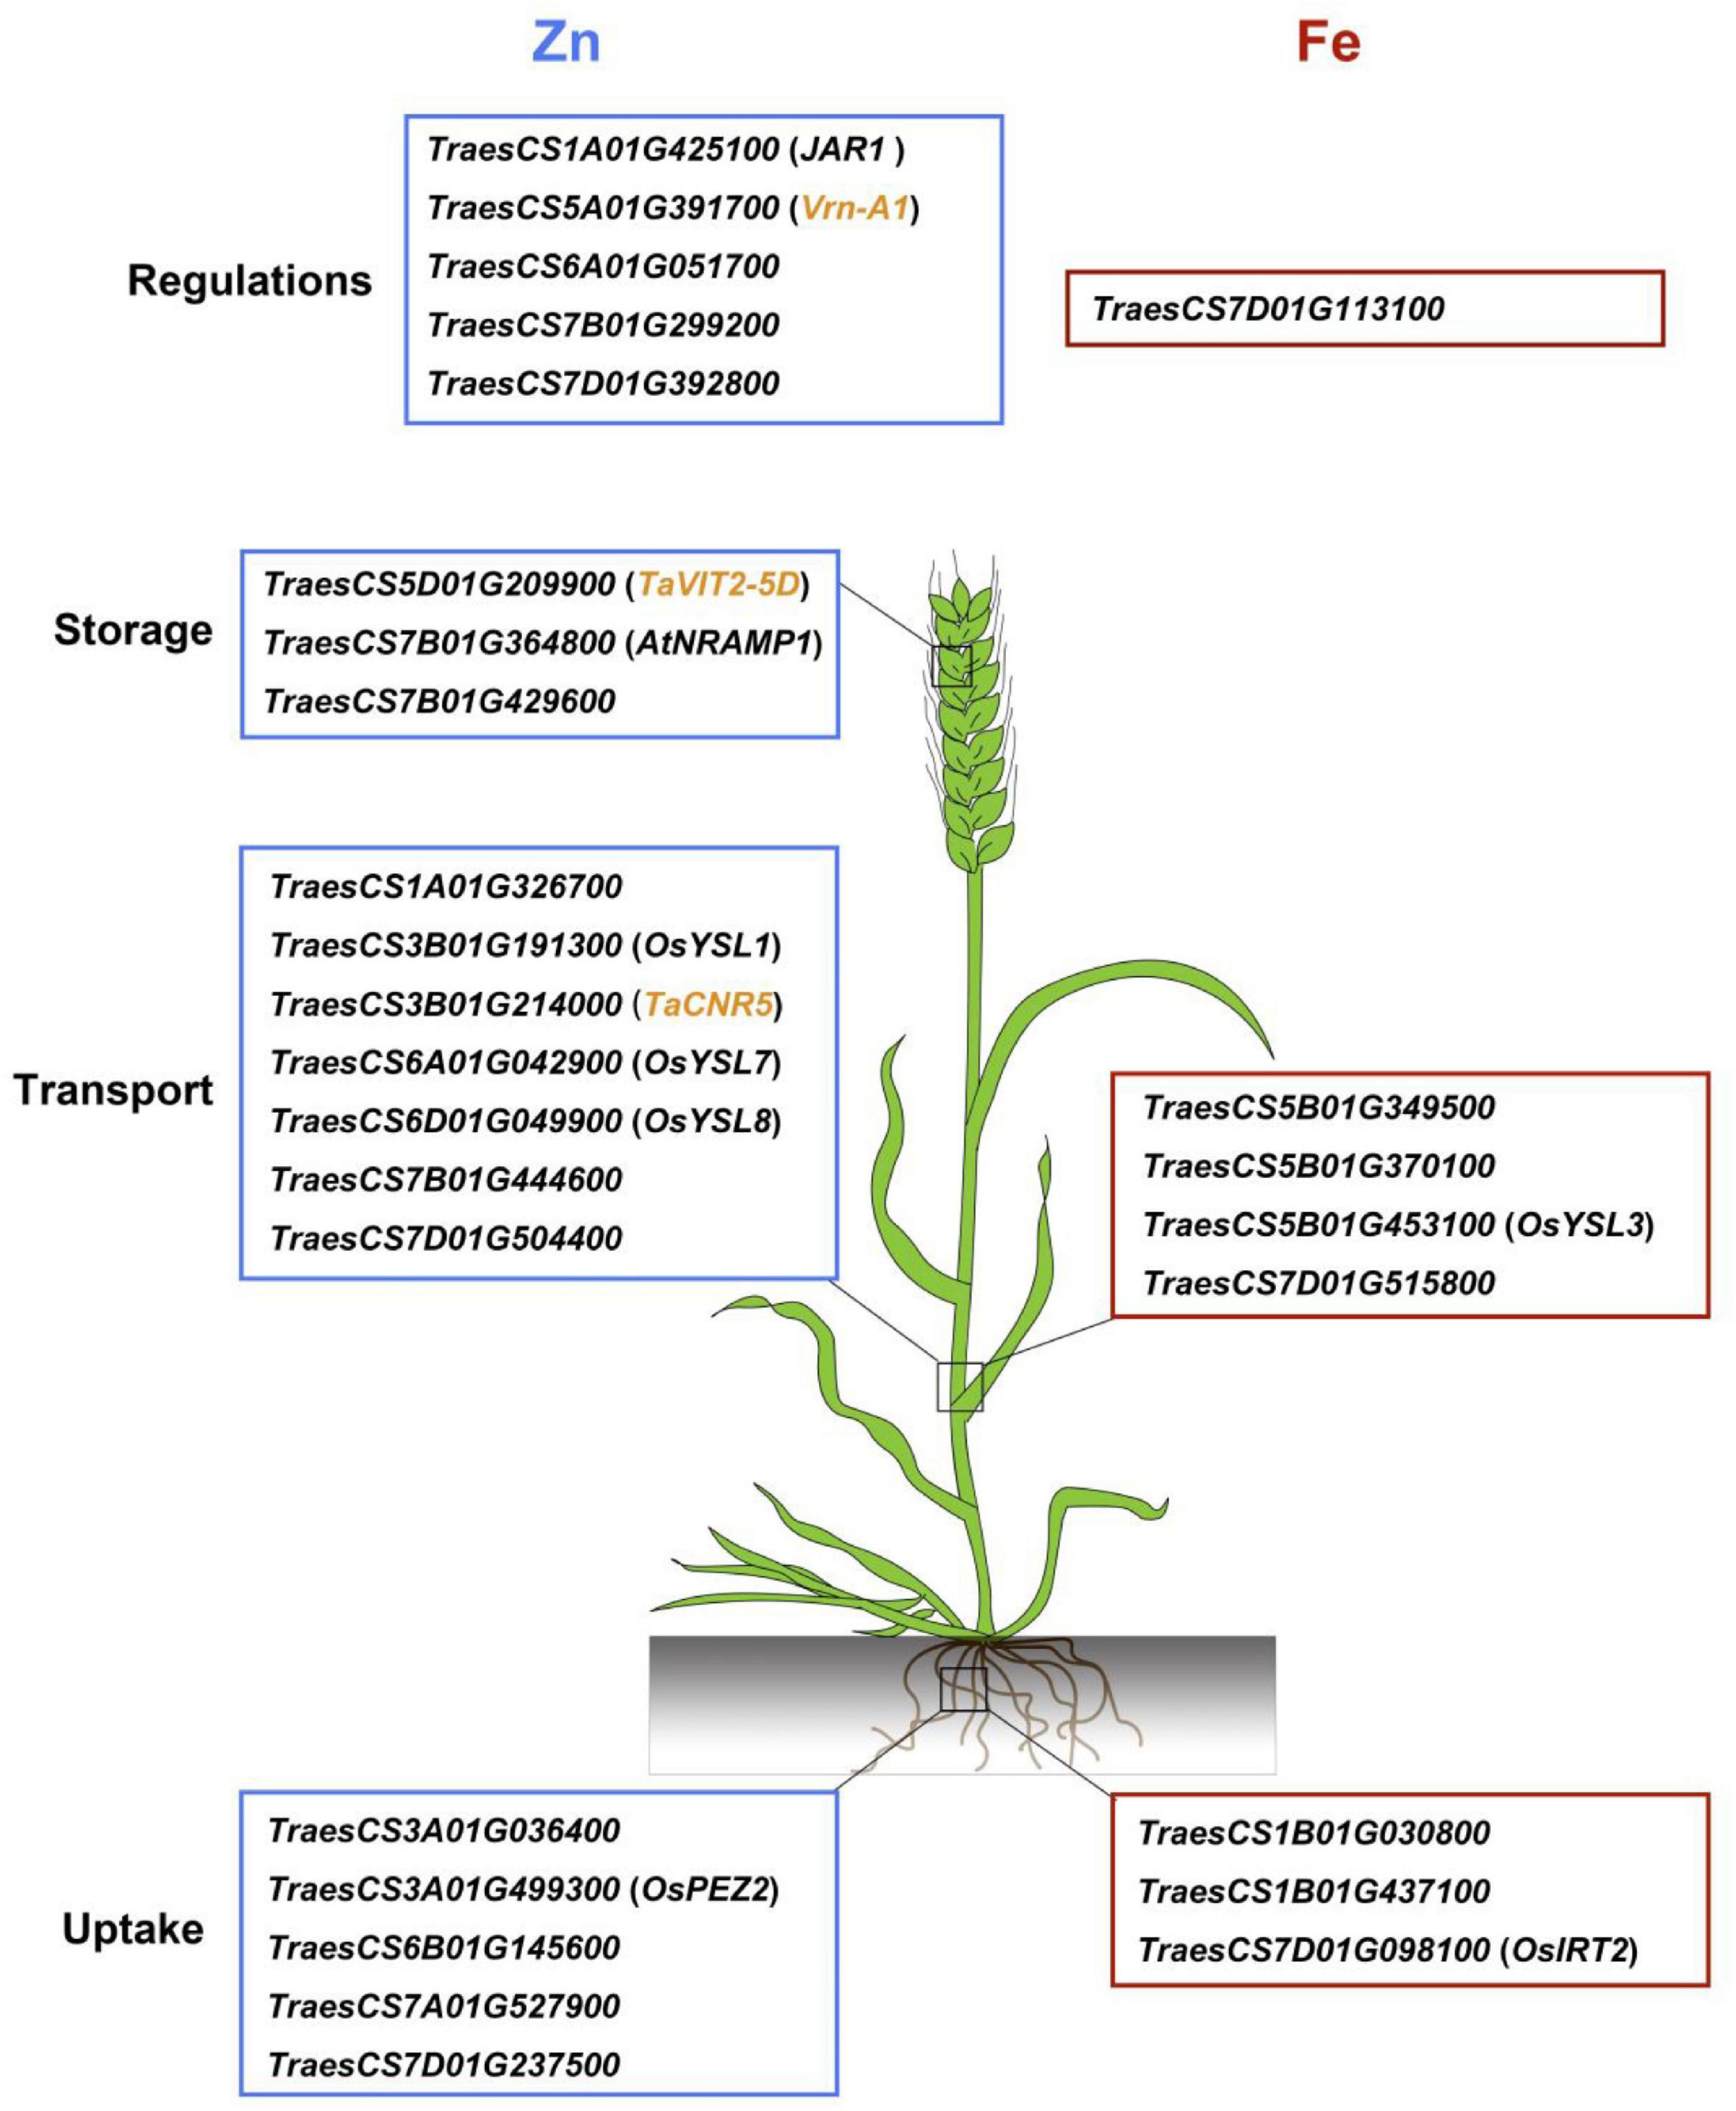
Figure 4. A brief model proposed for grain zinc and iron accumulation in common wheat based on the promising candidate genes identified. The wheat gene ID framed with blue and red boxes indicates zinc and iron genes, respectively, and the genes in the small brackets indicate known Zn/Fe related genes in model plants. The cloned zinc related genes in wheat are highlighted as yellow.
TraesCS3A01G499300, the candidate gene for 3AL QTL, was an ortholog of OsPEZ2, an efflux transporter for phenolics that served as chelators to facilitate metal uptake by root in rice (Bashir et al., 2011; Ishimaru et al., 2011). A very recent study demonstrated the pivotal roles of MATE family genes of protein detoxification for metal uptake and transport in rice roots and stems, further supporting the potential role of TraesCS3A01G499300 on Zn/Fe homeostasis (Ren et al., 2021). Abundant sequence variations of the gene between ZM175 and LX987 were observed and provided strong evidence that it is possibly the causal gene and deserves further studies. In addition, we successfully developed KASP markers for the 7AL QTL but unfortunately it returned monomorphic in ZM175/LX987 RILs. However, it was interesting to find that the candidate gene TraesCS7A01G527900 (706.91 Mb) underlying 7AL QTL was homologous with TraesCS7B01G444600 (708.11 Mb) on 7BL and TraesCS7D01G515800 (615.91 Mb) on 7DL for the three QTL identified in this study. The three candidate genes annotated as magnesium transporters were exactly the three homeologs for the same gene in each sub-genome. These loci are potentially important and we are now developing KASP markers for 7BL and 7DL QTL for validation. If any loci are validated in ZM175/LX987 or other mapping populations, the roles of all three loci in metal homeostasis can be presumed. The candidate genes identified in this study provided genetic bases for further elucidating the mechanisms of Zn and Fe homeostasis in wheat.
Applications in Wheat Breeding for Biofortification
Since most common wheat had suboptimal GZnC and GFeC, it is imperative to identify Zn/Fe-related QTL or genes as many as possible and to re-introduce or to pyramid them into current wheat gene pools. In this study, 12 accessions with stable high GZnC or GFeC were identified with BLUE values over 50 mg/kg (Supplementary Figure 3). The elite germplasm, such as Xiaoyan54 and Xinong1376 are currently cultivars in wheat production and can be used immediately as donor parents for wheat biofortification.
Although no significant correlation was observed between TKW and GZnC/GFeC in the present study, one pleiotropic locus on 3AS (AX_111528452, 20.33 Mb) was identified to increase GZnC but decrease TKW in all four environments. This QTL may be useful in certain crosses for biofortification when TKW is high enough. In addition, when plant height does not significantly affect the overall performance, pleiotropic loci on 5AL (AX_109311262, 495.92 Mb) and 7BL (Tdurum_contig61856_900, 706.45 Mb) could exert effects on Zn/Fe enrichment. It should be noted that favorable allele frequencies for the above three representative markers were 0.31, 0.09, and 0.36, respectively, indicating quite low frequency in our association panel (Supplementary Table 3). Considering only very few GZnC/GFeC loci had negative pleiotropic effects on agronomic traits such as TKW and PH, we speculated that there were still high chances for the improvement of GZnC/GFeC without yield penalty (Velu et al., 2018).
The fast release of wheat reference genome sequences and pan-genomes will undoubtedly speed up the process of marker development and gene discovery for wheat biofortification. Cloning important genes involved in Zn/Fe uptake, transport, storage, and regulations and pyramiding favorable alleles are promising avenues to increase the GZnC and GFeC in wheat cultivars. The 3AL locus was validated using a bi-parental population and its candidate gene was proposed as an uptake related gene, highlighting its potential use in wheat breeding. High-throughput and breeder-friendly KASP markers will pave the way for MAS in breeding and accelerate the release of biofortified wheat.
Conclusion
A GWAS using multiple models is demonstrated as a powerful approach for genetic dissection of micronutrient traits in wheat based on a high-resolution physical map. Sixteen loci were identified in the similar regions of known QTL related to Zn/Fe, and 25 loci were new. Twenty-eight promising candidate genes were identified based on bioinformatics analyses and gene expression data and are worthy of further investigation. The effect of one major QTL on 3AL was validated in a bi-parental population, highlighting its potential application for wheat biofortification.
Data Availability Statement
The original contributions presented in the study are included in the article/Supplementary Material, further inquiries can be directed to the corresponding author/s.
Author Contributions
YH and ZH conceived this work. YH and JT designed the experiments and wrote the manuscript. JT, CZ, MS, JS, DL, YZ, JZ, ZP, and LL completed the field work and data investigation. JT, CZ, and LF analyzed and interpreted the data. YH, ZH, AR, ML, and XX critically reviewed and revised the manuscript. All authors have read and approved the final manuscript.
Funding
This research was financially supported by the National Key Research and Development Program of China (2021YFF1000204 and 2020YFE0202300), the National Natural Science Foundation of China (31950410563 and 31961143007), the Agricultural Science and Technology Innovation Program of CAAS (CAAS-ZDRW202109), and the Fundamental Research Funds for Central Non-Profit of Institute of Crop Sciences, CAAS.
Conflict of Interest
The authors declare that the research was conducted in the absence of any commercial or financial relationships that could be construed as a potential conflict of interest.
Publisher’s Note
All claims expressed in this article are solely those of the authors and do not necessarily represent those of their affiliated organizations, or those of the publisher, the editors and the reviewers. Any product that may be evaluated in this article, or claim that may be made by its manufacturer, is not guaranteed or endorsed by the publisher.
Supplementary Material
The Supplementary Material for this article can be found online at: https://www.frontiersin.org/articles/10.3389/fpls.2022.840614/full#supplementary-material
Footnotes
- ^ http://www.capitalbiotech.com/
- ^ http://www.wheatgenome.org/
- ^ http://zzlab.net/GAPIT
- ^ https://github.com/YinLiLin/R-CMplot
- ^ http://www.uniprot.org/
- ^ http://wheat.cau.edu.cn/TGT/
- ^ http://wheat.cau.edu.cn/Wheat_SnpHub_Portal/
- ^ http://wheat-expression.com/
- ^ http://www.polymarker.info/
References
Alqudah, A. M., Sallam, A., Stephen Baenziger, P., and Börner, A. (2020). GWAS: Fast-forwarding gene identification and characterization in temperate cereals: lessons from Barley – A review. J. Adv. Res. 22, 119–135. doi: 10.1016/j.jare.2019.10.013
Bashir, K., Ishimaru, Y., Shimo, H., Kakei, Y., Senoura, T., Takahashi, R., et al. (2011). Rice phenolics efflux transporter 2 (PEZ2) plays an important role in solubilizing apoplasmic iron. Soil Sci. Plant Nutr. 57, 803–812. doi: 10.1080/00380768.2011.637305
Bhati, K. K., Alok, A., Kumar, A., Kaur, J., Tiwari, S., and Pandey, A. K. (2016). Silencing of ABCC13 transporter in wheat reveals its involvement in grain development, phytic acid accumulation and lateral root formation. J. Exp. Bot. 67, 4379–4389. doi: 10.1093/jxb/erw224
Bouis, H. E., Hotz, C., McClafferty, B., Meenakshi, J. V., and Pfeiffer, W. H. (2011). Biofortification: A new tool to reduce micronutrient malnutrition. Food Nutr. Bull. 32, S31–S40. doi: 10.1177/15648265110321S105
Chen, Y., Song, W., Xie, X., Wang, Z., Guan, P., Peng, H., et al. (2020). A collinearity-incorporating homology inference strategy for connecting emerging assemblies in Triticeae Tribe as a pilot practice in the plant pangenomic era. Mol. Plant 13, 1694–1708. doi: 10.1016/j.molp.2020.09.019
Chu, H., Chiecko, J., Punshon, T., Lanzirotti, A., Lahner, B., Salt, D. E., et al. (2010). Successful reproduction requires the function of Arabidopsis YELLOW STRIPE-LIKE1 and YELLOW STRIPE-LIKE3 metal-nicotianamine transporters in both vegetative and reproductive structures. Plant Physiol. 154, 197–210. doi: 10.1104/pp.110.159103
Connorton, J. M., Jones, E. R., Rodríguez-Ramiro, I., Fairweather-Tait, S., Uauy, C., and Balk, J. (2017). Wheat vacuolar iron transporter TaVIT2 transports Fe and Mn and is effective for biofortification. Plant Physiol. 174, 2434–2444. doi: 10.1104/pp.17.00672
Fu, L., Wu, J., Yang, S., Jin, Y., Liu, J., Yang, M., et al. (2020). Genome-wide association analysis of stem water-soluble carbohydrate content in bread wheat. Theor. Appl. Genet. 133, 2897–2914. doi: 10.1007/s00122-020-03640-x
Gómez-Galera, S., Rojas, E., Sudhakar, D., Zhu, C., Pelacho, A. M., Capell, T., et al. (2010). Critical evaluation of strategies for mineral fortification of staple food crops. Transgenic Res. 19, 165–180. doi: 10.1007/s11248-009-9311-y
Grillet, L., and Schmidt, W. (2019). Iron acquisition strategies in land plants: not so different after all. New Phytol. 224, 11–18. doi: 10.1111/nph.16005
Gupta, P. K., Balyan, H. S., Sharma, S., and Kumar, R. (2021). Biofortification and bioavailability of Zn, Fe and Se in wheat: present status and future prospects. Theor. Appl. Genet. 134, 1–35. doi: 10.1007/s00122-020-03709-7
Hamblin, M. T., Buckler, E. S., and Jannink, J. L. (2011). Population genetics of genomics-based crop improvement methods. Trends Genet. 27, 98–106. doi: 10.1016/j.tig.2010.12.003
Hänsch, R., and Mendel, R. R. (2009). Physiological functions of mineral micronutrients (Cu, Zn, Mn, Fe, Ni, Mo, B, Cl). Curr. Opin. Plant Biol. 12, 259–266. doi: 10.1016/j.pbi.2009.05.006
Hao, C., Jiao, C., Hou, J., Li, T., Liu, H., Wang, Y., et al. (2020). Resequencing of 145 landmark cultivars reveals asymmetric sub-genome selection and strong founder genotype effects on wheat breeding in China. Mol. Plant. 13, 1733–1751. doi: 10.1016/j.molp.2020.09.001
Holland, J. B., Carolina, N., Nyquist, W. E., and Lafayette, W. (2003). Estimating and interpreting heritability for plant breeding: an update. Plant Breed. Rev. 22, 11–112. doi: 10.1002/9780470650202.ch2
Ishimaru, Y., Kakei, Y., Shimo, H., Bashir, K., Sato, Y., Sato, Y., et al. (2011). A rice phenolic efflux transporter is essential for solubilizing precipitated apoplasmic iron in the plant stele. J. Biol. Chem. 286, 24649–24655. doi: 10.1074/jbc.M111.221168
Ishimaru, Y., Suzuki, M., Tsukamoto, T., Suzuki, K., Nakazono, M., Kobayashi, T., et al. (2006). Rice plants take up iron as an Fe 3+ -phytosiderophore and as Fe 2+. Plant J. 45, 335–346. doi: 10.1111/j.1365-313X.2005.02624.x
Jobson, E. M., Martin, J. M., Schneider, T. M., and Giroux, M. J. (2018). The impact of the Rht-B1b, Rht-D1b, and Rht-8 wheat semi-dwarfing genes on flour milling, baking, and micronutrients. Cereal Chem. 95, 770–778. doi: 10.1002/cche.10091
Kim, S. A., and Yoo, Y. J. (2016). Effects of single nucleotide polymorphism marker denstity on haplotype block partition. Genomics Inform. 14, 196–204. doi: 10.5808/GI.2016.14.4.196
Kobayashi, T. (2019). Understanding the Complexity of Iron Sensing and Signaling Cascades in Plants. Plant Cell Physiol. 60, 1440–1446. doi: 10.1093/pcp/pcz038
Kobayashi, T., and Nishizawa, N. K. (2012). Iron uptake, translocation, and regulation in higher plants. Annu. Rev. Plant Biol. 63, 131–152. doi: 10.1146/annurev-arplant-042811-105522
Korte, A., and Farlow, A. (2013). The advantages and limitations of trait analysis with GWAS: a review. Plant Methods 9:29. doi: 10.1186/1746-4811-9-29
Kusmec, A., and Schnable, P. S. (2018). FarmCPUpp: Efficient large-scale genomewide association studies. Plant Direct 2, 1–6. doi: 10.1002/pld3.53
Li, F., Wen, W., Liu, J., Zhang, Y., Cao, S., He, Z., et al. (2019). Genetic architecture of grain yield in bread wheat based on genome-wide association studies. BMC Plant Biol. 19:168. doi: 10.1186/s12870-019-1781-3
Liu, J., He, Z., Rasheed, A., Wen, W., Yan, J., Zhang, P., et al. (2017). Genome-wide association mapping of black point reaction in common wheat (Triticum aestivum L.). BMC Plant Biol. 17:220. doi: 10.1186/s12870-017-1167-3
Ludwig, Y., and Slamet-Loedin, I. H. (2019). Genetic biofortification to enrich rice and wheat grain iron: From genes to product. Front. Plant Sci. 10:833. doi: 10.3389/fpls.2019.00833
Murray, M. G., and Thompson, W. F. (1980). Rapid isolation of high molecular weight plant DNA. Nucleic Acids Res. 8, 4321–4326. doi: 10.1093/nar/8.19.4321
Paltridge, N. G., Milham, P. J., Ortiz-Monasterio, J. I., Velu, G., Yasmin, Z., Palmer, L. J., et al. (2012). Energy-dispersive X-ray fluorescence spectrometry as a tool for zinc, iron and selenium analysis in whole grain wheat. Plant Soil 361, 261–269. doi: 10.1007/s11104-012-1423-0
Pang, Y., Liu, C., Wang, D., Amand, P., Bernardo, A., Li, W., et al. (2020). High-resolution genome-wide association study identifies genomic regions and candidate genes for important agronomic traits in wheat. Mol. Plant 13, 1311–1327. doi: 10.1016/j.molp.2020.07.008
Peng, Y., Liu, H., Chen, J., Shi, T., Zhang, C., Sun, D., et al. (2018). Genome-wide association studies of free amino acid levels by six multi-locus models in bread wheat. Front. Plant Sci. 9:1196. doi: 10.3389/fpls.2018.01196
Platten, J. D., Cobb, J. N., and Zantua, R. E. (2019). Criteria for evaluating molecular markers: Comprehensive quality metrics to improve marker-assisted selection. PLoS One 14:e0210529. doi: 10.1371/journal.pone.0210529
Qiao, K., Wang, F., Liang, S., Wang, H., Hu, Z., and Chai, T. (2019). New biofortification tool: wheat TaCNR5 enhances zinc and manganese tolerance and increases zinc and manganese accumulation in rice grains. J. Agric. Food Chem. 67, 9877–9884. doi: 10.1021/acs.jafc.9b04210
Ramírez-González, R. H., Borrill, P., Lang, D., Harrington, S. A., Brinton, J., Venturini, L., et al. (2018). The transcriptional landscape of polyploid wheat. Science 361:eaar6089. doi: 10.1126/science.aar6089
Ramirez-Gonzalez, R. H., Uauy, C., and Caccamo, M. (2015). PolyMarker: A fast polyploid primer design pipeline: Fig. 1. Bioinformatics 31, 2038–2039. doi: 10.1093/bioinformatics/btv069
Rasheed, A., Hao, Y., Xia, X., Khan, A., Xu, Y., Varshney, R. K., et al. (2017). Crop breeding chips and genotyping platforms: Progress, challenges, and perspectives. Mol. Plant 10, 1047–1064. doi: 10.1016/j.molp.2017.06.008
Ren, Z., Bai, F., Xu, J., Wang, L., Wang, X., Zhang, Q., et al. (2021). A chloride efflux transporter OsBIRG1 regulates grain size and salt tolerance in rice. BioRxiv [Preprint]. doi: 10.1101/2021.03.07.434240
Segond, D., Dellagi, A., Lanquar, V., Rigault, M., Patrit, O., Thomine, S., et al. (2009). NRAMP genes function in Arabidopsis thaliana resistance to Erwinia chrysanthemi infection. Plant J. 58, 195–207. doi: 10.1111/j.1365-313X.2008.03775.x
Sun, C., Dong, Z., Zhao, L., Ren, Y., Zhang, N., and Chen, F. (2020). The Wheat 660K SNP array demonstrates great potential for marker-assisted selection in polyploid wheat. Plant Biotechnol. J. 18, 1354–1360. doi: 10.1111/pbi.13361
Tang, Y., Liu, X., Wang, J., Li, M., Wang, Q., Tian, F., et al. (2016). GAPIT Version 2: An enhanced integrated tool for genomic association and prediction. Plant Genome 9:0120. doi: 10.3835/plantgenome2015.11.0120
Tong, J., Sun, M., Wang, Y., Zhang, Y., Rasheed, A., Li, M., et al. (2020). Dissection of molecular processes and genetic architecture underlying iron and zinc homeostasis for biofortification: From model plants to common wheat. Int. J. Mol. Sci. 21:9280. doi: 10.3390/ijms21239280
Vasconcelos, M. W., Gruissem, W., and Bhullar, N. K. (2017). Iron biofortification in the 21st century: setting realistic targets, overcoming obstacles, and new strategies for healthy nutrition. Curr. Opin. Biotechnol. 44, 8–15. doi: 10.1016/j.copbio.2016.10.001
Velu, G., Singh, R. P., Crespo-Herrera, L., Juliana, P., Dreisigacker, S., Valluru, R., et al. (2018). Genetic dissection of grain zinc concentration in spring wheat for mainstreaming biofortification in CIMMYT wheat breeding. Sci. Rep. 8:13526. doi: 10.1038/s41598-018-31951-z
Wang, W., Wang, Z., Li, X., Ni, Z., Hu, Z., Xin, M., et al. (2020). SnpHub: an easy-to-set-up web server framework for exploring large-scale genomic variation data in the post-genomic era with applications in wheat. GigaScience 9, 1–8. doi: 10.1093/gigascience/giaa060
Waters, B. M., Chu, H., DiDonato, R. J., Roberts, L. A., Eisley, R. B., Lahner, B., et al. (2006). Mutations in Arabidopsis Yellow Stripe-Like1 and Yellow Stripe-Like3 reveal their roles in metal ion homeostasis and loading of metal ions in seeds. Plant Physiol. 141, 1446–1458. doi: 10.1104/pp.106.082586
Xu, D., Wen, W., Fu, L., Li, F., Li, J., Xie, L., et al. (2019). Genetic dissection of a major QTL for kernel weight spanning the Rht-B1 locus in bread wheat. Theor. Appl. Genet. 132, 3191–3200. doi: 10.1007/s00122-019-03418-w
Xu, X., Zhu, Z., Jia, A., Wang, F., Wang, J., Zhang, Y., et al. (2020). Mapping of QTL for partial resistance to powdery mildew in two Chinese common wheat cultivars. Euphytica 216:3. doi: 10.1007/s10681-019-2537-8
Yano, K., Yamamoto, E., Aya, K., Takeuchi, H., Lo, P., Hu, L., et al. (2016). Genome-wide association study using whole-genome sequencing rapidly identifies new genes influencing agronomic traits in rice. Nat. Genet. 48, 927–934. doi: 10.1038/ng.3596
Yin, C., Li, H., Li, S., Xu, L., Zhao, Z., and Wang, J. (2015). Genetic dissection on rice grain shape by the two-dimensional image analysis in one japonica × indica population consisting of recombinant inbred lines. Theor. Appl. Genet. 128, 1969–1986. doi: 10.1007/s00122-015-2560-7
Zhai, S., He, Z., Wen, W., Liu, J., Jin, H., Yan, J., et al. (2020). Genetic architecture of polyphenol oxidase activity in wheat flour by genome-wide association study. Crop Sci. 60, 1281–1293. doi: 10.1002/csc2.20038
Zhai, S., Liu, J., Xu, D., Wen, W., Yan, J., Zhang, P., et al. (2018). A genome-wide association study reveals a rich genetic architecture of flour color-related traits in bread wheat. Front. Plant. Sci. 9:1136. doi: 10.3389/fpls.2018.01136
Keywords: biofortification, candidate genes, GWAS, iron, zinc
Citation: Tong J, Zhao C, Sun M, Fu L, Song J, Liu D, Zhang Y, Zheng J, Pu Z, Liu L, Rasheed A, Li M, Xia X, He Z and Hao Y (2022) High Resolution Genome Wide Association Studies Reveal Rich Genetic Architectures of Grain Zinc and Iron in Common Wheat (Triticum aestivum L.). Front. Plant Sci. 13:840614. doi: 10.3389/fpls.2022.840614
Received: 21 December 2021; Accepted: 28 January 2022;
Published: 16 March 2022.
Edited by:
Yingyin Yao, China Agricultural University, ChinaReviewed by:
Wricha Tyagi, Central Agricultural University, IndiaJian Ma, Sichuan Agricultural University, China
Copyright © 2022 Tong, Zhao, Sun, Fu, Song, Liu, Zhang, Zheng, Pu, Liu, Rasheed, Li, Xia, He and Hao. This is an open-access article distributed under the terms of the Creative Commons Attribution License (CC BY). The use, distribution or reproduction in other forums is permitted, provided the original author(s) and the copyright owner(s) are credited and that the original publication in this journal is cited, in accordance with accepted academic practice. No use, distribution or reproduction is permitted which does not comply with these terms.
*Correspondence: Zhonghu He, hezhonghu02@caas.cn; Yuanfeng Hao, haoyuanfeng@caas.cn