 Jia-Xin Meng
 Hou-Hua Li
- College of Landscape Architecture and Art, Northwest A&F University, Yangling, China
The “Spring-red-leaf” crabapple cultivar has young red leaves and mature green leaves. However, the mechanism of anthocyanin biosynthesis in crabapple leaves in spring remains unknown. In this study, Illumina RNA sequencing (RNA-Seq) was performed on Malus ‘Radiant’ leaf tissues in different stages of development. Twenty-two genes in the anthocyanin biosynthesis pathway and 44 MYB transcription factors (TFs) were significantly enriched among differentially expressed genes (DEGs). Three R2R3-MYB TFs in subgroup 22 of the MYB TF family, MrMYB44-like1, MrMYB44-like2, and MrMYB44-like3, were highly expressed in green leaves according to RNA-Seq and quantitative real-time quantitative PCR results. Their expression levels were negatively correlated with anthocyanin content. In transient assays, overexpression of MrMYB44-like1, MrMYB44-like2, or MrMYB44-like3 inhibited anthocyanin accumulation and reduced pigment in leaf disks of M. ‘Radiant’ and fruit peels of M. domestica ‘Fuji.’ When the conserved region of the three MrMYB44-likes was silenced, the anthocyanin biosynthesis pathway was activated and pigments increased in both tissues. Moreover, bimolecular fluorescence complementation assays showed MrMYB44-likes interacted with MrWRKY6 to form protein complexes that regulated anthocyanin biosynthesis.
Introduction
Malus crabapple (Malus Mill.) is an ornamental deciduous tree or shrub in the family Rosaceae. It is a popular decorative plant in landscapes because of its pleasing form and attractive colors (Cui et al., 2018). Malus ‘Radiant’ is a “Spring-red-leaf” crabapple cultivar with young red leaves and green mature leaves, indicating complex changes in coloration. This quality trait is primarily determined by its metabolite composition (Yang et al., 2018).
Anthocyanins are the main pigments in flowers, leaves, and fruits and generate characteristic red, blue, and purple hues (Winkel-Shirley, 2001; Jaakola, 2013). Bright organ colors derived from anthocyanin accumulation directly determine the ornamental value of plants (Xie et al., 2012).
The anthocyanin metabolic pathway includes anthocyanin biosynthesis and degradation. Anthocyanin biosynthesis is derived from branches of the phenylalanine pathway (Koes et al., 2005; Petroni and Tonelli, 2011). Major enzymes include phenylalanine ammonia lyase (PAL), cinnamate-4-hydroxylase (C4H), 4-coumarate: CoA ligase (4CL), chalcone synthase (CHS), chalcone isomerase (CHI), flavanone 3-hydroxylase (F3H), flavonoid 3′-hydroxylase (F3′H), dihydroflavonol 4-reductase (DFR), anthocyanin synthase (ANS), and UDP-glucose: flavonoid 3-O-glu-cosyltransferase (UFGT). The enzymes encoded by the genes are responsible for biochemical reactions in anthocyanin biosynthesis (Honda et al., 2002). Anthocyanin degradation also affects color change. Loss of red pigmentation may be caused by increases in actively induced anthocyanin degradation, as well as termination of anthocyanin biosynthesis and dilution by growth (Oren-Shamir, 2009). Enzymes in three common families were recently found to participate in anthocyanin degradation, including β-glucosidase (BGLU), polyphenol oxidase (PPO), peroxidase (PER), and laccase (LAC) (Ying et al., 2018).
Expression of genes in the anthocyanin biosynthesis pathway is primarily regulated by a series of transcription factors (TFs). The MYB family of TFs is important in the anthocyanin biosynthesis pathway because it activates or inhibits genes by directly or indirectly binding the cis-acting element of DNA (Chen L. et al., 2019). As activators, MYB TFs usually form protein complexes with bHLH and WD40 (Albert et al., 2011). For example, the Aft (MYB) protein interacts with SlJAF13 (bHLH) and SlAN11 (WDR) forming an MBW complex and enhancing anthocyanin content in tomato (Solanum lycopersicum) (Yan et al., 2020). There has been a recent notable focus on MYB repressors (Ma and Constabel, 2019). The MYB repressors can act directly on promoters of structural genes (Yan et al., 2021), like NtMYB3 represses promoter activity of NtFLS in Chinese narcissus (Narcissus tazetta L. var. chinensis) (Anwar et al., 2019) and MdMYB6 inhibits the promoter activity of MdANS and MdGSTF12 in apple (Malus domestica) (Xu et al., 2020). They can also passively repress anthocyanin biosynthesis by interacting with bHLH proteins to compete with MYB activators in the MYB–bHLH complex, thereby reducing its activation capability. For example, MdMYB15L interacts with MdbHLH33 in Malus (Xu et al., 2018); VvMYB4b interacts with VvMYC1 (bHLH) in Vitis vinifera (Cavallini et al., 2015); and MtMYB2 interacts with MtTT8 (bHLH) in Medicago truncatula (Jun et al., 2015).
Moreover, other TF families also regulate anthocyanin biosynthesis via interaction with MYB TFs, like AtSPL9, negatively regulates anthocyanin accumulation through destabilization of a MYB-bHLH-WD40 transcriptional activation complex in Arabidopsis (Gou et al., 2011); PyWRKY26 interacts with PybHLH3 cotarget the PyMYB114 promoter resulting in anthocyanin accumulation in red-skinned pear (Pyrus L.) (Li et al., 2020); IbNAC56a and IbNAC56b interact with IbMYB340 and IbbHLH2 to positively regulate anthocyanin biosynthesis by binding to the IbANS promoter in sweet potato (Ipomoea batatas) (Wei et al., 2020).
Fading color in spring leaves is common, but for crabapple, the mechanism of changes in leaf coloration in natural conditions remains unclear. In this study, contents of anthocyanin metabolites and expression of differentially expressed genes (DEGs) in young red and green mature leaf tissues of M. ‘Radiant’ were analyzed to determine the key genes involved in anthocyanin biosynthesis. Then, the function of candidate key TFs was determined. This study increases understanding of the mechanism of pigmentation underlying color changes in leaves and therefore will facilitate breeding plants with desirable color traits.
Materials and Methods
Plant Material
Malus ‘Radiant’ plants were grown in the crabapple germplasm nursery of Northwest A&F University, Yangling, China, under natural conditions. During growth, leaf phenotype gradually changes during development and can be divided into four stages (S1–S4, Figure 1A). Tissue samples were immediately frozen in liquid nitrogen and stored at −80°C until RNA extraction and total anthocyanin and high-pressure liquid chromatography (HPLC) analyses.
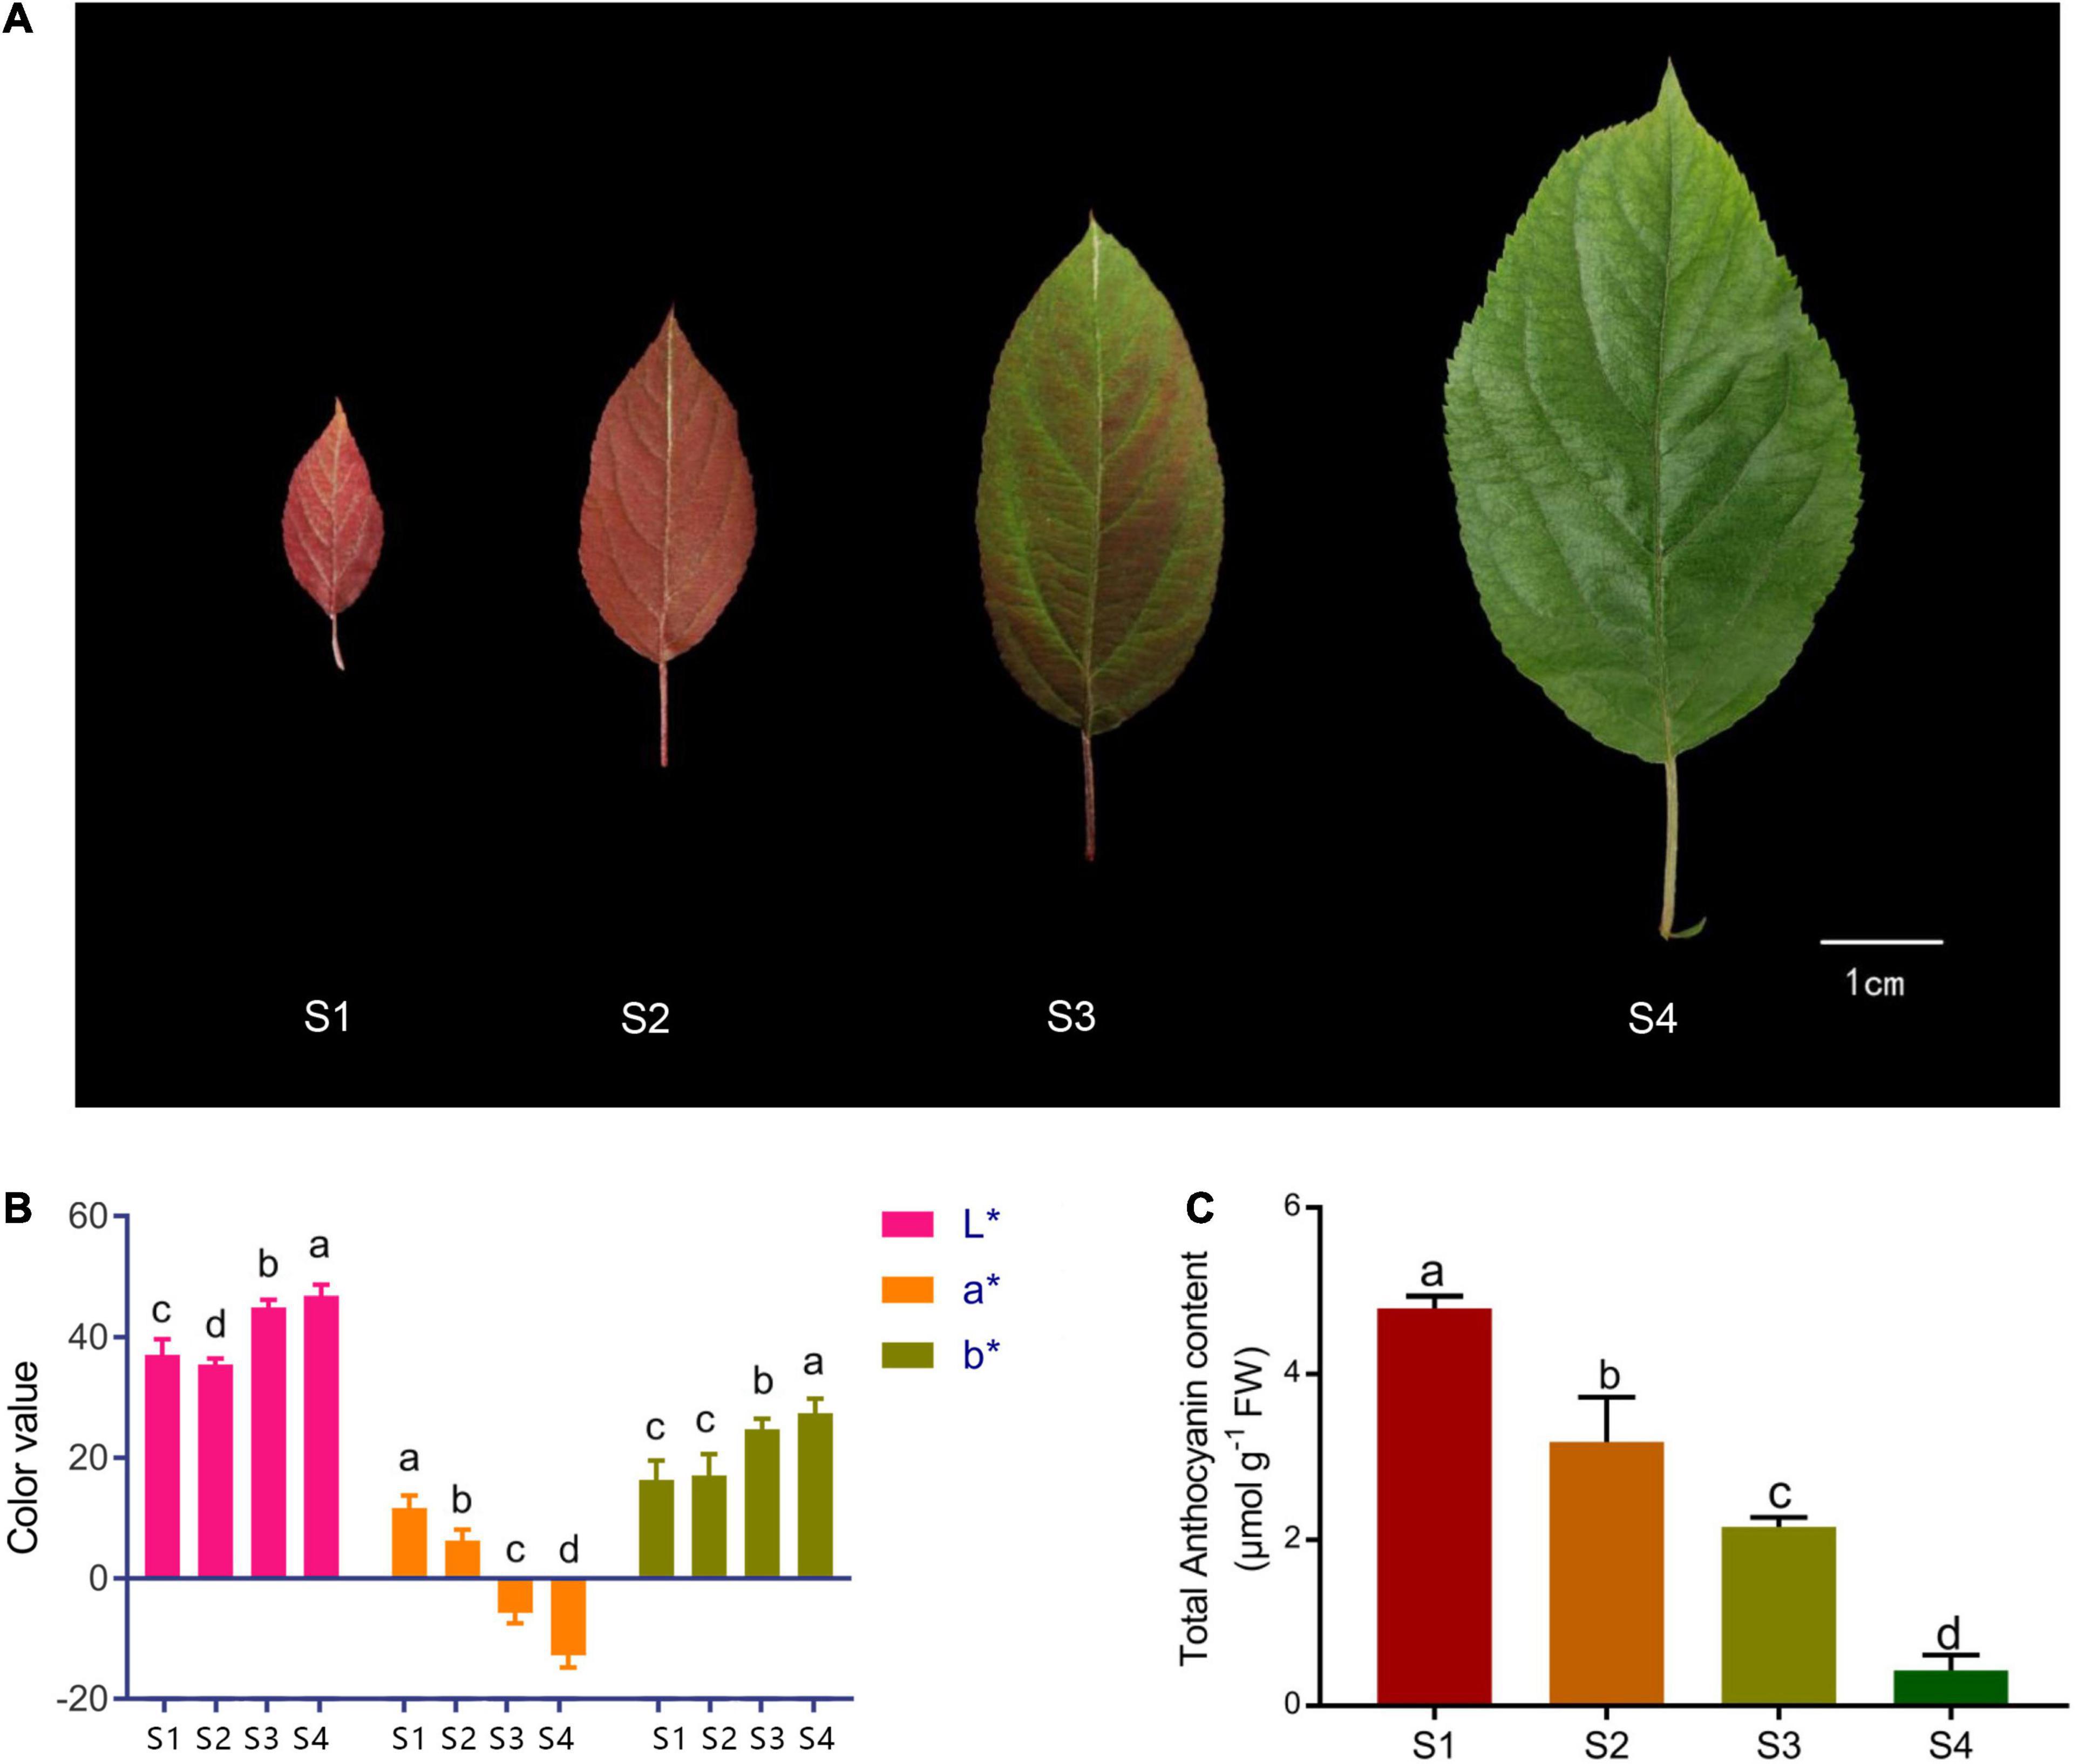
Figure 1. Phenotype and total anthocyanin content at different stages of spring leaf development in Malus ‘Radiant.’ (A) Leaf color at four stages (S1–S4). (B) L*, a*, and b* values of leaves at four stages. (C) Total anthocyanin content at four stages (FW, fresh weight). Error bars represent the standard errors. Different lowercase letters indicate significant differences among treatments according to one-way ANOVA test (P < 0.05).
Leaf Color Measurement
Colors of fresh leaves were measured with a CR-400 chroma meter (Konica Minolta, Tokyo, Japan). Parameters L*, a*, and b* were determined. Parameter L* indicates lightness (ranging from 0 to 100). Positive and negative values of a* are standard for red and green, respectively, and those of b* represent yellow and blue, respectively (both ranging from −60 to +60) (Mcguire, 1992; Liu et al., 2016). Means were based on five independent biological replicates with three technological replicates.
Measurement of Total Anthocyanin Contents
Total anthocyanins were extracted with a methanol–hydrochloric acid (HCL) solution (Lee and Wicker, 1991). Leaf samples (0.5 g) were incubated in 10 ml of methanol and 0.1% HCL (v/v) at 4°C for 48 h in the dark. Mixtures were centrifuged at 6,000 rpm for 3 min, and supernatants collected. Absorbance was measured at 530, 620, and 657 nm, in triplicate. Relative anthocyanin content was determined as follows:
Total anthocyanin content was normalized to the fresh weight (FW) of each sample.
High-Pressure Liquid Chromatography Analysis
Accurately weighed leaf samples (0.5 g) were leached with 10 ml of methanol at 4°C for 48 h in the dark and then stirred by ultrasonic waves for 1 h. Mixtures were centrifuged at 6,000 rpm for 3 min at 4°C and then set aside. Materials were separated using a Shimadzu LC-2030C liquid chromatograph (Shimadzu, Kyoto, Japan) equipped with an Inertsil C-18 column (5.0 mm particle size, 4.6 mm × 250 mm). The HPLC separation was performed as previously described by Han et al. (2020a). The respective structure was confirmed by comparison with a standard using LC–MS as described by Li et al. (2007). Measured results were compared with retention time and standard curve of the reference substance. Three biological replicates were analyzed in this section.
RNA Sequencing Data Analysis
Extraction of total RNA, library construction, RNA sequencing (RNA-Seq), RNA assembly, and DEG analysis of M. ‘Radiant’ leaves (S1 and S4, each with three biological replicates) were performed by Gene Denovo Biotechnology Co., (Guangzhou, China) as described previously (Han et al., 2020b). Malus × domestica HFTH1 Whole Genome version 1.01 was used to conduct transcriptome alignment.
All DEGs were mapped to the Gene Ontology (GO) database2 and the Kyoto Encyclopedia of Genes and Genomes (KEGG) pathways database.3 Gene numbers were calculated for every term, and significantly enriched GO terms in DEGs, compared with the genome background, were defined by hypergeometric test with FDR ≤ 0.05 as a threshold.
Quantitative Real-Time PCR Analysis
Total RNA was isolated following the method described previously. Approximately 1 μg of total RNA was used for first-strand cDNA synthesis using a PrimeScript™ RT reagent kit with a gDNA Eraser (TaKaRa Bio Inc., Shiga, Japan). Gene specific primers were designed with Primer Premier 5.0 (PREMIER Biosoft International, Palo Alto, CA, United States) and primer sequences are shown in Supplementary Table 1. The relative expression level of DEGs in the samples was determined using 2 × SYBR real-time PCR mixture kit (BioTeKe, Beijing, China) on the StepOnePlus real-time PCR system (Applied Biosystems, Waltham, MA, United States). 18S rRNA (DQ341382) was used as the internal control. All experiments were performed with three independent biological replicates and three technical replicates.
Construction of Expression Vectors
To construct MrMYB44-like1/2/3 overexpression vectors, MrMYB44-like1/2/3 cDNA sequences without a termination codon were inserted between BamHI and SalI of pCAMBIA2300-green fluorescent protein (GFP) vectors (35S: GFP). In addition, a 152-bp fragment of MrMYB44-like3 (411–563 bp), which is highly conserved in MrMYB44-like1, MrMYB44-like2, and MrMYB44-like3, was inserted between Kpn1 and Xhol of pTRV2 vectors to suppress MrMYB44-like gene expression. A Seamless Cloning and Assembly Kit (Novoprotein, Shanghai, China; primers are listed in Supplementary Table 1) was used to produce overexpression vectors 35S:MrMYB44-like1/2/3: GFP and gene silencing vector pTRV2-MrMYB44-like. Then, recombinant plasmids 35S:MrMYB44-like1/2/3: GFP, pTRV2-MrMYB44-like, pCAMBIA2300-35S: GFP empty vector, and pTRV1 and pTRV2 empty vectors were introduced into Agrobacterium tumefaciens GV3101 by the heat shock method.
Subcellular Localization
The 35S:MrMYB44-like1/2/3: GFP vectors described in the last section were used to identify subcellular localization of MrMYB44-likes. Recombinant (35S:MrMYB44-like1/2/3: GFP) and control (pCAMBIA2300-35S: GFP) vectors were introduced into 5-week-old Nicotiana benthamiana leaves by agroinfiltration. Infiltrated plants were grown for over 72 h in a growth chamber, and the GFP fluorescence of samples was observed under a confocal laser-scanning microscope (TCS SP8; Leica, Wetzlar, Germany).
Agroinfiltration in Fruit of Malus domestica ‘Fuji’
Procedures for overexpression and suppression of MrMYB44-likes by agroinfiltration in apple fruit were according to Li et al. (2012) with some modifications. Agrobacterium tumefaciens carrying pC2300-MrMYB44-like1/2/3 and empty pC2300 vectors were injected into the peel of freshly bagged apples using a needle-less syringe. Injected apples were treated in darkness at 4°C for 7 day and then transferred to 24 h of continuous white light (200 μmol m–2 s–1) with supplemental UV-B (280–320 nm) at 17°C in a growth chamber for 4 day.
To suppress MrMYB44-like expression, separate A. tumefaciens cultures containing pTRV1 and pTRV2-MrMYB44-like were mixed in a 1:1 ratio and then infiltrated into the fruit skin of freshly bagged apples using a needle-less syringe. Injected apples were treated as described above.
Agroinfiltration in Leaf Disks of Malus ‘Radiant’
Overexpression, suppression, and empty vector injections were prepared as described previously. Agroinfiltration in leaf disks was performed according to procedures described by Dai et al. (2012) with some modifications. Leaves (S1) of M. ‘Radiant’ were collected from trees grown in natural conditions. One-centimeter-diameter disks were taken from the center of leaves with a hole punch. Leaf disks were placed in a bacterial suspension solution and infiltrated under vacuum at 0.5 MPa for 15 s. After release of the vacuum, disks were washed in deionized water twice and kept in deionized water for 3 day at 4°C and then at 24°C for 3 day.
Bimolecular Fluorescence Complementation Assays
Constructs to investigate interactions were produced in pSPYNE-35S and pSPYCE-35S vectors by using bimolecular fluorescence complementation (BiFC) assays. The cDNAs without stop codons of MrMYB44-like1/2/3 were cloned into pSPYNE-35S, and those of MrbHLH3 and MrWRKY6 were cloned into pSPYCE-35S. Primers used for plasmid construction are listed in Supplementary Table 1. Constructs were transformed into A. tumefaciens by the heat shock method. Five-week-old Nicotiana benthamiana leaves were infiltrated with the mixed A. tumefaciens. Fluorescence signals were detected 72 h after infiltration using an inverted laser-scanning microscope with a 40 × water-immersion objective (TCS SP8; Leica, Wetzlar, Germany).
Results
Analysis of Pigment Levels and Differentially Expressed Genes in Spring Leaves
Leaves of M. ‘Radiant’ changed from red to green during spring growth (Figure 1A). The values of chromatic parameters L* and b* increased gradually and peaked in S4 (Figure 1B). By contrast, values of a* decreased to negative in S3 and reached the lowest value in S4. To investigate physiological changes in leaves of different colors, total anthocyanin content was determined by extraction with methanol–HCL. Total anthocyanin content was highest in S1, reaching 4.79 μmol g–1 FW, and then decreased gradually in other stages, reaching 0.43 μmol g–1 FW in S4 (Figure 1C). Anthocyanin constituents and contents in the four leaf stages were determined using HPLC. Cyanidin 3-galactoside chloride and cyanidin-3-O-glucoside chloride were both found in S1 and S2, but cyanidin-3-O-glucoside chloride was not detected in S3 and S4. Changes in contents of the two compounds were consistent with those of total anthocyanin (Table 1). Nine other types of phenolic compounds were also identified, including five flavonols, two flavanols, and one flavone (Table 1). Because anthocyanin contents were significantly different (P < 0.05), stages S1 and S4 were selected for RNA-sequencing.
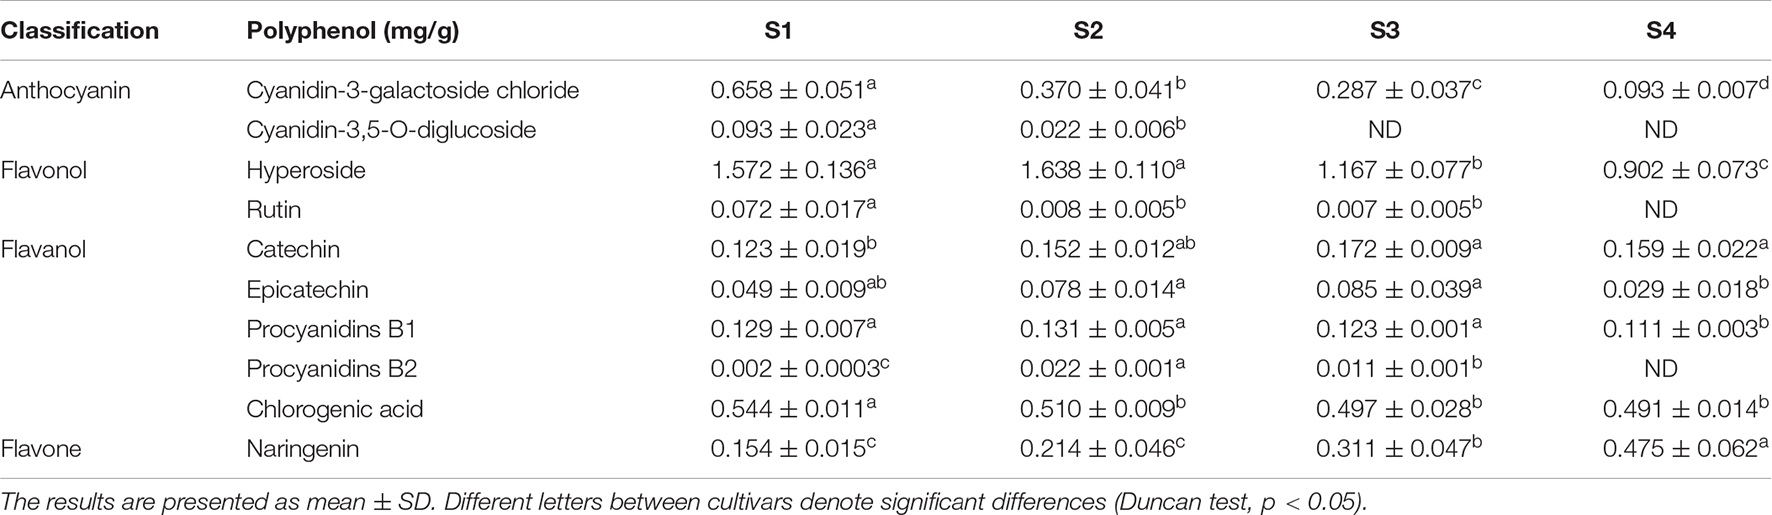
Table 1. The HPLC results of leaf extraction of Malus ‘Radiant.’
Six RNA libraries from M. ‘Radiant’ leaves (S1 and S4, each with three biological replicates) were sequenced. After removing adapter sequences and low-quality reads, raw reads of each sample were equal to or greater than 48,141,832 (Supplementary Table 2). Clean reads with a Q-score of 30 or higher (i.e., base call accuracy ≥ 99.9%) accounted for more than 94% of the total. The GC content (ratio of guanine and cytosine content to total nucleobases) ranged from 47 to 49%. Total mapping of each library was greater than 89%, and average unique mapping was greater than 85%. These results indicated transcriptomic data were suitable for further analysis.
Differentially expressed genes between the two leaf stages were identified. The overall distribution of DEGs is shown in a volcano plot (Figure 2A). A total of 14,660 DEGs were detected (Figure 2A). In the comparison between S1 and S4, 8,790 DEGs were identified, with 4,071 genes up-regulated and 4,719 genes down-regulated (Figure 2A).
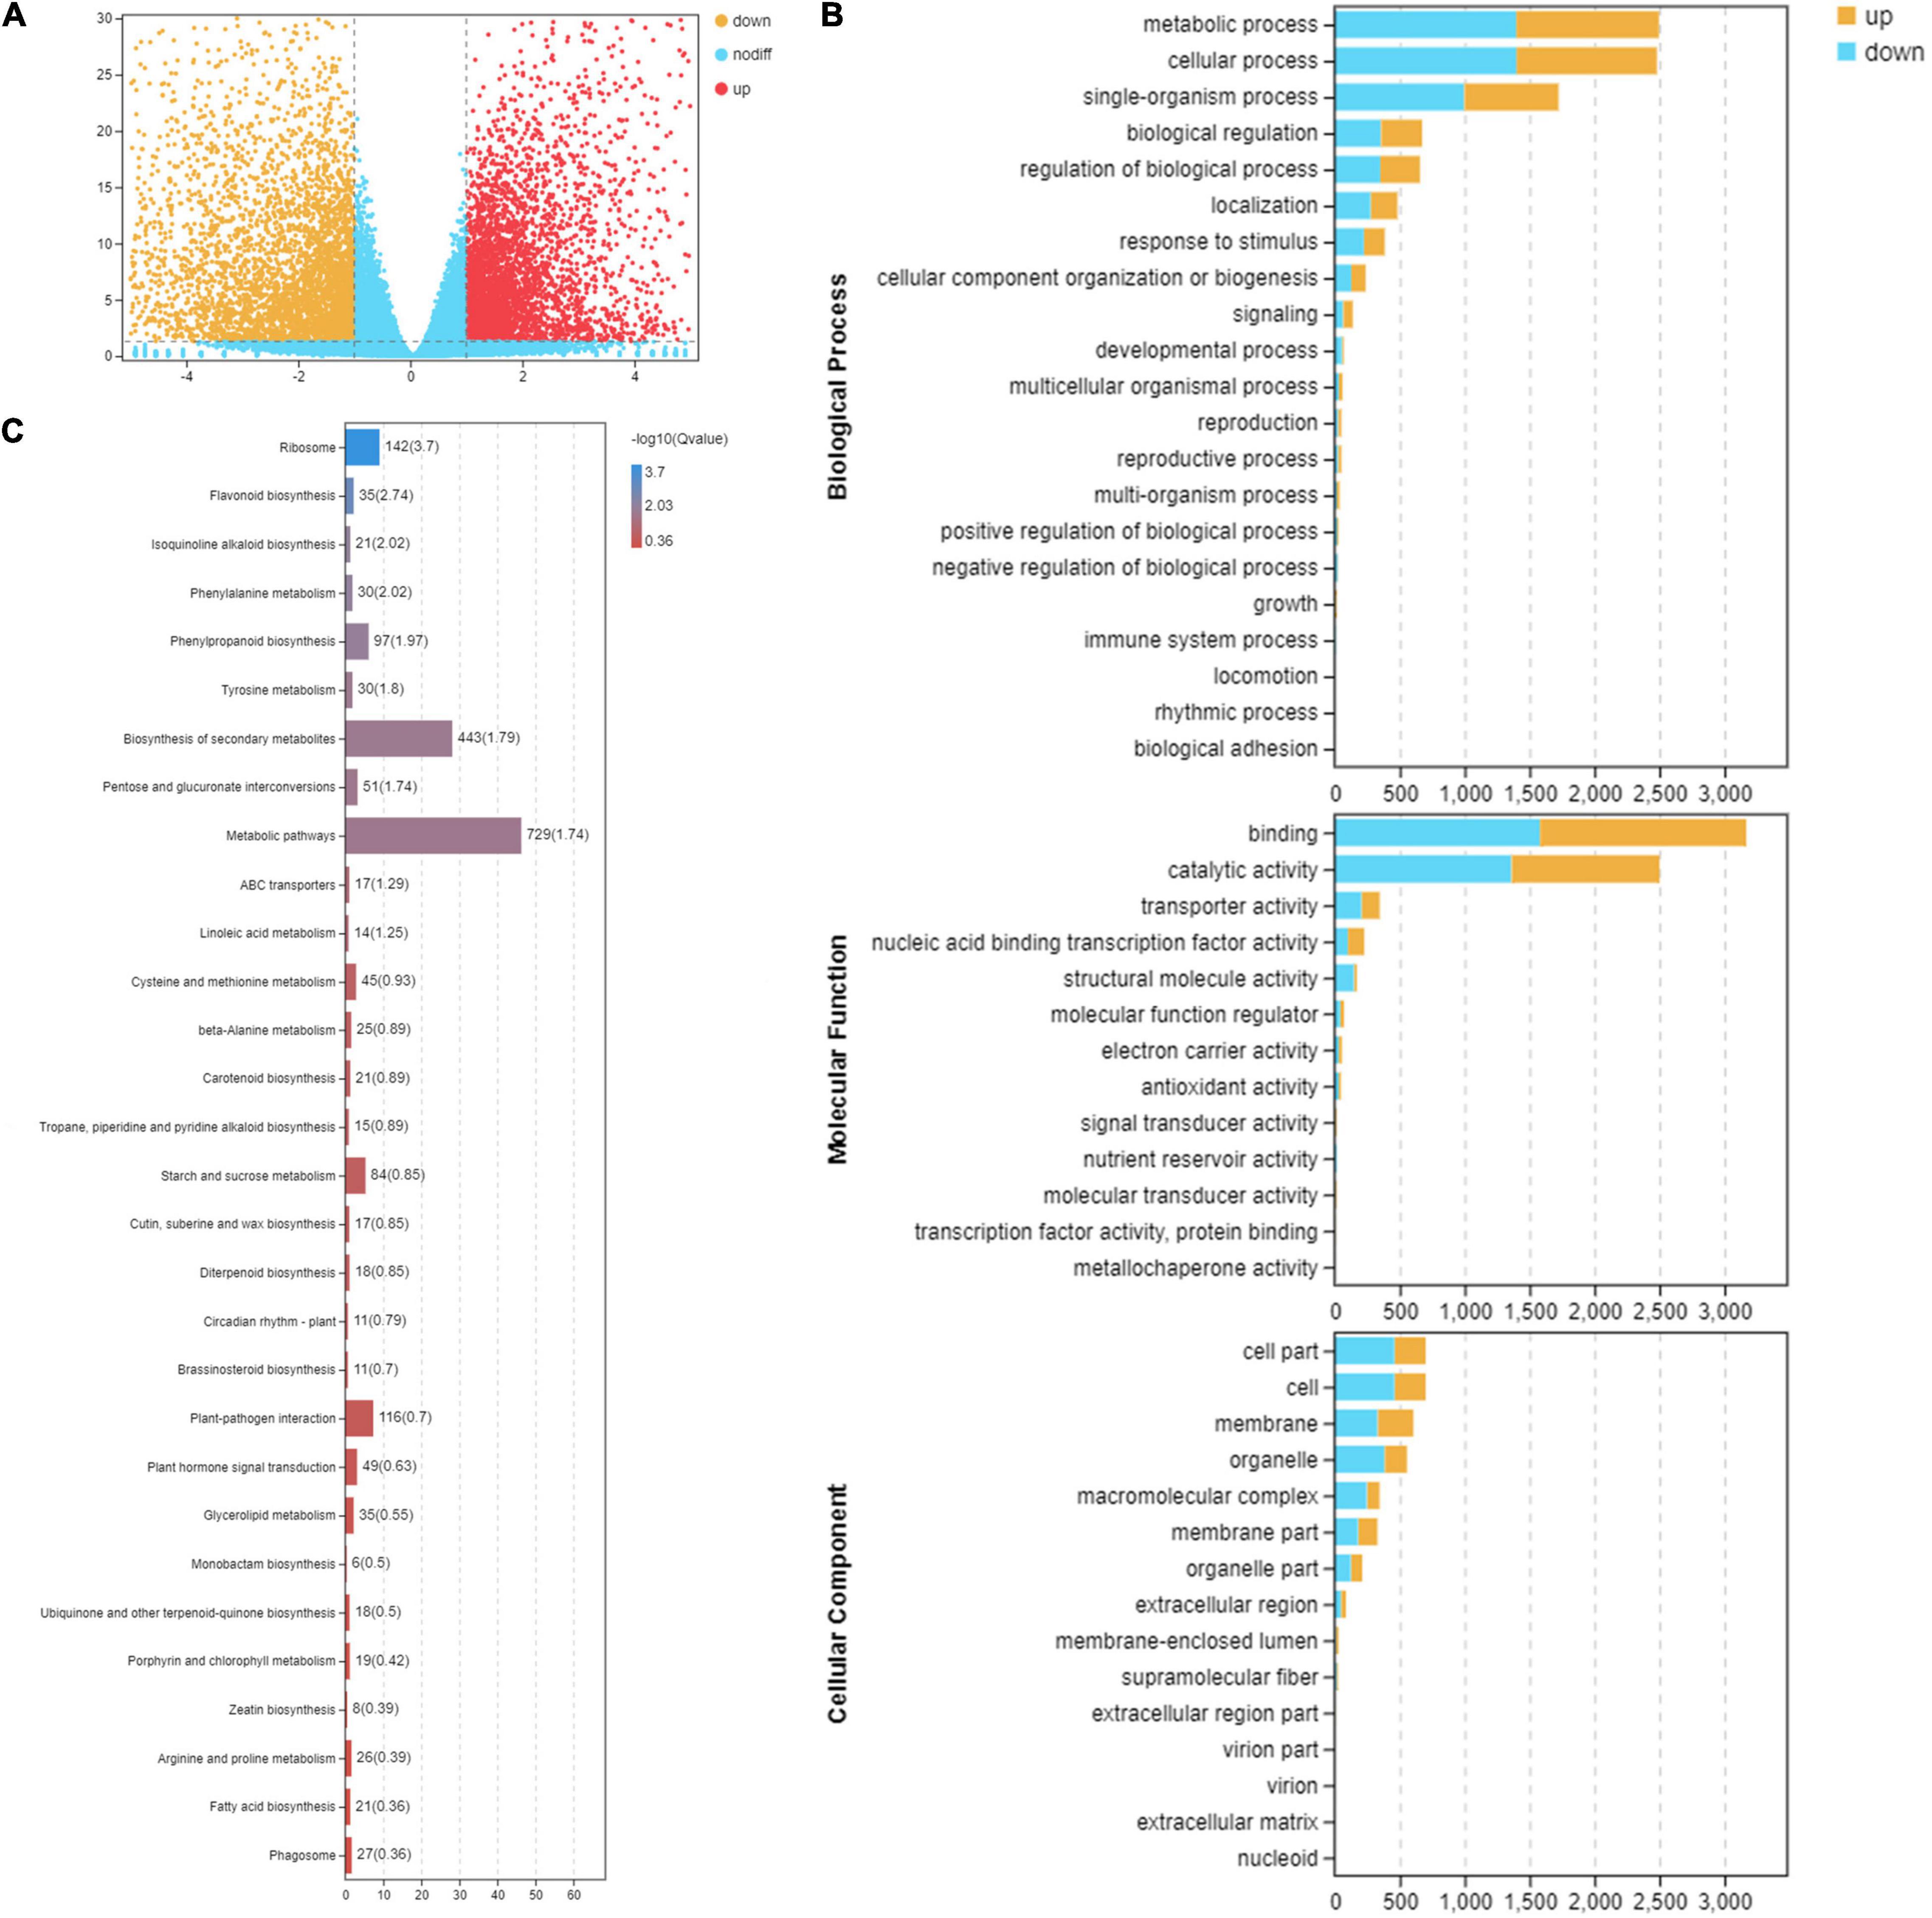
Figure 2. Functional analysis of differentially expressed genes between consecutive developmental stages. (A) The volcano distribution map of differentially expressed genes in the leaves at stage 1 (S1) and stage 4 (S4) on RNA-seq experiments. The genes were classified into three classes. Yellow genes are up-regulated gene expression, red indicates up-regulated gene expression, and blue indicates genes were not differentially expressed. The x-axis represents log2(fold change); the y-axis represents -log10 values. (B) Gene Ontology enrichment analysis in pairwise comparison between S1 and S4. Yellow indicates up-regulated genes, and blue indicates down-regulated genes. (C) Kyoto Encyclopedia of Genes and Genomes pathway enrichment analysis in pairwise comparison between S1 and S4.
Gene Ontology and Kyoto Encyclopedia of Genes and Genomes Pathway Enrichment Analyses of Differentially Expressed Genes
In the GO classification, 14,660 matched DEGs were categorized into 49 GO terms in three major GO ontologies, with 21 in biological process, 13 in molecular function, and 15 in cellular component (Figure 2B). In the KEGG database, 1,503 DEGs were mapped to 130 pathways, representing metabolism, genetic information processing, organism systems, cellular processes, and environmental information processing. Moreover, pathways closely associated with change in leaf pigmentation were significantly enriched, including flavonoid biosynthesis, phenylalanine metabolism, phenylpropanoid biosynthesis, biosynthesis of secondary metabolites, carotenoid biosynthesis, and porphyrin and chlorophyll metabolism (Figure 2C). The genes involved in pathways related to change in leaf pigmentation in M. ‘Radiant’ were investigated further.
Analysis of Genes Associated With Anthocyanin Metabolites
Twenty-two DEGs were involved in anthocyanin biosynthesis (Figure 3A). Phenylpropanoid and polyketide pathways contained two PAL, three C4H, and two 4CL genes. Early anthocyanin biosynthesis involved four CHS, three CHI, two F3H, and one F3’H gene, whereas one DFR, two ANS, and three UFGT genes were involved in later stages of biosynthesis. Most enzyme-encoding genes had higher FPKM (fragment per kilobase of transcript per million mapped reads) values in S1 than in other stages, except one C4H and one UFGT (Figure 3A). Consistent with low anthocyanin content in S4, expression of most genes was also very low (Supplementary Table 3).
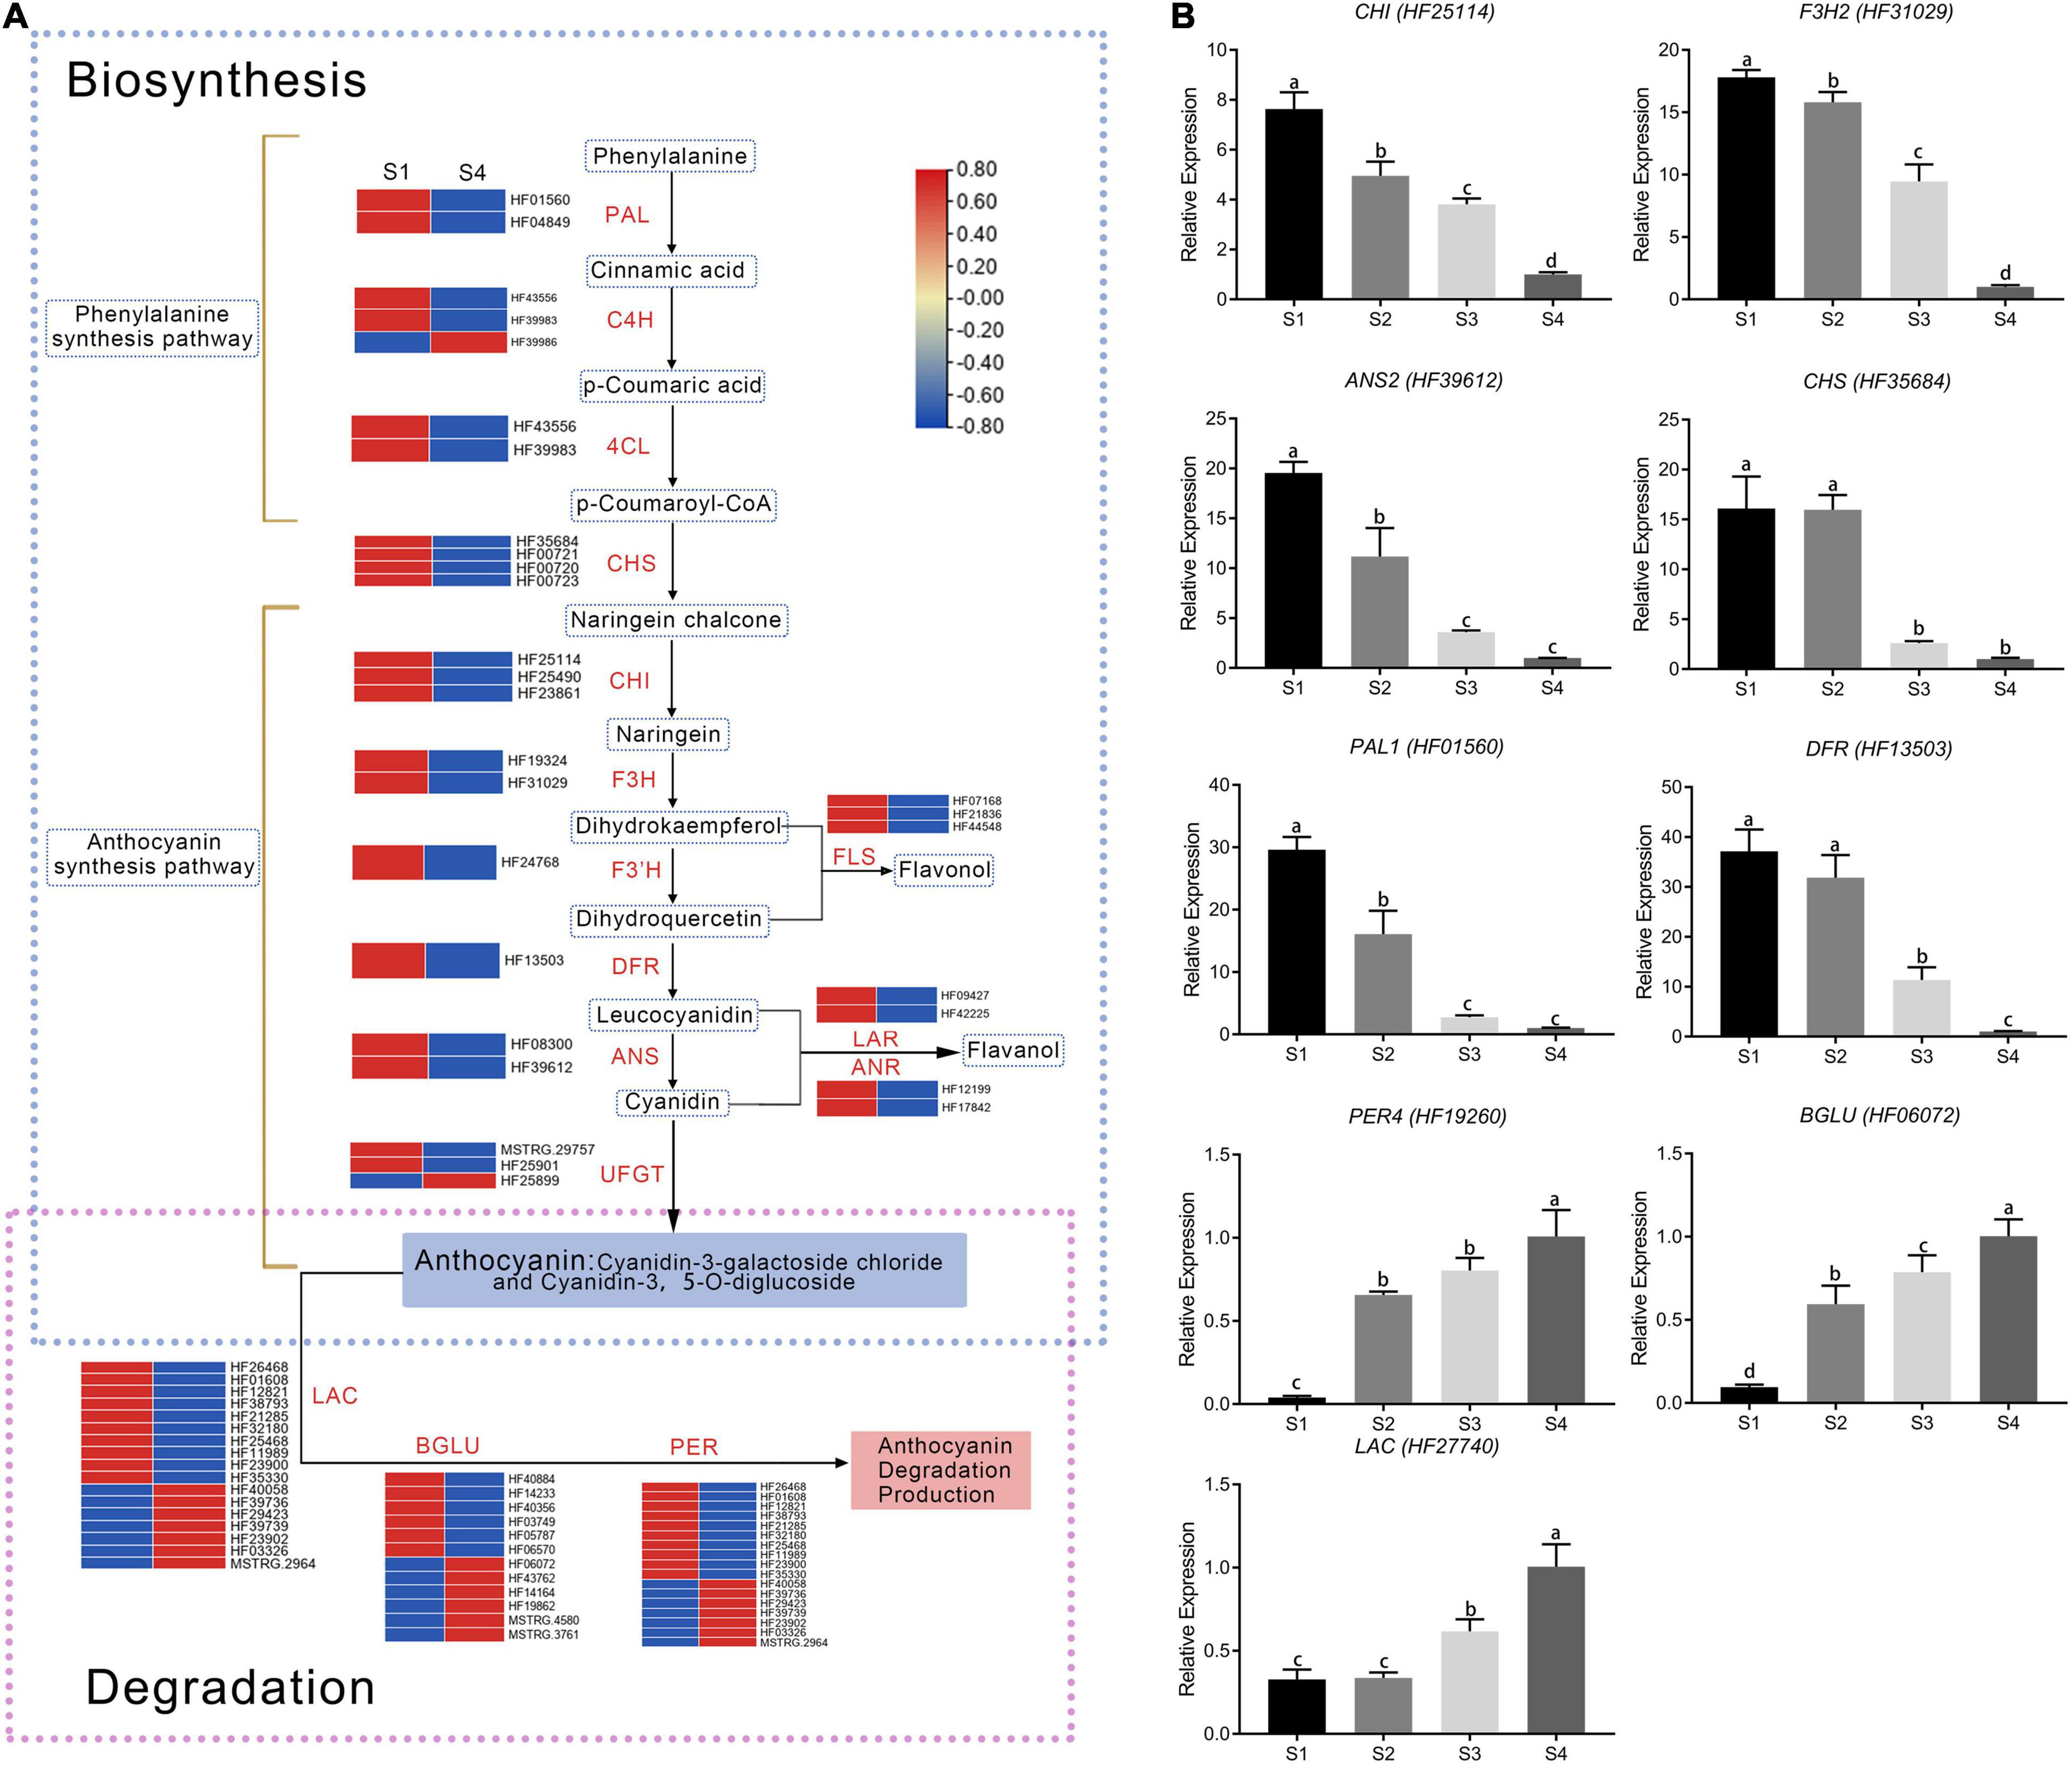
Figure 3. Expression of differentially expressed genes involved in anthocyanin pathways. (A) Expression analysis of flavonoid pathway genes at S1 and S4 stages in fruit. Expression was evaluated via RNA-seq with three biological replicates. Log2 fold change represents expression. (B) Validation of RNA-seq expression profiles in stages S1–S4 via real-time quantitative RT-PCR. Values were calculated relative to the transcription level in S4 (set to one). Error bars represent the standard errors. Different lowercase letters indicate significant differences among treatments according to one-way ANOVA test (P < 0.05).
Genes with FPKM values less than one were excluded in the study. The remaining targets included 18 laccase genes, 17 peroxidase genes, and 12 β-glucosidase genes (Figure 3A). Among them, 10 laccase, 10 peroxidase, and 6 β-glucosidase genes had relatively low expression in S1 but relatively high expression in S4. Those genes were negatively correlated with anthocyanin content (Supplementary Table 3), indicating they promoted anthocyanin degradation.
Results from quantitative real-time PCR (qRT-PCR) were used to validate whether differences in RNA-seq levels of DEGs involved in the anthocyanin metabolism pathway reflected actual transcription levels in M. ‘Radiant’ leaves at different stages of development (Figure 3B). Expression patterns of six anthocyanin biosynthesis genes [MrPAL (HF01560), MrCHS (HF35684), MrCHI (HF25114), MrF3H (HF31029), MrDFR (HF13503), and MrANS (HF39612)] and three anthocyanin degradation genes [MrLAC (HF27740), MrPER4 (HF19260), and MrBGLU (HF06072)] obtained by qRT-PCR were consistent with RNA-Seq data, confirming expression patterns in the four stages of development (Figure 3B). Expression levels of anthocyanin biosynthesis genes gradually decreased as red faded from leaves. By contrast, the anthocyanin degradation genes MrLAC, MrPER4 and MrBGLU were most highly expressed in S4.
To screen potential regulators of anthocyanin biosynthesis, 12 TF families were identified. After removal of genes with extremely low expression (FPKM < 1), 44 MYBs, 37 bHLHs, 1 WD40, 34 WRKYs, 8 SPLs, 2 HY5s, 7 LBDs, 22 HSPs, 11 T, 38 ERFs, 94 NACs, and 4 bZIPs were identified. In MYB, WRKY, HSP, ERF and bZIP families, more genes had higher expression in S4 than in S1. By contrast, in bHLH, WD40, SPL, HY5, LBD, TCP, and NAC families, more genes had lower expression in S4 than in S1 (Table 2). All TF families had complex expression patterns (Supplementary Table 4). Gene expression in the same family was either positively or negatively correlated with anthocyanin content, which indicated a complex network regulated change in leaf coloration.
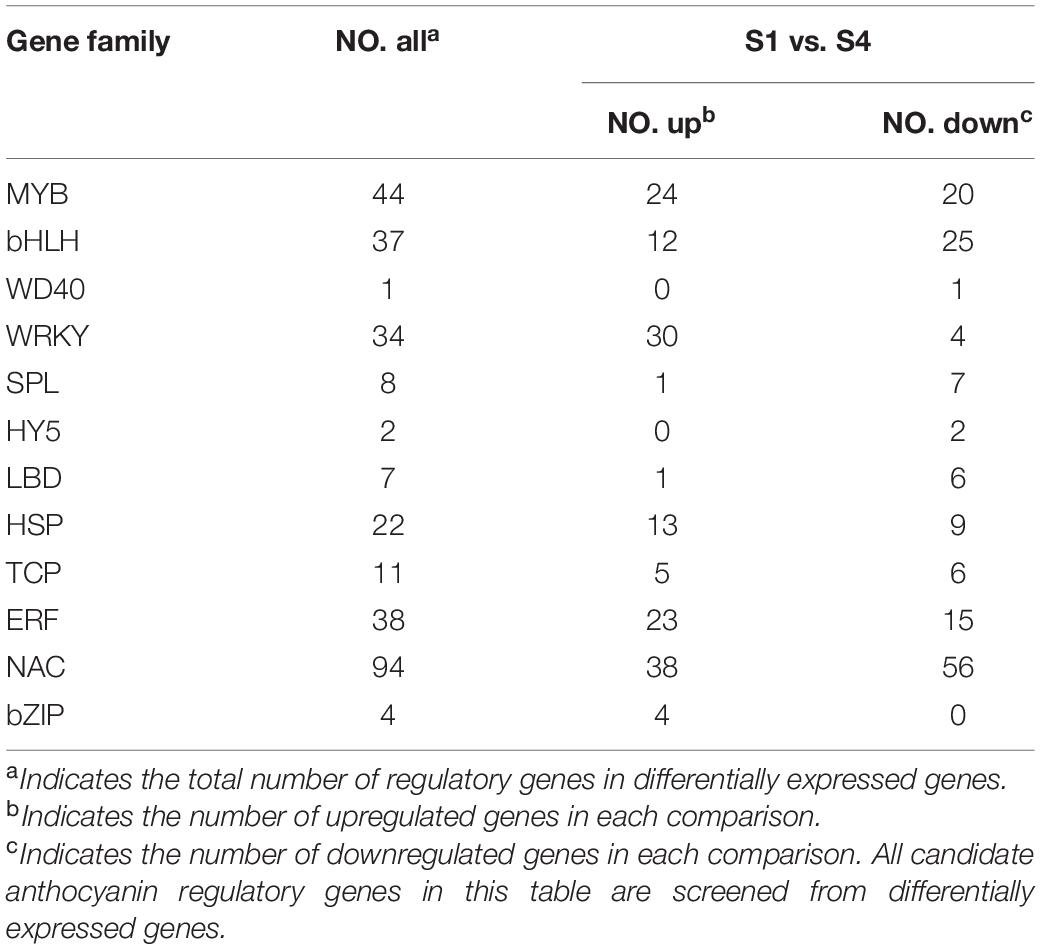
Table 2. Candidate anthocyanin regulatory genes in Malus ‘Radiant.’
Analysis of MYB Transcription Factors Identified as Differentially Expressed Genes
In RNA-Seq data, 44 MYBs were identified as DEGs (both R2R3 MYBs and R3 MYBs). Heat map and motif analysis are shown in Supplementary Figure 1. Notably, expression of three MYBs (HF13071, HF21590, and HF27377) increased 2.76 to 3.68-log2fold in S4, with FPKM values ranging from 91.07 to 257.49, which were higher than those of most of other MYB DEGs (Supplementary Table 3). Results from qRT-PCR showed that expression of all three genes increased as leaves changed from red to green in S1–S4, consistent with RNA-seq expression patterns (Figure 4). These results suggested the three MYBs negatively regulated anthocyanin biosynthesis.
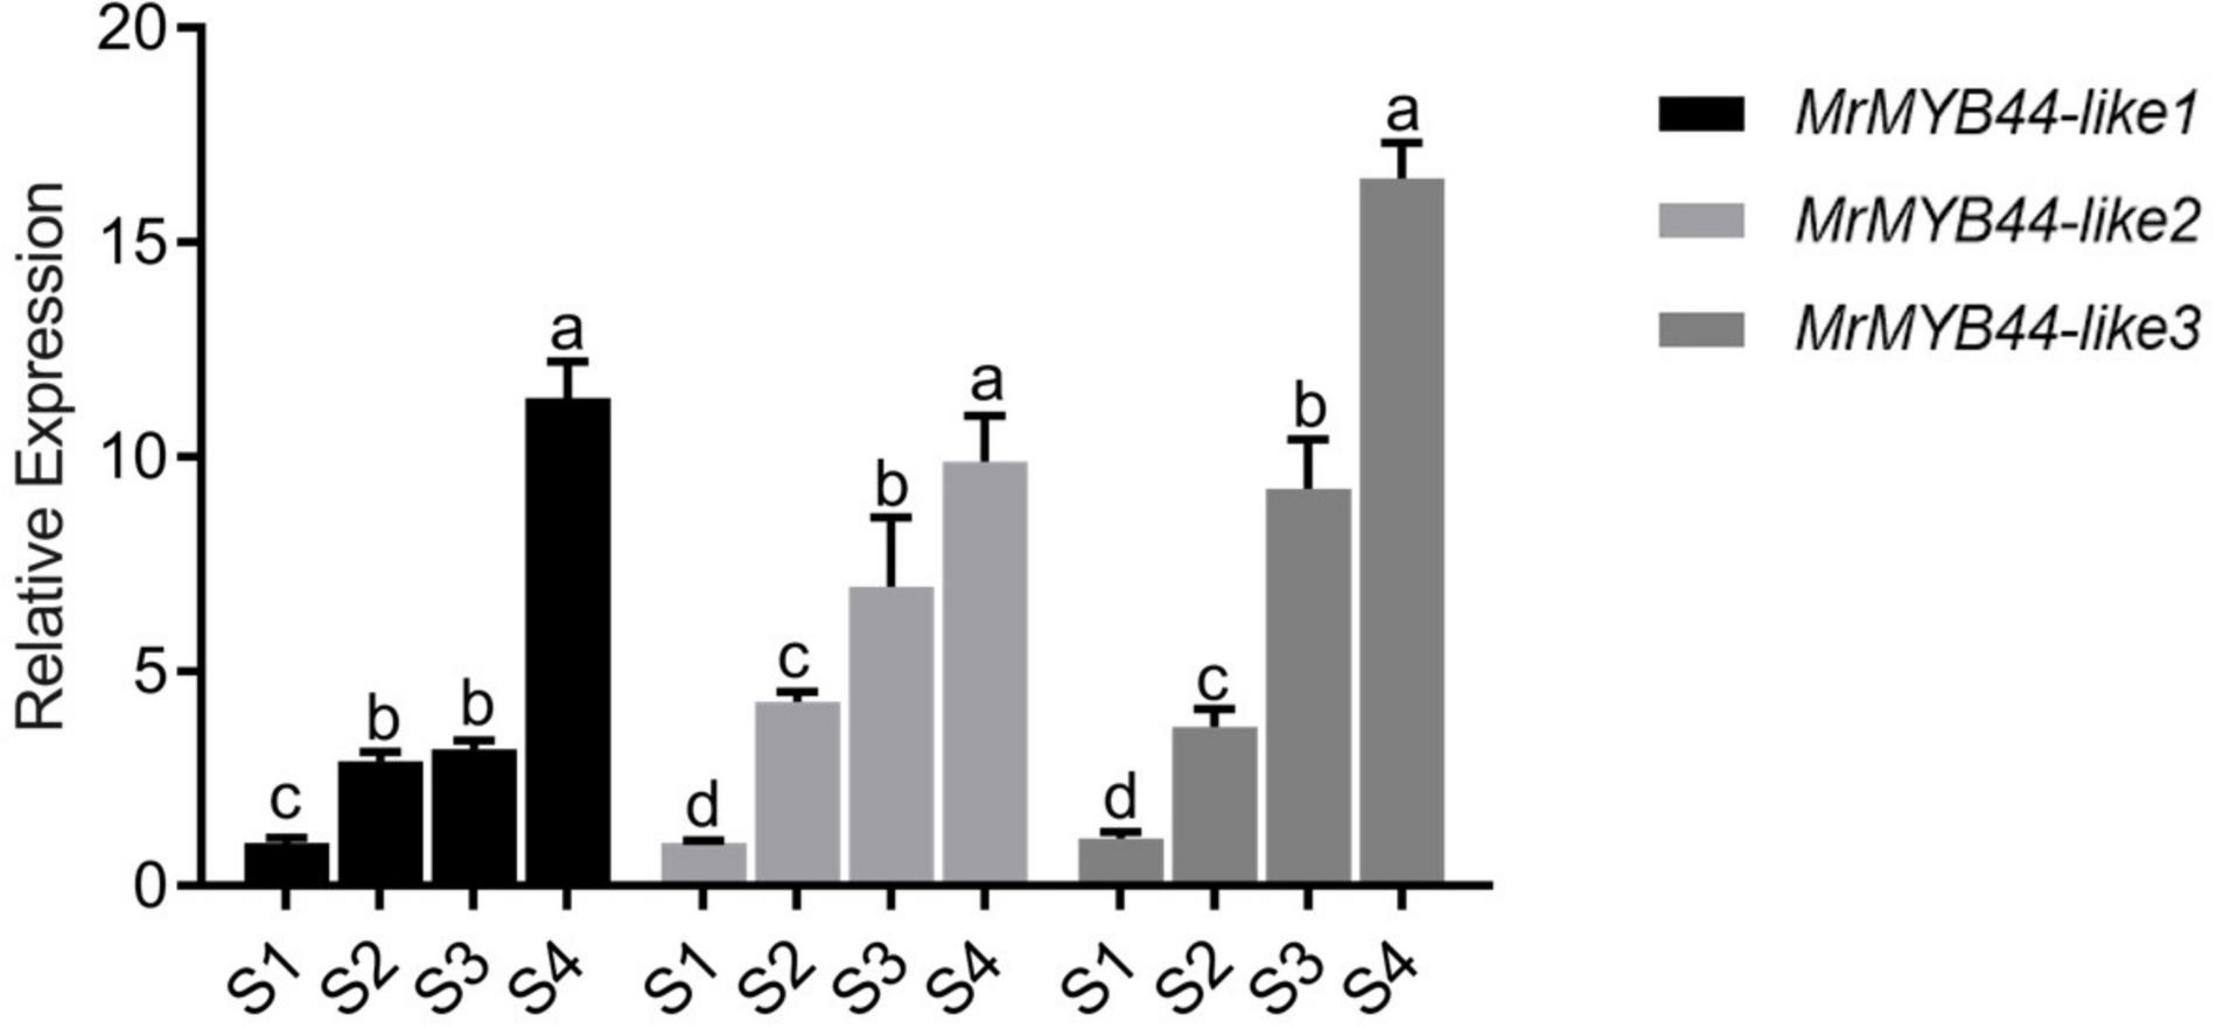
Figure 4. Transcript levels of MrMYB44-like1, MrMYB44-like2, and MrMYB44-like3 at different stages of development (S1–S4) in Malus ‘Radiant.’ Values were calculated relative to the transcription level of S1 (set to one). Error bars represent the standard errors. Different lowercase letters indicate significant differences among treatments according to one-way ANOVA test (P < 0.05).
Phylogenetic analysis was performed on the differentially expressed MYB TFs and 126 Arabidopsis MYBs from the TAIR4 (Supplementary Figure 2). The 44 MYB DEGs were divided into 24 subgroups. The three MYBs (HF13071, HF21590, and HF27377) were in subgroup 22 which including AtMYB44 (AT5G67300), AtMYB70 (AT2G23290), AtMYB73 (AT4G37260), and AtMYB77 (AT3G50060) (Supplementary Figure 2). Then, all of these three MYBs were used for basic local alignment search tool (BLAST)p queries against the genome of Malus in National Center for Biotechnology Information (NCBI) GenBank database, and they were close BLAST match to three MdMYB44-like genes, respectively. HF13071 is 100% match to NP_001315844.1, and HF21590 is 100% match to NP_001287808.1, and HF27377 is 99.68% match to XP_028963833.1. Therefore, HF13071, HF21590, and HF27377 were designated as MrMYB44-like1, MrMYB44-like2, and MrMYB44-like3, respectively. In addition, the 44 MYBs were located on chromosomes 1–17 (Supplementary Figure 3).
Cloning and Subcellular Localization of MrMYB44-Likes
Full-length sequences of MrMYB44-like1, MrMYB44-like2, and MrMYB44-like3 were obtained from RNA-seq, and cDNA prepared from M. ‘Radiant’ S4 leaf RNA was used as templates for PCR amplification of gene sequences (Supplementary Table 1). Amino acid sequence alignment indicated the deduced proteins of MrMYB44-like1, MrMYB44-like2, and MrMYB44-like3 shared 41.1, 39.6, and 48.45% sequence identity, respectively, with AtMYB44. As shown in Supplementary Figure 4, MrMYB44-like1, MrMYB44-like2, and MrMYB44-like3 all contained the conserved motifs of subgroup 22, including 22.1 (TGLYMSPxSP), 22.2 (D/EPP/MTxLxLSLP), and 22.3 (GxFMxVVQEMIxxEVRSYM) (Stracke et al., 2010; Zhou et al., 2017). Motif 22.2 is partially conserved with the EAR motif found in subgroup 4 R2R3 MYB repressors. Additionally, the conserved bHLH-interacting motif amino acid ([D/E]Lx2[R/K]x3Lx6Lx3R) was not found in MrMYB44-likes and other amino acid sequences except in AtMYB4 and FaMYB1. In addition, genes MrMYB44-like1, MrMYB44-like2, and MrMYB44-like3 were on chromosomes 15, 8, and 2, respectively (Supplementary Figure 3).
To examine subcellular localization of MrMYB44-like1/2/3, recombinant (35S:MrMYB44-like1/2/3: GFP) and control (pCAMBIA2300-35S: GFP) vectors were introduced into tobacco leaves by agroinfiltration. The GFP fluorescence of the control vector was clearly distributed throughout the entire cell (Supplementary Figure 4A), whereas 35S:MrMYB44-like1/2/3: GFP vectors displayed strong fluorescence signals in the nuclei of tobacco cells (Supplementary Figures 4B–D). Therefore, the three R2R3-MYB TFs, MrMYB44-like1/2/3, were likely localized and functioned in the nucleus.
MrMYB44-Like Negatively Regulates Peel Coloration in Malus domestica ‘Fuji’
To verify MrMYB44-likes down-regulated anthocyanin biosynthesis, overexpression vectors (pCambia2300) of MrMYB44-like1, MrMYB44-like2, and MrMYB44-like3 were constructed. Overexpression was initiated by an agrobacterium-mediated transformation method. Gene expression was suppressed by virus-induced gene silencing (VIGS), using a TRV vector. Vectors contained a conserved MrMYB44-like region, and in principle, could silence the expression of MrMYB44-like1, MrMYB44-like2, and MrMYB44-like3.
Overexpression of MrMYB44-like1, MrMYB44-like2, and MrMYB44-like3 inhibited fruit peel coloration around injection sites, whereas there was obvious red coloration in sites without injection and with injection of empty pCambia2300 vectors (Figure 5A). Subsequently, RT-qPCR revealed that MrMYB44-like1, MrMYB44-like2, and MrMYB44-like3 transcript levels in overexpression peel sites increased by approximately three- to six-fold (Figure 5B), whereas expression of anthocyanin biosynthesis genes, such as MrPAL, MrCHS, MrCHI, MrDFR, and MrANS, decreased (Figure 5B). By contrast, with silencing of MrMYB44-likes, red pigmentation increased around injection sites, compared with sites without injection and with injection of empty TRV2 vectors (Figure 6A). Expression levels of the three MrMYB44-likes decreased by approximately three- to four-fold, whereas those of the anthocyanin biosynthesis genes greatly increased by approximately two- to twelve-fold (Figure 6B). The abundance of those gene transcripts was consistent with pigmentation.
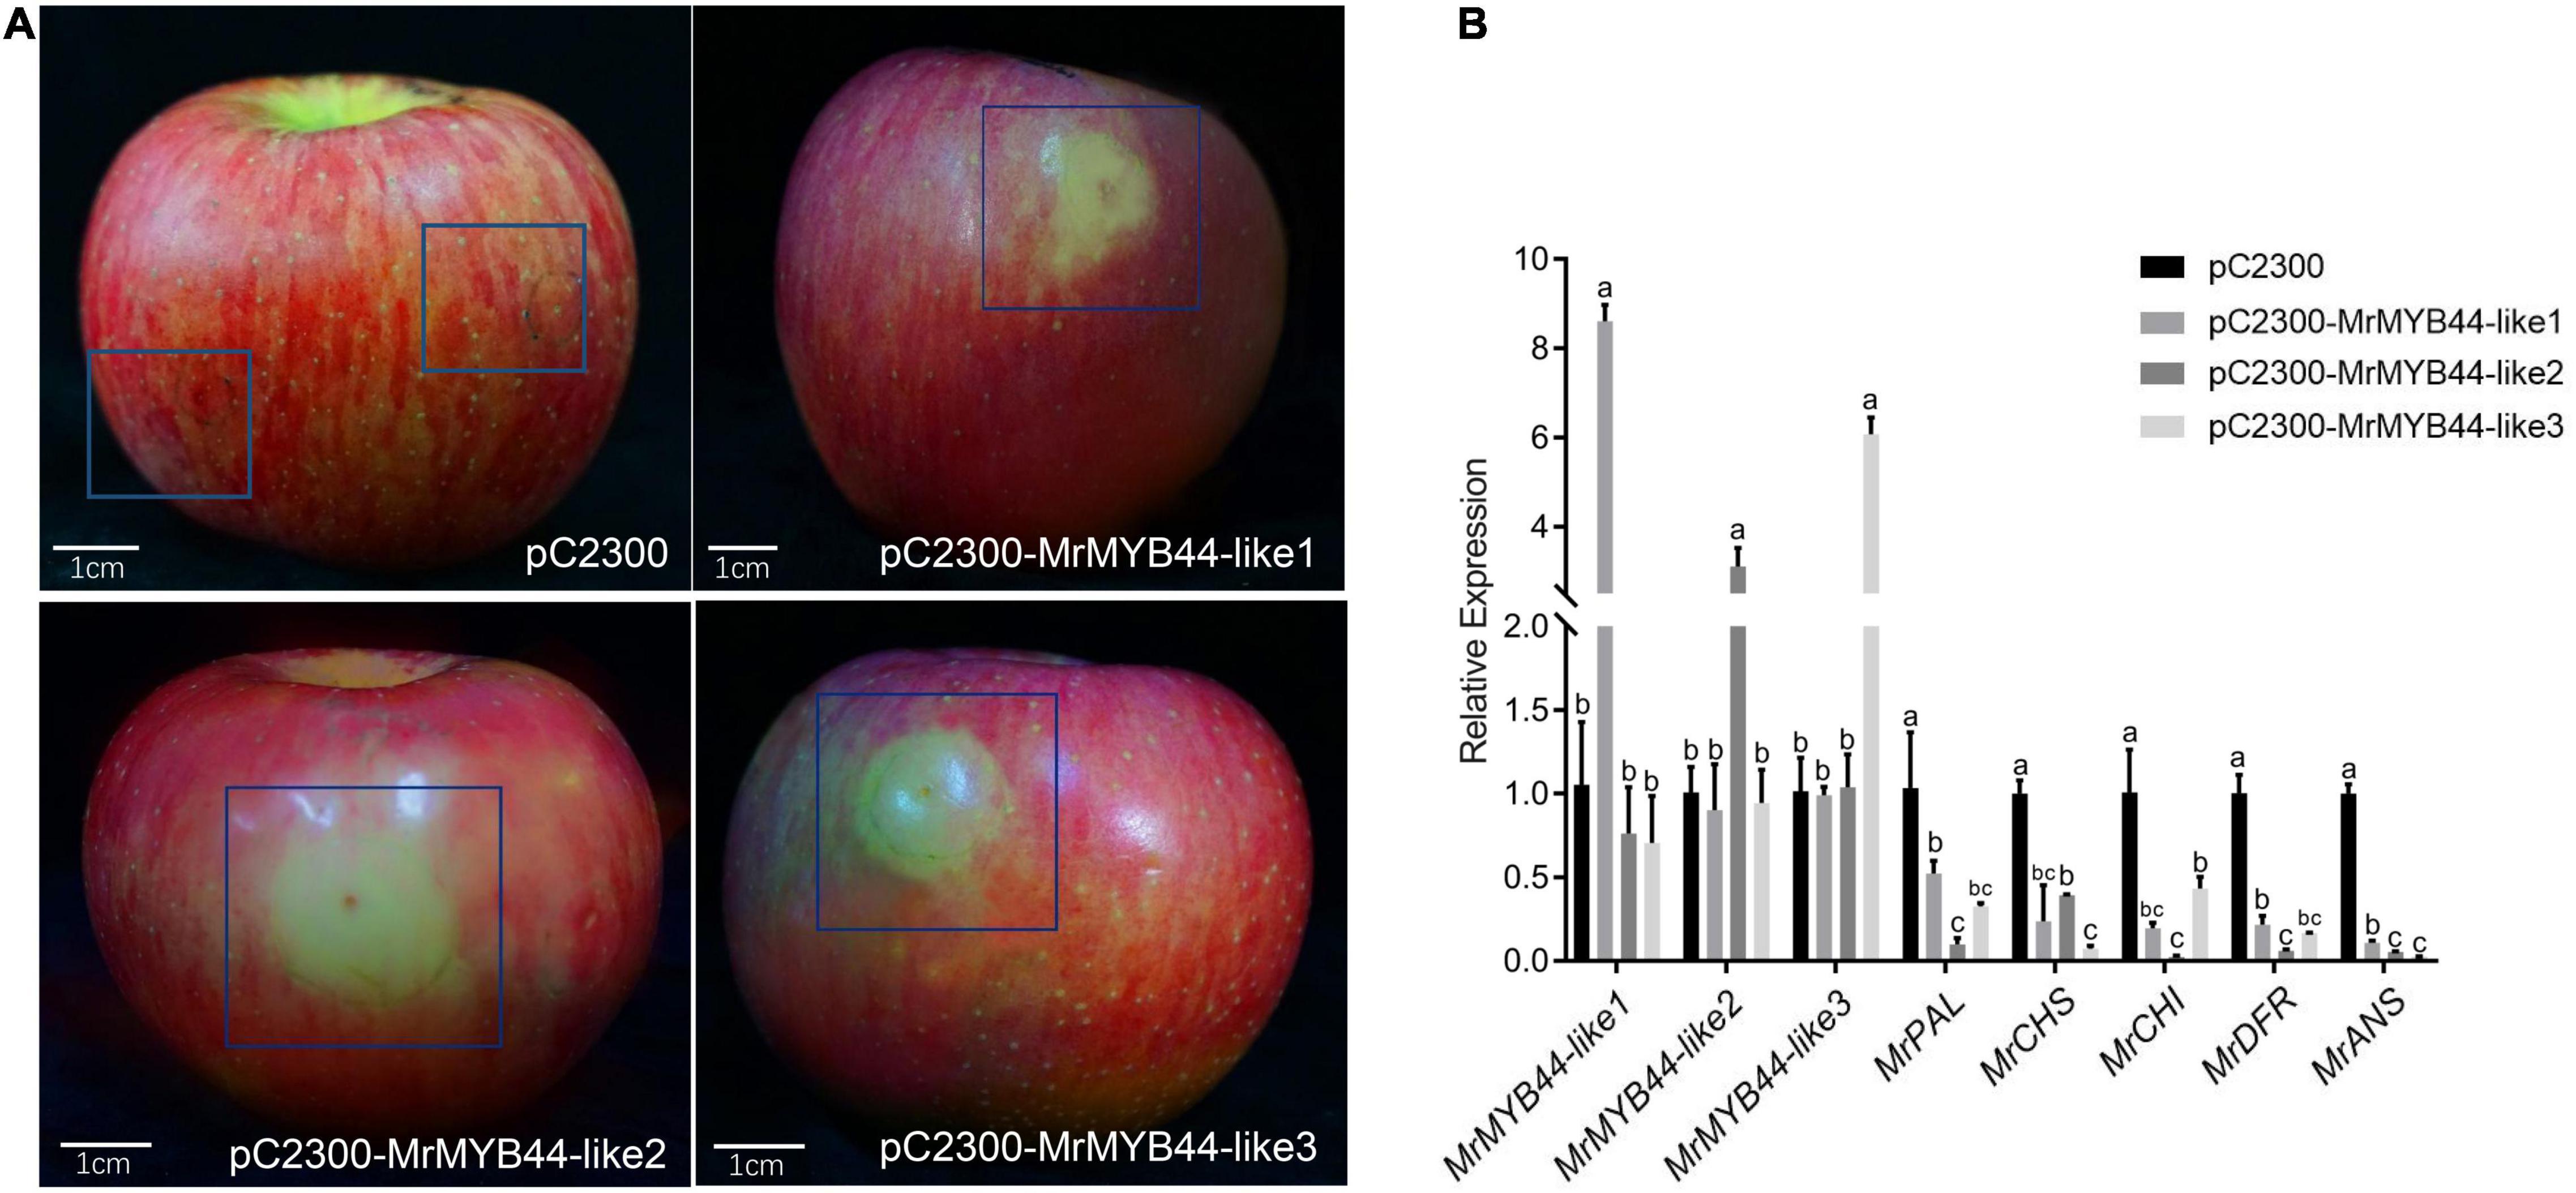
Figure 5. MrMYB44-likes negatively regulate color formation in apple transformation assays. (A) Malus domestica ‘Fuji’ fruit peel coloration around injection sites. pC2300-MYB44-likes were used for overexpression with the pCambia2300 vector. Empty vectors were the control. (B) Transcript levels of MrMYB44-likes and other anthocyanin biosynthesis genes in M. domestica ‘Fuji’ fruit peel around injection sites. Values were calculated relative to the transcription level of the control (set to one). Error bars represent the standard errors. Different lowercase letters indicate significant differences among treatments according to one-way ANOVA test (P < 0.05).
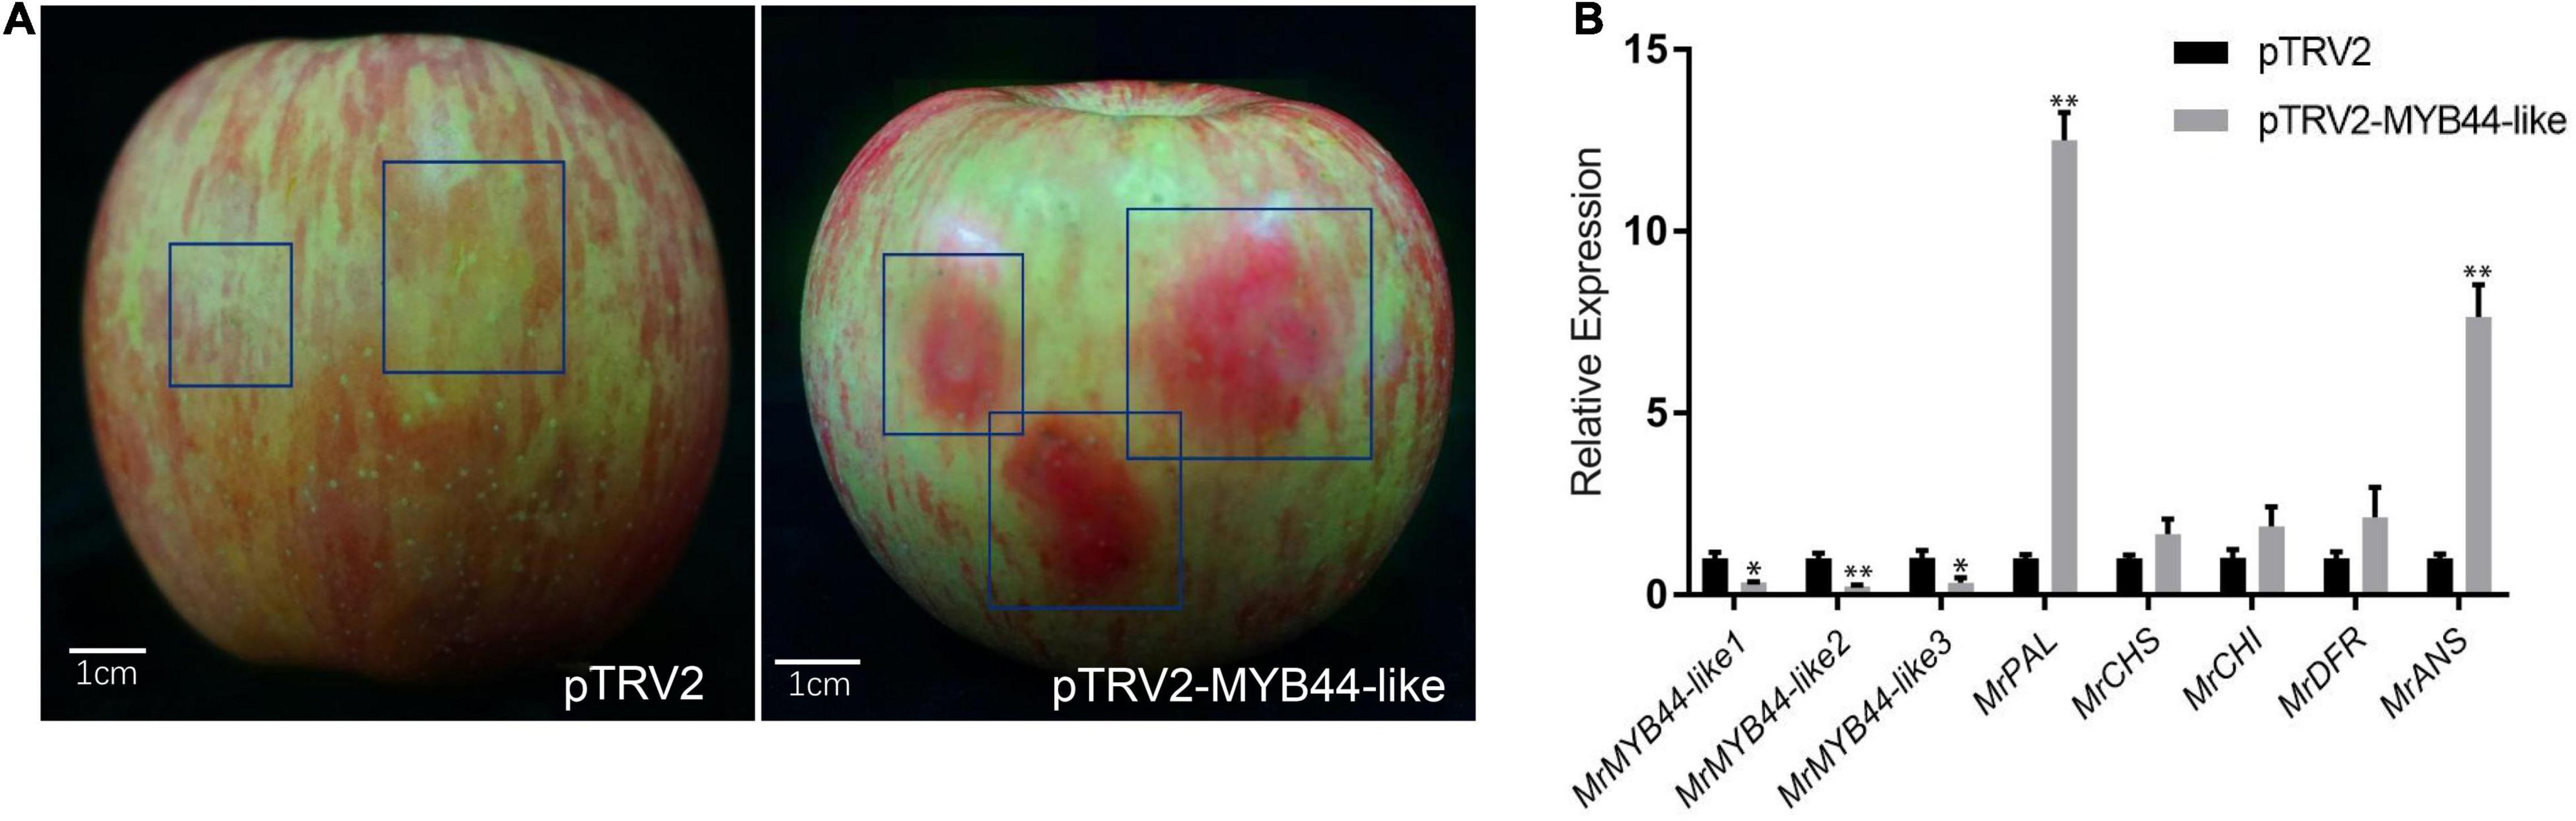
Figure 6. MrMYB44-likes negatively regulate color formation in apple in viral vector-based transformation assays. (A) Malus domestica ‘Fuji’ fruit peel coloration around injection sites. Antisense MrMYB44-like (pTRV2-MrMYB44-like) was used for suppression with the TRV vector. Empty TRV2 vectors were the control. (B) Transcript levels of MrMYB44-likes and other biosynthesis genes in M. domestica ‘Fuji’ fruit peel around injection sites. Error bars represent the standard errors. *P < 0.05, **P < 0.01 using the t-test.
MrMYB44-Like Negatively Regulates Anthocyanin Biosynthesis in Leaf Disks of Malus ‘Radiant’
To verify MrMYB44-likes repressed anthocyanin biosynthesis in crabapple leaves, red, young leaf disks collected in spring were infected with overexpression and suppression recombinant vectors. There was inevitable passive anthocyanin degradation because the leaves were cultured in vitro, and as a result, empty vector (both pCambia2300 and pTRV2)-infected leaf disks also faded to some degree at 3 days post-infection. However, fading of red in the overexpression group was greater than that in those untreated and treated with empty vectors as leaves turned green, whereas the silenced group maintained the red phenotype (Figure 7A).
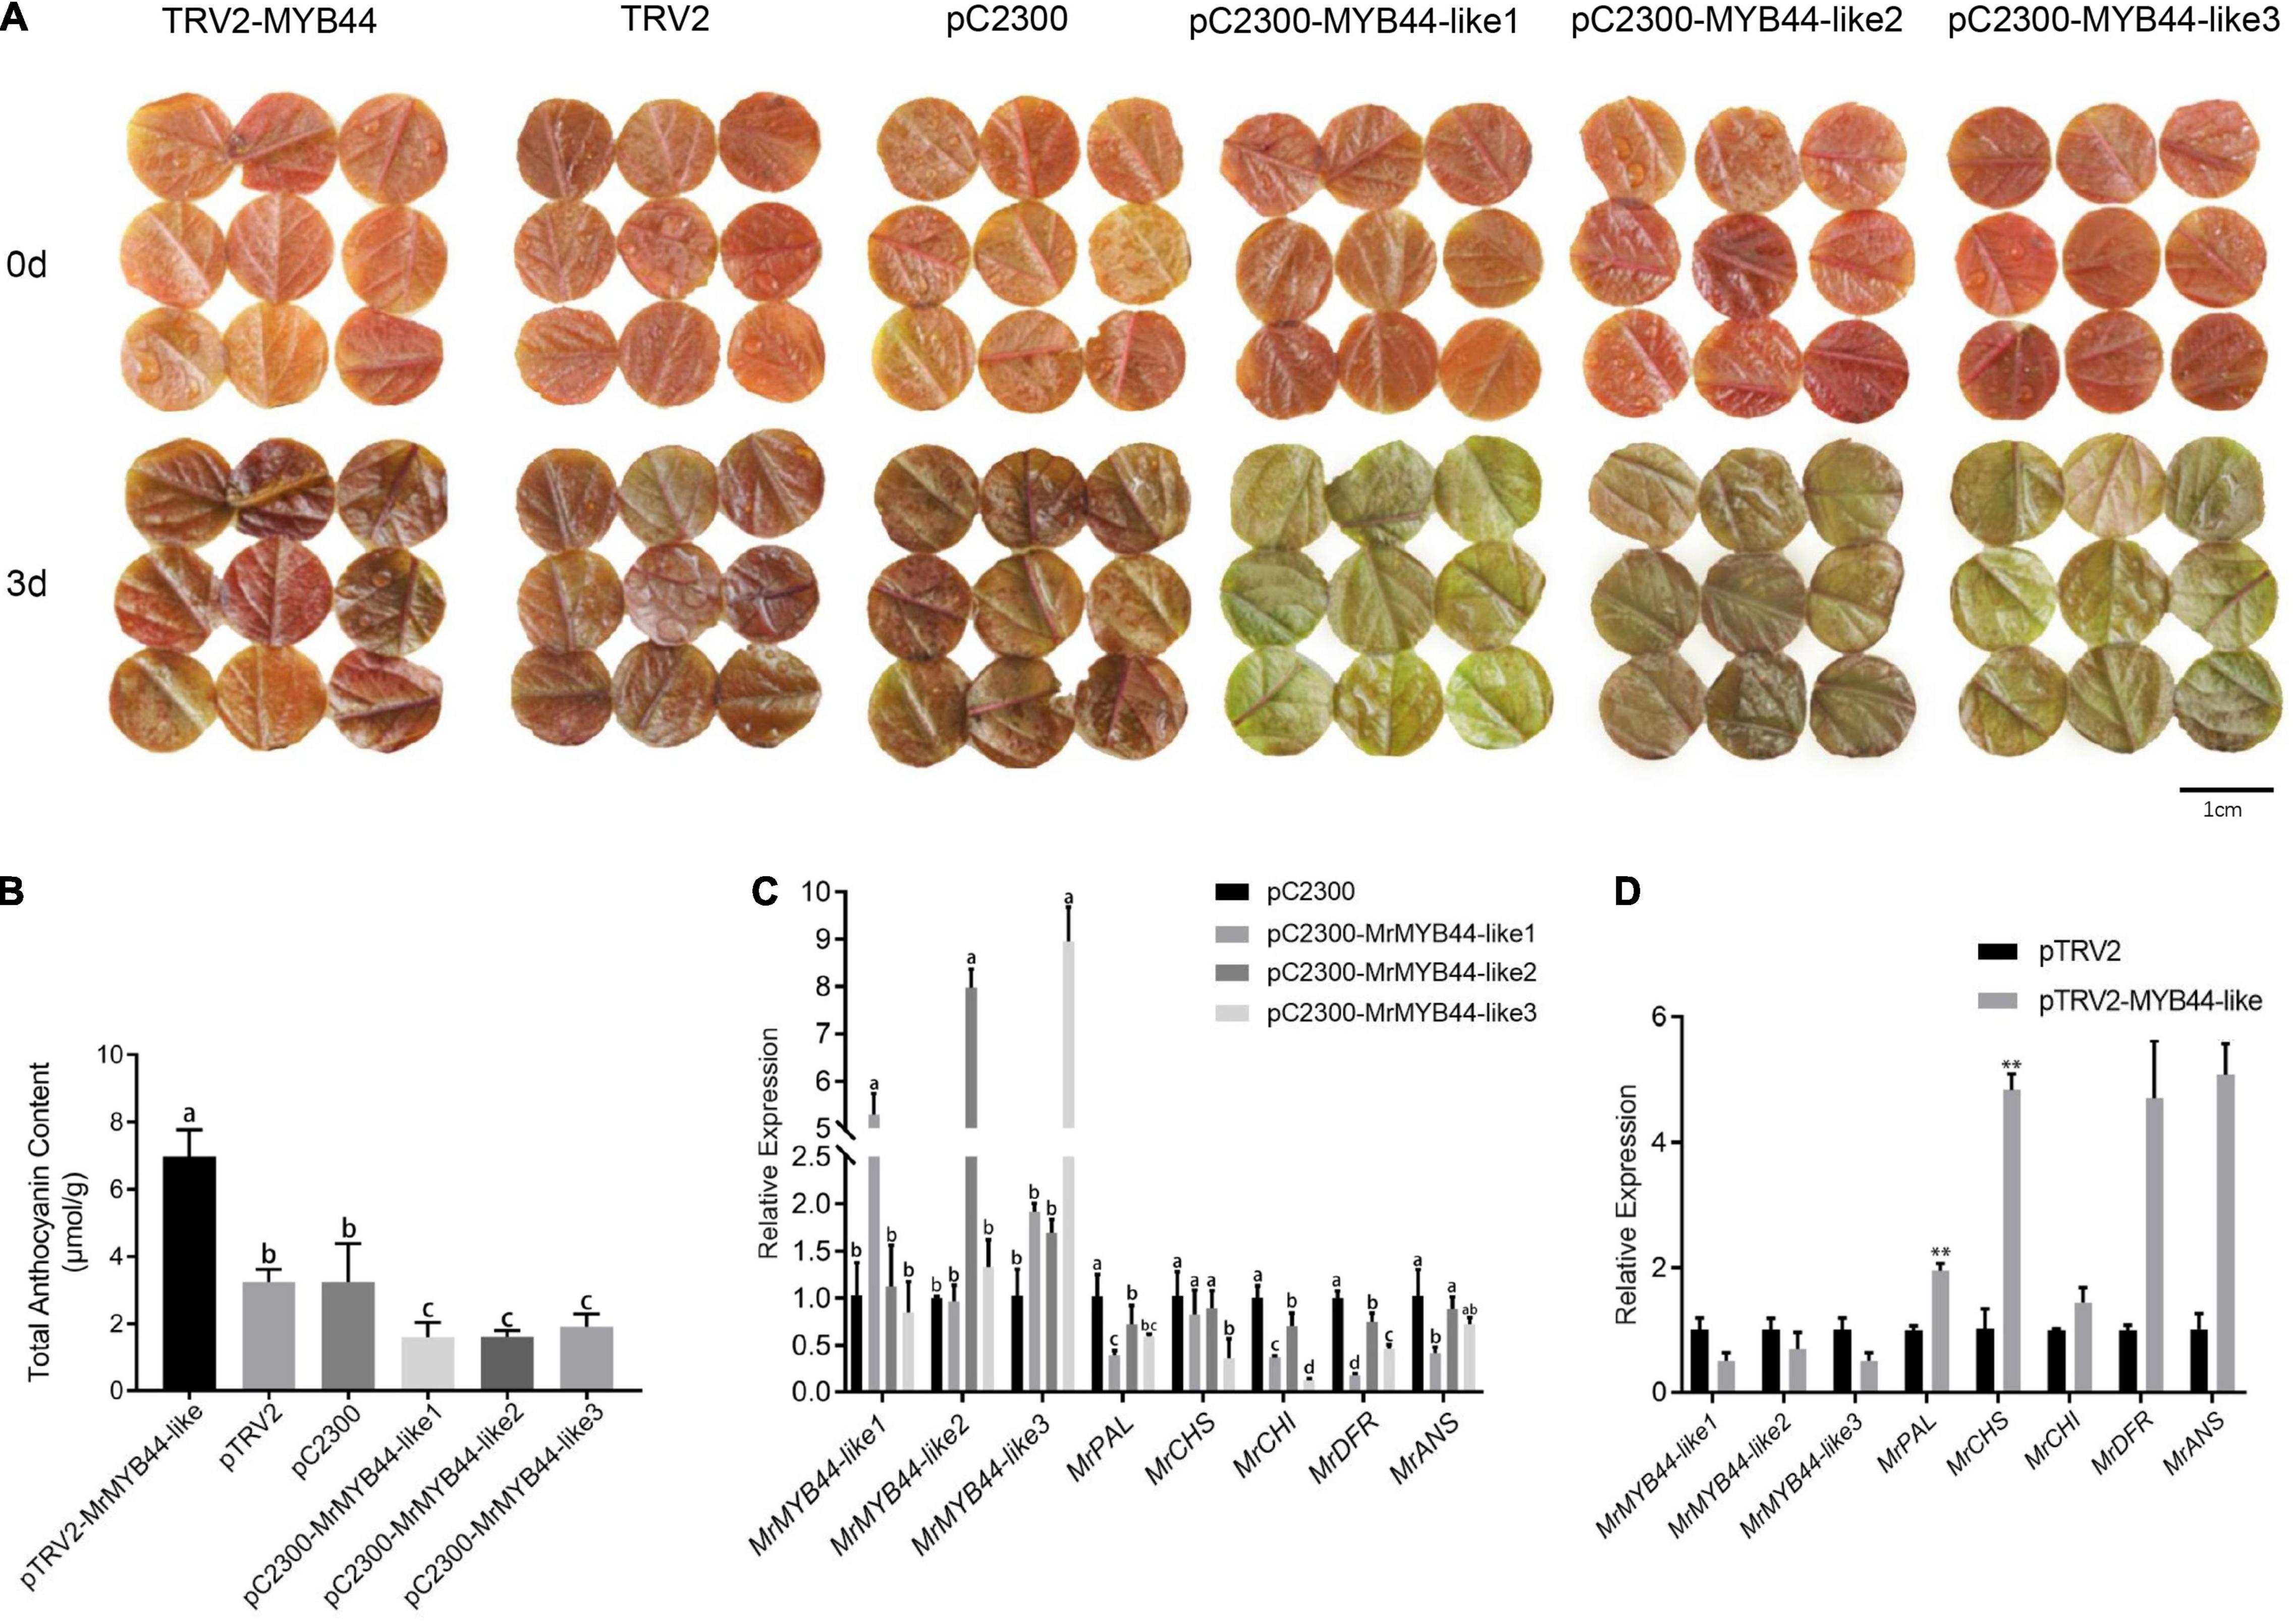
Figure 7. Relative anthocyanin contents and transcript levels of genes in the anthocyanin biosynthesis pathway in MrMYB44-like-overpression/repression transgenic leaf disks and empty vector control leaf disks of Malus ‘Radiant.’ (A) The phenotype of transgenic and control disks. (B) Relative anthocyanin content of transgenic and control disks. (C) Transcript levels of MrMYB44-likes and structural genes related to anthocyanin biosynthesis in MrMYB44-like-overexpression and control leaf disks. Error bars represent the standard errors. Different lowercase letters indicate significant differences among treatments according to one-way ANOVA test (P < 0.05). (D) Transcript levels of MrMYB44-likes and structural genes related to anthocyanin biosynthesis in MrMYB44-like-silenced and control leaf disks. Error bars represent the standard errors. *P < 0.05, **P < 0.01 using the t-test.
Total anthocyanin concentration in overexpression leaf disks (1.60, 1.61, and 1.92 μmol g–1 in pC2300-MYB44-like1, pC2300-MYB44-like2, and pC2300-MYB44-like3, respectively) was approximately twofold lower than that in leaf disks with empty pC2300 vectors (3.25 μmol g–1). In addition, anthocyanin concentration in silenced leaf disks (6.98 μmol g–1, with pTRV2-MYB44-like) was approximately twofold higher than that in leaf disks of the control group (3.25 μmol g–1, with pTRV2) (Figure 7B). According to HPLC analyses, concentrations of both cyanidin-3-galactoside chloride and cyanidin-3,5-O-diglucoside with overexpression or suppression of MrMYB44-likes were approximately twofold lower or higher, respectively, than the concentrations in the corresponding control groups. Those results were consistent with total anthocyanin concentrations and phenotype coloration (Supplementary Table 5). Moreover, levels of rutin, hyperoside, and naringenin in silenced leaf disks were higher than those in control leaves, whereas with overexpression, levels were lower than those in control leaves.
According to qRT-PCR results, expression of MrMYB44-like1, MrMYB44-like2, and MrMYB44-like3 increased by five-, eight-, and nine-fold, respectively, in overexpression leaf disks. By contrast, expression of anthocyanin biosynthesis genes, including MrPAL, MrCHS, MrCHI, MrDFR, and MrANS, decreased significantly (Figure 7C). Furthermore, MrMYB44-like1, MrMYB44-like2, and MrMYB44-like3 transcript levels in MrMYB44-like-silenced leaf disks decreased by approximately 50%, compared with levels in leaf disks with empty vectors. Transcript levels of anthocyanin biosynthesis genes were significantly higher in silenced leaf disks than in control leaf disks (Figure 7D). Overall, expression of these genes was consistent with anthocyanin levels and the pigmentation observed in overexpression, silenced, and control groups.
MrMYB44-Likes Interact With MrWRKY6 but Not With MrbHLH3
According to the previous studies, combinatorial interactions between MYB and bHLH TFs are crucial in regulating anthocyanin biosynthesis (Albert et al., 2011; Xu et al., 2018). However, the three MrMYB44-likes had no bHLH-interacting sites according to amino acid sequence alignment. To further investigate whether there were interactions between MrMYB44-likes and MrbHLH, BiFC assays were performed. The gene MrbHLH3 (HF28271) was screened because of its close genetic relationship with MdbHLH3, which was previously characterized as a regulator of the flavonoid pathway in Malus (Xie et al., 2012). Three construct combinations, that is, MrMYB44-like1-YFPN plus MrbHLH3-YFPC, MrMYB44-like2-YFPN plus MrbHLH3-YFPC, and MrMYB44-like3-YFPN plus MrbHLH3-YFPC, were cotransformed into tobacco epidermal cells. Yellow fluorescent signals were not observed in epidermis cells transformed with any of the three combinations (Figure 8). The results suggested that MrMYB44-like1/2/3 did not interact with MrbHLH3 to suppress anthocyanin biosynthesis.
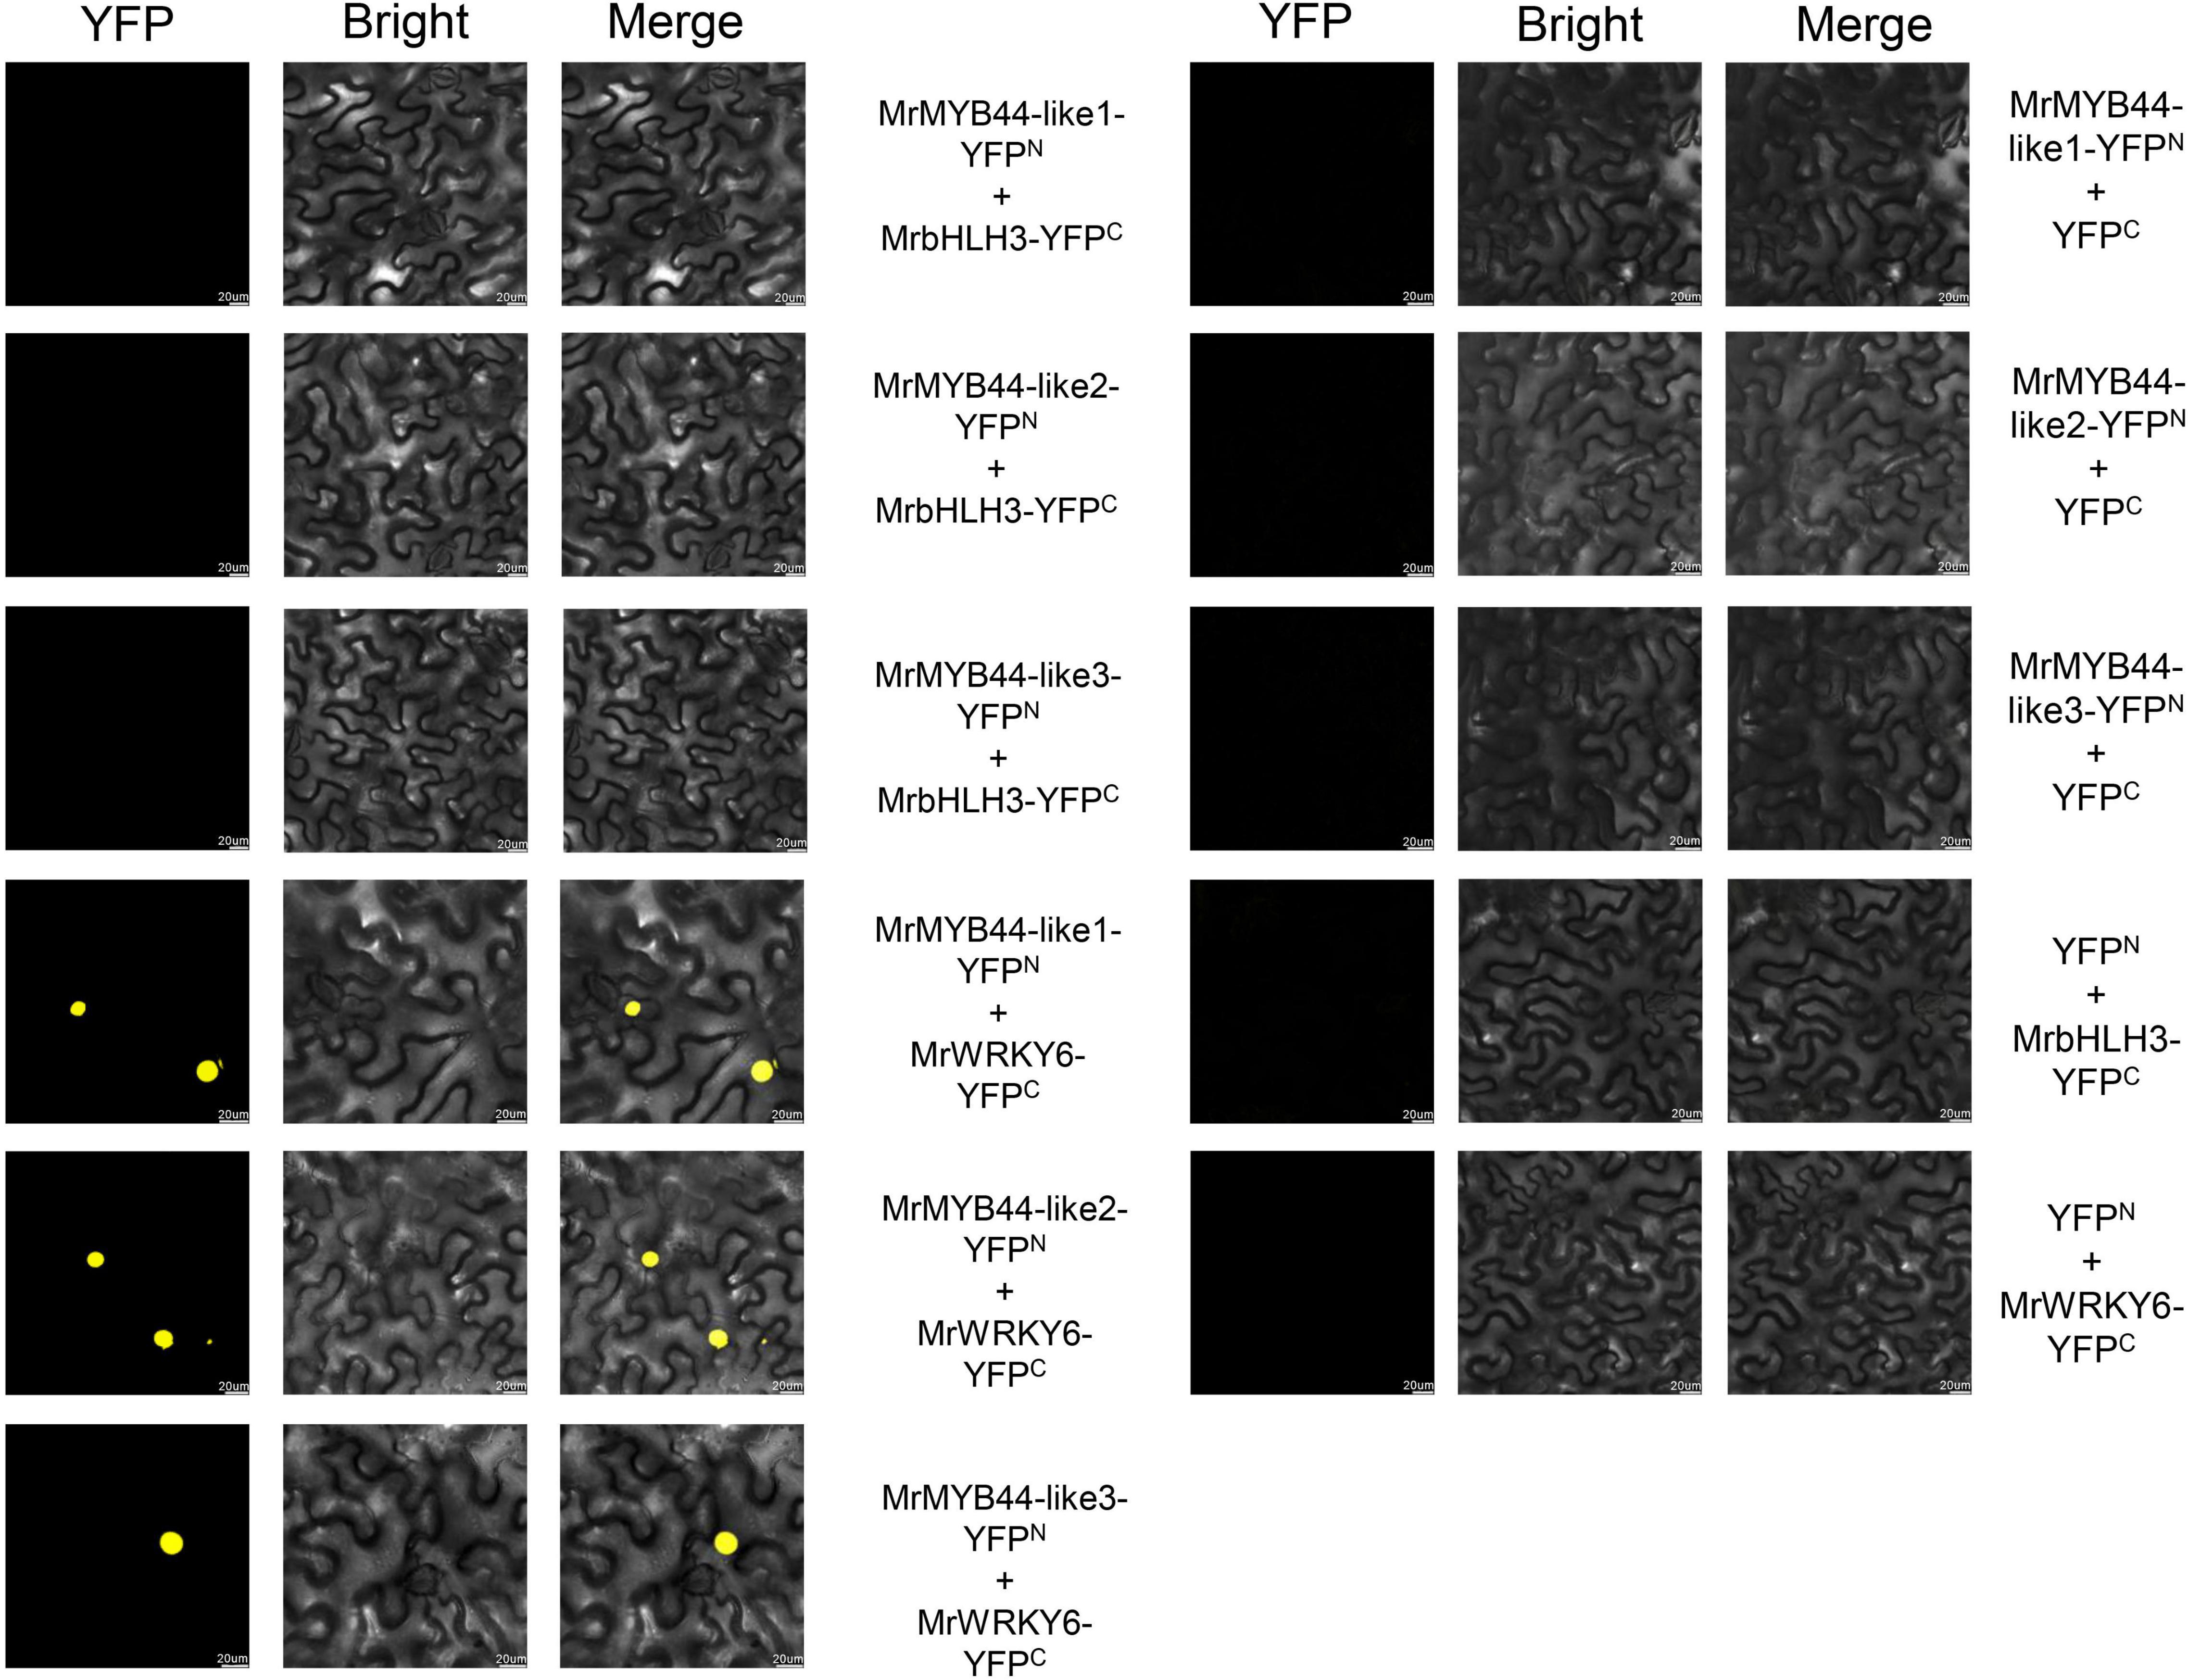
Figure 8. Bimolecular fluorescence complementation assays showing that MrMYB44-like1/2/3 did not interact with MrbHLH3 but did interact with MrWRKY6 in nuclei of epidermal cells in Nicotiana benthamiana. Bars, 20 μm.
According to Zhou et al. (2017), StMYB44, in MYB subgroup 22, physically interacts with AtWRKY6 and StWRKY6 in vivo. Therefore, BiFCs were performed to investigate whether MrWRKY6 could interact with MrMYB44-like1/2/3 to form protein complexes. MrWRKY6 was fused to the C-terminal fragment of YFP as MrWRKY6-YFPC, and then, three combinations including MrMYB44-like1-YFPN plus MrWRKY6-YFPC, MrMYB44-like2-YFPN plus MrWRKY6-YFPC, and MrMYB44-like3-YFPN plus MrWRKY6-YFPC were cotransformed into tobacco epidermal cells. As shown in Figure 8, yellow fluorescence signals were observed in nuclei of tobacco cells that coexpressed one of the three groups. Thus, MrWRKY6 physically interacted with MrMYB44-like1/2/3 in the nucleus. By contrast, there was no signal with the combinations of MrMYB44-like1-YFPN plus YFPC, MrMYB44-like2-YFPN plus YFPC, MrMYB44-like3-YFPN plus YFPC, and YFPN plus MrWRKY6-YFPC. The results demonstrated that MrWRKY6 physically interacted with MrMYB44-like1/2/3 in vivo.
Discussion
In spring, leaf color changes from red to green during growth in M. ‘Radiant.’ The value of a*, which is a standard for red and green, gradually decreased from S1 to S4. Consistent with color measurements, HPLC results showed contents of cyanidin 3-galactoside chloride and cyanidin-3-O-glucoside chloride decreased with development. Therefore, decreasing anthocyanin content led to fading red color in M. ‘Radiant’ leaves.
The MYB TFs positively or negatively regulate anthocyanin biosynthesis (Yan et al., 2021). In this study, 44 MYBs, including 38 R2R3-MYBs and 6 R3-MYBs, were screened in a phylogenetic tree analysis, which indicated that R2R3-MYBs have crucial roles as transcriptional regulators affecting changes in leaf color. Among the MYBs, MrMYB44-like1 (HF13071), MrMYB44-like2 (HF21590), and MrMYB44-like3 (HF27377) had notably high FPKM and fold change values, and expression of the three genes was negatively correlated with anthocyanin content. MrMYB44-like1/2/3 are in subgroup 22, which has a partial EAR motif (Liu et al., 2019). EAR motif-mediated transcriptional repression is the main form of transcriptional repression in plants (Jiao et al., 2018). Most importantly, transient overexpression of MrMYB44-like1, MrMYB44-like2, and MrMYB44-like3 in M. domestica ‘Fuji’ fruit peels and M. ‘Radiant’ leaves repressed expression of structural genes related to anthocyanin biosynthesis and reduced anthocyanin concentrations. By contrast, structural gene expression and red pigmentation increased significantly when MrMYB44-likes were transiently silenced in peels and leaves. Therefore, MrMYB44-likes are likely functional MYB TFs that negatively regulate anthocyanin biosynthesis. The three MYB44-like genes all showed strong inhibition ability when transiently overexpressed, although their amino acid sequences were not identical. The genes were also on different chromosomes. Those results indicated they were functionally redundant genes in the same subgroup of MYBs rather than different copies of one gene or allele genes. The three gene sequences were similar to MdMYB44 which was reported to negatively regulate fruit malate accumulation (Jia et al., 2018, 2021). It was indicated that the MYB44 or MYB44-like may play as important repressors in secondary metabolism in Malus.
In plants, R2R3-MYB repressors can passively compete with activator complexes by interacting with bHLH proteins to reduce their activation capability and thereby repress anthocyanin biosynthesis (Albert et al., 2011; Chen L. et al., 2019; Yan et al., 2021). However, in this study, according to amino acid sequence alignment, MrMYB44-like1/2/3 did not contain the conserved amino acid signature of the bHLH-interacting motif ([D/E]Lx2[R/K]x3Lx6Lx3R), which is used to predict new MYB–bHLH interactions (Zimmermann et al., 2010). Further, in BiFC assays, MrMYB44-likes did not interact with MrbHLH3, indicating the repressive function is independent of bHLH. Thus, MrMYB44-likes could not repress anthocyanin biosynthesis by interacting with bHLH proteins to compete with MYB activators in the MYB–bHLH complex.
In addition to bHLH, many other TFs interact with MYBs, such as AtWRKY6 and StWRKY6, which physically interact with StMYB44 in vivo (Zhou et al., 2017). Amino acid sequence alignment indicated MrMYB44-like1/2/3 shared high amino acid identity with StMYB44 in DNA-binding domains. In addition, MrWRKY6 (HF12290) had affinities with AtWRKY6 and StWRKY6, and according to RNA-seq, expression of MrWRKY6 was consistent with that of MrMYB44-like1/2/3. Therefore, interactions were predicted between MrWRKY6 and MrMYB44-like1/2/3, and BiFC assays confirmed that MrMYB44-like1/2/3 physically interacted with MrWRKY6 in nuclei of tobacco epidermal cells. Those results suggested that MrMYB44-like1, MrMYB44-like2, and MrMYB44-like3 could form a protein complex with MrWRKY6 to regulate transcript levels of anthocyanin biosynthesis genes. In mature leaves, high abundance of transcriptional complexes likely strongly inhibited anthocyanin biosynthesis genes, which led to fading color. In previous studies, WRKY6 responded to plant senescence, in pathogen defense, and to low phosphorus stress in different plants (Robatzek and Somssich, 2002; Wang et al., 2016; Zhou et al., 2017; Chen Z. et al., 2019). In this study, a different potential function of WRKY6 was identified that indicated it might be a key regulator of the anthocyanin biosynthesis pathway. However, further studies are needed.
Conclusion
This study confirms that in spring, anthocyanin content decreases with leaf development in M. ‘Radiant.’ During development, transcription of most anthocyanin biosynthesis genes gradually decreases and that of key anthocyanin degradation genes gradually increases. The MYB repressors MrMYB44-like1, MrMYB44-like2, and MrMYB44-like3 are members of subgroup 22 and are important negative regulators that inhibit anthocyanin biosynthesis. The three MrMYB44-likes interact with MrWRKY6 but not with MrbHLH3. This study further validates and supplements known functions of MYB subgroup 22, while also providing new insights into the mechanism of leaf color change in crabapple.
Data Availability Statement
The datasets generated for this study can be found in the NCBI Sequence Read Archive (SRA) with bioproject No. PRJNA784337, and under GenBank accession numbers of SAMN23483827, SAMN23483828, SAMN23483829, SAMN23483830, SAMN23483831, and SAMN23483832.
Author Contributions
J-XM performed most of the experiments and data analysis. JW and R-FC carried out material collection and pigment extraction. Y-HQ, R-FC, and HW conducted pigment analysis. JZ conducted a part of RNA extraction and qRT-PCR experiment. JW and Y-LW constructed a part of vectors. J-XM, JW, Y-HQ, and R-FC participated in the preparation of the manuscript. H-HL conceived, designed, and coordinated the studies. All authors contributed to the article and approved the submitted version.
Funding
This work was supported by the National Natural Science Foundation of China (32171862), Shaanxi Academy of Forestry Science and Technology innovation plan special (SXLK2020-0201), and Shaanxi Key R&D Plan (2021NY-067).
Conflict of Interest
The authors declare that the research was conducted in the absence of any commercial or financial relationships that could be construed as a potential conflict of interest.
Publisher’s Note
All claims expressed in this article are solely those of the authors and do not necessarily represent those of their affiliated organizations, or those of the publisher, the editors and the reviewers. Any product that may be evaluated in this article, or claim that may be made by its manufacturer, is not guaranteed or endorsed by the publisher.
Acknowledgments
We appreciate the linguistic assistance provided by the Charlesworth service (www.cwauthors.com.cn) during the preparation of this manuscript.
Supplementary Material
The Supplementary Material for this article can be found online at: https://www.frontiersin.org/articles/10.3389/fpls.2022.822340/full#supplementary-material
Footnotes
- ^ https://www.rosaceae.org/species/malus_x_domestica_HFTH1/genome_v1.0
- ^ http://www.geneontology.org/
- ^ http://www.kegg.jp/kegg
- ^ https://www.arabidopsis.org/
References
Albert, N. W., Lewis, D. H., Zhang, H., Schwinn, K. E., and Davies, K. M. (2011). Members of an R2R3-MYB transcription factor family in petunia are developmentally and environmentally regulated to control complex floral and vegetative pigmentation patterning. Plant J. 65, 771–784. doi: 10.1111/j.1365-313X.2010.04465.x
Anwar, M., Yu, W., Yao, H., Zhou, P., and Zeng, L. (2019). NtMYB3, an R2R3-MYB from narcissus, regulates flavonoid biosynthesis. Int. J. Mol. Sci. 20:5456. doi: 10.3390/ijms20215456
Cavallini, E., Matus, J. T., Finezzo, L., Zenoni, S., Loyola, R., Guzzo, F., et al. (2015). The phenylpropanoid pathway is controlled at different branches by a set of R2R3-MYB C2 repressors in grapevine. Plant Physiol. 167, 1448–1470. doi: 10.1104/pp.114.256172
Chen, L., Hu, B., Qin, Y., Hu, G., and Zhao, J. (2019). Advance of the negative regulation of anthocyanin biosynthesis by MYB transcription factors. Plant Physiol. Bioch. 136, 178–187. doi: 10.1016/j.plaphy.2019.01.024
Chen, Z., Lu, X., Xuan, Y., Tang, F., and Ren, J. (2019). Transcriptome analysis based on a combination of sequencing platforms provides insights into leaf pigmentation in acer rubrum. BMC Plant Biol. 19:240. doi: 10.1186/s12870-019-1850-7
Cui, L., Xing, M., Xu, L., Wang, J., Zhang, X., Ma, C., et al. (2018). Antithrombotic components of Malus halliana koehne flowers. Food Chem. Toxicol. 119, 326–333. doi: 10.1016/j.fct.2018.02.049
Dai, F., Zhang, C., Jiang, X., Kang, M., Yin, X., Lü, P., et al. (2012). RhNAC2 and RhEXPA4 are involved in the regulation of dehydration tolerance during the expansion of rose petals. Plant Physiol. 160, 2064–2082. doi: 10.1104/pp.112.207720
Gou, J. Y., Felippes, F. F., Liu, C. J., Weigel, D., and Wang, J. W. (2011). Negative regulation of anthocyanin biosynthesis in Arabidopsis by a miR156-targeted SPL transcription factor. Plant Cell 23, 1512–1522. doi: 10.1105/tpc.111.084525
Han, M. L., Yang, C., Zhou, J., Zhu, J., Meng, J. X., Shen, T., et al. (2020a). Analysis of flavonoids and anthocyanin biosynthesis-related genes expression reveals the mechanism of petal color fading of Malus hupehensis (Rosaceae). Rev. Bras. Bot. 43, 81–89. doi: 10.1007/s40415-020-00590-y
Han, M. L., Yin, J., Zhao, Y. H., Sun, X. W., Meng, J. X., Zhou, J., et al. (2020b). How the color fades from Malus halliana flowers: transcriptome sequencing and DNA methylation analysis. Front. Plant. Sci. 11:576054. doi: 10.3389/fpls.2020.576054
Honda, C., Kotoda, N., Wada, M., Kondo, S., and Kobayashi, S. (2002). Anthocyanin biosynthetic genes are coordinately expressed during red coloration in apple skin. Plant Physiol. Bioch. 40, 955–962. doi: 10.1016/S0981-9428(02)01454-7
Jaakola, L. (2013). New insights into the regulation of anthocyanin biosynthesis in fruits. Trends Plant Sci. 18, 477–483. doi: 10.1016/j.tplants.2013.06.003
Jia, D., Shen, F., Wang, Y., Wu, T., Xu, X., Zhang, X., et al. (2018). Apple fruit acidity is genetically diversified by natural variations in three hierarchical epistatic genes: MdSAUR37, MdPP2CH and MdALMTII. Plant J. 95, 427–443. doi: 10.1111/tpj.13957
Jia, D., Wu, P., Shen, F., Li, W., Zheng, X., Wang, Y., et al. (2021). Genetic variation in the promoter of an R2R3-myb transcription factor determines fruit malate content in apple (Malus domestica Borkh.). Plant Physiol. 186, 549–568. doi: 10.1093/plphys/kiab098
Jiao, T. Y., Yue, L., Heng, Y. Y., Tian, T., Qi, Y., Zhang, L., et al. (2018). Plant EAR: functional analysis platform for plant EAR motif-containing proteins. Front. Genet. 9:590. doi: 10.3389/fgene.2018.00590
Jun, J. H., Liu, C., Xiao, X., and Dixon, R. A. (2015). The transcriptional repressor MYB2 regulates both spatial and temporal patterns of proanthocyandin and anthocyanin pigmentation in Medicago truncatula. Plant Cell 27, 2860–2879. doi: 10.1105/tpc.15.00476
Koes, R., Verweij, W., and Quattrocchio, F. (2005). Flavonoids: a colorful model for the regulation and evolution of biochemical pathways. Trends Plant Sci. 10, 236–242. doi: 10.1016/j.tplants.2005.03.002
Lee, H. S., and Wicker, L. (1991). Anthocyanin pigments in the skin of lychee fruit. J. Food Sci. 56, 466–468. doi: 10.1111/j.1365-2621.1991.tb05305
Li, C., Wu, J., Hu, K. D., Wei, S. W., Sun, H. Y., Hu, L.-Y., et al. (2020). PyWRKY26 and PybHLH3 cotargeted the PyMYB114 promoter to regulate anthocyanin biosynthesis and transport in red-skinned pears. Hortic. Res. 7:37. doi: 10.1038/s41438-020-0254-z
Li, H., Flachowsky, H., Fischer, T. C., Hanke, M. V., Forkmann, G., Treutter, D., et al. (2007). Maize LC transcription factor enhances biosynthesis of anthocyanins, distinct proanthocyanidins and phenylpropanoids in apple (Malus domestica Borkh.). Planta 226, 1243–1254. doi: 10.1007/s00425-007-0573-4
Li, Y. Y., Mao, K., Zhao, C., Zhao, X. Y., Zhang, H. L., Shu, H. R., et al. (2012). MdCOP1 ubiquitin E3 ligases interact with MdMYB1 to regulate light-induced anthocyanin biosynthesis and red fruit coloration in apple. Plant Physiol. 160, 1011–1022. doi: 10.1104/pp.112.199703
Liu, L., Zhang, L. Y., Wang, S. L., and Niu, X. Y. (2016). Analysis of anthocyanins and flavonols in petals of 10 Rhododendron species from the Sygera Mountains in Southeast Tibet. Plant Physiol. Bioch. 104, 250–256. doi: 10.1016/j.plaphy.2016.03.036
Liu, Y., Lin-Wang, K., Espley, R. V., Wang, L., Li, Y., Liu, Z., et al. (2019). StMYB44 negatively regulates anthocyanin biosynthesis at high temperatures in tuber flesh of potato. J. Exp. Bot. 70, 3809–3824. doi: 10.1093/jxb/erz194
Ma, D., and Constabel, C. P. (2019). MYB repressors as regulators of phenylpropanoid metabolism in Plants. Trends Plant Sci. 24, 275–289. doi: 10.1016/j.tplants.2018.12.003
Mcguire, R. G. (1992). Reporting of objective color measurements. Hortscience 27, 1254–1255. doi: 10.21273/HORTSCI.27.12.1254
Oren-Shamir, M. (2009). Does anthocyanin degradation play a significant role in determining pigment concentration in plants? Plant Sci. 177, 310–316. doi: 10.1016/j.plantsci.2009.06.015
Petroni, K., and Tonelli, C. (2011). Recent advances on the regulation of anthocyanin synthesis in reproductive organs. Plant Sci. 181, 219–229. doi: 10.1016/j.plantsci.2011.05.009
Robatzek, S., and Somssich, I. E. (2002). Targets of AtWRKY6 regulation during plant senescence and pathogen defense. Genes Dev. 16, 1139–1149. doi: 10.1101/gad.222702
Stracke, R., Ishihara, H., Huep, G., Barsch, A., and Weisshaar, B. (2010). Differential regulation of closely related R2R3-MYB transcription factors controls flavonol accumulation in different parts of the Arabidopsis thaliana seedling. Plant J. 50, 660–677. doi: 10.1111/j.1365-313X.2007.03078.x
Wang, N., Yue, Z. Y., Wang, P., Sun, X., and Ma, F. W. (2016). Function of Malus prunifolia WRKY6 transcription factor in response to different stresses. Biol. Plantarum 61, 284–292. doi: 10.1007/s10535-016-0701-8
Wei, Z. Z., Hu, K. D., Zhao, D. L., Tang, J., Huang, Z. Q., Jin, P., et al. (2020). MYB44 competitively inhibits the formation of the MYB340-bHLH2-NAC56 complex to regulate anthocyanin biosynthesis in purple-fleshed sweet potato. BMC Plant Biol. 20:258. doi: 10.1186/s12870-020-02451-y
Winkel-Shirley, B. (2001). Flavonoid biosynthesis. A colorful model for genetics, biochemistry, cell biology, and biotechnology. Plant Physiol. 126, 485–493. doi: 10.1104/pp.126.2.485
Xie, X. B., Li, S., Zhang, R. F., Zhao, J., Chen, Y. C., Zhao, Q., et al. (2012). The bHLH transcription factor MdbHLH3 promotes anthocyanin accumulation and fruit colouration in response to low temperature in apples. Plant Cell Environ. 35, 1884–1897. doi: 10.1111/j.1365-3040.2012.02523.x
Xu, H., Yang, G., Zhang, J., Wang, Y., Zhang, T., Wang, N., et al. (2018). Overexpression of a repressor MdMYB15L negatively regulates anthocyanin and cold tolerance in red-fleshed callus. Biochem. Bioph. Res. Commun. 500, 405–410. doi: 10.1016/j.bbrc.2018.04.088
Xu, H., Zou, Q., Yang, G., Jiang, S., and Chen, X. (2020). MdMYB6 regulates anthocyanin formation in apple both through direct inhibition of the biosynthesis pathway and through substrate removal. Hortic. Res. 7:72. doi: 10.1038/s41438-020-0294-4
Yan, H., Pei, X., Zhang, H., Li, X., and Zhao, X. (2021). MYB-mediated regulation of anthocyanin biosynthesis. Int. J. Mol. Sci. 22:3103. doi: 10.3390/ijms22063103
Yan, S., Chen, N., Huang, Z., Li, D., Zhi, J., Yu, B., et al. (2020). Anthocyanin fruit encodes an R2R3-MYB transcription factor, SlAN2-like, activating the transcription of SlMYBATV to fine-tune anthocyanin content in tomato fruit. New. Phytol. 225, 2048–2063. doi: 10.1111/nph.16272
Yang, T., Li, K., Hao, S., Zhang, J., Song, T., Tian, J., et al. (2018). The use of RNA sequencing and correlation network analysis to study potential regulators of crabapple leaf color transformation. Plant Cell Physiol. 59, 1027–1042. doi: 10.1093/pcp/pcy044
Ying, L., Yury, T., Schouten, R. E., Marcelis, L., Visser, R., and Bovy, A. (2018). Anthocyanin biosynthesis and degradation mechanisms in solanaceous vegetables: a review. Front. Chem. 6:52. doi: 10.3389/fchem.2018.00052
Zhou, X., Zha, M., Huang, J., Li, L., Imran, M., and Zhang, C. (2017). StMYB44 negatively regulates phosphate transport by suppressing expression of PHOSPHATE1 in potato. J. Exp. Bot. 68, 1265–1281. doi: 10.1093/jxb/erx026
Keywords: anthocyanin, transcriptome, MYB44-like, WRKY6, spring leaf color, transcription factors, crabapple
Citation: Meng J-X, Wei J, Chi R-F, Qiao Y-H, Zhou J, Wang Y-L, Wang H and Li H-H (2022) MrMYB44-Like Negatively Regulates Anthocyanin Biosynthesis and Causes Spring Leaf Color of Malus ‘Radiant’ to Fade From Red to Green. Front. Plant Sci. 13:822340. doi: 10.3389/fpls.2022.822340
Received: 25 November 2021; Accepted: 05 January 2022;
Published: 01 February 2022.
Edited by:
Kevin Davies, The New Zealand Institute for Plant and Food Research Ltd., New ZealandReviewed by:
Antje Feller, University of Tübingen, GermanyYuncong Yao, Beijing University of Agriculture, China
Copyright © 2022 Meng, Wei, Chi, Qiao, Zhou, Wang, Wang and Li. This is an open-access article distributed under the terms of the Creative Commons Attribution License (CC BY). The use, distribution or reproduction in other forums is permitted, provided the original author(s) and the copyright owner(s) are credited and that the original publication in this journal is cited, in accordance with accepted academic practice. No use, distribution or reproduction is permitted which does not comply with these terms.
*Correspondence: Hou-Hua Li, lihouhua73@163.com