 Muhammad Ahmad1,2
 Thibault Leroy2
 Nikos Krigas3
 Eva M. Temsch2
 Hanna Weiss-Schneeweiss2
 Christian Lexer2†
 Eva Maria Sehr1*‡
 Ovidiu Paun2‡
- 1Center for Health & Bioresources, AIT Austrian Institute of Technology GmbH, Tulln, Austria
- 2Department of Botany and Biodiversity Research, University of Vienna, Vienna, Austria
- 3Institute of Plant Breeding and Genetic Resources, Hellenic Agricultural Organization Demeter, Thessaloniki, Greece
Background and Aims: Quantifying genetic variation is fundamental to understand a species’ demographic trajectory and its ability to adapt to future changes. In comparison with diploids, however, genetic variation and factors fostering genetic divergence remain poorly studied in polyploids due to analytical challenges. Here, by employing a ploidy-aware framework, we investigated the genetic structure and its determinants in polyploid Alkanna tinctoria (Boraginaceae), an ancient medicinal herb that is the source of bioactive compounds known as alkannin and shikonin (A/S). From a practical perspective, such investigation can inform biodiversity management strategies.
Methods: We collected 14 populations of A. tinctoria within its main distribution range in Greece and genotyped them using restriction site-associated DNA sequencing. In addition, we included two populations of A. sieberi. By using a ploidy-aware genotype calling based on likelihoods, we generated a dataset of 16,107 high-quality SNPs. Classical and model-based analysis was done to characterize the genetic structure within and between the sampled populations, complemented by genome size measurements and chromosomal counts. Finally, to reveal the drivers of genetic structure, we searched for associations between allele frequencies and spatial and climatic variables.
Key Results: We found support for a marked regional structure in A. tinctoria along a latitudinal gradient in line with phytogeographic divisions. Several analyses identified interspecific admixture affecting both mainland and island populations. Modeling of spatial and climatic variables further demonstrated a larger contribution of neutral processes and a lesser albeit significant role of selection in shaping the observed genetic structure in A. tinctoria.
Conclusion: Current findings provide evidence of strong genetic structure in A. tinctoria mainly driven by neutral processes. The revealed natural genomic variation in Greek Alkanna can be used to further predict variation in A/S production, whereas our bioinformatics approach should prove useful for the study of other non-model polyploid species.
Introduction
Polyploids are very frequent in flowering plants as at least 35% of extant species are of recent polyploid origin (Wood et al., 2009). Despite their high abundance in nature, economic, esthetic, and medicinal importance, polyploids are still rarely investigated in population genomics (van de Peer et al., 2017). One of the reasons is that such investigations remain challenging, due to uncertainty in estimating allele copy number (i.e., dosage) and, therefore, to accurately assess genotype and allele frequencies (Meirmans and van Tienderen, 2013; Dufresne et al., 2014; Meirmans et al., 2018). In addition, the genome complexity of polyploids is often exacerbated by heterogeneous inheritance patterns across chromosomes, ranging from fully tetrasomic to disomic inheritance (Dufresne et al., 2014; Meirmans et al., 2018).
Genotype likelihood-based methods (as implemented, e.g., in ANGSD; Nielsen et al., 2011; Korneliussen et al., 2014) that are accounting for uncertainties regarding genotype calling have been shown to greatly improve accuracy of population genetics parameters estimated from low to medium coverage NGS data in diploid species (Warmuth and Ellegren, 2019). Recently, an accurate Bayesian method for estimating polyploid genotypes at biallelic single-nucleotide polymorphisms (SNPs) based on likelihoods has been developed (Blischak et al., 2016, 2018) but has not yet been widely applied (but see, e.g., Brandrud et al., 2020). Restriction site-associated DNA sequencing (RAD-seq; Baird et al., 2008) is a popular method to generate NGS data and investigate genetic variation and population structure, especially for species not benefiting from an available suitable reference genome (Rochette and Catchen, 2017). However, only a limited number of RAD-seq studies have been employed to investigate genetic variation in non-model polyploid species (Zohren et al., 2016; Brandrud et al., 2017; Záveská et al., 2019; Wagner et al., 2020; Wang et al., 2021).
Genetic variation is a fundamental determinant of the capacity of populations, species, and ecosystems to persist and adapt in the face of environmental change (Hughes et al., 2008). More than a single gene pool often exists across a species’ range within a spatial and/or ecological arrangement (Hartl and Clark, 1997; Jones and Wang, 2012). The intensity of gene flow between populations, together with the potential for divergent selection and neutral processes, including drift, is largely defining the degree of population genetic structure (Papadopulos et al., 2014). Geographically, limited dispersal among individuals produces a spatial genetic structure called isolation by distance (IBD; Vekemans and Hardy, 2004). IBD is quantified as the strength of correlation between genetic dissimilarity and geographic distance (Wright, 1943). However, an increased divergence between populations can be also observed as a result of ecologically-based divergent selection against maladapted migrants and hybrids, which, in turn, reduces effective gene flow (Nosil et al., 2009), commonly referred as ecologically driven isolation by environment (IBE; Wang and Bradburd, 2014). The distribution of intraspecific genetic variation often reflects geographical proximity, as well as the spatial heterogeneity in the ecological landscape suggesting that functional traits may show a similar pattern, mirroring selective forces (Fournier-Level et al., 2011). Hence, investigating the genetic structure of populations together with its drivers is key for understanding the evolutionary history of a group, and predicting its future, with important implications for biodiversity management and conservation.
In the current study, we used a ploidy-aware likelihood-based genotyping to quantify genetic diversity and to investigate the population structure of the polyploid plant Alkanna tinctoria Tausch (Boraginaceae) across most of its distribution area in mainland Greece. In addition, as a potential outgroup species, we included the closely related A. sieberi A.DC (Chacón et al., 2019), a rare endemic species on Crete Island. A. tinctoria is a tetraploid perennial herb mainly distributed in Greece and other Mediterranean countries (Dimopoulos et al., 2013; Strid, 2016). However, in countries, such as Slovakia (Eliáš et al., 2015), Bulgaria (Petrova and Vladimirov, 2009), and Hungary (Király, 2007), A. tinctoria is considered as very rare. The species is of great interest to biochemists and pharmacists as its roots biosynthesize specialized secondary metabolites known as alkannin or its enantiomer shikonin (A/S; Papageorgiou et al., 1999). The red extracts from roots have a long history of curative usage, dating back to the period of the Greek physician Hippocrates (Papageorgiou et al., 1999; Assimopoulou et al., 2011). Several modern investigations have shown the effectiveness of A/S in wound healing, and as antibacterial and anticarcinogenic agents (Malik et al., 2016; Yan et al., 2019; Zhang et al., 2019). Although the bioactivity of A/S from A. tinctoria and related species has been much explored, its natural genetic diversity remains poorly investigated (Ahmad et al., 2019). We employed ploidy-aware genotyping with RAD-seq, supported with cytogenetic investigations, to answer the following questions: (1) Are there intra- and interspecific ploidy differences? Do the genotypic data suggest auto- or allotetraploid origin for A. tinctoria? (2) How much genetic diversity is present in A. tinctoria in Greece and how is this diversity distributed? (3) What are the factors shaping the observed genetic structure? Given the medical relevance and historical importance of A. tinctoria our population genomic and cytogenetic appraisal serves as a valuable foundation for understanding its genetic and phenotypic variability.
Materials and Methods
Study Species
Herein, we focus on two medicinally important species within the tribe Lithospermeae (Boraginaceae): A. tinctoria with a wide range in Greece and A. sieberi, as the potential outgroup species, with a very restricted range (local endemic to Crete). On Crete, the two species have partly overlapping distributions (Strid, 2016). Both species commonly occur at low elevation (<1,000 m above sea level) and occupy similar habitats, such as rocky, sandy, disturbed, and other open places in phrygana, xeric grasslands and coastal habitats (Strid, 2016).
Sampling and DNA Extraction
Leaf samples of up to 11 individuals (on average 9.25 individuals) per sampling locality (Supplementary Table S1) were collected from 14 localities of A. tinctoria across three mainland regions of Greece (North, Central, and South), as well as from additionally two A. sieberi localities found on the island of Crete (AT27, AT28; Figure 1). These areas roughly reflect four distinct phytogeographical regions of Greece, i.e., North-East – NE, East-Central – EC, Sterea Ellas – StE, and Kriti and Karpathos – KK (Dimopoulos et al., 2016; Strid, 2016). The samples were either silica- or freeze-dried. Voucher specimens and/or living material (seeds) are maintained ex situ at the Institute of Plant Breeding and Genetic Resources, Hellenic Agricultural Organization–Demeter (HAO-Demeter), Thessaloniki, Greece, with specific International Plant Exchange Network (IPEN) accession numbers (Supplementary Table S1).
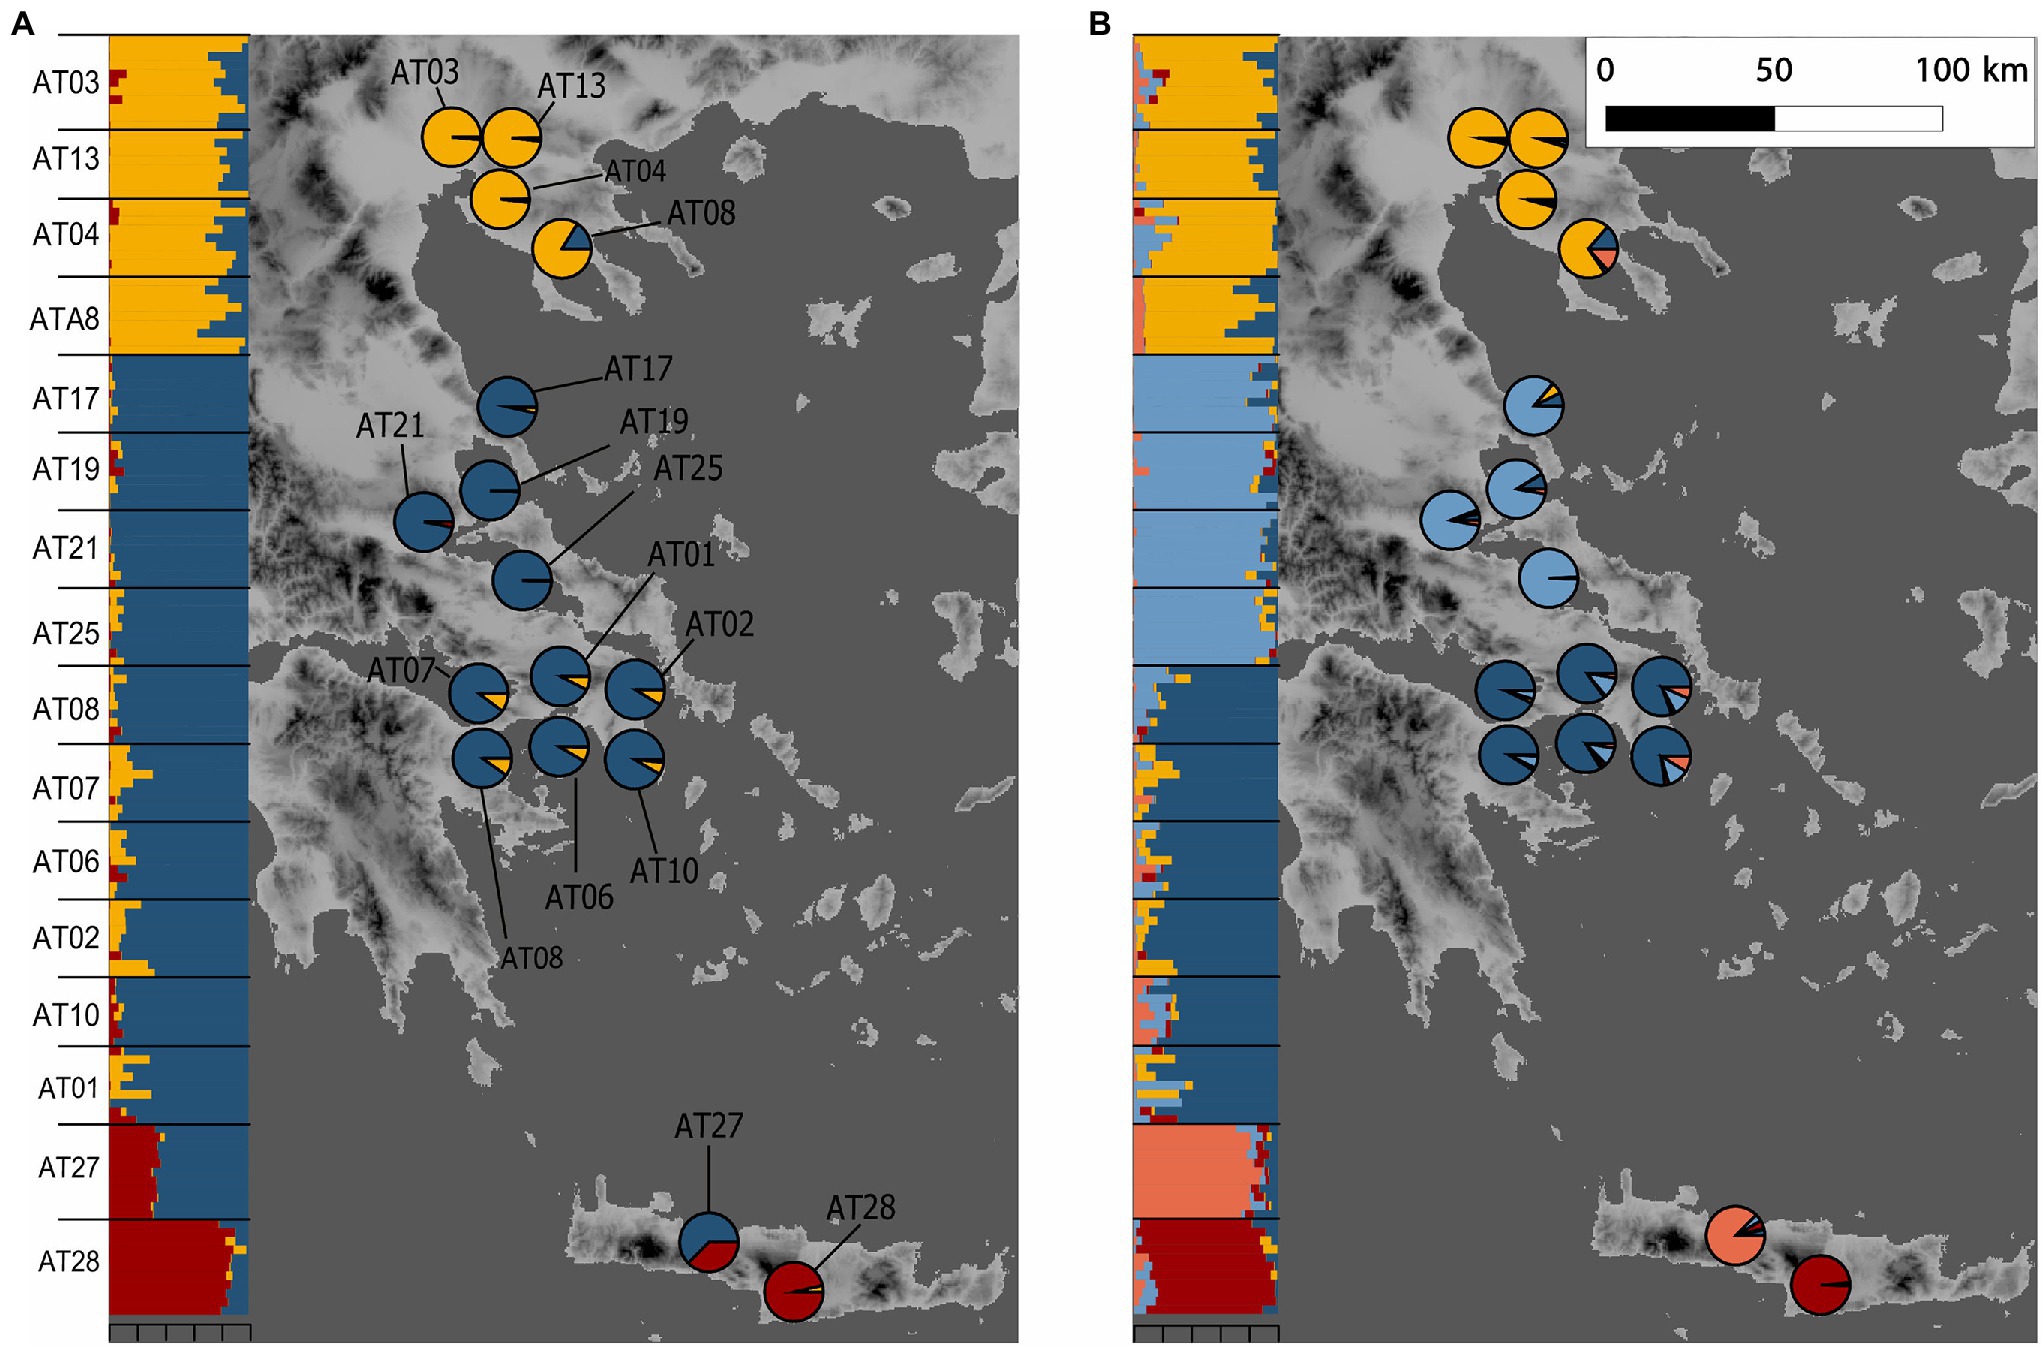
Figure 1. Sampling localities of Alkanna and its genetic structure in Greece. Alkanna tinctoria was sampled across Greece, and A. sieberi on Crete island (localities AT27 and AT28). Geographical coordinates of sampling locations are provided in Supplementary Table S1. Ancestry proportions inferred with TESS3 averaged for sampling locality are plotted as pie charts. Inset shows ancestry proportions from STRUCTURE as vertical bars where each vertical bar represents an individual and each color represents a genetic cluster. (A) K = 3, and (B) K = 5. Genetic structure estimates are based on RAD-seq data. For TESS3 and STRUCTURE, 7,935 and 1,000 SNPs, respectively, present across at least 90% individuals were used. The map of Greece was extracted from the WorldClim database (Hijmans et al., 2005).
Total DNA was extracted from 40 to 50 mg of powdered leaf tissue using the method described in Lefort and Douglas (1999). DNA extracts were further cleaned and purified using the DNeasy PowerClean CleanUp Kit (Qiagen, Hilden, Germany) following manufacturers’ instructions.
Cytogenetic Analysis
Fresh tissue of A. tinctoria was collected from three geographic regions of Greece (North, South, and Central Greece), while entire plants of A. sieberi individuals were collected from two sampling localities (Supplementary Table S1) and were grown under greenhouse conditions at the Austrian Institute of Technology, Tulln, Austria. A total of ten individuals of A. tinctoria were used for genome size assessment, plus five individuals of the outgroup species A. sieberi (Table 1). Fresh leaf tissue was subjected to flow cytometry using about 25 mg of fresh leaf tissue, which was co-chopped together with internal standards (Galbraith et al., 1983), either Pisum sativum “Kleine Rheinländerin” (4.42 pg./1C; Greilhuber and Ebert, 1994) or Capsicum flexuosum (7.44 pg./1C; unpublished) in Otto’s isolation buffer (Otto et al., 1981). The isolate was filtered through a nylon mesh (30–50 μm), treated with RNase in the 37°C water bath for 30 min, stained with a propidium iodide containing Otto’s staining buffer (Otto et al., 1981) and stored in the refrigerator until measurement. This was performed on CyFlow flow cytometers (Sysmex/Partec, Muenster, Germany) equipped with lasers (532 nm; 30 mW Partec, Muenster, Germany, or 100 mW Cobolt Samba, Cobolt AB, Solna, Sweden). The 1C values were calculated based on a linear relationship between the G1/0 mean peak positions on the fluorescence axis of the standard and the objects.
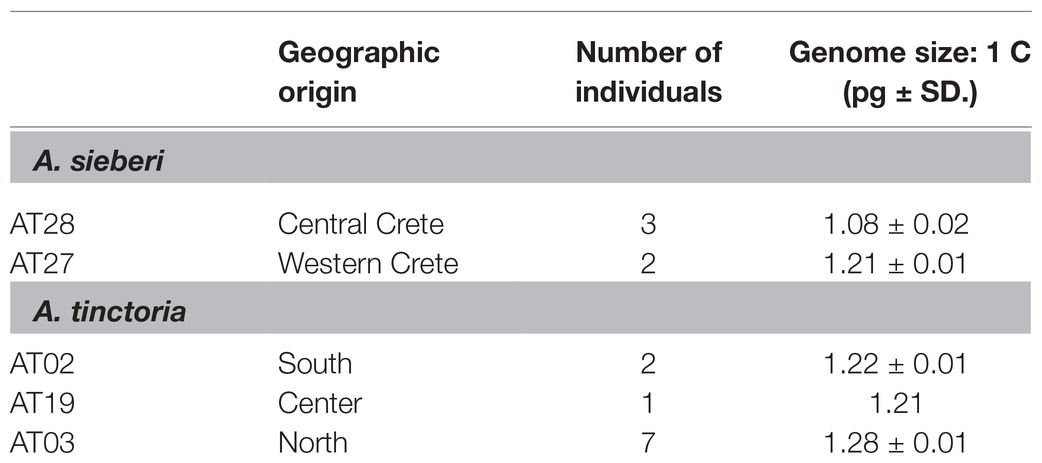
Table 1. Genome size [average picogram (pg) ± standard deviation (SD)] of Greek Alkanna tinctoria and A. sieberi as measured by flow cytometry.
Chromosome numbers were analyzed for two individuals of A. tinctoria originating from Northern Greek locality AT03. Actively growing root meristems were harvested from young plants, pretreated with 0.002 M 8-hydoxyquinoline in darkness for 2 h at room temperature and 2 h at 4°C, and fixed in 3:1 ethanol:acetic acid. Briefly, root meristems were hydrolyzed in 5 N HCl for 20 min, washed with water, and stained with Schiff’s reagent (Merck, Darmstadt, Germany) for 1 h at room temperature in darkness. Root meristems were then squashed in a drop of 60% acetic acid under a cover slip, and the preparations were analyzed using Axioplan light microscope (Carol Zeiss, Vienna, Austria) equipped with a CCD camera. Images were captured using ZEN software (Carl Zeiss, Vienna, Austria).
Library Preparation and RAD-seq
Preparation of the RAD-seq libraries for a total of 148 accessions (n = 8–11 per sampling locality, average 9.3; Table 2; Supplementary Table S1) was carried out following the protocol described in Paun et al. (2016) with modifications. Per accession 150 ng of DNA was digested with the restriction enzyme PstI, except for repeats where between 75 and 100 ng of starting DNA was used. After ligation of P1 adapters to digested samples overnight at 16°C, samples with different P1 barcodes were pooled together and sheared via sonication with a Bioruptor Pico (Diagenode) using three cycles of 45 s ON and 60 s OFF at 4°C. Illumina HiSeq sequencing as single-end 100 bp reads has been performed at the NGS Unit of Vienna Biocenter Sequencing Facility (VBCF,1) Vienna, Austria.
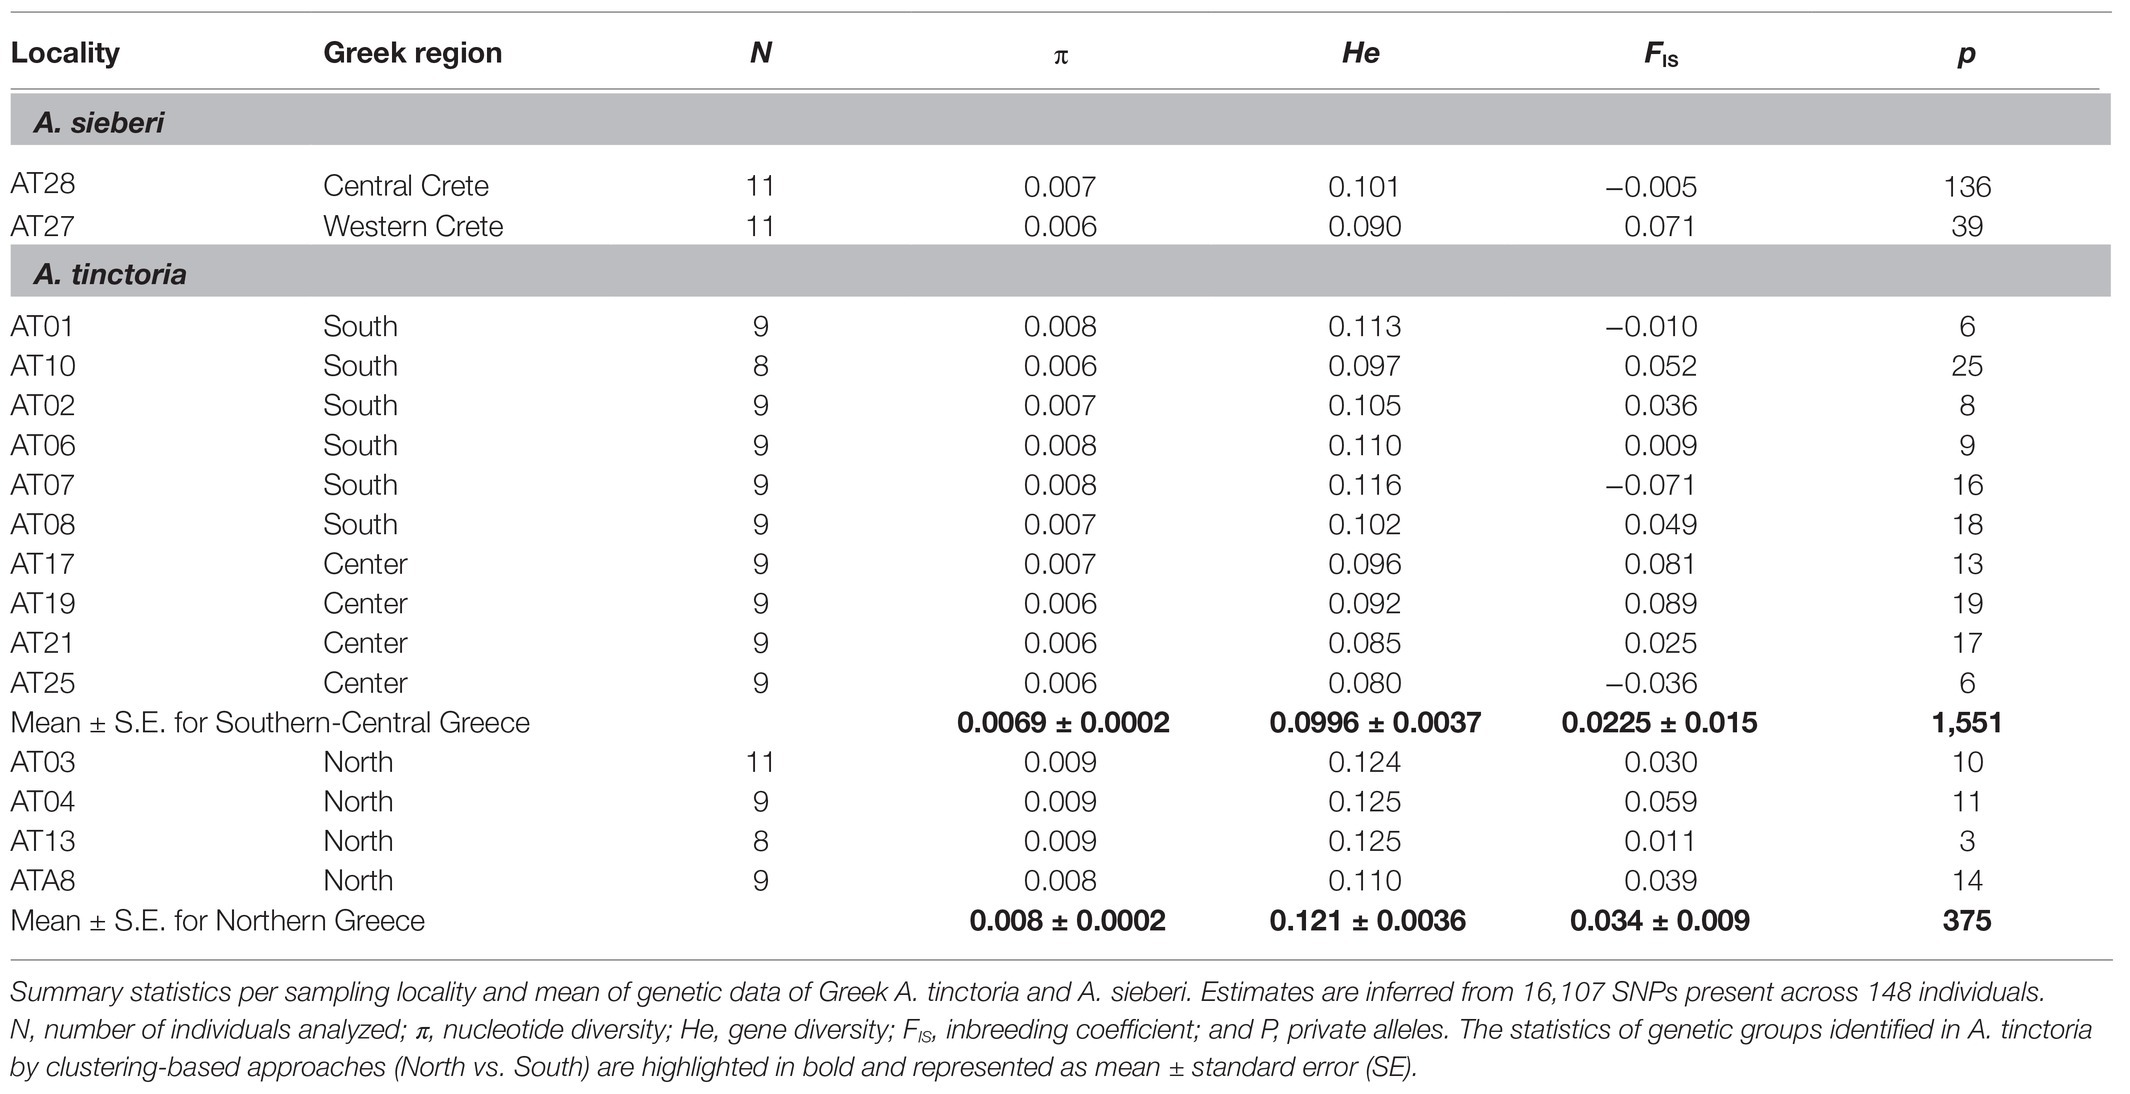
Table 2. Genomic diversity in Alkanna populations.
De novo Assembly of Loci, Filtering, and Polyploid Genotype Calling
Raw reads were first demultiplexed into sub-pools based on index reads using BamIndexDecoder (v.1.19) from Illumina2bam (available at https://gq1.github.io/illumina2bam/) with default options. Further demultiplexing into individual samples based on inline barcodes used process_radtags (Stacks v.1.47; Catchen et al., 2013), rescuing barcodes and restriction sites (−r) with a maximum of one mismatch, and discarding reads with low-quality scores (−q) and any uncalled bases (−c). As no reference genome is available to date for Alkanna, we first assembled the RAD loci with Stacks. To optimize the de novo assembly, we followed Heckenhauer et al. (2018) and varied the value of minimum reads required to create a stack (m), the maximum mismatches allowed between stacks within individuals (M), and the number of mismatches allowed between sample loci (n) to maximize the number of obtained polymorphic loci, including a maximum of ten SNPs, and that were recovered for at least 80% of individuals. The assembly parameters were optimized on a subset of 60 individuals. The final assembly parameters chosen based on the criteria described above to produce the final catalogue were m = 3, M = 1, and n = 4. The RAD-seq loci from the catalogue have been extracted with the EXPORT_SQL.pl module of Stacks. They have been further used as individual contigs to generate a synthetic reference in FASTA format.
Following the pipeline in Brandrud et al. (2020), the raw reads were mapped back to this synthetic reference using bowtie2 v.2.3.4.1 (Langmead and Salzberg, 2012) with default settings. Further processing (conversion to BAM, sorting by reference coordinates, and addition of read group information) was done using Picard v.2.20.6,2 and realignment around indels was performed using the Genome Analysis Toolkit (GATK v.3.81; McKenna et al., 2010).
We further inferred tetraploid genotypes with the GATK-based approach implemented in EBG v.0.3.2-alpha (Empirical Bayes Genotyping in Polyploids; Blischak et al., 2018). This pipeline is able to refine polyploid genotypes starting from flat priors and has been shown to result in negligible levels of genotype errors for both auto- and allopolyploids for intermediate to high coverages. Briefly, as recommended we employed the GATK UnifiedGenotyper for variant calling and genotype estimations with ploidy set to four. Further, we filtered the GATK-generated tetraploid VCF file using filter-VCF.R (Blischak et al., 2018) to retain only biallelic SNPs present in at least 90% of individuals with a minimum quality threshold of 100 and a minimum read depth of five. The resulting polymorphic position was then used to extract base quality scores from the original BAM files using the mpileup command of SAMtools v.1.6 (Li et al., 2009; Li, 2011), to extract read counts and to estimate per site error rates with read-counts-from-VCF.py and, respectively, per-locus-err.py scripts provided with EBG (Blischak et al., 2018). Finally, we inferred final genotypes as alternative allele counts using the GATK model implemented in EBG.
Genetic Diversity and Population Structure of Greek Alkanna
The summary statistics for each sampling locality was assessed by estimating within-population genetic diversity [Hs, analog to the expected heterozygosity (He)] and inbreeding coefficient (GIS, analog to FIS) in GENODIVE v.3.0 (Meirmans, 2020). In addition, nucleotide diversity (π) was estimated with a custom script (Supplementary Notes S1). Finally, we calculated the amount of private alleles for each sampling locality as well as for the genetic groups identified by clustering-based approaches. Private alleles calculations were corrected for a small sample size using the factor [(n + 1)/n] following Brandrud et al. (2020), where n is the number of individuals in the relevant group.
To further assess genetic relationships among the sampled individuals, we first estimated a pairwise relatedness with a method of moments as implemented in PolyRelatedness v.1.8 (Huang et al., 2016). This was then displayed as a heatmap of coancestry with the heatmap.2 function in the R package Gplots v.3.1.1 (Warnes et al., 2009). Next, we carried out a principal component analysis (PCA) based on the covariance of allele frequencies between individuals using GENODIVE (v.3.0; Meirmans, 2020). The first three PCs were visualized as scatter plots using the R package Ggplot2 v.3.2.1 (Wickham, 2016). Only SNPs with no missing data were used for the aforementioned analyses (Supplementary Table S2).
We further assigned individuals to genetic groups using two clustering-based approaches: TESS3 v.1.1.0 implemented in the R package tess3r (Caye et al., 2016) and STRUCTURE v.2.3.4 (Pritchard et al., 2000). For TESS3, we used a dataset, including a single SNP per RAD-seq locus (in total 7,935 SNPs) with maximum 10% missing data, whereas 1,000 SNPs were randomly selected using a custom script (Supplementary Notes S1) from this dataset for STRUCTURE analyses. TESS3 is a spatially explicit clustering program, and therefore, it is more robust when geographic discontinuities are present in the sampling. Furthermore, TESS3 can accommodate data with thousands of SNPs and remains faster as compared to STRUCTURE. Importantly, like STRUCTURE, TESS3 can analyze polyploid data, which is otherwise currently not possible in other fast algorithms, such as FastStructure (Raj et al., 2014) or Admixture (Alexander and Lange, 2011). In TESS3, the clustering was performed from K1 to K10 with ten replicates of each K. The final choice of K was based on cross validation criteria. Our objective using STRUCTURE was to confirm the individual assignment inferred by TESS3. We ran STRUCTURE with 20 replicates for each K value ranging from K = 1 to K = 6, with a burnin period of 50,000 and 100,000 steps. The optimal number of ancestral populations from STRUCTURE results was determined using Evanno’s ΔK method (Evanno et al., 2005) as implemented in STRUCTURE HARVESTER (Earl and vonHoldt, 2012), and the replicate runs were summarized using CLUMPAK online server3 (Kopelman et al., 2015).
To quantify the strength of genetic differentiation among all sampling localities as well as among the K groups identified as above, we estimated pairwise FST with GENODIVE (v.3.0). For FST estimation between K groups, we only included those individuals where the individual assignment to respective groups was greater than 0.8 at the optimal value of K.
Spatial vs. Environmental Contribution to Genomic Divergence
To disentangle the roles of dispersal limitation vs. environmental drivers in shaping the genomic differentiation of A. tinctoria, we first identified the most important climatic variables for our target species using a gradient forest (GF) analysis in the R package gradientForest v.0.1–17 (Ellis et al., 2012). As a nonparametric, machine learning regression tree approach, GF evaluates the associations between genetic variants and other variables by partitioning allele frequency data at split values along the covariate gradients and defining the explained variability as split importance values. The overall importance of each covariate can then be assessed from GF plots which show the mean importance of the covariate weighted by R2 (Bay et al., 2018; Jia et al., 2020; Zhang et al., 2020). For GF analysis, we retrieved 19 bioclimatic variables for our sampling locations from the WorldClim database (Hijmans et al., 2005) at a spatial resolution of 2.5 arc-minutes. To avoid collinearity among covariates across our data points, the Pearson correlation coefficient between the covariates was estimated using the cor function implemented in the R package stats (R Core Team, 2020). We retained only one variable from all pairs having absolute correlation values greater than 0.9 using the findcorrelation command implemented in the R package caret v 6.0–86 (Kuhn et al., 2016). Finally, a total of seven covariates were used in the GF analysis. The three most important covariates identified by GF were then used in downstream analysis.
Next, we performed simple and partial Mantel analyses to test whether geographical or environmental processes contributed to the observed genome-wide divergence among A. tinctoria populations. The analyses were performed on pairwise genetic distances among populations as linearized FST expressed as (FST/1 − FST) and log-transformed geographic or environmental distances. Partial Mantel test was performed by controlling the respective geographical or environmental distance matrices. These analyses were carried out using GENODIVE with 999 permutations.
To further quantify the contribution of IBD and IBE, we employed a multiple matrix regression with randomization (MMRR; Wang, 2013) supplemented with a commonality analysis (CA) as implemented in Cuevas et al. (2020). MMRR is a multiple regression method where distance matrices are used as input to assess the contribution of multiple predictor variables (i.e., geography and environment) to patterns of genetic divergence. The fit of the model is assessed by R2 (coefficient of determination), where the statistical significance of the effect of the predictor variable (βn) and R2 are estimated by randomized permutations of columns and rows of the dependent variable distance matrix (i.e., genetic distances). However, this approach cannot take into account the multi-collinearity among predictors which can affect the estimation of regression coefficients (βn), R2 and values of p (Prunier et al., 2015). To overcome this limitation, we followed the implementation of CA suggested by Prunier et al. (2015) and Cuevas et al. (2020). This analysis decomposes the model coefficients into unique and common variance components. The unique effect represents the sole contribution of the predictor, while the common component quantifies the proportion of variances contributed by the collinearity among two or more predictor variables. Here, CA allows estimating the unique and common effect of geographical and environmental distances on genomic divergence (FST) while accounting for collinearity among explanatory variables. We ran MMRR using pairwise FST as a response variable and geographical and environmental distances as predictor variables (model = FST ~ GEO + ENV) with 1,000 permutations. Variance partitioning analysis was then performed using CA to quantify the common and unique effect of GEO and ENV using a R-script available at https://datadryad.org/stash/dataset/doi:10.5061/dryad.q573n5th7 (Cuevas et al., 2020).
In addition, we identified loci associated with environmental variables using BayPass v.2.2 (Gautier, 2015). In a nutshell, BayPass can identify loci under selection using an FST-like statistic (XtX) that explicitly accounts for the confounding effect of population structure. To do so, BayPass first estimates the covariance matrix of population-level allele frequencies (Ω matrix in Gautier, 2015), which can capture even complex demographic histories. Then BayPass detects outlier loci among variants exhibiting the highest XtX values. BayPass can also identify variants associated with population-specific covariates, including climate or phenotypic data (Gautier et al., 2018; Leroy et al., 2020). The program estimates Bayesian factors (BF) by comparing models with and without covariates. Neutral calibrations of the XtX and BF metrics were performed using pseudo-observed datasets (PODS), following the best practices for BayPass (Gautier, 2015). PODS were generated for 100,000 SNPs using BayPass_utils.R following the recommendations of the BayPass manual. We then used conservative (XtX > 99% quantiles and BF > 99.9%) and very conservative quantiles for this neutral simulation (XtX > 99.9% quantiles and BF > 99.9%) as thresholds to define outliers in the real dataset. All analyses were run using the standard covariate model (STD) and default parameters, and with scaled covariates, as suggested by Gautier (2015).
Results
Genome Size and Chromosome Counts
The genome size of A. tinctoria was found to vary from 1.21 to 1.28 pg. (1C-value), whereas greater variation was observed among the A. sieberi samples, with sizes from 1.08 to 1.21 pg. (Table 1). Neither species showed apparent classes of 1C values suggestive of multiple ploidies, nor were there substantial differences in 1C values of geographic relevance. This suggests that both species might share the same ploidy. These results are the first reported for A. tinctoria and A. sieberi. Within the genus, the only yet published species’ genome size is 11.10 pg./1C in A. leiocarpa (Bou Dagher-Kharrat et al., 2013), which is the approximately 10-fold compared to our findings in A. sieberi and A. tinctoria. Finally, chromosome counts for two A. tinctoria samples were performed and were consistent with 2n = 30 chromosomes in this species (Supplementary Figure S1).
Polyploid Genotype Calling Supports Tetrasomic Inheritance
After demultiplexing, RAD-seq data included on average 1.2 (SD ± 0.5) million high-quality reads per individual. The optimized de novo assembly resulted in a catalogue of 33,126 polymorphic RAD tags of a length of 94 bp. On average, 44.0% (SD ± 8.5%) of the reads mapped back to these contigs with a final average coverage across individuals of 16× (SD ± 6×). Filtering of variants obtained from the EBG pipeline based on missing data, and minor allele frequency yielded 16,107 high-quality SNPs. The distribution of tetraploid genotypic frequencies against their allelic frequencies (estimated from EBG genotypes) in A. tinctoria showed the modes of the distribution of heterozygous genotypes (i.e., Aaaa, AAaa, and AAAa) to be of similar heights in agreement with the hypothesis of tetratomic inheritance (Figure 2; Arnold et al., 2015; Lloyd and Bomblies, 2016; see also section “Discussion” below).
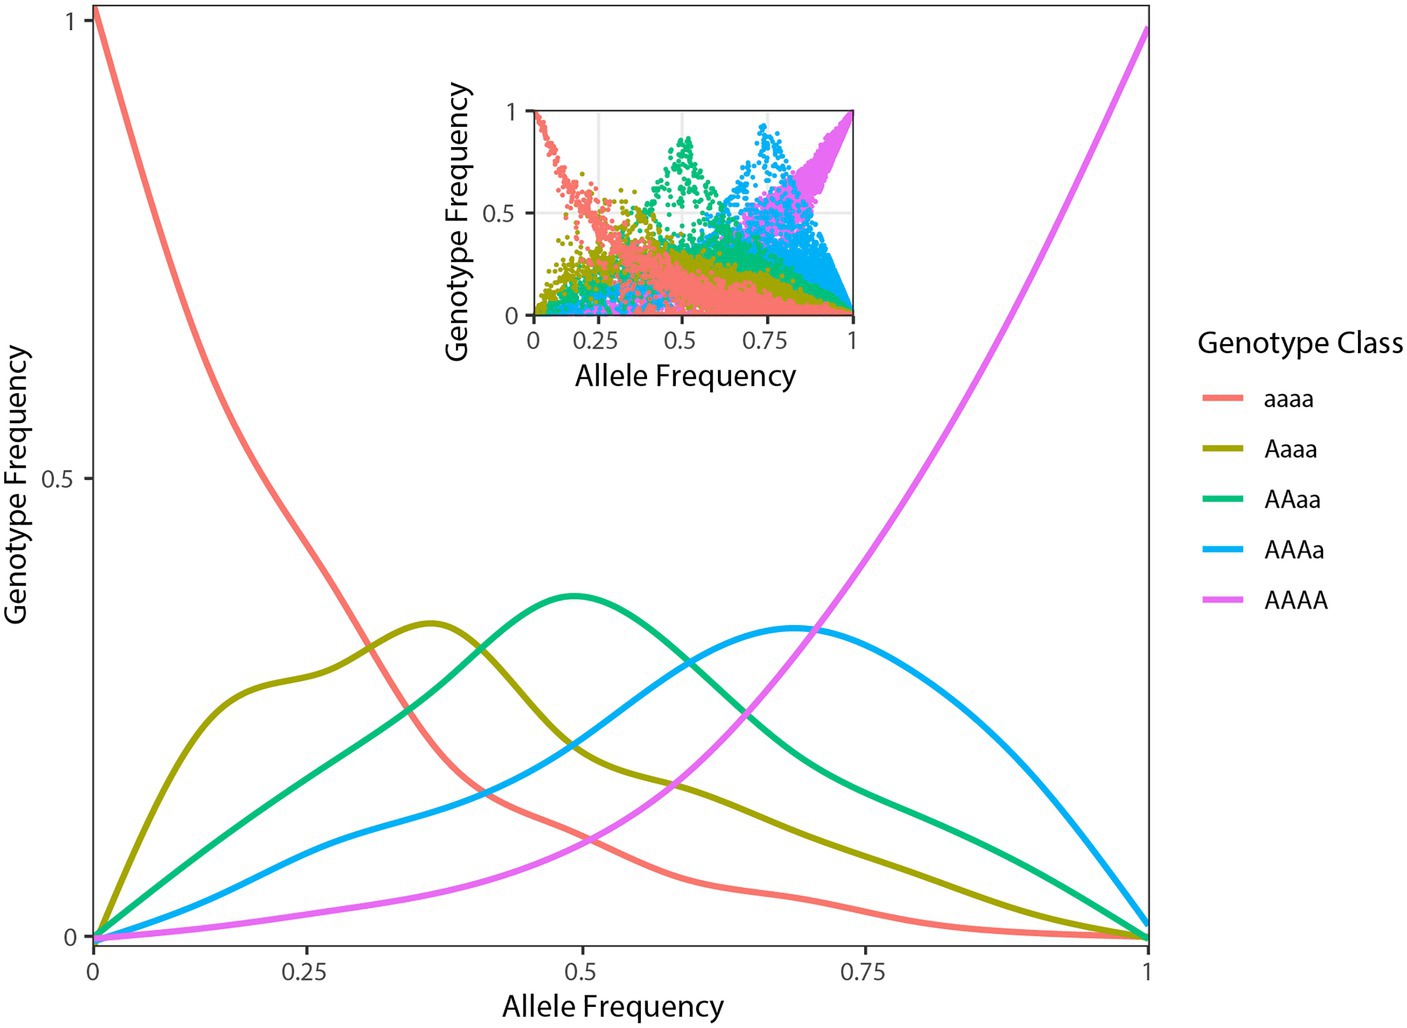
Figure 2. Population genomic data consistent with tetrasomic inheritance. Genotype frequencies (y-axis) as function of allele frequencies (x-axis) in A. tinctoria. The inset shows raw plotting of genotype and allele frequencies of A. tinctoria. The estimates are derived from 16,107 SNPs present across all individuals. For tetrasomic inheritance, all five genotypes are expected to be observe at intermediate (0.5) allele frequency. In addition, the three middle peaks are expected to be of similar height. The pattern observed here is largely consistent with tetrasomic inheritance (see section “Discussion”).
Higher Diversity and Lower Divergence in Northern Greece
To investigate the level and distribution of genetic variation across the sampled localities, we estimated summary statistics. The genetic diversity estimates (π and He) revealed that the northern sampling localities harbor comparatively higher amount of diversity than the other sampled localities of A. tinctoria (Table 2), possibly due to a larger effective population size (Ne) and more limited drift effects in the North. Nevertheless, on average diversity estimates per locality differed only slightly between the two species suggesting similar breeding systems and dispersal capacities within populations. Inbreeding coefficients (FIS) estimated for the sampling localities were all relatively close to zero (Table 2), consistent with Hardy–Weinberg expectations. Based on pairwise FST estimates, lower divergence levels were observed in northern localities, as compared to central and southern localities of A. tinctoria (Supplementary Table S3). Highest divergence levels were observed for the locality AT25 in Central Greece, where FST estimates ranged from 0.144 (AT25-AT17) to 0.409 (AT25-AT28; Supplementary Table S3). More surprisingly, genetic divergence between A. sieberi localities was also high (FST = 0.333); however, one of the A. sieberi localities (AT27) showed lower differentiation to A. tinctoria populations than to the second (AT28) locality of A. sieberi (Supplementary Table S3).
North–South Population Structure in Greek Alkanna
The relatedness-based heatmap allows to identify three main genetic groups (Figure 3A). Two main groups were specific of A. tinctoria hereby called North and Southern-Central. Within the latter group, the analysis allows to find evidence of substructure, both at the regional scale (Central vs. Southern) and even sometimes, more locally, between the different sampling sites (e.g., AT25; Figure 3A). The third main group consisted of the A. sieberi locality from central Crete (AT28), which showed the least relatedness to all A. tinctoria accessions (Figure 3A). However, interestingly, all individuals from the western Cretan locality (AT27) that have been initially identified as A. sieberi showed intermediate relatedness to the individuals of A. tinctoria from Southern-Central group and to A. sieberi from the central Cretan locality (AT28), therefore suggesting interspecific admixture. One accession from A. tinctoria from South Greece (AT01) shows also increased co-ancestry with A. sieberi (indicated with an arrow in Figure 3A), suggesting recent gene flow between A. tinctoria and A. sieberi.
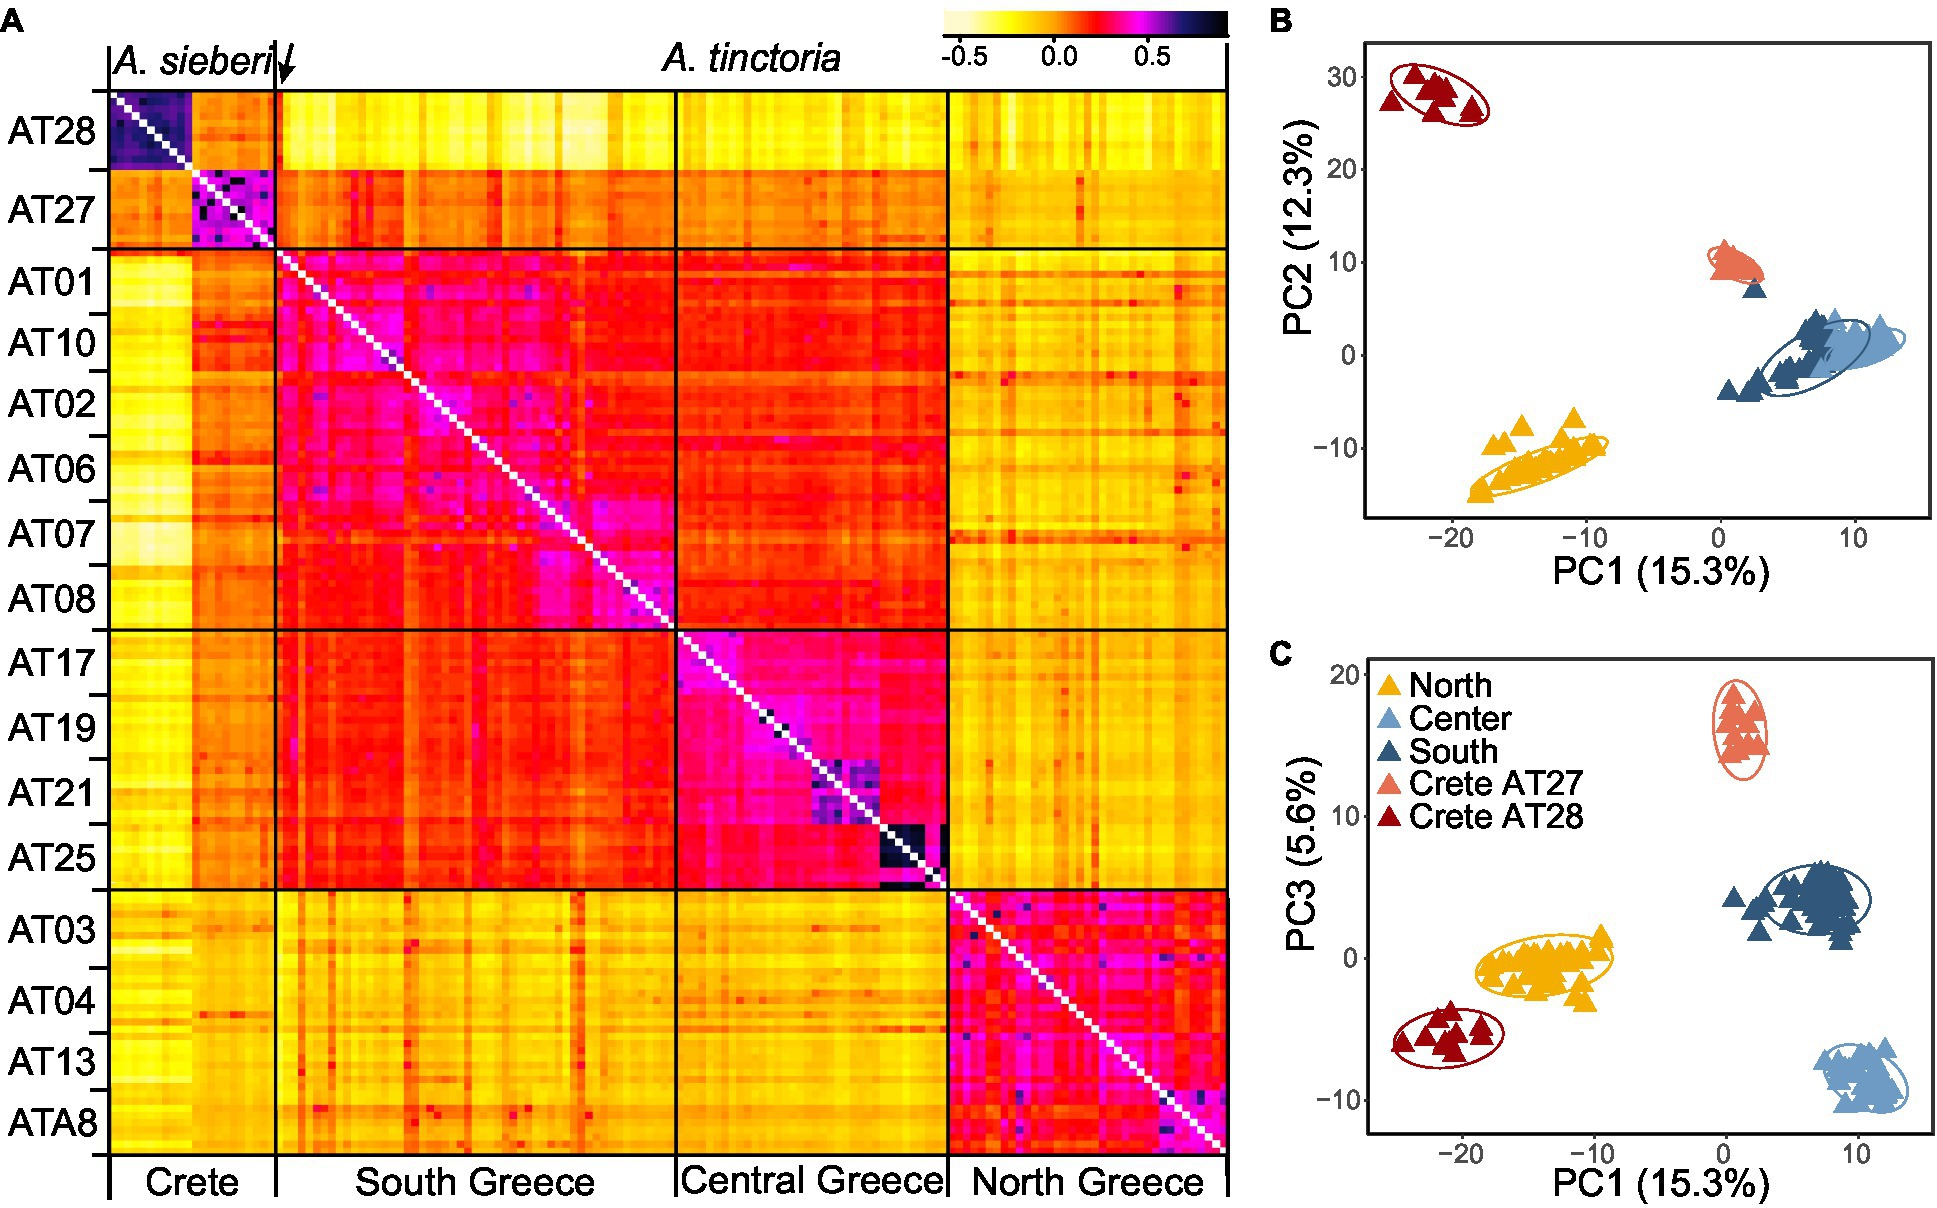
Figure 3. Genomic variation in Alkanna. (A) Heatmap of pairwise relatedness between 148 individuals from 16 different localities across Greece based on 16,107 SNPs present across all individuals. Regional origins of individuals are given below the heatmap, and each population is indicated on the left side of the heatmap. Darker colors represent higher relatedness, according to the legend included on the top right side. For improved color resolution, the estimates on the diagonal were excluded. An arrow points to a potentially admixt individual in population AT01 that is discussed in the text. (B,C) Genetic structure in the Greek Alkanna populations inferred based on EBG-derived tetraploid genotypes (n = 148) as revealed by principal component analysis (PCA).
To further investigate population structure, we performed PCA (Figures 3B,C), which highlighted consistent patterns with the previously identified clusters in the coancestry heatmap. The first two PCs, which together explained 27.6% of the total variance, primarily distinguished individuals of A. sieberi from the central Cretan locality (AT28), and those of A. tinctoria from the North on one side and from the Southern-Central localities on the other. The individuals from the western Crete population (AT27), plus the accession from AT01 already identified as admixed based on the coancestry heatmap, were located between the A. tinctoria Southern-Central group and the cluster formed by A. sieberi accessions from AT28 (Figure 3B), again consistent with admixture. The central Greek localities were well resolved from Southern Greece in particular by PC3, but this axis explains a lower proportion of the total variation (5.6%, Figure 3C).
We then used Bayesian clustering to further investigate these patterns of genetic structure. For that purpose, we used the spatially-explicit TESS3 and the non-spatially explicit, albeit widely used, STRUCTURE programs. Both the cross-validation score as implemented in TESS3 and the use of the Evanno’s ΔK statistic support K = 3 as the best K value (Supplementary Figure S2), suggesting that the dataset can be best explained by three main genetic clusters. For the optimal structure (K = 3), the clustering of individuals is consistent with all previously described analyses (i.e., the presence of three genetic groups), including the likely interspecific admixed nature of AT27 (Figure 1A). Since heatmap and PCA showed substructure within the Southern-Central group, we further evaluated the individual memberships at K values from K = 4 to K = 5. As expected, at these values of K, a further separation of Southern and Central A. tinctoria was observed (Supplementary Figure S3), whereas eastern Crete accessions of A. sieberi showed signatures of admixture between the Southern-Central group and the central Crete population at K = 4 (Supplementary Figure S3) and formed an independent group at K = 5 (Figure 1B).
Finally, to evaluate the strength of genetic differentiation between the identified groups, we estimated FST between the three genetic pools (K = 3) with well-assigned individuals (q > 0.80). We observed a significant genetic divergence between the three groups (p = 0.001). Genetic differentiation was highest between AT28 and mainland groups (North: 0.29 and Southern-Central: 0.31) and lowest between Southern-Central and North group (0.14).
Geographical and Environmental Influences on Genomic Divergence Within Alkanna tinctoria
To assess the role of environmental and geographical variables in the onset of genetic differentiation, we first identified the most important climate-related covariates using a random forest-based approach called gradient forest (GF). Among the seven non-collinear covariates tested with GF, the top three covariates were related to precipitation, including precipitation of coldest quarter (BIO19), precipitation of warmest quarter (BIO18), and annual precipitation (BIO12; Figure 4A). We then used the top three climatic variables identified by GF in Mantel statistics and genotype-environment association analysis. The pairwise genetic distances (FST/1 − FST) between populations were strongly correlated with pairwise geographical distances (R2 = 0.49, p = 0.001). We also observed a milder, but still significant association between the genetic and the environmental distance matrices (R2 = 0.24, p = 0.002; Figures 4B,C). In multiple comparisons, where we controlled for either distances, the geographic distances were strongly and highly significantly associated with genetic distances (Mantel’s r = 0.63, p = 0.001), whereas the association with environmental distances was weaker albeit significant (Mantel’s r = 0.31, p = 0.020). The multivariate model (MMRR), including both predictors (FST ~ GEO + ENV), explained 55% (R2 = 0.55) of the genomic variation within the Greek A. tinctoria (Table 3). Consistent with the results from the partial Mantel analysis, in MMRR, the geographic distances showed a significant and a higher β weight (βGEO = 0.037, p = 0.002; Table 3), explaining 75% of total variation in the model. A considerable proportion of this total variability was assigned as unique (unique 54%; common 21%; Table 3). The environmental distances had a lower β weight (βENV = 0.025, p = 0.003), explaining 45% of the variation in the model (unique 24%; Table 3). Taken together, these results suggest that IBD has a stronger contribution to the overall genetic differentiation among A. tinctoria populations as compared to IBE.
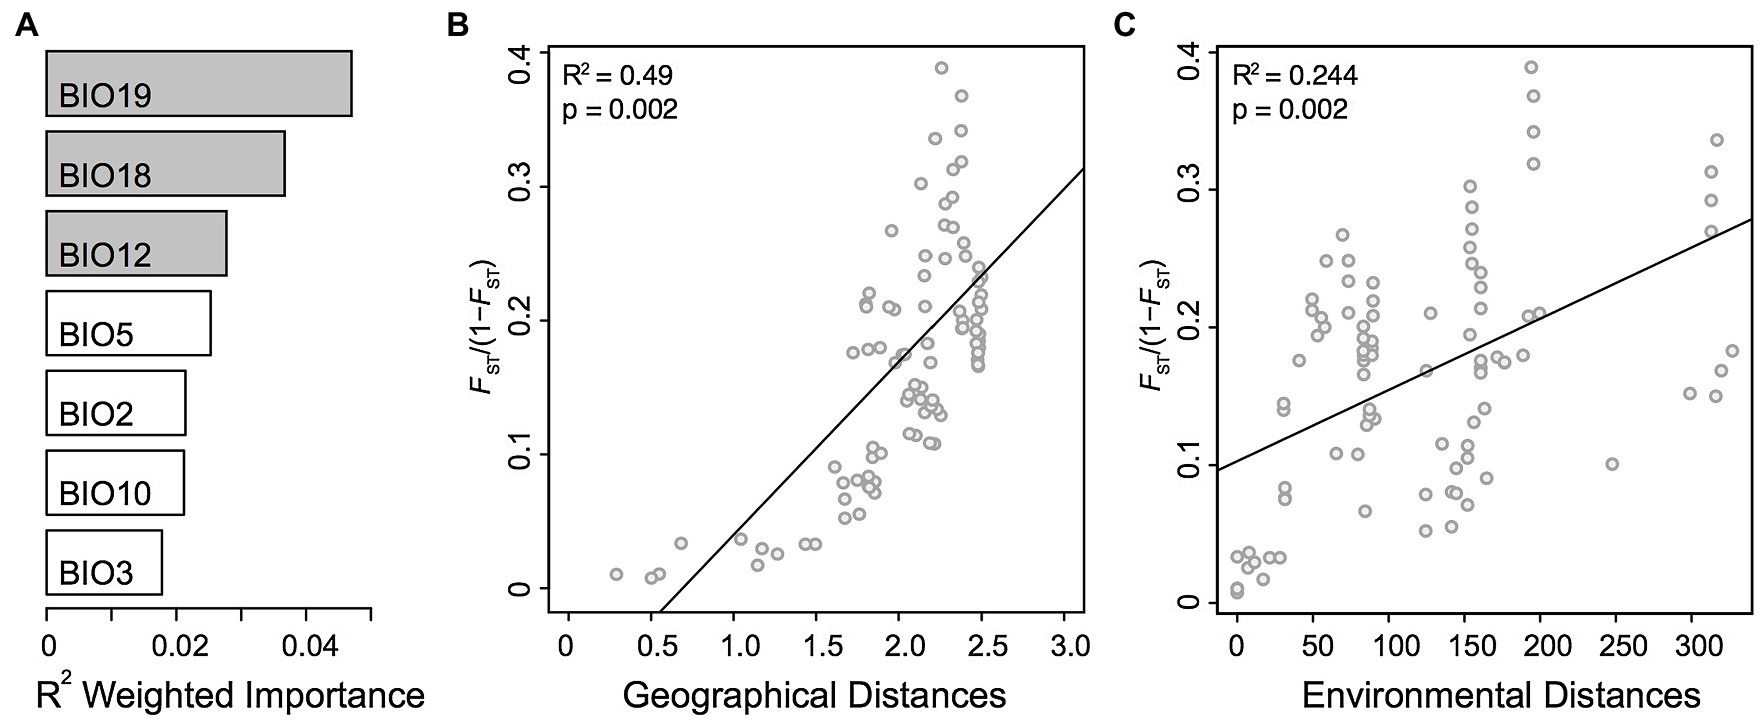
Figure 4. Isolation by distance (IBD) and isolation by environment (IBE). Influence of geographical and environmental covariates on genetic differentiation in Greek populations of A. tinctoria. (A) R2 weighted importance of environmental covariates that explains genetic gradients estimated using gradient forest. Top 3 environmental covariates are given in gray. Relationship of genetic distances (FST/1 − FST) and (B) log-transformed geographical distances, or (C) environmental distances. Analysis are based on 16,107 SNPs present across all individuals.
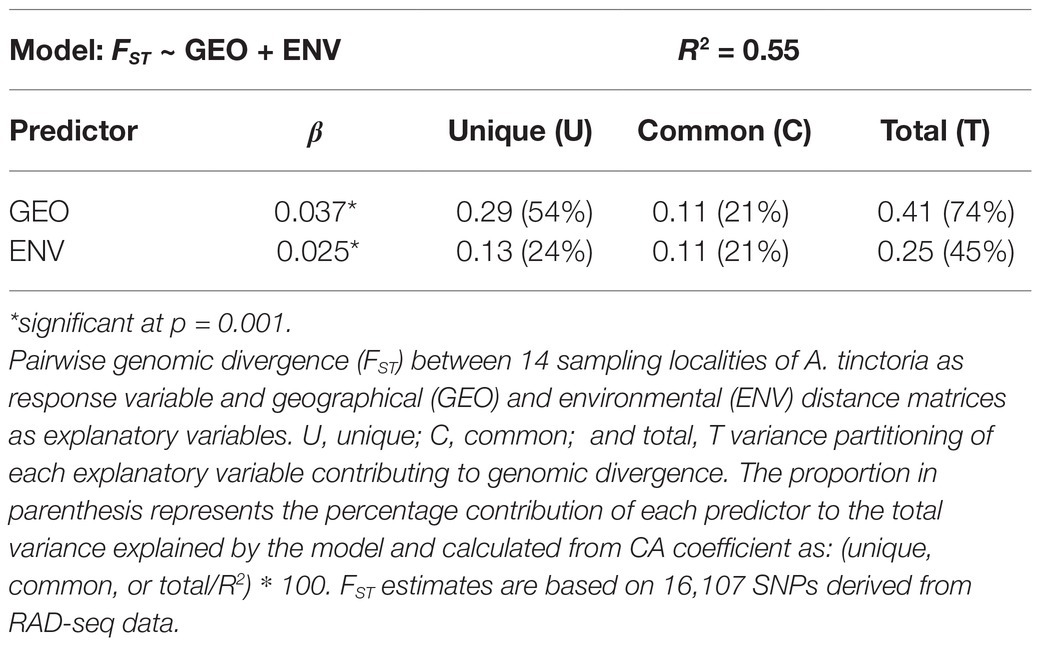
Table 3. Summary of multiple matrix regression with randomization (MMRR) and commonality analysis (CA).
Genotype-Environment Associations
Although the overall population structure appears more explained by migration-drift equilibrium, some loci could be affected by selection either directly, or through linkage. We therefore performed a FST outlier scan and a genotype-environment association analysis. To identify non-neutral markers, we performed a classical genome scan using the XtX statistics, an FST analog which explicitly accounts for the confounding effect of population structure, including IBD. Using BayPass, we identified 107 SNPs (0.7% of all SNPs) with conservative criteria, including 17 (0.11%) using a more conservative criterion. Then, under BayPass, we assessed associations of three top bioclimatic variables and identified between up to 0.14% of the SNPs with BF > 99.9% depending on the variable. Interestingly, among the 107 previously detected FST outliers, several SNPs were associated with precipitation: Six SNPs were associated with annual precipitation (BIO12; BF > 99.9%, XtX > 99%), including one SNP among the 17 strongest outliers. Similarly, six and four SNPs were associated with precipitation of warmest quarter (BIO18) and of coldest quarter (BIO19), including three and one SNPs among the 17 strongest outliers, respectively (Supplementary Figure S4). Among all these outliers, three SNPs were associated with both BIO12 and BIO19 (Supplementary Figure S4). Clinal variation of allele frequencies across each clinal gradient follows linear trends as shown in Supplementary Figure S5.
Discussion
RAD-seq is being commonly employed to study the intra- and interspecific genomic divergence, to investigate the levels of genomic diversity and to resolve phylogenomic relationships of diverged lineages (Paun et al., 2016; Rochette and Catchen, 2017; Brandrud et al., 2020). However, the use of RAD-seq in non-model polyploid species is still challenging due to difficulties of inferring allele copy numbers (Clevenger et al., 2015; Wagner et al., 2020). Thus, only recently, RAD-seq has started to be used for analyzing population structure of non-model polyploid plant species (Zohren et al., 2016; Brandrud et al., 2017). Here, using an appropriate ploidy-aware genotype calling approach (Blischak et al., 2018; Brandrud et al., 2020), we investigated the main drivers of genomic diversity and divergence of Greek populations of A. tinctoria – a species of particular interest in the traditional and modern pharmacopeia (Papageorgiou et al., 1999; Assimopoulou et al., 2011), jointly analyzed with two populations of a potential closely related outgroup species, A. sieberi. Overall, we detect a marked regional structure along a latitudinal gradient and highlight an important role for physical distance between the investigated sites in shaping genetic diversity. However, we also identified loci with variation related to ecological pressures, in particular related to precipitation, suggesting that both levels can be at play in shaping the population structure in A. tinctoria.
Genome Size Variation and Fixed Dysploidy at the Tetraploid Level
Considering all available evidence, including the newly described chromosome number (2n = 30), previous microsatellite analyses where up to four alleles were observed per individual (Ahmad et al., 2019), and previously reported base chromosome numbers in the genus (x = 7 most frequently reported, but also x = 10, 11 and the derived secondary base number of x2 = 15; Coppi et al., 2006; Weigend et al., 2016), we inferred that A. tinctoria is a dysploid at the tetraploid level (4x + 2) derived from lineages/species with x = 7. Indeed, x = 7 is one of the widespread in Lithospermae (Weigend et al., 2016). A tetraploid state is also strongly supported by the present genomic analyses, in particular by the similar frequencies of Aaaa, AAaa, and AAAa genotypes when the data are scored as tetraploid (Figure 2). On the other hand, the relatively consistent genome size estimates within A. tinctoria, and the lack of substantial genome size differences between A. tinctoria and A. sieberi (Table 1) suggests that the sampled accessions of these two species represent a single ploidy. This is in agreement with previous karyological findings for A. tinctoria (Grau, 1968; Kamari and Papatsou, 1973; Luque, 1990; Markova, 1995), supporting a single ploidy across its entire distribution range.
In tribe Lithospermae, several tetraploid species have been identified (Luque, 1990; Korbecka et al., 2003; Coppi et al., 2006; Kolarčik et al., 2014; Weigend et al., 2016). Moreover, both allopolyploids and autopolyploids have been described in this tribe (Luque and Valdes, 1984; Kolarčik et al., 2014, 2015; Weigend et al., 2016). In the present study, two lines of genomic evidence led us to suggest that A. tinctoria might be an autopolyploid. First, in allotetraploids, especially those with well-differentiated parents and disomic inheritance, the proportion of duplex heterozygous genotypes (e.g., AAaa) is expected to be significantly higher than other classes of heterozygous genotypes (e.g., AAAa and Aaaa). At the other end of a continuum, autotetraploids with tetrasomic inheritance are expected to show the reversed trend. In A. tinctoria, we observed that triplex heterozygous genotype class (i.e., AAAa and Aaaa together) is approximately two-fold more frequent than the duplex heterozygous genotypes (Figure 2). Second, for loci with intermediate allele frequency, allopolyploids are expected to be largely represented by AAaa genotypes because of fixed differences between divergent subgenomes (Lloyd and Bomblies, 2016). In contrast, in autopolyploids, all five genotype classes are expected to be observed around this allele frequency (Lloyd and Bomblies, 2016). When A. tinctoria genotype proportions were plotted against allele frequencies, all five classes of genotypes could be seen at intermediate allele frequency (Figure 2). This distribution is comparable to that described for autotetraploid Arabidopsis arenosa (Arnold et al., 2015) and it is expected under a tetrasomic mode of inheritance (see Figures 1C,D in Lloyd and Bomblies, 2016). However, we note that in depth cytological investigation would be required to confirm the hypothesis put forward here.
Spatial Structure in Greek Alkanna Is Associated With a Latitudinal Gradient
Genetic diversity within localities of A. tinctoria was moderate and mostly homogenous across the sampling range, with higher values in the North (Table 2). Although not directly comparable, a previous study also reported moderate albeit similar levels of genetic diversity at inter simple repeat markers (ISSR) in three other Alkanna species (Semerdjieva et al., 2020). The relatively higher genetic diversity and lower genetic differentiation between sampling localities (Table 2; Supplementary Table S3) observed in the North could be a result of higher connectivity of stands and larger Ne leading to lower effect of genetic drift as compared to central Greece where A. tinctoria has a much more fragmented distribution. During field visits, we observed an absence of A. tinctoria from several regions located around East-Central Greece (e.g., Lárisa, Magnisia, and Fthiotida) probably due to a change of management practices (conversion into agricultural lands), or due to expanding urbanization over natural habitats. Reduced connectivity of suitable habitats could lead to genetic isolation (Toczydlowski and Waller, 2019) and thus expose populations to greater effects of genetic drift. Consistent with an increased effect of genetic drift in more isolated localities, we observed highest amount of FST as well as reduced genetic diversity at locality AT25 in central Greece which appeared disconnected from other populations by vast agricultural landscape.
Genetic structure analyses identified two divergent A. tinctoria clusters, localized around Northern and, respectively, Southern-Central Greece, with a weaker subdivision between South and Central accessions (Figures 1, 3), consistent with a latitudinal structuring of regional genetic variation. The strength of divergence was further confirmed by a significant FST (0.14, p = 0.001) estimated between these main genetic pools. Although investigating different regions and spatial scales, other studies also found evidence for significant genetic structure in other Alkanna species (Wolff et al., 1997; Semerdjieva et al., 2020).
Genetic structure, such as that observed in A. tinctoria, is possibly explained by the establishment of populations from multiple glacial refugia as have been reported for other Balkan and Mediterranean regions (for a review see Nieto, 2014). However, this might be a less likely explanation for the Greek A. tinctoria, as currently available phylogeographic or phylogenetic studies on plants (Lakušić et al., 2013; Jaros et al., 2018; Janković et al., 2019) from Greek part of Balkan rather provide indications for an East–West genetic differentiation (Španiel et al., 2017; Falch et al., 2019). But what might have been the forces giving rise to the North–South clustering in Greek A. tinctoria? Although not explicitly tested in the current study, the identified genetic structure in mainland localities of A. tinctoria mirrors the Greek phytogeographic zones suggested in Flora Hellenica (Dimopoulos et al., 2013, 2016; Strid, 2016). For example, the northern lineage of A. tinctoria belongs to the North–East (NE) phytogeographic region, whereas the majority of the southern-central localities pertain to the Sterea Ellas (StE), except two populations which were collected at the boundary between East-Central (EC) and StE (AT17 and AT19), and between Peloponnisos (Pe) and StE (AT07 and AT08). Botanical exploration and biosystematics studies have shown consistent discontinuities in species composition, richness, and endemism patterns between StE and NE (Strid, 1996, 2016; Dimopoulos et al., 2013, 2016). These phytogeographical regions take into account biogeography and have been mainly defined by network biogeography (Kougioumoutzis et al., 2017), or comparative floristics (Strid, 1996). Hence, these divisions reflect the paleogeographic history of those regions and dispersal limitations of organisms owing to geographic as well as ecological barriers. In the case of Greece, this could include the complex geological history of the Aegean region (e.g., fragmentation of mainland and subsequent island formation including the Aegean archipelago), topographic heterogeneity (numerous mountain massifs and mountain ranges separated by rivers, valleys, plains, and lowlands), varied climatic (descending rainfall and ascending temperature gradients from north to south), and soil features (Dimopoulos et al., 2016; Perlès, 2016). Hence, these phytogeographic regions represent a conglomerate of many factors (including geological, geographical, and environmental covariates), which might have shaped the observed genetic differentiation in A. tinctoria.
Dispersal Limitation as a Primary Source of Genetic Divergence in A. tinctoria
The high relatedness of geographically proximal individuals, as well as the above-mentioned clustering patterns (Figures 1, 3), suggest that IBD might have played a major role in shaping the observed genetic differentiation. Indeed, we inferred a significant relationship between geographical and genetic distances even after controlling for climatic covariates (Figure 4B; Table 3). In A. tinctoria, seed dispersal is limited to very short distances (Ulrych and Szabóová, 2010), with pollen exchange likely promoting almost exclusively gene flow between localities. Although no detailed study has been carried out on pollination in A. tinctoria, existing evidence suggests that pollination is performed by bees (Ulrych and Szabóová, 2010; Dafni et al., 2012), insects with limited potential for long-distance dispersal, especially in areas with complex topography, such as Greece, where plains are separated by mountains and sea. Such a pattern could therefore be consistent with IBD, i.e., a migration-drift equilibrium hypothesis. Furthermore, the southern Balkan Peninsula has been recognized as an important glacial refugium for Mediterranean biota (Médail and Diadema, 2009), opening the possibility that A. tinctoria existed in this region for a long period. A long local history together with limited dispersal, patchy distribution and topographic barriers, could have led to the observed pattern of IBD.
Climate as a Second Source of Population Structure in A. tinctoria
Climatic variables have been implicated as strong selective factors in plants (Joshi et al., 2001). Understanding the association of climatic covariates with the observed genetic divergence can prove useful in determining a species’ ability to persist against varying climatic scenarios (Jia et al., 2020). Our study identified significant associations between environmental variables and genetic differentiation after controlling for spatial covariates (Figure 4C; Table 3). Specifically, GF analysis indicated that the genetic structure across our sampling localities is strongly associated with precipitation characteristics (Figure 4A). The Mediterranean climate is mainly characterized by hot, dry summers and cold, comparatively wet winters (Joffre et al., 1999). In this environment, the precipitation regime imposes strong constraints on plants and can act as an important evolutionary driver (Galmés et al., 2007). A. tinctoria is habitually confined to sandy soils and rocky places, xeric grasslands, and coastal habitats, highlighting the sensitivity to water availability, and autumnal wetter periods have been shown to coincide with rigorous plant growth for this species (Pluhár et al., 2001). Moreover, rainfall during late winter is important for early spring flowering in many plant species (Moore and Lauenroth, 2017). Therefore, precipitation characteristics appear to play an important role in promoting local adaptation and shaping genetic differentiation in A. tinctoria. Additional support for this hypothesis is also offered by the identification of outlier loci associated with rainfall (Supplementary Figure S4). Although the identified loci are few and do not entirely deviate from the neutral expectations, some of these loci show substantial allele frequency changes associated with the respective covariates (Supplementary Figure S5), pointing to adaptive genetic differentiation.
Genomic Divergence and Introgression in Mainland-Island Congeners of Alkanna
Our investigation of genetic differentiation detected a high genetic differentiation between mainland A. tinctoria and A. sieberi accessions from one of the two sampled Cretan localities (AT28; Figures 1, 3; average FST = 0.271, p = 0.001) after excluding putatively admixed individuals. Phylogenetic and historical biogeographical studies have shown that the diversification in islands mainly occurred via vicariant speciation that is taxa become isolated owing to formation of barriers (Comes et al., 2008; Cellinese et al., 2009; Poulakakis et al., 2015; Sfenthourakis and Triantis, 2017; Jaros et al., 2018). However, secondary colonization events and gene flow between divergent populations from mainland or neighboring islands during sea level fluctuations and recurrent land bridge formation have also been proposed in other species (Li et al., 2010; Zhai et al., 2012). Due to lack of dated phylogenomic studies in genus Alkanna and the absence of samples of A. tinctoria from Crete do not allow us to predict whether the observed genetic split between mainland-island congener is a consequence of strictly vicariant divergence, or resulted from the colonization event(s), as the later has been hypothesized for some Cretan (sub)species (Cellinese et al., 2009; Jaros et al., 2018). In the future, a more wide sampling of each taxon is needed to understand whether the observed pattern follows the allopatric model of vicariant divergence, or other processes (i.e., post-fragment colonization) are also at play.
Intriguingly, in addition to genetic divergence between mainland-island congeners, our data identify significant introgression between the divergent southern lineage of A. tinctoria and the Central population from Crete. We identified via traditional and Bayesian clustering that the investigated accessions from AT27 showed an admixed ancestry between the two species (Figures 1, 3). In addition, AT27 formed its own independent clade on the third PC, as well as in the STRUCTURE and TESS3 results at K = 5 (Figure 1B), but showed comparatively lower heterozygosity. In turn, this implies that the admixture event might be old and further point toward a complex demographic history where the admixed population might have experienced bottlenecks during colonization phase resulting in the reduction of genetic diversity.
Conclusion
In the present study, we provide evidence that only dysploid tetraploid A. tinctoria and A. sieberi are prevalent in Greece, the main distribution area for these species. Our further population genetic inferences start from ploidy-aware genotype calling and successfully employ a strategy that can be extended to other polyploid non-model plant species, for example, in order to develop hypotheses regarding mode of inheritance of polyploids. Overall, we found a moderate intrapopulation genetic diversity in A. tinctoria, but significant regional differentiation, together with clear evidence of admixture between mainland and island congeners. Furthermore, the strong genetic structure uncovered is in line with native phytogeographical divisions and appears mainly shaped as a result of dispersal limitations and drift, but also of isolation by environment, with precipitation as the main contributing factor. Finally, the genomic variation revealed here can be used to further inform and predict the structure of phenotypic variation (e.g., alkannin and shikonin production) in this important medicinal plant, prompting to future studies.
Data Availability Statement
The raw sequence reads can be found at NCBI (https://www.ncbi.nlm.nih.gov/) under the accession number PRJNA705074.
Author Contributions
MA, ES, CL, and OP planned and designed the research. NK collected the samples. ET and HW-S performed flow cytometry and chromosomal counts. MA prepared the RAD-seq libraries and analyzed the data with support from OP and TL. MA, ES, TL, and OP interpreted the results. MA and OP wrote the manuscript with the input from all authors. All authors contributed to the article and approved the submitted version.
Funding
The research was funded by the European Union’s Horizon 2020 Research and Innovation Program under the Marie Skłodowska-Curie grant agreement no 721635.
Conflict of Interest
The authors declare that the research was conducted in the absence of any commercial or financial relationships that could be construed as a potential conflict of interest.
The reviewer EZ declared a past co-authorship with one of the authors OP to the handling editor.
Acknowledgments
This article was dedicated to CL, a wonderful scientist and mentor that passed away too early. We thank Angela Sessitsch and our partners in MICROMETABOLITE project for obtaining the funding, Eleni Maloupa, Andreana Assimopoulou, and Nikolas Fokialakis for provision of plant material used in this study, Karin Hansel-Hohl for her support in the wet laboratory, Antonielli Livio and Silvia Madritsch for initial help with Bash and R scripts, and Paul Blischak for advices on EBG implementation.
Supplementary Material
The Supplementary Material for this article can be found online at: https://www.frontiersin.org/articles/10.3389/fpls.2021.706574/full#supplementary-material
Footnotes
References
Ahmad, M., Lazic, D., Hansel-Hohl, K., Lexer, C., and Sehr, E. M. (2019). Development of novel microsatellite markers for Alkanna tinctoria by comparative transcriptomics. Appl. Plant Sci. 7:e11296. doi: 10.1002/aps3.11296
Alexander, D. H., and Lange, K. (2011). Enhancements to the ADMIXTURE algorithm for individual ancestry estimation. BMC Bioinform. 12:246. doi: 10.1186/1471-2105-12-246
Arnold, B., Kim, S.-T., and Bomblies, K. (2015). Single geographic origin of a widespread autotetraploid Arabidopsis arenosa lineage followed by interploidy admixture. Mol. Biol. Evol. 32, 1382–1395. doi: 10.1093/molbev/msv089
Assimopoulou, A., Tappeiner, J., Ganzera, M., Vasiliou, A., Stuppner, H., and Papageorgiou, V. P. (2011). Determination of alkannin/shikonin derivatives in endemic Greek Alkanna species. Planta Med. 77:1282742. doi: 10.1055/s-0031-1282742
Baird, N. A., Etter, P. D., Atwood, T. S., Currey, M. C., Shiver, A. L., Lewis, Z. A., et al. (2008). Rapid SNP discovery and genetic mapping using sequenced RAD markers. PLoS One 3:e3376. doi: 10.1371/journal.pone.0003376
Bay, R. A., Harrigan, R. J., Le Underwood, V., Gibbs, H. L., Smith, T. B., and Ruegg, K. (2018). Genomic signals of selection predict climate-driven population declines in a migratory bird. Science 359, 83–86. doi: 10.1126/science.aan4380
Blischak, P. D., Kubatko, L. S., and Wolfe, A. D. (2016). Accounting for genotype uncertainty in the estimation of allele frequencies in autopolyploids. Mol. Ecol. Resour. 16, 742–754. doi: 10.1111/1755-0998.12493
Blischak, P. D., Kubatko, L. S., and Wolfe, A. D. (2018). SNP genotyping and parameter estimation in polyploids using low-coverage sequencing data. Bioinformatics 34, 407–415. doi: 10.1093/bioinformatics/btx587
Bou Dagher-Kharrat, M., Abdel-Samad, N., Douaihy, B., Bourge, M., Fridlender, A., Siljak-Yakovlev, S., et al. (2013). Nuclear DNA C-values for biodiversity screening: case of the Lebanese flora. Plant Biosyst. Int. J. Deal. Aspect. Plant Biol. 147, 1228–1237. doi: 10.1080/11263504.2013.861530
Brandrud, M. K., Baar, J., Lorenzo, M. T., Athanasiadis, A., Bateman, R. M., Chase, M. W., et al. (2020). Phylogenomic relationships of diploids and the origins of allotetraploids in Dactylorhiza (Orchidaceae). Syst. Biol. 69, 91–109. doi: 10.1093/sysbio/syz035
Brandrud, M. K., Paun, O., Lorenzo, M. T., Nordal, I., and Brysting, A. K. (2017). RADseq provides evidence for parallel ecotypic divergence in the autotetraploid Cochlearia officinalis in northern Norway. Sci. Rep. 7:5573. doi: 10.1038/s41598-017-05794-z
Catchen, J., Hohenlohe, P. A., Bassham, S., Amores, A., and Cresko, W. A. (2013). Stacks: an analysis tool set for population genomics. Mol. Ecol. 22, 3124–3140. doi: 10.1111/mec.12354
Caye, K., Deist, T. M., Martins, H., Michel, O., and François, O. (2016). TESS3: fast inference of spatial population structure and genome scans for selection. Mol. Ecol. Resour. 16, 540–548. doi: 10.1111/1755-0998.12471
Cellinese, N., Smith, S. A., Edwards, E. J., Kim, S. T., Haberle, R. C., Avramakis, M., et al. (2009). Historical biogeography of the endemic campanulaceae of Crete. J. Biogeogr. 36, 1253–1269. doi: 10.1111/j.1365-2699.2008.02077.x
Chacón, J., Luebert, F., Selvi, F., Cecchi, L., and Weigend, M. (2019). Phylogeny and historical biogeography of Lithospermeae (Boraginaceae): disentangling the possible causes of miocene diversifications. Mol. Phylogenet. Evol. 141:106626. doi: 10.1016/j.ympev.2019.106626
Clevenger, J., Chavarro, C., Pearl, S. A., Ozias-Akins, P., and Jackson, S. A. (2015). Single nucleotide polymorphism identification in polyploids: a review, example, and recommendations. Mol. Plant 8, 831–846. doi: 10.1016/j.molp.2015.02.002
Comes, H. P., Tribsch, A., and Bittkau, C. (2008). Plant speciation in continental island floras as exemplified by Nigella in the Aegean archipelago. Philos. Trans. R. Soc. B 363, 3083–3096. doi: 10.1098/rstb.2008.0063
Coppi, A., Selvi, F., and Bigazzi, M. (2006). Chromosome studies in Mediterranean species of Boraginaceae. Flora Mediterr. 16, 253–274.
Cuevas, A., Ravinet, M., Saetre, G.-P., and Eroukhmanoff, F. (2020). Intraspecific genomic variation and local adaptation in a young hybrid species. Mol. Ecol. doi: 10.1111/mec.15760 (in press).
Dafni, A., Izhaki, I., and Ne’eman, G. (2012). The effect of fire on biotic interactions in Mediterranean basin ecosystems: pollination and seed dispersal. Israel J. Ecol. Evol. 58, 235–250.
Dimopoulos, P., Raus, T., Bergmeier, E., Constantinidis, T., Iatrou, G., Kokkini, S., et al. (2013). Vascular plants of Greece: an annotated checklist. Englera. Vol. 31 (Berlin: Botanic Garden and Botanical Museum Berlin-Dahlem; Athens: Hellenic Botanical Society), 365.
Dimopoulos, P., Raus, T., Bergmeier, E., Constantinidis, T., Iatrou, G., Kokkini, S., et al. (2016). Vascular plants of Greece: an annotated checklist. Supplement. Willdenowia 46, 301–347. doi: 10.3372/wi.46.46303
Dufresne, F., Stift, M., Vergilino, R., and Mable, B. K. (2014). Recent progress and challenges in population genetics of polyploid organisms: an overview of current state-of-the-art molecular and statistical tools. Mol. Ecol. 23, 40–69. doi: 10.1111/mec.12581
Earl, D. A., and vonHoldt, B. M. (2012). STRUCTURE HARVESTER: a website and program for visualizing STRUCTURE output and implementing the Evanno method. Conserv. Genet. Resour. 4, 359–361. doi: 10.1007/s12686-011-9548-7
Eliáš, P., Dítě, D., Kliment, J., Hrivnák, R., and Feráková, V. (2015). Red list of ferns and flowering plants of Slovakia, 5th Edn. Biologia 70, 218–228. doi: 10.1515/biolog-2015-0018
Ellis, N., Smith, S. J., and Pitcher, C. R. (2012). Gradient forests: calculating importance gradients on physical predictors. Ecology 93, 156–168. doi: 10.1890/11-0252.1
Evanno, G., Regnaut, S., and Goudet, J. (2005). Detecting the number of clusters of individuals using the software STRUCTURE: a simulation study. Mol. Ecol. 14, 2611–2620. doi: 10.1111/j.1365-294X.2005.02553.x
Falch, M., Schönswetter, P., and Frajman, B. (2019). Both vicariance and dispersal have shaped the genetic structure of eastern Mediterranean Euphorbia myrsinites (Euphorbiaceae). Perspect. Plant Ecol. Evol. Systemat. 39:125459. doi: 10.1016/j.ppees.2019.125459
Fournier-Level, A., Korte, A., Cooper, M. D., Nordborg, M., Schmitt, J., and Wilczek, A. M. (2011). A map of local adaptation in Arabidopsis thaliana. Science 334, 86–89. doi: 10.1126/science.1209271
Galbraith, D. W., Harkins, K. R., Maddox, J. M., Ayres, N. M., Sharma, D. P., and Firoozabady, E. (1983). Rapid flow cytometric analysis of the cell cycle in intact plant tissues. Science 220, 1049–1051. doi: 10.1126/science.220.4601.1049
Galmés, J., Medrano, H., and Flexas, J. (2007). Photosynthetic limitations in response to water stress and recovery in Mediterranean plants with different growth forms. New Phytol. 175, 81–93. doi: 10.1111/j.1469-8137.2007.02087.x
Gautier, M. (2015). Genome-wide scan for adaptive divergence and association with population-specific covariates. Genetics 201, 1555–1579. doi: 10.1534/genetics.115.181453
Gautier, M., Yamaguchi, J., Foucaud, J., Loiseau, A., Ausset, A., Facon, B., et al. (2018). The genomic basis of color pattern polymorphism in the harlequin ladybird. Curr. Biol. 28, 3296.e7–3302.e7. doi: 10.1016/j.cub.2018.08.023
Grau, J. (1968). Cytologische Untersuchungen an Boraginaceen. Mitt. Bot. Staatssamml. Münch. 7, 277–294.
Greilhuber, J., and Ebert, I. (1994). Genome size variation in Pisum sativum. Genome 37, 646–655. doi: 10.1139/g94-092
Hartl, D. L., and Clark, A. G. (1997). Principles of Population Genetics. 3rd Edn. Sunderland, Mass: Sinauer Associates.
Heckenhauer, J., Samuel, R., Ashton, P. S., Salim, K. A., and Paun, O. (2018). Phylogenomics resolves evolutionary relationships and provides insights into floral evolution in the tribe Shoreeae (Dipterocarpaceae). Mol. Phylogenet. Evol. 127, 1–3. doi: 10.1016/j.ympev.2018.05.010
Hijmans, R. J., Cameron, S. E., Parra, J. L., Jones, P. G., and Jarvis, A. (2005). Very high resolution interpolated climate surfaces for global land areas. Int. J. Climatol. 25, 1965–1978. doi: 10.1002/joc.1276
Huang, K., Ritland, K., Dunn, D. W., Qi, X., Guo, S., and Li, B. (2016). Estimating relatedness in the presence of null alleles. Genetics 202, 247–260. doi: 10.1534/genetics.114.163956
Hughes, A. R., Inouye, B. D., Johnson, M. T. J., Underwood, N., and Vellend, M. (2008). Ecological consequences of genetic diversity. Ecol. Lett. 11, 609–623. doi: 10.1111/j.1461-0248.2008.01179.x
Janković, I., Satovic, Z., Liber, Z., Kuzmanović, N., Di Pietro, R., Radosavljević, I., et al. (2019). Genetic and morphological data reveal new insights into the taxonomy of Campanula versicolor s.l. (Campanulaceae). Taxon 68, 340–369. doi: 10.1002/tax.12050
Jaros, U., Tribsch, A., and Comes, H. P. (2018). Diversification in continental island archipelagos: new evidence on the roles of fragmentation, colonization and gene flow on the genetic divergence of Aegean Nigella (Ranunculaceae). Ann. Bot. 121, 241–254. doi: 10.1093/aob/mcx150
Jia, K.-H., Zhao, W., Maier, P. A., Hu, X. G., Jin, Y., Zhou, S. S., et al. (2020). Landscape genomics predicts climate change-related genetic offset for the widespread Platycladus orientalis (Cupressaceae). Evol. Appl. 13, 665–676. doi: 10.1111/eva.12891
Joffre, R., Rambal, S., and Damesin, C. (1999). “Functional attributes in Mediterranean-type ecosystems,” in Handbook of functional plant ecology. eds. F. Pugnaire and V. Valladares (New York: Marcel Dekker), 347–380.
Jones, O. R., and Wang, J. (2012). A comparison of four methods for detecting weak genetic structure from marker data. Ecol. Evol. 2, 1048–1055. doi: 10.1002/ece3.237
Joshi, J., Schmid, B., Caldeira, M. C., Dimitrakopoulos, P. G., Good, J., Harris, R., et al. (2001). Local adaptation enhances performance of common plant species. Ecol. Lett. 4, 536–544. doi: 10.1046/j.1461-0248.2001.00262.x
Kamari, G., and Papatsou, S. (1973). Chromosome studies in some Mediterranean angiosperms. Nord. J. Bot. 126, 266–268.
Kolarčik, V., Ducár, E., and Kačmárová, T. (2015). Patterns of pollen stainability in polyploids of the genus Onosma (Boraginaceae). Plant Ecol. Evol. 148, 76–89. doi: 10.5091/plecevo.2015.1053
Kolarčik, V., Zozomová-Lihová, J., Ducár, E., and Mártonfi, P. (2014). Evolutionary significance of hybridization in Onosma (Boraginaceae): analyses of stabilized hemisexual odd polyploids and recent sterile hybrids. Biol. J. Linn. Soc. 112, 89–107. doi: 10.1111/bij.12270
Kopelman, N. M., Mayzel, J., Jakobsson, M., Rosenberg, N. A., and Mayrose, I. (2015). Clumpak: A program for identifying clustering modes and packaging population structure inferences across K. Mol. Ecol. Resour. 15, 1179–1191. doi: 10.1111/1755-0998.12387
Korbecka, G., Vrieling, K., Squirrell, J., Hale, M. L., and Wolff, K. (2003). Characterization of six microsatellite loci in Echium vulgare (Boraginaceae). Mol. Ecol. Notes 3, 274–276. doi: 10.1046/j.1471-8286.2003.00421.x
Korneliussen, T. S., Albrechtsen, A., and Nielsen, R. (2014). ANGSD: analysis of next generation sequencing data. BMC Bioinform. 15:356. doi: 10.1186/s12859-014-0356-4
Kougioumoutzis, K., Valli, A. T., Georgopoulou, E., Simaiakis, S. M., Triantis, K. A., and Trigas, P. (2017). Network biogeography of a complex island system: the aegean achipelago revisited. J. Biogeogr. 44, 651–660. doi: 10.1111/jbi.12920
Kuhn, M., Wing, J., Weston, S., Williams, A., Keefer, C., Engelhardt, A., et al. (2016). Caret: classification and regression training. R package version 6.0–71. The R Journal. Available at: https://CRAN.R-project.org/package=caret (Accessed September 25, 2020).
Lakušić, D., Liber, Z., Nikolić, T., Surina, B., Kovačić, S., Bogdanović, S., et al. (2013). Molecular phylogeny of the Campanula pyramidalis species complex (Campanulaceae) inferred from chloroplast and nuclear non-coding sequences and its taxonomic implications. Taxon 62, 505–524. doi: 10.12705/623.1
Langmead, B., and Salzberg, S. L. (2012). Fast gapped-read alignment with bowtie 2. Nat. Methods 9, 357–359. doi: 10.1038/nmeth.1923
Lefort, F., and Douglas, G. C. (1999). An efficient micro-method of DNA isolation from mature leaves of four hardwood tree species Acer, Fraxinus, Prunus, and Quercus. Ann. For. Sci. 56, 259–263. doi: 10.1051/forest:19990308
Leroy, T., Louvet, J.-M., Lalanne, C., Le Provost, G., Labadie, K., Aury, J. M., et al. (2020). Adaptive introgression as a driver of local adaptation to climate in European white oaks. New Phytol. 226, 1171–1182. doi: 10.1111/nph.16095
Li, H. (2011). A statistical framework for SNP calling, mutation discovery, association mapping and population genetical parameter estimation from sequencing data. Bioinformatics 27, 2987–2993. doi: 10.1093/bioinformatics/btr509
Li, H., Handsaker, B., Wysoker, A., Fennell, T., Ruan, J., Homer, N., et al. (2009). The sequence alignment/map format and SAMtools. Bioinformatics 25, 2078–2079. doi: 10.1093/bioinformatics/btp352
Li, J.-W., Yeung, C. K. L., Tsai, P.-W., Lin, R. C., Yeh, C. F., Yao, C. T., et al. (2010). Rejecting strictly allopatric speciation on a continental island: prolonged post divergence gene flow between Taiwan (Leucodioptron taewanus, Passeriformes Timaliidae) and Chinese (L. canorum canorum) hwameis. Mol. Ecol. 19, 494–507. doi: 10.1111/j.1365-294X.2009.04494.x
Lloyd, A., and Bomblies, K. (2016). Meiosis in autopolyploid and allopolyploid Arabidopsis. Curr. Opin. Plant Biol. 30, 116–122. doi: 10.1016/j.pbi.2016.02.004
Luque, T. (1990). Karyological studies on Spanish Boraginaceae. V: Onosma L., Cerinthe L. and Alkanna Tausch (Lithospermeae). Bot. J. Linn. Soc. 102, 261–272. doi: 10.1111/j.1095-8339.1990.tb01880.x
Luque, T., and Valdes, B. (1984). Karyological studies on Spanish Boraginaceae: Lithospermum L. sensu lato. Bot. J. Linn. Soc. 88, 335–350. doi: 10.1111/j.1095-8339.1984.tb01580.x
Malik, S., Bhushan, S., Sharma, M., and Ahuja, P. S. (2016). Biotechnological approaches to the production of shikonins: a critical review with recent updates. Crit. Rev. Biotechnol. 36, 327–340. doi: 10.3109/07388551.2014.961003
McKenna, A., Hanna, M., Banks, E., Sivachenko, A., Cibulskis, K., Kernytsky, A., et al. (2010). The genome analysis toolkit: a MapReduce framework for analyzing next-generation DNA sequencing data. Genome Res. 20, 1297–1303. doi: 10.1101/gr.107524.110
Médail, F., and Diadema, K. (2009). Glacial refugia influence plant diversity patterns in the Mediterranean Basin. J. Biogeogr. 36, 1333–1345. doi: 10.1111/j.1365-2699.2008.02051.x
Meirmans, P. G. (2020). Genodive version 3.0: easy-to-use software for the analysis of genetic data of diploids and polyploids. Mol. Ecol. Resour. 20, 1126–1131. doi: 10.1111/1755-0998.13145
Meirmans, P. G., Liu, S., and van Tienderen, P. H. (2018). The analysis of polyploid genetic data. J. Hered. 109, 283–296. doi: 10.1093/jhered/esy006
Meirmans, P. G., and van Tienderen, P. H. (2013). The effects of inheritance in tetraploids on genetic diversity and population divergence. Heredity 110, 131–137. doi: 10.1038/hdy.2012.80
Moore, L. M., and Lauenroth, W. K. (2017). Differential effects of temperature and precipitation on early- vs. late-flowering species. Ecosphere 8:e01819. doi: 10.1002/ecs2.1819
Nielsen, R., Paul, J. S., Albrechtsen, A., and Song, Y. S. (2011). Genotype and SNP calling from next-generation sequencing data. Nat. Rev. Genet. 12, 443–451. doi: 10.1038/nrg2986
Nieto, F. G. (2014). Patterns and processes in plant phylogeography in the Mediterranean Basin. A review. Perspect. Plant Ecol. Evol. Syst. 16, 265–278. doi: 10.1016/j.ppees.2014.07.002
Nosil, P., Funk, D. J., and Ortiz-Barrientos, D. (2009). Divergent selection and heterogeneous genomic divergence. Mol. Ecol. 18, 375–402. doi: 10.1111/j.1365-294X.2008.03946.x
Otto, F., Oldiges, H., Göhde, W., and Jain, V. K. (1981). Flow cytometric measurement of nuclear DNA content variations as a potential in vivo mutagenicity test. Cytometry 37, 189–191. doi: 10.1002/cyto.990020311
Papadopulos, A. S. T., Kaye, M., Devaux, C., Hipperson, H., Lighten, J., Dunning, L. T., et al. (2014). Evaluation of genetic isolation within an island flora reveals unusually widespread local adaptation and supports sympatric speciation. Philos. Trans. R. Soc. B 369:20130342. doi: 10.1098/rstb.2013.0342
Papageorgiou, V. P., Assimopoulou, A. N., Couladouros, E. A., Hepworth, D., and Nicolaou, K. C. (1999). The chemistry and biology of alkannin, shikonin, and related naphthazarin natural products. Angew. Chem. Int. Ed. 38, 270–301. doi: 10.1002/(SICI)1521-3773(19990201)38:3<270::AID-ANIE270>3.0.CO;2-0
Paun, O., Turner, B., Trucchi, E., Munzinger, J., Chase, M. W., and Samuel, R. (2016). Processes driving the adaptive radiation of a tropical tree (Diospyros, Ebenaceae) in New Caledonia, a biodiversity hotspot. Syst. Biol. 65, 212–227. doi: 10.1093/sysbio/syv076
Perlès, C. (2016). “Early Holocene climatic fluctuations and human responses in Greece,” in Climate and Cultural Change in Prehistoric Europe and the Near East. eds. P. F. Biehl and O. Nieuwenhuise (New York: Suny Press), 169–194.
Petrova, A., and Vladimirov, V. (2009). Red list of Bulgarian vascular plants. Phytol. Balc. 15, 63–94.
Pluhár, Z., Bernáth, J., and Hermándy-Berencz, J. (2001). Introduction of alkanet (Alkanna tinctoria (L.) Tausch), a traditional dye plant into cultivation. Int. J. Horticult. Sci. 7, 41–46.
Poulakakis, N., Kapli, P., Lymberakis, P., Trichas, A., Vardinoyiannis, K., Sfenthourakis, S., et al. (2015). A review of phylogeographic analyses of animal taxa from the Aegean and surrounding regions. J. Zool. Syst. Evol. Res. 53, 18–32. doi: 10.1111/jzs.12071
Pritchard, J. K., Stephens, M., and Donnelly, P. (2000). Inference of population structure using multilocus genotype data. Genetics 155, 945–959. doi: 10.1093/genetics/155.2.945
Prunier, J. G., Colyn, M., Legendre, X., Nimon, K. F., and Flamand, M. C. (2015). Multicollinearity in spatial genetics: separating the wheat from the chaff using commonality analyses. Mol. Ecol. 24, 263–283. doi: 10.1111/mec.13029
R Core Team (2020). R: A Language and Environment for Statistical Computing. Vienna, Austria: R Foundation for Statistical Computing.
Raj, A., Stephens, M., and Pritchard, J. K. (2014). fastSTRUCTURE: variational inference of population structure in large SNP data sets. Genetics 197, 573–589. doi: 10.1534/genetics.114.164350
Rochette, N. C., and Catchen, J. M. (2017). Deriving genotypes from RAD-seq short-read data using stacks. Nat. Protoc. 12, 2640–2659. doi: 10.1038/nprot.2017.123
Semerdjieva, I., Petrova, G., Yankova-Tsvetkova, E., Doncheva, T., Kostova, N., Nikolova, R., et al. (2020). Genetic diversity, reproductive capacity and alkaloids content in three endemic Alkanna species. PLoS One 15:e0233516. doi: 10.1371/journal.pone.0233516
Sfenthourakis, S., and Triantis, K. A. (2017). The Aegean archipelago: a natural laboratory of evolution, ecology and civilisations. J. Biol. Res. 24:4. doi: 10.1186/s40709-017-0061-3
Španiel, S., Marhold, K., and Zozomová-Lihová, J. (2017). The polyploid Alyssum montanum-A. repens complex in the Balkans: a hotspot of species and genetic diversity. Plant Syst. Evol. 303, 1443–1446. doi: 10.1007/s00606-017-1470-3
Strid, A. (1996). Phytogeographia Aegaea and the flora Hellenica database. Annalen des Naturhistorischen Museums in Wien. Serie B für Botanik und Zoologie 98, 279–289.
Strid, A. (2016). Atlas of the Aegean Flora. “Part 1: Text and plates” & “part 2: Maps”. Englera 33. Berlin: Botanic Garden and Botanical Museum Berlin.
Toczydlowski, R. H., and Waller, D. M. (2019). Drift happens: molecular genetic diversity and differentiation among populations of jewelweed (Impatiens capensis Meerb.) reflect fragmentation of floodplain forests. Mol. Ecol. 28, 2459–2475. doi: 10.1111/mec.15072
Ulrych, L., and Szabóová, R. A. (2010). Alkanna tinctoria. Published by the state nature conservancy of the Slovak Republic. Available at: http://www.sopsr.sk/projekty/moznosti_cerpania_sf/brozura_Alkana_EN.pdf (Accessed October 12, 2020).
van de Peer, Y., Mizrachi, E., and Marchal, K. (2017). The evolutionary significance of polyploidy. Nat. Rev. Genet. 18, 411–424. doi: 10.1038/nrg.2017.26
Vekemans, X., and Hardy, O. J. (2004). New insights from fine-scale spatial genetic structure analyses in plant populations. Mol. Ecol. 13, 921–935. doi: 10.1046/j.1365-294X.2004.02076.x
Wagner, N. D., He, L., and Hörandl, E. (2020). Phylogenomic relationships and evolution of polyploid Salix species revealed by rad sequencing data. Front. Plant Sci. 11:1077. doi: 10.3389/fpls.2020.01077
Wang, I. J. (2013). Examining the full effects of landscape heterogeneity on spatial genetic variation: a multiple matrix regression approach for quantifying geographic and ecological isolation. Evolution 67, 3403–3411. doi: 10.1111/evo.12134
Wang, I. J., and Bradburd, G. S. (2014). Isolation by environment. Mol. Ecol. 23, 5649–5662. doi: 10.1111/mec.12938
Wang, N., Kelly, L. J., McAllister, H. A., Zohren, J., and Buggs, R. J. A. (2021). Resolving phylogeny and polyploid parentage using genus-wide genome-wide sequence data from birch trees. Mol. Phylogenet. Evol. 160:107126. doi: 10.1016/j.ympev.2021.107126
Warmuth, V. M., and Ellegren, H. (2019). Genotype-free estimation of allele frequencies reduces bias and improves demographic inference from RADSeq data. Mol. Ecol. Resour. 19, 586–596. doi: 10.1111/1755-0998.12990
Warnes, G. R., Bolker, B., Bonebakker, L., Gentleman, R., Huber, W., Liaw, A., et al. (2009). Gplots: Various R programming tools for plotting data. R package version 2:1.
Weigend, M., Selvi, F., Thomas, D. C., and Hilger, H. H. (2016). “Boraginaceae,” in Flowering Plants. Eudicots. eds. J. W. Kadereit and V. Bittrich (Cham: Springer International Publishing), 41–102.
Wickham, H. (2016). ggplot2: Elegant Graphics for Data Analysis. New York: Springer-Verlag. Available at: https://ggplot2.tidyverse.org (Accessed January 12, 2020).
Wolff, K., El-Akkad, S., and Abbott, R. J. (1997). Population substructure in Alkanna orientalis (Boraginaceae) in the Sinai Desert, in relation to its pollinator behaviour. Mol. Ecol. 6, 365–372. doi: 10.1046/j.1365-294X.1997.00201.x
Wood, T. E., Takebayashi, N., Barker, M. S., Mayrose, I., Greenspoon, P. B., and Rieseberg, L. H. (2009). The frequency of polyploid speciation in vascular plants. Proc. Natl. Acad. Sci. U. S. A. 106, 13875–13879. doi: 10.1073/pnas.0811575106
Yan, Y., Tan, F., Miao, H., Wang, H., and Cao, Y. (2019). Effect of shikonin against Candida albicans biofilms. Front. Microbiol. 10:1085. doi: 10.3389/fmicb.2019.01085
Záveská, E., Maylandt, C., Paun, O., Bertel, C., Frajman, B., Schönswetter, P., et al. (2019). Multiple auto- and allopolyploidisations marked the Pleistocene history of the widespread Eurasian steppe plant Astragalus onobrychis (Fabaceae). Mol. Phylogenet. Evol. 139:106572. doi: 10.1016/j.ympev.2019.106572
Zhai, S.-N., Comes, H. P., Nakamura, K., Yan, H.-F., and Qiu, Y.-X. (2012). Late Pleistocene lineage divergence among populations of Neolitsea sericea (Lauraceae) across a deep sea-barrier in the Ryukyu Islands. J. Biogeogr. 39, 1347–1360. doi: 10.1111/j.1365-2699.2012.02685.x
Zhang, S., Gao, Q., Li, W., Zhu, L., Shang, Q., Feng, S., et al. (2019). Shikonin inhibits cancer cell cycling by targeting Cdc25s. BMC Cancer 19:20. doi: 10.1186/s12885-018-5220-x
Zhang, X., Sun, Y., Landis, J. B., Zhang, J., Yang, L., Lin, N., et al. (2020). Genomic insights into adaptation to heterogeneous environments for the ancient relictual Circaeaster agrestis (Circaeasteraceae, Ranunculales). New Phytol. 228, 285–301. doi: 10.1111/nph.16669
Keywords: Alkanna, EBG, genetic variation, Greece, RAD-seq, polyploid
Citation: Ahmad M, Leroy T, Krigas N, Temsch EM, Weiss-Schneeweiss H, Lexer C, Sehr EM and Paun O (2021) Spatial and Ecological Drivers of Genetic Structure in Greek Populations of Alkanna tinctoria (Boraginaceae), a Polyploid Medicinal Herb. Front. Plant Sci. 12:706574. doi: 10.3389/fpls.2021.706574
Edited by:
Petr Koutecký, University of South Bohemia, CzechiaReviewed by:
Ivana Rešetnik, University of Zagreb, CroatiaEliska Zaveska, Academy of Sciences of the Czech Republic (ASCR), Czechia
Copyright © 2021 Ahmad, Leroy, Krigas, Temsch, Weiss-Schneeweiss, Lexer, Sehr and Paun. This is an open-access article distributed under the terms of the Creative Commons Attribution License (CC BY). The use, distribution or reproduction in other forums is permitted, provided the original author(s) and the copyright owner(s) are credited and that the original publication in this journal is cited, in accordance with accepted academic practice. No use, distribution or reproduction is permitted which does not comply with these terms.
*Correspondence: Eva Maria Sehr, eva-maria.sehr@ait.ac.at
†Deceased
‡These authors share last authorship