 Zhihui Xu1,2
 Xiaobo Shi2Mengmei Bao2Xiaoqian Song2
 Yuxia Zhang2Haiyan Wang2Hairong Xie2Fei Mao2
 Shuai Wang2Hongmei Jin3Suomeng Dong4Feng Zhang4
 Zhe Wu5
 Yufeng Wu2*
- 1College of Life Science, Nanjing Agricultural University, Nanjing, China
- 2State Key Laboratory for Crop Genetics and Germplasm Enhancement, Jiangsu Key Laboratory for Information Agriculture, Bioinformatics Center, Academy for Advanced Interdisciplinary Studies, Nanjing Agricultural University, Nanjing, China
- 3Institute of Agricultural Resources and Environment, Jiangsu Academy of Agricultural Sciences, Nanjing, China
- 4College of Plant Protection, Nanjing Agricultural University, Nanjing, China
- 5Department of Biology, SUSTech-PKU Institute of Plant and Food Science, Southern University of Science and Technology, Shenzhen, China
The remodeling of transcriptome, epigenome, proteome, and metabolome in hybrids plays an important role in heterosis. N(6)-methyladenosine (m6A) methylation is the most abundant type of post-transcriptional modification for mRNAs, but the pattern of inheritance from parents to hybrids and potential impact on heterosis are largely unknown. We constructed transcriptome-wide mRNA m6A methylation maps of Arabidopsis thaliana Col-0 and Landsberg erecta (Ler) and their reciprocal F1 hybrids. Generally, the transcriptome-wide pattern of m6A methylation tends to be conserved between accessions. Approximately 74% of m6A methylation peaks are consistent between the parents and hybrids, indicating that a majority of the m6A methylation is maintained after hybridization. We found a significant association between differential expression and differential m6A modification, and between non-additive expression and non-additive methylation on the same gene. The overall RNA m6A level between Col-0 and Ler is clearly different but tended to disappear at the allelic sites in the hybrids. Interestingly, many enriched biological functions of genes with differential m6A modification between parents and hybrids are also conserved, including many heterosis-related genes involved in biosynthetic processes of starch. Collectively, our study revealed the overall pattern of inheritance of mRNA m6A modifications from parents to hybrids and a potential new layer of regulatory mechanisms related to heterosis formation.
Significance Statement
The reprogramming and corresponding effect of mRNA m6A methylation on hybrids remain highly unknown. We demonstrated the pattern of conserved inheritance of m6A methylation from parents to hybrids and the potential impact on heterosis formation, uncovering mRNA m6A methylation as a new layer of regulatory mechanisms in the formation of hybrid vigor.
Introduction
Heterosis refers to the increased performance of hybrid offspring relative to their parents in many traits, such as growth rate and biomass (Birchler et al., 2003, 2010; Hochholdinger and Hoecker, 2007; Chen, 2010; Birchler, 2015). Both genetic and epigenetic mechanisms are thought to be involved in heterosis (Chen, 2013). Epigenetic changes have been found to impact hybrid vigor (Cubas et al., 1999; Manning et al., 2006; Shindo et al., 2006; Ni et al., 2009; He et al., 2010). DNA methylation level is altered by trans-chromosomal methylation (TCM) and trans-chromosomal demethylation (TCdM) (Greaves et al., 2014), which changes the overall DNA methylation level in the F1 hybrids, especially in regions that are differentially methylated in two parents (Shen et al., 2012). Histone modification patterns in hybrids of rice or maize have shown correlations between altered gene expression and changes in histone marks compared with the parents (He et al., 2010, 2013; Lv et al., 2019). In Arabidopsis hybrids, global histone modifications of the parents are largely transmitted to the F1 generation (Moghaddam et al., 2011; Dong et al., 2012; Yang et al., 2016). DNA methylation and histone modifications are altered at many loci, such as circadian clock associated1 (CCA1) and late elongated hypocotyl (LHY), which are associated with growth vigor in Arabidopsis F1 hybrids (Ni et al., 2009; Shen et al., 2012).
Recently, chemical modifications of mRNAs, such as N(6)-methyladenosine (m6A), N(1)-methyladenosine (m1A), and 5-methylcytosine (m5C), have emerged as an additional level of transcript regulation (Dominissini et al., 2012, 2016; Meyer et al., 2012; Li et al., 2016, 2017). m6A methylation is the most abundant type of modification for mRNAs, occurring in more than one-third of mammalian transcripts and half of the plant transcripts (Dominissini et al., 2012; Meyer et al., 2012; Li et al., 2014; Luo et al., 2014; Luo et al., 2020; Wan et al., 2015; Zhou et al., 2019; Miao et al., 2020). The m6A modification is reversible and dynamic, with m6A demethylase acting as an eraser and methyltransferase acting as a writer (Jia et al., 2011; Meyer and Jaffrey, 2017). Recognition of these dynamic m6A modifications by YTH domain-containing proteins leads to a broad range of functions associated with the change in mRNA stability, cap-independent translation, splicing, translation efficiency, and mRNA structure (Dominissini et al., 2012; Meyer et al., 2015; Meyer and Jaffrey, 2017), but the location of m6A in mRNA determines different functions (Gilbert et al., 2016). In the 5' UTR, m6A participates in mRNA cap-independent translation by directly binding to eukaryotic initiation factor 3 (eIF3) and then recruiting the 40S ribosomal subunit to initiate translation (Meyer et al., 2015). On the other hand, m6A in the 3' UTR has been reported to have several functions, such as promoting translation by binding with METTL3 and eIF3h to facilitate formation of the translation loop (Choe et al., 2018), regulating mRNA lifetime by binding with YTHDF2, which relocates transcripts to the P-body (Wang et al., 2014), and changing mRNA structure to affect RNA-protein interactions (Liu et al., 2015).
In Arabidopsis thaliana, m6A is essential in embryo development (Zhong et al., 2008). Further research revealed that m6A is also essential in post-embryonic development (Bodi et al., 2012), for example, for normal trichome morphology and correct timing of leaf formation (Arribas-Hernandez et al., 2018; Scutenaire et al., 2018; Wei et al., 2018), partly because it regulates the expression of key shoot meristem genes to control shoot apical meristem (SAM) proliferation (Shen et al., 2016). Transcriptome-wide mapping of m6A in Arabidopsis wild-type (WT) and related mutants indicated a complex relationship between m6A modifications and gene expression. Lack of FKBP12 interacting protein 37 (FIP37), a component of the methyltransferase complex in Arabidopsis, results in a dramatically reduced abundance of m6A, as most transcripts bearing m6A in WT are decreased in the mutant (Shen et al., 2016). In addition, further study showed that m6A inhibits mRNA degradation through inhibition of site-specific cleavage (Anderson et al., 2018). Nevertheless, it was reported that the highly expressed transcripts had fewer m6A modifications, as revealed by transcriptome-wide m6A patterns in Arabidopsis (Wan et al., 2015). Although m6A abundance varies among Arabidopsis accessions and affects transcript abundance, how m6A changes in F1 hybrids relative to their parents and its potential role in determining F1 hybrid vigor have not been clarified.
In this study, we selected two Arabidopsis ecotypes, namely, Col-0 and Landsberg erecta (Ler), and their F1 reciprocal hybrids, to investigate the potential effect of m6A on heterosis. We identified the distribution pattern and the intensity change in m6A in Col-0, Ler, and their F1 reciprocal hybrids. We showed that the peaks and distribution features of m6A methylation are highly conserved between accessions. Although changes in m6A intensity and transcript abundance within accessions are weakly positively correlated, upregulation of m6A between accessions tends to be associated with a downregulated abundance of mRNA and vice versa. We found that the overall m6A difference between the parents is attenuated at allelic sites in the hybrids, and that there is a negative correlation between the expression and corresponding m6A intensity of allelic genes. Interestingly, even though hundreds of m6A peaks are changed between the parents and hybrids, many biological functions of the corresponding genes are consistently affected, including the biosynthetic processes of starch, which have been reported to be associated with growth vigor. The data, therefore, suggest the overall pattern of mRNA m6A remodeling in hybrids, which may contribute to heterosis formation.
Results
Transcriptome-Wide Profile of m6A Methylation Among Col-0, Ler, and Their F1 Reciprocal Hybrids
To explore RNA m6A abundance variation between the two ecotypes and its alteration in hybrids, we first analyzed transcriptome-wide m6A profiles among Col-0, Ler, and their F1 reciprocal hybrids (Supplementary Figure 1A) by applying N6-methyladenosine sequencing (m6A-seq) with two biological replicates. Sequencing data of RNA input and immunoprecipitation (RIP) are highly correlated between replicates, indicating the high quality of m6A-seq in this study (Supplementary Figures 1B,C). We found that the normalized reads from m6A-RIP of all samples are enriched in the 3' UTR of the transcripts (Figure 1A), which is similar to the results of previous research (Luo et al., 2014; Wan et al., 2015). The normalized read depth in Ler is significantly lower than that of the other three samples, suggesting that the overall m6A abundance of Ler was lower (Figure 1A). To exclude the possible bias introduced by the reference genome, we performed exact analysis using the Ler reference genome rather than Col-0 and still obtained identical results (Supplementary Figure 2). Interestingly, we did not find low m6A abundance in the 3' UTR of the two hybrids, similar to Ler.
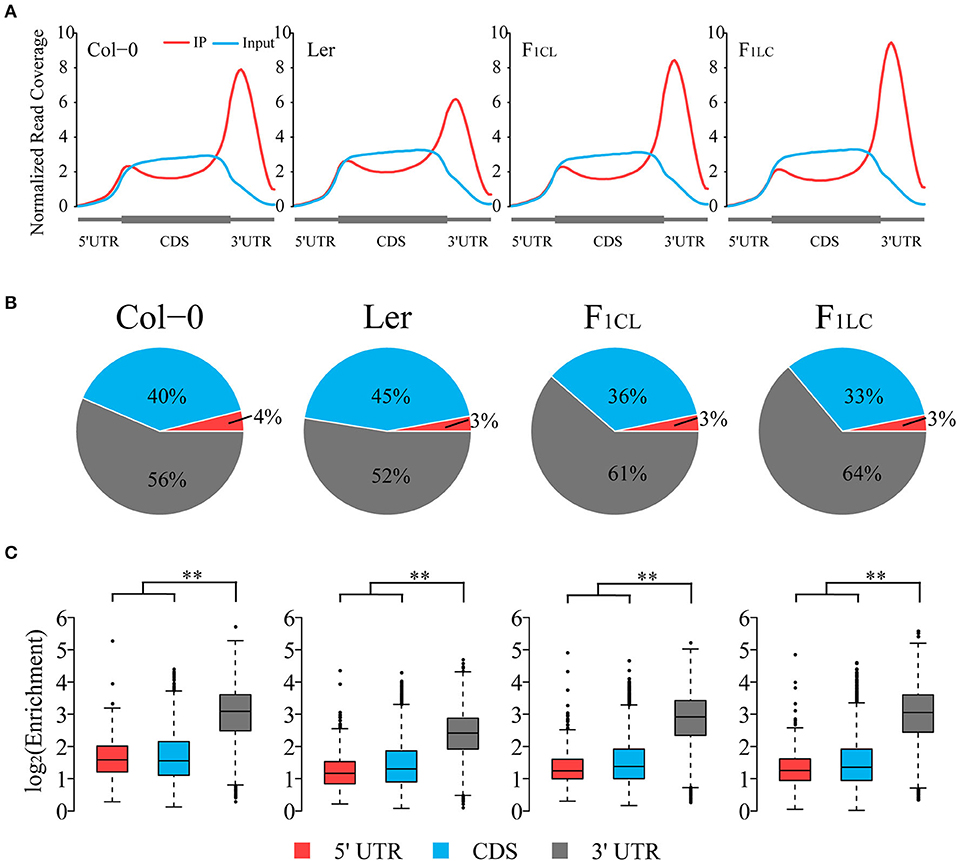
Figure 1. Global pattern of m6A peaks in Col-0, Ler, and their F1 reciprocal hybrids. (A) Coverage of normalized reads along transcripts. Each transcript is divided into three non-overlapping features: 5' UTR, CDS, and 3' UTR. (B) Distribution of m6A peaks in transcript features of parents and hybrids. (C) Relative enrichment of m6A peaks of each transcript feature. Enrichment = Normalized m6A-seq reads divided by normalized input reads of each peak. **p < 2.2e−16, Wilcoxon rank-sum test.
To further study global patterns of m6A in Col-0, Ler and their hybrids, we identified m6A peaks using a transcriptomic peak caller, METPeak (Cui et al., 2016). A total of 13,145, 13,562, 12,956, and 12,542 peaks are detected in Col-0, Ler, F1CL, and F1LC, respectively (Supplementary Table 1); and these peaks were located in ~9,778, 9,920, 10,066, and 10,017 protein-coding genes, respectively. The majority of these genes have one or two m6A sites (Supplementary Figure 3A), which is consistent with a previous report (Wan et al., 2015). In agreement with the distribution of m6A-seq reads, the majority of the m6A peaks are enriched in the 3' UTR and CDS region, while only 3–4% of the m6A peaks are located in the 5' UTR (Figure 1B). The enrichment degree of peaks in the 3' UTR is significantly higher (Wilcoxon rank sum test, p < 2.2e−16) than that of peaks in the 5' UTR and CDS among the four samples (Figure 1C). As expected, we also found that the enrichment of the m6A peaks in Ler is significantly lower than that in the other groups (Wilcoxon rank sum test, p < 2.2e−16, Supplementary Figure 3B).
To further analyze the feature of the distribution of m6A peaks, we counted the number of peaks around the start codon segment and the stop codon segment (200 nt centered on the start codon and stop codon, respectively), and found that ~40% of the peaks are located in these two regions (Supplementary Figure 3C). The number of peaks in the start codon is relatively low in all four samples. However, there are more than 4,000 m6A peaks located in the stop codon segment (Supplementary Figure 3C), which is consistent with previous findings in mammals and plants showing that m6A peaks are preferentially located around stop codons (Dominissini et al., 2012; Luo et al., 2014; Wan et al., 2015).
Variations of m6A Modification Among the Parental Lines and Hybrids
Previous research has shown that m6A is highly conserved between two accessions of Arabidopsis, namely, Can-0 and Hen-16 (Luo et al., 2014). We found that 10,584 m6A peaks (80.5% of Col-0, 78% of Ler; Figure 2A) are common between Col-0 and Ler, and that these peaks are located in 8,302 expressed transcripts (49.4% of the total). In addition, we found that the majority of the m6A peaks are common among the parental lines and F1 hybrids. There are 9,641 (74.4% of F1CL) and 9,331 (74.4% of F1LC) m6A peaks that are common between the parents and the F1 hybrids, respectively (Figure 2B). These peaks are also located in 7,844 and 7,723 of the expressed transcripts in F1CL and F1LC, respectively (Supplementary Figure 3E). The common peaks (11,000) between F1CL and F1LC account for 85.6–88.5% of the total peaks in F1 hybrids (Figure 2A), which is slightly higher than that in the two parents. Collectively, these data indicate a more general conservation pattern of RNA m6A modification among accessions and hybrids of Arabidopsis.
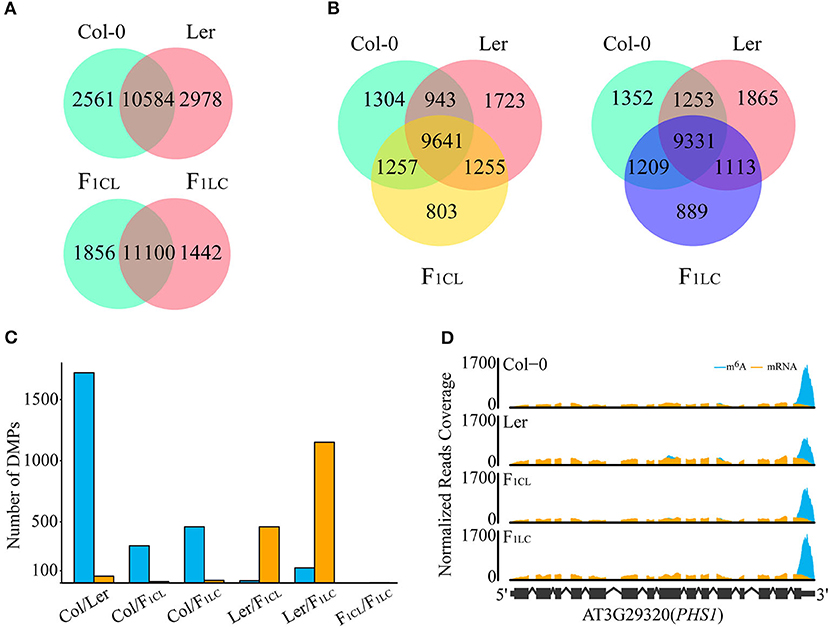
Figure 2. Differences in m6A modifications among Col-0, Ler, and their F1 reciprocal hybrids. (A,B) Number of shared m6A peaks between accessions. (C) Number of DMPs in each comparison. Blue bars, DMPs showing upregulated m6A intensity in the former comparison. Orange bars, DMPs showing upregulated m6A intensity in the latter. (D) Diagram for differentially methylated peaks. m6A, normalized IP reads; mRNA, normalized input reads.
Considering the obvious difference in m6A levels between Col-0 and Ler, it is necessary to determine whether common m6A peaks between any two samples are significant differentially methylated peaks (DMPs). We established two criteria for DMPs: (1) passed Fisher's exact test after multiple comparison corrections (FDR < 0.05); (2) the difference in peak enrichment between any two samples was larger than a 1.5-fold change. Eventually, we identified 1,776 DMPs (16.8% of the common peaks) between the parents, among which the intensity of 1,721 (16.3%) peaks, as expected, is higher in Col-0 (Figures 2C,D, Supplementary Table 2). For the comparison between F1 reciprocal hybrids, we found only 2 DMPs (0.02%), suggesting that paternal or maternal effects on the level of m6A modifications are weak in Arabidopsis (Figure 2C). For the m6A peaks shared between the parents and F1CL or between the parents and F1LC, we identified 315, 479, 477, and 1,273 DMPs, respectively (Figure 2C). Taken together, the intensity of common m6A peaks tends to be conserved between accessions or during inheritance from parents to hybrids.
Relationship Between Transcript Abundance and m6A Modification Level
Multiple recent studies have indicated complex functions of m6A in transcription regulation with the ability to stabilize (Luo et al., 2014; Anderson et al., 2018) or destabilize mRNAs in Arabidopsis (Wan et al., 2015). We analyzed the relationships of transcript abundance and the corresponding m6A levels. We found a weak positive correlation between the expression abundance and intensity of m6A modification on one gene within each accession (Figure 3A). Overall, the genes with m6A modification show significantly higher expression than non-m6A-containing genes (Figure 3B). In addition, more than 60% of the expressed genes are associated with at least one m6A peak (Supplementary Figure 3A, Supplementary Table 1).
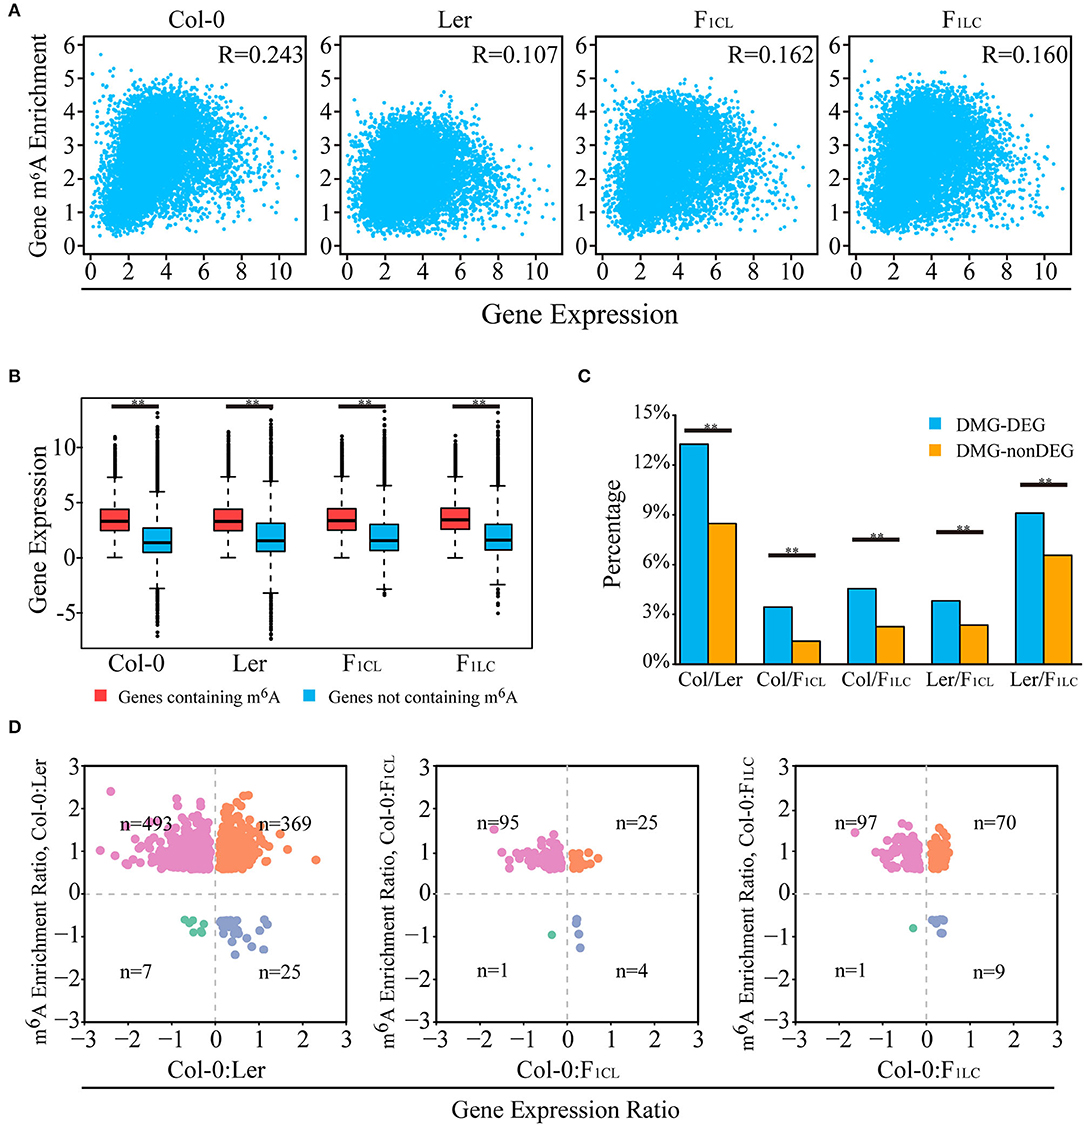
Figure 3. Relationship between m6A methylation level and transcript abundance. (A) Scatter plot showing the correlation of m6A modification and transcript abundance. R indicates Pearson correlation coefficient. (B) Transcripts with m6A peaks showing higher abundance levels. (C) Percentage of DEGs (differentially expressed genes) overlapping with DMGs (genes with differentially m6A-methylated peaks), indicated as DMG-DEGs, and percentage of non-DEGs associated with DMGs, indicated as DMG-nonDEGs. **p < 1e−6, Wilcoxon rank-sum test. (D) Scatter plot of DMG-DEGs between accessions showing the relationship of m6A modification and transcript abundance. For example, the m6A enrichment ratio of Col-0: Ler is calculated as log2 (enrichment of Col-0/enrichment of Ler) of m6A peaks. The gene expression ratio of Col-0: Ler is calculated as log2 (FPKM of Col-0/FPKM of Ler) of transcripts. n indicates number of DMG-DEGs in each quadrant. For (A–D), gene m6A enrichment is calculated by normalized m6A-seq reads number divided by normalized input reads of peaks within the transcript, and gene expression is indicated by the FPKM of the input RNA-seq data.
Next, we investigated the relationship between changes in m6A methylation and transcript abundance in the parent lines and their F1 reciprocal hybrids. We first identified differentially expressed genes (DEGs) between the lines (Supplementary Figures 4A,B) and checked the overlap between DEGs and DMPs. We found that the proportion of DEGs associated with DMPs is significantly higher than that of non-DEGs (Figure 3C). Even so, only 3.29–13.26% of the DEGs are associated with DMPs between the parent lines and hybrids (Figure 3C). Taken together, these results indicated that changes in m6A intensity on transcripts tend to be associated with changes in abundance, and that most DEGs are not directly associated with m6A changes in Arabidopsis.
We then focused on genes with significant changes in both expression and m6A modification between accessions. Most DMPs showed upregulated m6A intensity in Col-0 between Col-0/Ler (comparison between Col-0 and Ler), as well as between Col-0/F1CL and between Col-0/F1LC (Figure 3D). A total of 862 DEGs between Col-0/Ler are associated with DMPs upregulated in Col-0, among which there are significantly more downregulated expressed genes than upregulated genes in Col-0 (Figure 3D, p = 2.41e−5, chi-square test). A similar pattern is also found in Col-0/F1CL (p = 1.7e−10) and Col-0/F1LC (p = 0.037, Figure 3D). There are more DMPs showing downregulated m6A intensity in Ler between Ler/F1CL and between Ler/F1LC, and these DMPs are also associated with more genes with upregulated expression in Ler (Supplementary Figure 4C, p = 1.19e−12 for Ler/F1CL; p = 2.38e−20 for Ler/F1LC). This result indicates that downregulated DMPs tend to be associated with more upregulated DEGs and vice versa between accessions of Arabidopsis, implying that the complexity of m6A function affects the transcript abundanceof genes.
Relationship Between Non-additive Expression and Non-additive m6A Modification
We identified 2,758 and 4,123 genes showing non-additive expression in F1CL and F1LC, respectively. Similar to gene expression, the inheritance of m6A modifications in hybrids can be additive or non-additive. We defined m6A peaks with a significant change between enrichment value in hybrid and the average enrichment value of parents (MPV) (FDR < 0.05, see methods for detail) as non-additive m6A modified peaks. The majority (95.6 and 95.2%) of the m6A peaks show additive patterns in both hybrids, while only 538 and 563 peaks in F1CL and F1LC, respectively, are non-additive (Supplementary Table 3). Moreover, non-additive m6A peaks are significantly associated with non-additively expressed genes in both hybrids (Supplementary Table 3, p < 2.2e−16 for both F1CL and F1LC, chi-square test). We still observed that only 6.53–6.82% of non-additively expressed genes show a non-additive pattern of m6A modification, indicating that m6A may play a role in the regulation of non-additive gene expression in Arabidopsis hybrids.
Relationship Between Allelic Gene Expression and Allelic m6A Methylation in F1 Hybrids
To analyze the allelic bias in gene expression and m6A modifications in hybrids, we identified single-nucleotide polymorphisms (SNPs) between Col-0 and Ler with stringent criteria (see methods) and used these SNPs to determine the reads of RNA-seq or m6A-seq generated from the allele of Col-0 or Ler. A total of 76,983 SNPs with high confidence are identified. These SNPs associate with 8,972 and 8,991 genes and with 2,509 and 2,325 m6A peaks in F1CL and F1LC, respectively, which are used in the following analysis. As expected, we still observed significantly higher m6A modification in Col-0 than in Ler on these SNPs (Figure 4A). Nevertheless, this bias tends to disappear between the two parental alleles in the hybrids. The log-transformed mean value of the m6A ratio between the two allelic SNPs is close to zero, and the majority of the ratio (94.1% for F1CL and 93.6% for F1LC) falls within the interval (−1, 1) in both hybrids (Figure 4A), indicating that the overall m6A difference between the parents is attenuated at allelic sites in the hybrids. The pattern of attenuation is not observed for the expression of allelic genes (Figure 4B). We have identified only four and seven peaks showing significant allele-specific RNA m6A methylation (FDR < 0.05, see Methods) in the hybrids, implying extremely rare allele bias of RNA m6A methylation after the combination of the two parental genomes. Despite the smaller difference in m6A abundance between the alleles, the correlation between the allelic abundance of mRNA and the corresponding allelic intensity of m6A methylation is negative (Figure 4C). This result is consistent with the relationship between DEGs and DMPs.
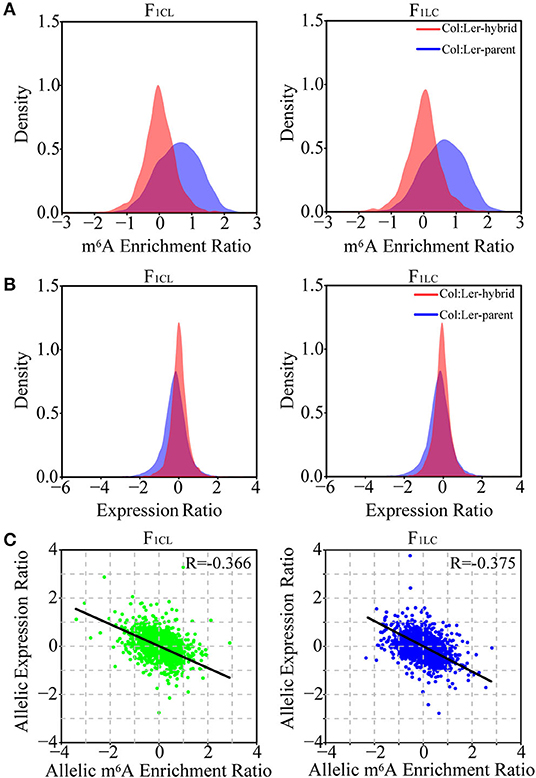
Figure 4. Relationship between allelic gene expression and allelic m6A methylation in F1 hybrids. Density distribution of the (A) m6A enrichment ratio and (B) gene expression ratio between allelic sites of Col-0 and Ler (marked as Col: Ler-parent) and the ratio between allelic sites inherited from Col-0 and Ler in the hybrids (Col: Ler-hybrid). (C) Scatter plot showing the correlation between allele-specific expression and allele-specific m6A methylation in the hybrids. Only the reads of m6A-seq or RNA-seq mapped to the SNPs between Col-0 and Ler with high confidence are used in the analysis.
Biological Function of Genes Associated With Significant Changes in m6A
F1 hybrids crossed by ecotypes of Arabidopsis, as well as Col-0 × Ler (Groszmann et al., 2014), showed clear growth vigor (Supplementary Figure 1), but the relationship between heterosis and changes in m6A abundance between the parent lines and hybrids was unknown. We first focused on the function of genes showing significantly differential m6A methylation (Supplementary Table 4), which were referred to as differentially m6A-modified genes (DMGs). We identified 462 enriched GO terms of DMGs between Col-0 and Ler, among which 160–294 (34–63%) are also identified as enriched GO terms of DMGs generated from the comparisons between the parents and hybrids (Supplementary Table 5). Interestingly, the enriched GO terms of DMGs between the parents and hybrids tend to be consistent. For instance, we found 319 enriched GO terms of DMGs between Col-0/F1CL, among which 231–267 (72–84%) are also identified in the Col-0/F1LC, Ler/F1CL, and Ler/F1LC comparisons. These data implied that there is clear heterogeneity of biological functions affected by differential m6A modification between Col/Ler (between-parent difference) and between parent/hybrid (parent-hybrid difference). We kept the enriched GO terms of DMGs from the parent-hybrid comparison but not from the between-parent comparison and found a clear trend of enriched biological functions, such as biosynthetic and metabolic processes of multiple carbohydrates, secondary metabolic processes, and development of shoot, root hair, and so on (Figure 5A, Supplementary Table 4), among which starch biosynthetic process was reported to be involved in heterosis (Chen, 2013).
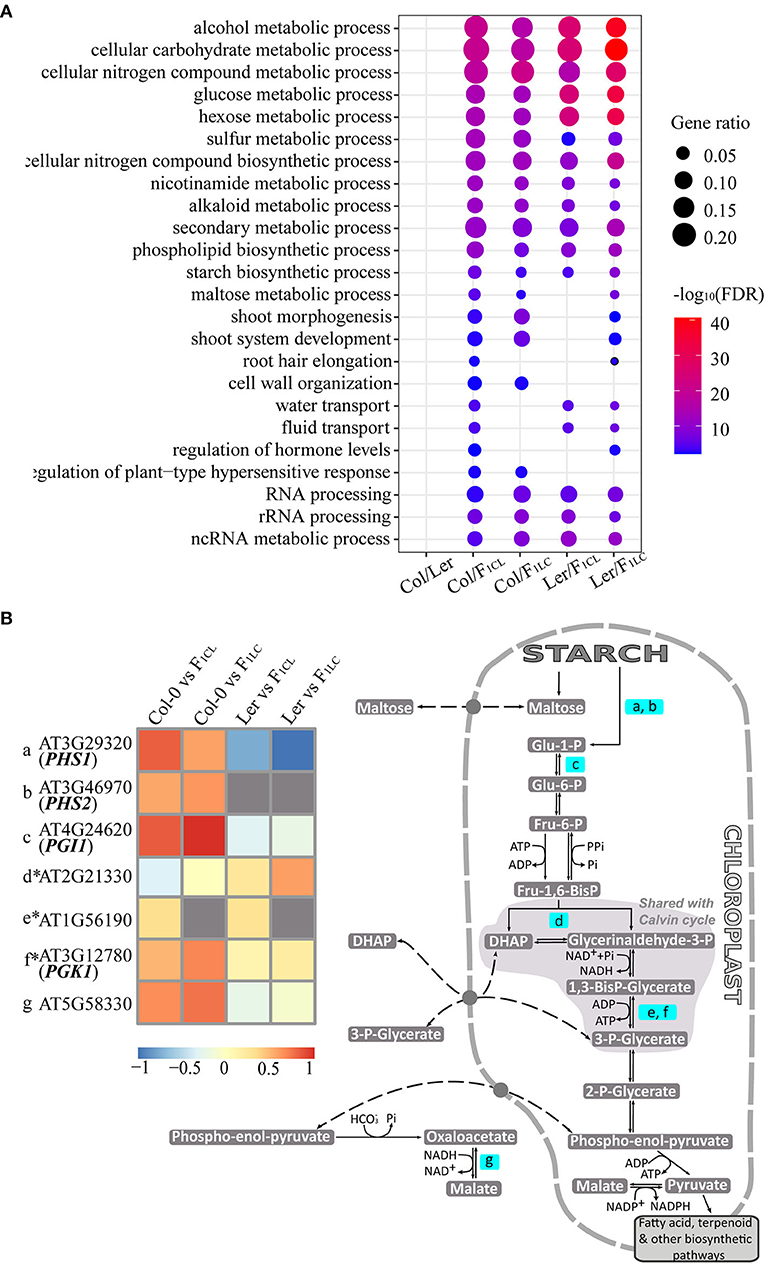
Figure 5. Enriched biological functions of differentially m6A-methylated genes. (A) GO terms of genes associated with DMPs that are enriched only in comparisons of parents/hybrids, e.g., m6A-methylated peaks showing significant differences between Col-0 and F1CL. Only some enriched GO terms are shown in the figure, and all GO terms are listed in Supplementary Table 4. (B) A diagram for genes with DMPs involved in starch biosynthetic process related to biomass in Arabidopsis. The pathway is modified based on the Mapman database. Only genes in the pathway with DMPs are highlighted, of which m6A methylation differences between parents/hybrids are shown in the heatmap. *indicates the genes showing non-additive m6A methylation in the hybrids simultaneously.
Hybrid vigor has been found to be related to changes in transcription, epigenetic modifications, and protein abundance (Chen, 2013). Considering that m6A is involved in multiple biological processes related to RNA fate at the post-transcriptional level, it is worthwhile to focus on the function of genes showing differential m6A modification without changes in gene expression. We found that the enriched GO terms of DMGs and not DEGs between parents/hybrids are associated with membrane- or chloroplast-located proteins, transport, or the proteasome complex (Supplementary Figure 5A). This pattern is clearly different from the enriched GO terms of the DEGs but not DMGs between parent/hybrid, which are associated with stress response genes, mitochondria-located genes, etc (Supplementary Figure 5B). These data implied that m6A modification could be involved in the formation of F1 hybrid vigor through post-transcriptional regulation of mRNA without changing the abundance.
Several genes involved in starch and carbohydrate metabolism promote growth and biomass vigor in Arabidopsis (Chen, 2013), so we focused on the DMGs involved in the starch biosynthetic process (Figure 5B). There are 51 DMGs from all four parent/hybrid comparisons annotated as genes of the starch biosynthetic process (GO: 0019252). We checked the published biological functions against the TAIR database one by one and found 20 genes associated with the biomass and growth rate of Arabidopsis (Supplementary Table 6). We visualized seven genes of 51 DMGs that are annotated as starch metabolism genes through Mapman (Thimm et al., 2004). Interestingly, six genes are located in chloroplasts and involved in the same pathway, and four of them control biomass and growth rate in Arabidopsis based on published results (Figure 5B). Collectively, these data indicated the strong association between changes in m6A methylation and the growth vigor of F1 hybrids.
Discussion
Multiple transcriptome-wide maps revealed highly conserved patterns of m6A methylation among Arabidopsis accessions (Can-0 and Hen-16) or organs (leaf, root, and flower) (Luo et al., 2014; Wan et al., 2015). More than 70% of m6A peaks are shared between Arabidopsis Can-0 and Hen-16 (Luo et al., 2014), similar to the percentage (78%) of peaks shared between Col-0 and Ler in this study. We also found that ~74% of m6A peaks are shared between the parents and hybrids. In addition, our results indicated that m6A modifications in hybrids are enriched around the 3' UTR, stop and start codons of transcripts, showing consistent features across accessions and organs (Luo et al., 2014; Wan et al., 2015). Moreover, RNA m6A methylation peaks are also conserved between two inbred lines (B73 and Mo17) of maize (Luo et al., 2020) and two tissues of rice (Li et al., 2014). In summary, these results implied a more general conservation pattern of m6A methylation in plants, which could be related to the fundamental role of m6A methylation in plant development (Zhong et al., 2008; Shen et al., 2016; Anderson et al., 2018). Nevertheless, a recently published study showed that there are much more genes with differentially m6A level or non-additively m6A variation in maize hybrid (B73 × Mo17) compared with the parents (Luo et al., 2021), implying that the pattern of m6A reprogramming in hybrid is related to species or parent lines with different degree of variation.
The effects of m6A modification on gene expression vary among genes. In an Arabidopsis demethylase ALKBH10B loss-of-function mutant, mRNAs of flower development genes, such as FT, SPL3, and SPL9 show increased m6A modification but reduced stability (Duan et al., 2017). Nevertheless, lack of m6A modifications on the mRNA of the WUS and STM genes enhances their stability in the FIP37 mutant line of Arabidopsis (Shen et al., 2016). Additional studies have indicated the biological functions of stabilizing or destabilizing mRNAs in Arabidopsis (Luo et al., 2014; Wan et al., 2015; Anderson et al., 2018). The data also indicated the conflicting functions of m6A in regulating gene expression. Overall, we observed a very weak positive correlation between the abundance of mRNA and the intensity of m6A modification within each of the accessions. However, we also found that mRNAs with significantly decreased methylation of m6A tend to show upregulated expression between accessions or between parents and hybrids. The complex regulatory roles of m6A in transcript abundance might be correlated with its location (Luo et al., 2014), differences between readers (Wei et al., 2018), or the RNA structure dependent on m6A (Liu et al., 2015).
The molecular mechanism of heterosis is quite complex; and omics methods, ranging from transcriptomics to metabolomics, have provided novel insights into the mechanism (Chen, 2013). Changes in epigenetic modifications, such as histone methylation in hybrids, could promote growth by altering gene expression (Ni et al., 2009). As a newly identified reversible modification of RNA, the reprogramming of m6A in hybrids and the corresponding functions related to heterosis remain largely elusive. The data indicated that most of the differentially expressed genes are not associated with differential m6A methylation, and that only a few hundred m6A peaks are significantly changed between parents and hybrids. However, these peaks are associated with many biological functions, of which 20 of 51 starch- and carbohydrate-related genes are confirmed as being associated with biomass vigor in Arabidopsis (Supplementary Table 6). We did not identify the genes showing differential m6A methylation involved in the circadian rhythm regulatory network, for instance, LHY, GI, CCA1, and TOC1, which are also related to biomass vigor in hybrids crossed by two accessions, namely, Col-0 and C24 (Chen, 2013). We propose two possible reasons. One could be that the different molecular bases of heterosis between F1 hybrids are crossed by different ecotypes. The hybrids of C24 × Col and Col × Ler showed differences in growth vigor at various time points of vegetative development (Groszmann et al., 2014). Another reason could be that circadian rhythm-related genes tend to promote growth through the regulation of transcription. We found that some circadian genes, such as GI and TOC1, are differentially expressed between the parents and hybrids, while a considerable number of the 20 genes involved in the starch biosynthetic process showed only differential m6A methylation rather than differential expression (Supplementary Table 7). Since m6A controls RNA fate-related processes, such as mRNA stability, transport, or translation (Dominissini et al., 2012; Meyer et al., 2015; Meyer and Jaffrey, 2017), this study indicates a new layer of regulatory mechanisms contributing to heterosis at the post-transcriptional level in Arabidopsis.
Experimental Procedures
Plant Materials and Growth Conditions
Plant materials included two Arabidopsis accessions (Col-0, Ler) and their F1 reciprocal hybrids. F1 seeds were produced by hand pollination between Col-0 and Ler. Seeds were sown on soil, stratified at 4°C for 3 days to synchronize germination. Plants were then shifted into greenhouse and grown under a long-day condition (16 h in light and 8 h in dark) at 22°C for 21 days. Above-ground tissues were harvested and stored at −80°C for the following experiments.
MeRIP Libraries Construction and Sequencing
MeRIP libraries preparation mainly followed a published procedure (Dominissini et al., 2013). Briefly, total RNA was extracted from leaves in 50 mL conicals using TRIzol (15596018, Ambion, Austin, TX, United States). Poly(A) RNA was enriched (MRN10, Sigma-Aldrich, Saint Louis, MO, United States) and fragmented into ~100 nt by fragmentation reagent (AM8740, Invitrogen, Carlsbad, CA, United States) for 15 min at 70°C. Few microliters of fragmented RNA was saved as input control, and the left was incubated with m6A antibody (202003, Synaptic Systems, Goettingen, Germany), in 1x IP buffer supplemented with RNasin Plus (N2611, Promega, Madison, WI, United States) for 4 h at 4°C. The antibody-bound RNA was then incubated with pre-blocked protein A beads (10001D, Invitrogen, Carlsbad, CA, United States) at 4°C for 2 h. The immunoprecipitated RNA was released using an elution buffer (1x IP buffer supplemented with 6.7 mM N6-methyladenosine, M2780, Sigma-Aldrich, Saint Louis, MO, United States). Input and IP libraries were constructed using NEBNext Ultra RNA Library Prep Kit for Illumina (E7645S, NEB, Ipswich, MA, United States) and subjected to sequencing on the Illumina Hiseq X-10 platform.
Reads Pre-processing and Alignment
Raw reads of input and IP samples were processed by trim-galore (version 0.4.1) to remove adaptors and low quality reads and then mapped to the Arabidopsis Col-0 reference genome (TAIR 10) using Tophat2 (version 2.1.1) (Kim et al., 2013) with Araport11 annotation in the analyses for parental lines and hybrid lines. We also used Ler reference genome and corresponding annotation (downloaded from NCBI, accession number GCA_001651475.1) to check for possible bias introduced by the reference genome. The parameters were modified (–read-edit-dist 5, –N 5) to obtain more SNP information of Ler and F1 hybrids. Multiple mapped reads were filtered using the SAMtools package (version 1.9) (Li et al., 2009). Only paired unique reads were used for downstream analysis.
N(6)-Methyladenosine Peak Identification and Annotation
MeTPeak (Cui et al., 2016), a transcriptomic peak caller, was used to identify m6A peaks. In order to get confidence peaks, we maintained peaks on genes with FPKM ≥ 1. Moreover, to avoid huge differences in the calculation of peak enrichment due to insufficient coverage, we performed a random sampling of genomic regions and calculated reads of all input samples, and high confidence peaks were selected if the peak region satisfied Input FPKM ≥ 5.
To define m6A peak summits, two repeats of input and IP sample were merged, and the coverage of each base of peaks was counted by in-house script (Supplementary Scripts 1–3). The residual was calculated by IP reads subtracted by input reads, and the point with the largest residual was referred to as peak summit. The peak summits were intersected with protein-coding gene sequences, which were integrated into a tiered order−3′UTR, 5′ UTR, and CDS, to determine their locations (Supplementary Script 4). Additionally, m6A peaks were assigned to start codon and stop codon segments, which was 200 nt centered to start codon and stop codon, respectively, to identify the preference of m6A peaks.
Identification of Differentially Methylated Peaks and Additive/Non-Additive Methylated Peaks
The common m6A peaks between any two samples were defined according to whether they intersected with each other. We calculated read counts of IP and input replicates for each m6A peak of every comparison group (Supplementary Script 5). A 2 × 2 contingency table was filled by IP and input normalized reads of samples, respectively. A Fisher's exact test was performed to identify m6A differentially methylated peaks, and p-value was adjusted by Bonferroni–Holm correction using R scripts. The differentially methylated peaks should satisfy two requirements: (1) padj <0.05; (2) the difference between any two samples >1.5.
To classify non-additive and additive methylated peaks, Fisher's exact test was performed by comparing the input and IP normalized reads of hybrid and the average of parents' input and IP normalized reads. Only common peaks with padj <0.05 were considered as non-additive methylated peaks. Otherwise, they were referred to as additively methylated peaks.
Identification of Differentially Expressed Genes and Additive/Non-Additive Expressed Genes
The number of reads for each gene was counted using HTSeq (Anders et al., 2015) with a default setting. R package DESeq2 (version 1.22.2) was used for analyzing differentially expressed genes, and only genes with padj <0.05 were considered as DEGs. If the expression of genes in hybrids was significantly different from mid-parent value (padj <0.05), these genes were classified as non-additive expressed genes, and the others were referred to as additive expressed genes.
Gene Ontology Analysis
The gene sets were submitted to agriGO database (Tian et al., 2017) to perform GO enrichment analysis. Functional enrichment was performed using the singular enrichment analysis (SEA) tool and TAIR genome locus (TAIR 10) as background. The GO terms with FDR ≤ 0.01 were considered to be enriched.
Analysis of Allelic Expression and Allelic N(6)-Methyladenosine Enrichment
To obtain confidence SNPs between Col-0 and Ler, the Ler (downloaded from NCBI) and Col-0 reference genomes (TAIR 10) were cut into 100 bp fragments with 1 bp shift, and then mutually mapped to the reference genome. The read counts of each position were called using the SAMtools “mpileup” command with the parameter “-f.” SNPs were first identified if site coverage ≥90X and mutant ratio (mutants/covered reads) ≥90%. The input and IP reads of F1CL and F1LC were separately mapped to the Col-0 reference and the Ler reference, and the reads covered SNPs were calculated. Theoretically, the reads mapped to the corresponding coordinate of the Col-0 and Ler references should be identical, or at least with small bias. Thus, SNPs with severe biased reads (the difference of reads mapped to the corresponding SNPs of two references was more than 10%) were excluded. Additionally, the SNPs that were not homozygous in parent lines were filtered. For allele-specific methylation analysis (Supplementary Script 6), we first calculated reads at SNPs within m6A peaks of IP and input replicates of F1 hybrids, and then filled a 2 × 2 contingency table with normalized reads. A Fisher's exact test was performed to identify allele-specific methylated peaks, and p-value was adjusted by Bonferroni-Holm correction using R scripts. Peaks with significant allelic methylation difference (FDR < 0.05) were identified as allele-specific peaks.
Data Availability Statement
The original contributions presented in the study are publicly available. All the sequencing data have been deposited in The National Genomics Data Center (NGDC) under accession number CRA003884.
Author Contributions
YW conceived the project. ZX, SD, FZ, and ZW designed the experiments. ZX, XBS, MB, YZ, HW, HX, SW, and HJ performed the experiments. ZX, XQS, FM, and YW conducted bioinformatics analyses. ZX, SW, and YW wrote the article. All authors contributed to the article and approved the submitted version.
Funding
This study was supported by the National Key Research and Development Program of China (2016YFD0101001), Innovative Project of State Key Laboratory for Crop Genetics and Germplasm Enhancement, Fundamental Research Funds for the Central Universities (JCQY201901), Jiangsu Collaborative Innovation Center for Modern Crop Production, and an Innovation and Enterprise Scholar of Jiangsu Province to YW.
Conflict of Interest
The authors declare that the research was conducted in the absence of any commercial or financial relationships that could be construed as a potential conflict of interest.
Supplementary Material
The Supplementary Material for this article can be found online at: https://www.frontiersin.org/articles/10.3389/fpls.2021.685189/full#supplementary-material
Supplementary Figure 1. Phenotypes of Arabidopsis lines and quality of sequencing data. (A) The biomass vigor of both F1 hybrids is higher than that of Col-0 and Ler. Scale bar = 10 mm. Spearman correlations between two biological replicates of input (B) mRNA-seq and (C) m6A-seq in Col-0, Ler, F1CL, and F1LC..
Supplementary Figure 2. Global pattern of m6A peaks using the Ler genome sequence as a reference. (A) Coverage of normalized reads along transcripts. Each transcript is divided into three non-overlapping features: 5' UTR, CDS, and 3' UTR. (B) Distribution of m6A peaks in transcript features of parents and hybrids. (C) Relative enrichment of m6A peaks of each transcript feature. Enrichment = Normalized m6A-seq read number divided by normalized input reads of each peak. **p < 2.2e−16, Wilcoxon rank-sum test.
Supplementary Figure 3. Features of m6A modifications among the parent lines and F1 hybrids. (A) Number of peaks on transcripts. (B) Cumulative plot of m6A methylation enrichment in Col-0, Ler, F1CL, and F1LC. **p < 2.2e−16, Wilcoxon rank-sum test. (C) Number of m6A peaks located at the start codon and stop codon of transcripts. (D,E) Number of shared genes containing m6A peaks between accessions.
Supplementary Figure 4. Diagram of the relationship between m6A methylation level and transcript abundance. (A) Number of DEGs between parents and hybrids. (B) Number of up- or downregulated DEGs in comparisons of parents/hybrids. (C) Scatter plot of DMG-DEGs between accessions showing the relationship of m6A modification and transcript abundance. DMG-DEG indicates DEGs overlapping with DMGs (genes with differentially m6A-methylated peaks). For example, the m6A enrichment ratio of Ler: F1CL is calculated as log2 (enrichment of Ler/enrichment of F1CL) of m6A peaks. The gene expression ratio of Ler: F1CL is calculated as log2 (FPKM of Ler/FPKM of F1CL) of transcripts. n indicates the number of DMG-DEGs in each quadrant. Gene m6A enrichment is calculated by normalized m6A-seq reads number divided by normalized input reads of peaks within the transcript, and gene expression is indicated by the FPKM of the input RNA-seq data.
Supplementary Figure 5. Enriched biological functions of differentially m6A-methylated genes. (A) Enriched GO terms of genes associated with differentially m6A-methylated peaks (DMPs) that are not DEGs in comparisons of parents/hybrids. (B) Enriched GO terms of DEGs not associated with differentially m6A-methylated peaks (DMPs) in comparisons of parents/hybrids. Only some of the enriched GO terms enriched in the comparisons between parents/hybrids rather than Col/Ler are shown in the figure. All the GO terms are listed in Supplementary Table 4.
Supplementary Table 1. List of m6A peaks identified in all the samples.
Supplementary Table 2. List of DMPs between the samples.
Supplementary Table 3. List of non-additive and additive expressed genes and m6A peaks in hybrids.
Supplementary Table 4. The results of GO analysis of DMPs in each comparison.
Supplementary Table 5. Shared GO terms of any two samples.
Supplementary Table 6. Genes related to growth vigor.
Supplementary Table 7. m6A methylation of starch biosynthetic process and circadian rhythm-related genes.
References
Anders, S., Pyl, P. T., and Huber, W. (2015). HTSeq–a python framework to work with high-throughput sequencing data. Bioinformatics 31, 166–169. doi: 10.1093/bioinformatics/btu638
Anderson, S. J., Kramer, M. C., Gosai, S. J., Yu, X., Vandivier, L. E., Nelson, A. D. L., et al. (2018). N6-methyladenosine inhibits local ribonucleolytic cleavage to stabilize mRNAs in Arabidopsis. Cell Rep. 25, 1146–1157. doi: 10.1016/j.celrep.2018.10.020
Arribas-Hernandez, L., Bressendorff, S., Hansen, M. H., Poulsen, C., Erdmann, S., and Brodersen, P. (2018). An m6A-YTH module controls developmental timing and morphogenesis in Arabidopsis. Plant Cell 30, 952–967. doi: 10.1105/tpc.17.00833
Birchler, J. A. (2015). Heterosis: the genetic basis of hybrid vigour. Nat. Plants 1, 15020. doi: 10.1038/nplants.2015.20
Birchler, J. A., Auger, D. L., and Riddle, N. C. (2003). In search of the molecular basis of heterosis. Plant Cell 15, 2236–2239. doi: 10.1105/tpc.151030
Birchler, J. A., Yao, H., Chudalayandi, S., Vaiman, D., and Veitia, R. A. (2010). Heterosis. Plant Cell 22, 2105–2112. doi: 10.1105/tpc.110.076133
Bodi, Z., Zhong, S., Mehra, S., Song, J., Graham, N., Li, H., et al. (2012). Adenosine methylation in Arabidopsis mRNA is associated with the 3' end and reduced levels cause developmental defects. Front. Plant Sci. 3:48. doi: 10.3389/fpls.2012.00048
Chen, Z. J. (2010). Molecular mechanisms of polyploidy and hybrid vigor. Trends Plant Sci. 15, 57–71. doi: 10.1016/j.tplants.2009.12.003
Chen, Z. J. (2013). Genomic and epigenetic insights into the molecular bases of heterosis. Nat. Rev. Genet. 14, 471–482. doi: 10.1038/nrg3503
Choe, J., Lin, S., Zhang, W., Liu, Q., Wang, L., Ramirez-Moya, J., et al. (2018). mRNA circularization by METTL3-eIF3h enhances translation and promotes oncogenesis. Nature 561, 556–560. doi: 10.1038/s41586-018-0538-8
Cubas, P., Vincent, C., and Coen, E. (1999). An epigenetic mutation responsible for natural variation in floral symmetry. Nature 401, 157–161. doi: 10.1038/43657
Cui, X., Meng, J., Zhang, S., Chen, Y., and Huang, Y. (2016). A novel algorithm for calling mRNA m6A peaks by modeling biological variances in MeRIP-seq data. Bioinformatics 32, i378–i385. doi: 10.1093/bioinformatics/btw281
Dominissini, D., Moshitch-Moshkovitz, S., Salmon-Divon, M., Amariglio, N., and Rechavi, G. (2013). Transcriptome-wide mapping of N6-methyladenosine by m6A-seq based on immunocapturing and massively parallel sequencing. Nat. Protoc. 8, 176–189. doi: 10.1038/nprot.2012.148
Dominissini, D., Moshitch-Moshkovitz, S., Schwartz, S., Salmon-Divon, M., Ungar, L., Osenberg, S., et al. (2012). Topology of the human and mouse m6A RNA methylomes revealed by m6A-seq. Nature 485, 201–206. doi: 10.1038/nature11112
Dominissini, D., Nachtergaele, S., Moshitch-Moshkovitz, S., Peer, E., Kol, N., Ben-Haim, M. S., et al. (2016). The dynamic N1-methyladenosine methylome in eukaryotic messenger RNA. Nature 530, 441–446. doi: 10.1038/nature16998
Dong, X., Reimer, J., Göbel, U., Engelhorn, J., He, F., Schoof, H., et al. (2012). Natural variation of H3K27me3 distribution between two Arabidopsis accessions and its association with flanking transposable elements. Genome Biol. 13:R117. doi: 10.1186/gb-2012-13-12-r117
Duan, H.-C., Wei, L.-H., Zhang, C., Wang, Y., Chen, L., Lu, Z., et al. (2017). ALKBH10B is an RNA N6-methyladenosine demethylase affecting Arabidopsis floral transition. Plant Cell 29, 2995–3011. doi: 10.1105/tpc.16.00912
Gilbert, W. V., Bell, T. A., and Schaening, C. (2016). Messenger RNA modifications: form, distribution, and function. Science 352:1408. doi: 10.1126/science.aad8711
Greaves, I. K., Groszmann, M., Wang, A., Peacock, W. J., and Dennis, E. S. (2014). Inheritance of trans chromosomal methylation patterns from Arabidopsis F1 hybrids. Proc. Natl. Acad. Sci. U.S.A. 111, 2017–2022. doi: 10.1073/pnas.1323656111
Groszmann, M., Gonzalez-Bayon, R., Greaves, I. K., Wang, L., Huen, A. K., Peacock, W. J., et al. (2014). Intraspecific Arabidopsis hybrids show different patterns of heterosis despite the close relatedness of the parental genomes. Plant Physiol. 166, 265–280. doi: 10.1104/pp.114.243998
He, G., Chen, B., Wang, X., Li, X., Li, J., He, H., et al. (2013). Conservation and divergence of transcriptomic and epigenomic variation in maize hybrids. Genome Biol. 14:R57. doi: 10.1186/gb-2013-14-6-r57
He, G., Zhu, X., Elling, A. A., Chen, L., Wang, X., Guo, L., et al. (2010). Global epigenetic and transcriptional trends among two rice subspecies and their reciprocal hybrids. Plant Cell 22, 17–33. doi: 10.1105/tpc.109.072041
Hochholdinger, F., and Hoecker, N. (2007). Towards the molecular basis of heterosis. Trends Plant Sci. 12, 427–432. doi: 10.1016/j.tplants.2007.08.005
Jia, G., Fu, Y., Zhao, X., Dai, Q., Zheng, G., Yang, Y., et al. (2011). N6-methyladenosine in nuclear RNA is a major substrate of the obesity-associated FTO. Nat. Chem. Biol. 7:885. doi: 10.1038/nchembio.687
Kim, D., Pertea, G., Trapnell, C., Pimentel, H., Kelley, R., and Salzberg, S. L. (2013). Tophat2: accurate alignment of transcriptomes in the presence of insertions, deletions and gene fusions. Genome Biol. 14:R36. doi: 10.1186/gb-2013-14-4-r36
Li, H., Handsaker, B., Wysoker, A., Fennell, T., Ruan, J., Homer, N., et al. (2009). The sequence alignment/map format and SAMtools. Bioinformatics 25, 2078–2079. doi: 10.1093/bioinformatics/btp352
Li, Q., Li, X., Tang, H., Jiang, B., Dou, Y., Gorospe, M., et al. (2017). NSUN2-mediated m5C methylation and METTL3/METTL14-mediated m6A methylation cooperatively enhance p21 translation. J. Cell. Biochem. 118, 2587–2598. doi: 10.1002/jcb.25957
Li, X., Xiong, X., Wang, K., Wang, L., Shu, X., Ma, S., et al. (2016). Transcriptome-wide mapping reveals reversible and dynamic N1-methyladenosine methylome. Nat. Chem. Biol. 12, 311–316. doi: 10.1038/nchembio.2040
Li, Y., Wang, X., Li, C., Hu, S., Yu, J., and Song, S. (2014). Transcriptome-wide N6-methyladenosine profiling of rice callus and leaf reveals the presence of tissue-specific competitors involved in selective mRNA modification. RNA Biol. 11, 1180–1188. doi: 10.4161/rna.36281
Liu, N., Dai, Q., Zheng, G., He, C., Parisien, M., and Pan, T. (2015). N6-methyladenosine-dependent RNA structural switches regulate RNA-protein interactions. Nature 518, 560–564. doi: 10.1038/nature14234
Luo, G.-Z., MacQueen, A., Zheng, G., Duan, H., Dore, L. C., Lu, Z., et al. (2014). Unique features of the m6A methylome in Arabidopsis thaliana. Nat. Commun. 5, 5630–5630. doi: 10.1038/ncomms6630
Luo, J., Wang, Y., Wang, M., Zhang, L., Peng, H., Zhou, Y., et al. (2020). Natural variation in RNA m6A methylatioin and its relationship with translational status. Plant Physiol. 182, 332–344. doi: 10.1104/pp.19.00987
Luo, J. H., Wang, M., Jia, G. F., and He, Y. (2021). Transcriptome-wide analysis of epitranscriptome and translational efficiency associated with heterosis in maize. J. Exp. Bot. 72, 2933–2946. doi: 10.1093/jxb/erab074
Lv, Z., Zhang, W., Wu, Y., Huang, S., Zhou, Y., Zhang, A., et al. (2019). Extensive allele-level remodeling of histone methylation modification in reciprocal F1 hybrids of rice subspecies. Plant J. 97, 571–586. doi: 10.1111/tpj.14143
Manning, K., Tor, M., Poole, M., Hong, Y., Thompson, A. J., King, G. J., et al. (2006). A naturally occurring epigenetic mutation in a gene encoding an SBP-box transcription factor inhibits tomato fruit ripening. Nat. Genet. 38, 948–952. doi: 10.1038/ng1841
Meyer, K. D., and Jaffrey, S. R. (2017). Rethinking m6A readers, writers, and erasers. Annu. Rev. Cell Dev. Biol. 33, 319–342. doi: 10.1146/annurev-cellbio-100616-060758
Meyer, K. D., Patil, D. P., Zhou, J., Zinoviev, A., Skabkin, M. A., Elemento, O., et al. (2015). 5' UTR m6A promotes cap-independent translation. Cell 163, 999–1010. doi: 10.1016/j.cell.2015.10.012
Meyer, K. D., Saletore, Y., Zumbo, P., Elemento, O., Mason, C. E., and Jaffrey, S. R. (2012). Comprehensive analysis of mRNA methylation reveals enrichment in 3' UTRs and near stop codons. Cell 149, 1635–1646. doi: 10.1016/j.cell.2012.05.003
Miao, Z., Zhang, T., Qi, Y., Song, J., Han, Z., and Ma, C. (2020). Evolution of the RNA N6-methyladenosine methylome mediated by genomic duplication. Plant Physiol. 182, 345–360. doi: 10.1104/pp.19.00323
Moghaddam, A. M., Roudier, F., Seifert, M., Berard, C., Magniette, M. L., Ashtiyani, R. K., et al. (2011). Additive inheritance of histone modifications in Arabidopsis thaliana intra-specific hybrids. Plant J. 67, 691–700. doi: 10.1111/j.1365-313X.2011.04628.x
Ni, Z., Kim, E. D., Ha, M., Lackey, E., Liu, J., Zhang, Y., et al. (2009). Altered circadian rhythms regulate growth vigour in hybrids and allopolyploids. Nature 457, 327–331. doi: 10.1038/nature07523
Scutenaire, J., Deragon, J. M., Jean, V., Benhamed, M., Raynaud, C., Favory, J. J., et al. (2018). The YTH domain protein ECT2 is an m6A reader required for normal trichome branching in Arabidopsis. Plant Cell 30, 986–1005. doi: 10.1105/tpc.17.00854
Shen, H., He, H., Li, J., Chen, W., Wang, X., Guo, L., et al. (2012). Genome-wide analysis of DNA methylation and gene expression changes in two Arabidopsis ecotypes and their reciprocal hybrids. Plant Cell 24, 875–892. doi: 10.1105/tpc.111.094870
Shen, L., Liang, Z., Gu, X., Chen, Y., Teo, Z. W., Hou, X., et al. (2016). N6-methyladenosine RNA modification regulates shoot stem cell fate in Arabidopsis. Dev. Cell 38, 186–200. doi: 10.1016/j.devcel.2016.06.008
Shindo, C., Lister, C., Crevillen, P., Nordborg, M., and Dean, C. (2006). Variation in the epigenetic silencing of FLC contributes to natural variation in Arabidopsis vernalization response. Genes Dev. 20, 3079–3083. doi: 10.1101/gad.405306
Thimm, O., Bläsing, O., Gibon, Y., Nagel, A., Meyer, S., Krüger, P., et al. (2004). MAPMAN: a user-driven tool to display genomics data sets onto diagrams of metabolic pathways and other biological processes. Plant J. 37, 914–939. doi: 10.1111/j.1365-313X.2004.02016.x
Tian, T., Liu, Y., Yan, H., You, Q., Yi, X., Du, Z., et al. (2017). agriGO v2.0: a GO analysis toolkit for the agricultural community, 2017 update. Nucleic Acids Res. 45, W122–W129. doi: 10.1093/nar/gkx382
Wan, Y., Tang, K., Zhang, D., Xie, S., Zhu, X., Wang, Z., et al. (2015). Transcriptome-wide high-throughput deep m6A-seq reveals unique differential m6A methylation patterns between three organs in Arabidopsis thaliana. Genome Biol. 16:272. doi: 10.1186/s13059-015-0839-2
Wang, X., Lu, Z., Gomez, A., Hon, G. C., Yue, Y., Han, D., et al. (2014). N6-methyladenosine-dependent regulation of messenger RNA stability. Nature 505, 117–120. doi: 10.1038/nature12730
Wei, L.-H., Song, P., Wang, Y., Lu, Z., Tang, Q., Yu, Q., et al. (2018). The m6A reader ECT2 controls trichome morphology by affecting mRNA stability in Arabidopsis. Plant Cell 30, 968–985. doi: 10.1105/tpc.17.00934
Yang, M., Wang, X., Huang, H., Ren, D., Su, Y., Zhu, P., et al. (2016). Natural variation of H3K27me3 modification in two Arabidopsis accessions and their hybrid. J. Integr. Plant Biol. 58, 466–474. doi: 10.1111/jipb.12443
Zhong, S., Li, H., Bodi, Z., Button, J., Vespa, L., Herzog, M., et al. (2008). MTA is an Arabidopsis messenger RNA adenosine methylase and interacts with a homolog of a sex-specific splicing factor. Plant Cell 20, 1278–1288. doi: 10.1105/tpc.108.058883
Keywords: RNA m6A methylation, hybrid, heterosis, Arabidopsis, RNA modification dynamics
Citation: Xu Z, Shi X, Bao M, Song X, Zhang Y, Wang H, Xie H, Mao F, Wang S, Jin H, Dong S, Zhang F, Wu Z and Wu Y (2021) Transcriptome-Wide Analysis of RNA m6A Methylation and Gene Expression Changes Among Two Arabidopsis Ecotypes and Their Reciprocal Hybrids. Front. Plant Sci. 12:685189. doi: 10.3389/fpls.2021.685189
Received: 24 March 2021; Accepted: 14 May 2021;
Published: 10 June 2021.
Edited by:
Dazhong Dave Zhao, University of Wisconsin–Milwaukee, United StatesReviewed by:
Chuang Ma, Northwest a and F University, ChinaHua Jiang, Leibniz Institute of Plant Genetics and Crop Plant Research (IPK), Germany
Copyright © 2021 Xu, Shi, Bao, Song, Zhang, Wang, Xie, Mao, Wang, Jin, Dong, Zhang, Wu and Wu. This is an open-access article distributed under the terms of the Creative Commons Attribution License (CC BY). The use, distribution or reproduction in other forums is permitted, provided the original author(s) and the copyright owner(s) are credited and that the original publication in this journal is cited, in accordance with accepted academic practice. No use, distribution or reproduction is permitted which does not comply with these terms.
*Correspondence: Yufeng Wu, yfwu@njau.edu.cn