 Songmei Shi
 Yuling Qiu
 Miao Wen
 Xiao Xu2
 Xingshui Dong
 Chenyang Xu
 Xinhua He
- 1Centre of Excellence for Soil Biology, School of Resource and Environment, Southwest University, Chongqing, China
- 2Key Laboratory of Southwest China Wildlife Resources Conservation (China West Normal University), Ministry of Education, Nanchong, China
- 3School of Biological Sciences, University of Western Australia, Perth, WA, Australia
Almost all elevated atmospheric CO2 concentrations (eCO2) studies have not addressed the potential responses of plant growth to different CO2 in daytime and nighttime. The present study was to determine the impact of daytime and/or nighttime eCO2 on growth and quality of mulberry (Morus alba L.), a perennial multipurpose cash plant. Six-month-old mulberry seedlings were hence grown in environmentally auto-controlled growth chambers under four CO2 concentrations: (1) ambient CO2 (ACO2, 410 μmol mol–1 daytime/460 μmol mol–1 nighttime), (2) sole daytime elevated CO2 (DeCO2, 710 μmol mol–1/460 μmol mol–1), (3) sole nighttime elevated CO2 (NeCO2, 410 μmol mol–1/760 μmol mol–1), and (4) continuous daytime and nighttime elevated CO2 (D + NeCO2, 710 μmol mol–1/760 μmol mol–1). Plant growth characteristics, nutrient uptake, and leaf quality were then examined after 120 days of CO2 exposure. Compared to control, DeCO2 and (D + N)eCO2 increased plant biomass production and thus the harvest of nutrients and accumulation of leaf carbohydrates (starch, soluble sugar, and fatty acid) and N-containing compounds (free amino acid and protein), though there were some decreases in the concentration of leaf N, P, Mg, Fe, and Zn. NeCO2 had no significant effects on leaf yield but an extent positive effect on leaf nutritional quality due to their concentration increase in leaf B, Cu, starch, and soluble sugar. Meanwhile, (D + N)eCO2 decreased mulberry leaf yield and harvest of nutritious compounds for silkworm when compared with DeCO2. The reason may be associated to N, P, Mg, Fe, and Zn that are closely related to leaf pigment and N metabolism. Therefore, the rational application of mineral nutrient (especially N, P, Fe, Mg, and Zn) fertilizers is important for a sustainable mulberry production under future atmosphere CO2 concentrations.
Introduction
The increasing atmosphere CO2 concentration has become one of the worldwide hot issues. The atmosphere CO2 concentration has increased from 280 μmol mol–1 in the pre-industry times to 417 μmol mol–1 in November 20201 and is predicted to exceed 700 μmol mol–1 by the end of the twenty-first century (IPCC,, 2014). As atmospheric CO2 is the primary source of carbon (C) for plants, the ongoing increased CO2 will act as a C fertilizer, resulting in an increase in biomass production in cereal crops (Drag et al., 2020; Park et al., 2020; Tcherkez et al., 2020), vegetable crops (Dong et al., 2020), perennial fruit crops (Salazar-Parra et al., 2015), grass (Xiao et al., 2016), and some perennial woody plants (Maillard et al., 2001; Singh et al., 2019; Ahammed et al., 2020). The beneficial effect has led to a growing demand for macro- and micronutrients, including nitrogen (N), phosphorous (P), potassium (K), calcium (Ca), magnesium (Mg), etc., to match their increased C assimilation under elevated CO2 (eCO2), resulting in changes in crop quality and hence food nutrition (Loladze, 2014; Kohler et al., 2019; Chumley and Hewlings, 2020). Therefore, to address how eCO2 affects crop productivity, food quality and security is timely needed.
Mulberry (Morus alba L.) is a fast-growing multipurpose plant, and its leaves are rich in proteins, carbohydrates, fats, fibers, minerals, and vitamins (Butt et al., 2008). In a number of Asian and European countries, mulberry leaves have been used not only for rearing silkworm (Bombyx mori L.) but also for feeding cattle, goat, and other animals, being used as tea and vegetable, and treating atherosclerosis, diabetes mellitus, etc. (Papanastasis et al., 2008; Guha et al., 2010). The quality of mulberry leaves thus strongly associates with the quantity and quality of cocoon, animal, and human nutrition. However, little information was available about the responses of nutritional quality in mulberry leaves under global environmental change scenarios. To date, only limited reports have explored the response of mulberry trees to eCO2. For example, Sekhar et al. (2014, 2015) showed that plant height, leaf numbers, branches, total shoot length, and biomass production in 6 month-old mulberry Selection-13 (S13) and Kanva-2 (K2) genotypes were lower under ambient CO2 than under 550 μmol mol–1 eCO2 for 90 days. In addition, such a 550 μmol mol–1 eCO2 treatment significantly increased net photosynthetic rates, intercellular CO2 concentration, photosynthetic N and water use efficiency, and Rubisco, chlorophyll a, starch, and total sugar concentrations, but significantly decreased stomatal conductance, transpiration rates, and light compensation point in the fully expanded upper third or fourth leaf, respectively (Sekhar et al., 2015). Meanwhile, all abovementioned increases were higher under S13 than under K2 (Sekhar et al., 2015). Recently, 800 μmol mol–1 eCO2 alleviated drought stresses on 1 year “Qinglong” mulberry seedlings by increasing their leaf water use efficiency and PSII photochemical activity (Liu et al., 2019). The number and biomass of inflorescence in female, not in male of the mulberry tree, were increased after 18 months eCO2 (ambient plus 380 μmol mol–1 CO2 exposure) (Li et al., 2019). Nevertheless, relatively less attention has been paid to their changes into leaf nutrition quality of mulberry trees, especially their macro- and micronutrients under eCO2, considering that N, P, K, Ca, Mg, boron (B), zinc (Zn), iron (Fe), copper (Cu), and manganese (Mn) in the mulberry leaves are essential to silkworm and other animals (Radojkovic et al., 2014).
A 7 year experiment of free-air CO2 enrichment (FACE) study reported that N, P, and Zn concentrations on grain were, respectively, decreased by 6, 5, and 10% under 550 eCO2, irrespective of soil types, crop species, and year (Jin et al., 2019). Moreover, short-term FACE studies showed that 550–900 μmol mol–1 eCO2 decreased P in Medicago truncatula (Jakobsen et al., 2016), Ca, Zn, and Mn in lettuce (Baslam et al., 2012), and oilseed rape (Högy et al., 2010), and Zn and Fe in grains of wheat (Triticum aestivum) (Fernando et al., 2012), and soybean (Glycine max) (Kohler et al., 2019). The adverse effect of 550–900 μmol mol–1 eCO2 on leaf and grain quality was also observed with decreased economic benefits of food crops (Dietterich et al., 2015). However, all of these studies have determined the responses of plant growth and nutrient uptake to eCO2 only at daytime, but not at nighttime.
The atmospheric CO2 concentrations indeed differ between daytime and nighttime, considering that differences exist in plant photosynthesis and soil respiration particularly in agricultural fields. For example, a 3 month (June–September, assuming in 1999 or 2000) observation in Australia, Japan, and United States showed that the average atmospheric CO2 concentration at canopy height (rice and other crops/weeds) varied from 390 μmol mol–1 at daytime to 465 μmol mol–1 at nighttime (Ziska et al., 2001). A few studies have indicated that eCO2 at nighttime can influence plant growth and dry matter accumulation, and the positive or negative effects on growth result from effects of CO2 on dark respiration (Bunce, 1995, 2002; Griffin et al., 1999). However, there are controversial effects of eCO2 at nighttime on dark respiration. It is suggested that 500–1,400 μmol mol–1 eCO2 at nighttime decreased both respiration and translocation processes in short-term experiments, and the responses of common bean (Phaseolus vulgaris) growth depended on whether CO2 was elevated at nighttime or daytime (Amthor et al., 1992; Bunce, 2002). In contrast, dark respiration usually, but not always, increases in proportion to the elevated photosynthesis rate in long-term CO2 enrichment experiments (Poorter et al., 1992; Bunce, 1995). Mechanisms by which eCO2 at night may influence plant growth have not been established, and their effect on plant carbon balance and nutrient allocation also has not been revealed. Thus, variations in daytime and/or nighttime eCO2 concentrations shall provide a closer simulation of future atmospheric CO2 conditions that plants will respond to in the near future.
Several methodologies have been explored to simulate the response of a plant–soil system to eCO2. For example, closed-chamber experiments can strictly control environmental factors, e.g., temperature, humidity, water, light, CO2 concentration, etc., which affect plant growth in a completely closed space (Freijer and Bouten, 1991). This closed-chamber system has been widely applied in agricultural research, although the environments are often substantially different from those in the field (Horie et al., 1995; Cheng et al., 2006). The open-top chamber (OTC) is a semi-closed climate simulation system with all chamber sides being closed but the top opened. The OTC is comparatively inexpensive, but has a higher air temperature and humidity, lower solar radiation and wind turbulence, thus decreasing evapo-transpiration and increasing pest and disease (Lawlor and Mitchell, 1991; Amthor, 2001). Compared to the conventional closed-chamber and OTC, the free-air carbon dioxide enrichment (FACE) creates a microclimate to approach the natural environment; however, it is hard to achieve a high CO2 enrichment during nighttime because of the extra expense or the lack of wind at night to deliver the CO2 to the plots (Norby and Zak, 2011; Kuzyakov et al., 2019). By taking into account the advantages and disadvantages of these systems, in the present study, we constructed an automatically environmentally controlled glass-made growth chambers that was programmed to mimic outside environmental conditions except for CO2 concentration, which was set to the amounts required for the experiment during daytime and nighttime (Supplementary Figure S1). With comparisons to the current CO2 atmosphere concentrations, the objectives of the present study were to address how daytime and/or nighttime eCO2 could affect: (1) mulberry biomass production, (2) leaf concentrations of macronutrients (N, P, K, Ca, and Mg) and micro-nutrients (Mn, B, Cu, Fe, and Zn), and (3) leaf concentrations of carbohydrates (starch, soluble sugar, and fatty acid) and N-containing compounds (free amino acid and protein). Six month-old mulberry seedlings were therefore grown inside environmentally controlled glass-made chambers, which had the same growth conditions (fertilization, temperature, humidity, etc.), except CO2 concentrations: ambient CO2, eCO2 in daytime only, eCO2 in nighttime only, and continuous eCO2 in both daytime and nighttime. The abovementioned plant characteristics were then compared after a further 120 day growth.
Materials and Methods
Plant Materials and Experimental Design
The seeds of mulberry (Morus alba var. Gui-sang-you 62) were provided by the Sericultural Research Institute of Sichuan Academy of Agricultural Sciences, and the test materials were 6 month older mulberry seedlings with uniform growth status. One seedling was planted in a plastic pot (20 × 24 cm = height × diameter) filled with 5 kg of soil (Eutric Regosol, FAO Soil Classification System). The soil (pH 6.8) had 7.56 g of organic carbonkg–1, 0.66 g of total Nkg–1, 0.61 g of total Pkg–1, 97 mg available Nkg–1, 17 mg available Pkg–1, and 197 mg available K kg–1.
A total of 12 glass-made growth chambers (length × width × height = 1.5 × 1.0 × 2.5 m) were constructed in the National Monitoring Base for Purple Soil Fertility and Fertilizer Efficiency (29°48′N, 106°24′E, 266.3 m above sea level) on the campus of Southwest University, Chongqing, China. The four-side walls and top roof of the chamber were constructed using tempered glasses (10 mm thickness) with 90% light transmission rate (Yutao Glass Company, Jiulongpo, Chongqing 400051, China). The CO2 concentration, temperature, and humidity inside the growth chambers were auto-controlled by a CO2 auto-controlling facility (DSS-QZD, Qingdao Shengsen Research Institute of CNC Technology, Shandong, China). Based on the on-site variation of daytime and nighttime atmosphere CO2 concentrations, we designed four CO2 treatments: (1) ambient CO2 (ACO2, 410/460 μmol mol–1 nighttime), (2) elevated CO2 in daytime only (DeCO2, 710/460 μmol mol–1), (3) elevated CO2 in nighttime (NeCO2, 410/760 μmol mol–1), and (4) elevated CO2 in both daytime and nighttime [(D + N)eCO2, 710/760 μmol mol–1]. Daytime was from 07:30 a.m. to 19:30 p.m. and nighttime was from 19:30 p.m. to 07:30 a.m. Each CO2 treatment had three independent replicates or chambers, and each chamber contained six independent mulberry seedlings (pots) for a total of 18 seedlings. Except for CO2 concentrations, those growth chambers had the same growth conditions including fertilization, light, temperature, and humidity. The temperature and humidity inside and outside the growth chambers were kept consistent with each other by an auto-controlling facility. The photosynthetic active radiation (PAR) was supplied by the natural light, though the tempered glass had 90% light transmission. The variations in mean daily temperature, relative humidity, PAR, and CO2 concentration over the whole growth stage are shown in Figure 1. The pots in the chambers were weekly relocated once in order to ensure a similar plant growth environment.
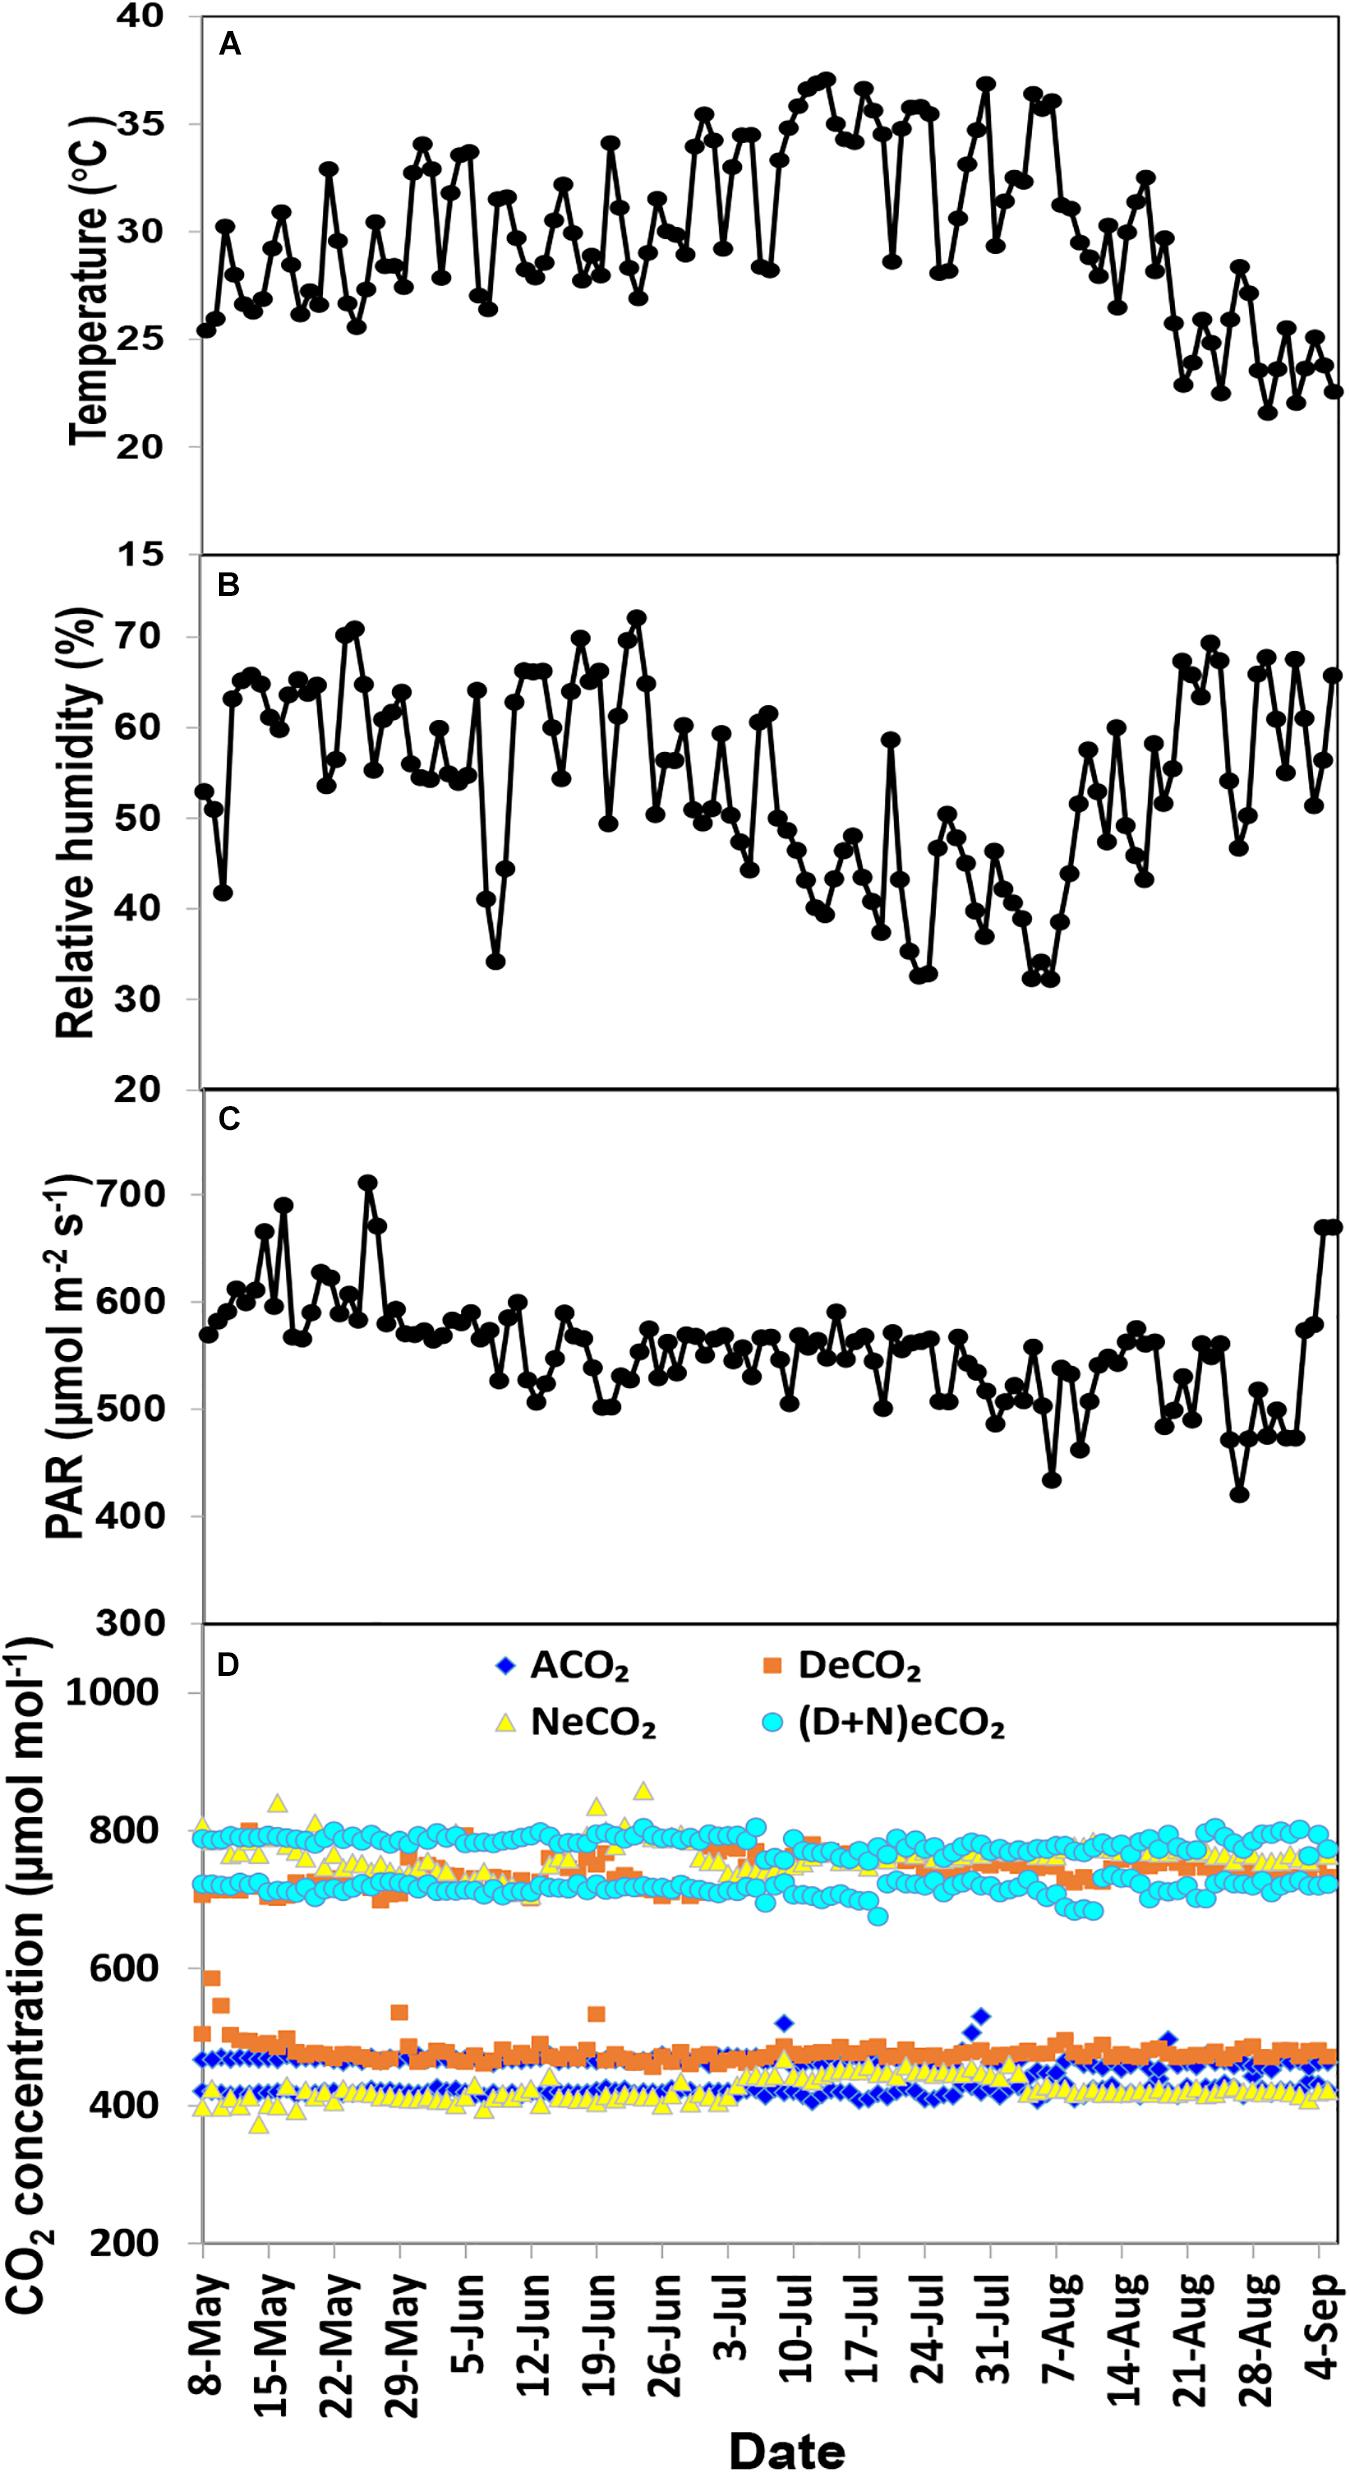
Figure 1. Mean temperature (A), relative humidity (B), photosynthetic active radiation (PAR) (C), and CO2 concentration (D) over the experimental period in the growth chambers.
Plant Sampling and Measurements
After 120 days of CO2 exposure, plant samples were harvested and divided into leaf, stem, and root, and their fresh weight was then, respectively, measured. The harvested fresh leaves were divided into two groups. One group of the fresh leaves was cut into fine pieces and mixed for the determination of soluble sugar, starch, and free amino acid, and the measured data were then calculated on the basis of their dry weight. Another group of fresh leaves, all harvested fresh stems, and roots were oven dried at 75°C until their dry weight was constant. The oven-dried leaf, stem, or root samples were ground into fine powder for the determination of crude fatty acid (leaf only) or element concentrations. The determined elements were C, N, P, K, Ca, Mg, Mn, B, Cu, Fe, and Zn for leaf samples, but only C for stem and root samples that were presented in this study. The total plant biomass was the sum of leaf, stem, and root.
The concentrations of C in plant tissues were determined with the potassium dichromate–sulfuric acid oxidation method, and the concentrations of leaf N was determined with the Kjeldahl method to determine protein levels (N × 6.25) (Yang et al., 2008). After the nitric acid digestion, the mineral elements, including P, K, Ca, Mg, Fe, Zn, B, Cu, and Mn, were determined by using an inductively coupled plasma-optical emission spectrometry (iCAP 6500 Duo; Thermo Fisher Scientific, Waltham, MA, United States), following the operation procedures in the spectrometry’s manual.
Determination of leaf soluble sugar (mg g–1 DW) and starch (mg g–1 DW) was followed by the anthrone method using glucose as the standard (Li, 2000). Briefly, 200 mg of fresh leaves were extracted with 10 ml of ethanol (80%, v/v) in a water bath at 80°C for 30 min, and centrifuged at 13,000 rpm for 10 min. The supernatant was collected into a 100 ml volumetric flask for estimating soluble sugar. The residue after the final centrifugation was added with 5 ml of H2O and 2 ml of perchloric acid (9.2 mol L–1), and then centrifuged at 13,000 rpm for 10 min. The supernatant was collected into a 100 ml volumetric flask for estimating starch. One milliliter of supernatant from both samples was added with 5 ml of freshly prepared anthrone sulfuric acid solution (80%, v/v), respectively, and incubated in boiling water for 10 min. After cooling, the absorbance of the incubated supernatant was spectrophotometrically read at 620 nm.
Determination of free amino acids (mg g–1 DW) was performed by ninhydrin colorimetry using leucine as standard (Li, 2000). Briefly, 500 mg of fresh leaves was extracted with 10 ml of H2O in boiling water for 20 min, and then the mixture was centrifuged at 13,000 rpm for 10 min. The supernatant was collected into a 100 ml volumetric flask. One milliliter of the extraction was added into 0.5 ml of NaCN (0.01 mol L–1) and 0.5 ml ninhydrin (3%, w/v), and the mixture was boiled for 12 min. After cooling, 5 ml of ethanol (95%, v/v) was added into the mixture, and the absorbance of the incubated supernatant was spectrophotometrically read at 570 nm.
Determination of leaf crude fatty acid (mg g–1 DW) was followed by the Soxhlet extractor method (Gao, 2006). Briefly, 20,000 g of dried leaf powder was placed in a filter cartridge, which was dried at 105°C for 2 h, then the cartridge was added with 50 ml of anhydrous ether, and refluxed for 12 h using a Soxhlet apparatus. After the anhydrous ether was fully evaporated, the cartridge was oven dried at 105°C for 2 h, cooled in a desiccator, and then weighed.
Leaf nutrient accumulation was calculated by the leaf concentration and biomass. Leaf nutrient accumulation (mg plant–1) = leaf biomass (g plant–1) × leaf nutrient concentration (mg g–1). The nutrient use efficiency was calculated according to Carvalho et al. (2020): Nutrient use efficiency (g) = (leaf biomass, g plant–1)2 / (nutrient accumulation, mg plant–1).
Statistics
Data (means ± SE, n = 3) were statistically analyzed by one-way ANOVA with SPSS 19.0. Significant differences between treatments were analyzed by the Duncan’s multiple range test at P < 0.05 using the SPSS 19.0 (SPSS Inc., Chicago, IL, United States). The polynomial regression analysis was performed using the OriginPro 8.0 (OriginLab Corp., Northampton, MA, United States).
Results
Plant Biomass Production
The 710/460 μmol mol–1 DeCO2 significantly enhanced leaf biomass by 102%, stem biomass by 187%, root biomass by 90%, and total plant biomass by 113%, compared with mulberry plants grown under ACO2 (Figure 2A). Leaf, stem, root, and total plant biomass production in mulberry grown under 710/760 μmol mol–1 (D + N)eCO2 was, respectively, increased by 42, 42, 22, and 40% compared with their ambient counterparts (Figure 2A). However, 410/760 μmol mol–1 NeCO2 had no significant effects on plant biomass production, including leaf, stem, and root biomass (Figure 2A). Significantly higher leaf, stem, root, and total plant biomass between CO2 treatments is ranked as DeCO2 > (D + N)eCO2 > NeCO2 ≈ ACO2 (Figure 2A).
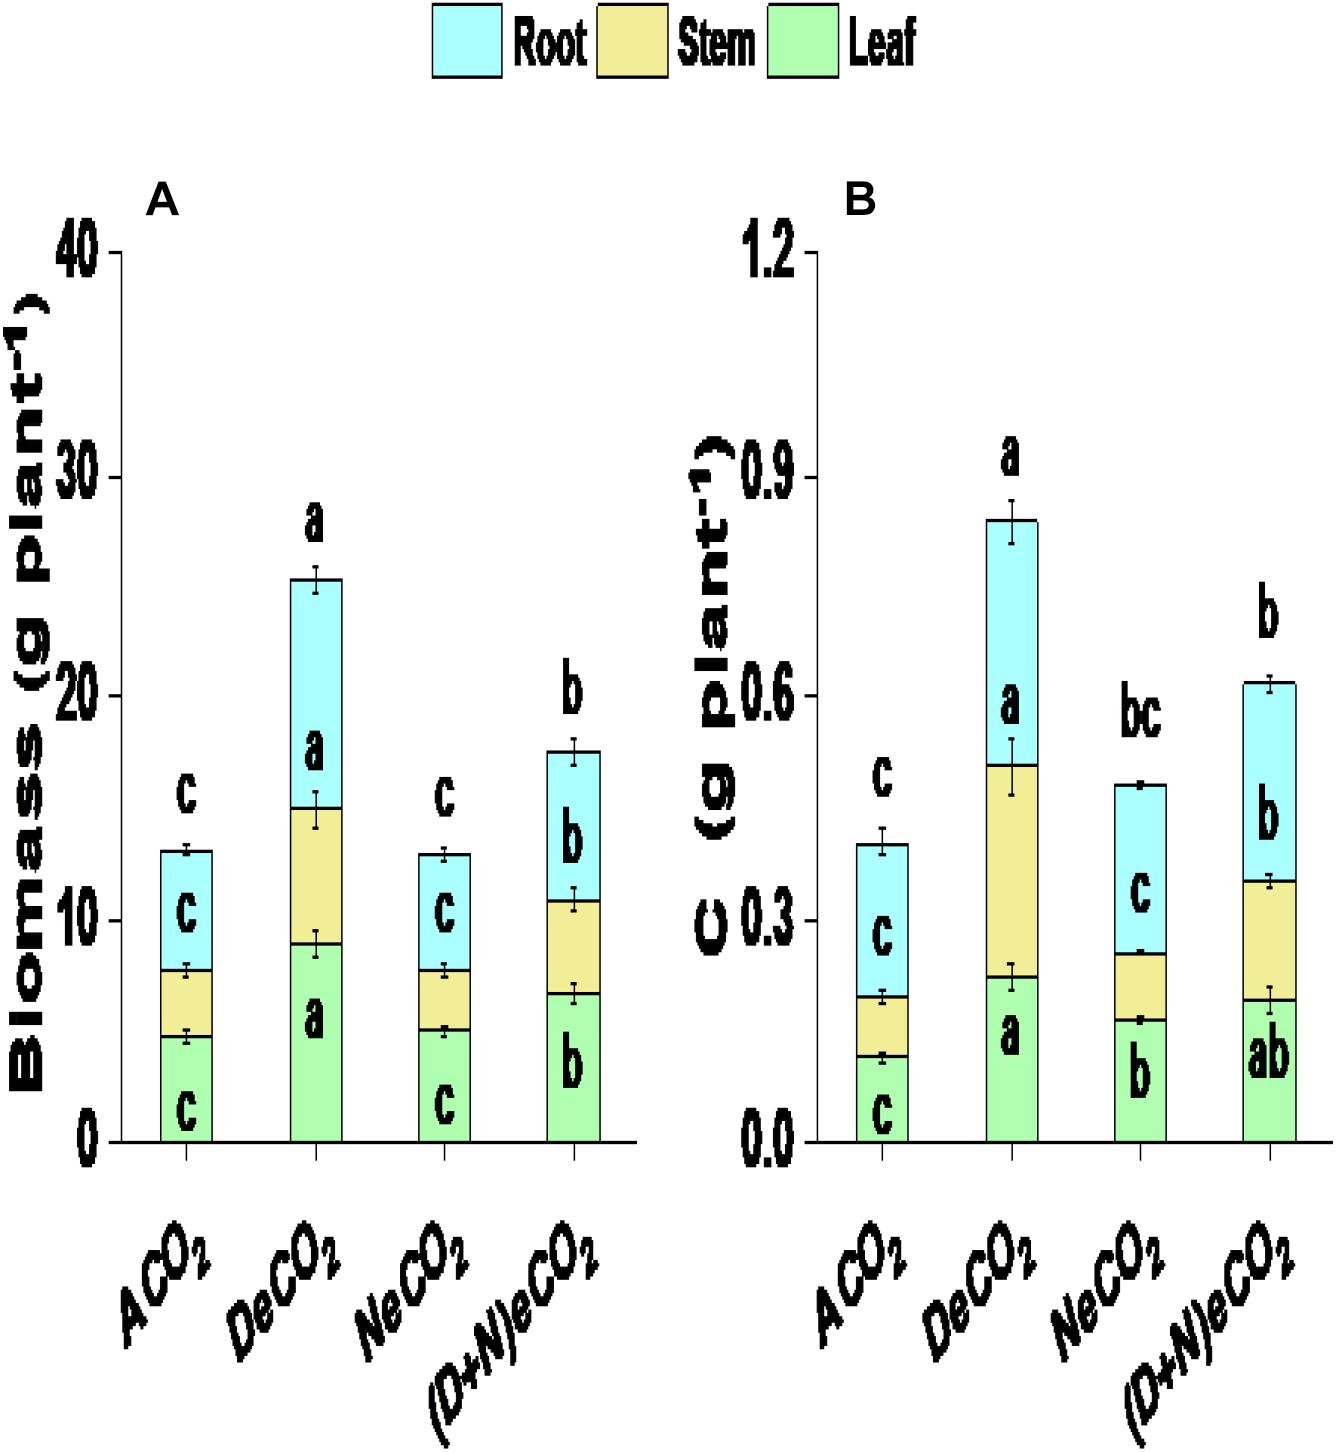
Figure 2. Plant biomass production (A) and carbon accumulation (B) of mulberry seedlings grown for 120 days under four different daytime and nighttime CO2 concentrations inside environmentally controlled glass growth chambers. Data (means ± SE, n = 3) followed by different letters above the bars are significant differences between CO2 treatments at P < 0.05. Abbreviations: ACO2, ambient CO2 (410 μmol mol–1 daytime + 460 μmol mol–1 nighttime); DeCO2, sole daytime elevated CO2 (710 μmol mol–1 daytime + 460 μmol mol–1 nighttime); NeCO2, sole nighttime eCO2 (410 μmol mol–1 daytime + 760 μmol mol–1 nighttime); (D + N)eCO2, continuous daytime/nighttime eCO2 (710 μmol mol–1 daytime + 760 μmol mol–1 nighttime). All CO2 concentrations had a variation of ± 30 μmol mol–1 in inside environmentally controlled growth chambers. Daytime: 07:30 a.m.–19:30 p.m. and nighttime: 19:30 p.m.–07:30 a.m.
Carbon Accumulation
DeCO2 and (D + N)eCO2 treatments significantly increased C accumulation in leaf, stem, and root by 68–95, 94–245, and 27–58%, respectively (Figure 2B). Leaf and root C accumulation under NeCO2 was, respectively, increased by 45 and 10%, whereas stem C basically had no changes, compared with mulberry plants grown under ACO2 (Figure 2B). Between CO2 treatments, significantly higher C accumulation is ranked as DeCO2 > (D + N)eCO2 > NeCO2 > ACO2 for leaf and root and DeCO2 > (D + N)eCO2 > NeCO2 ≈ ACO2 for stem (Figure 2B).
Leaf Concentrations and Accumulations of Mineral Elements
Irrespective of CO2 treatments, concentrations of leaf K, Ca, Mn, and B were generally similar, except for a higher B or Cu under NeCO2 or DeCO2 (Figure 3). Compared to ACO2, leaf N, P, Mg, Fe, and Zn concentrations declined by 5.0–6.0, 9–18, 3.0–5.3, 24–67, and 6.3–11.7% under eCO2 enrichment, respectively. Among the four CO2 treatments, significantly higher nutrient concentration is ranked as ACO2 ≈ (D + N)eCO2 > NeCO2 ≈ DeCO2 for leaf N, ACO2 > NeCO2 > (D + N)eCO2 ≈ DeCO2 for leaf P, ACO2 ≈ NeCO2 > DeCO2 > (D + N)eCO2 for Mg, ACO2 > (D + N)eCO2 > DeCO2 > NeCO2 for Fe, and ACO2 > NeCO2 ≈ DeCO2 ≈ (D + N)eCO2 for Zn (Figure 3).
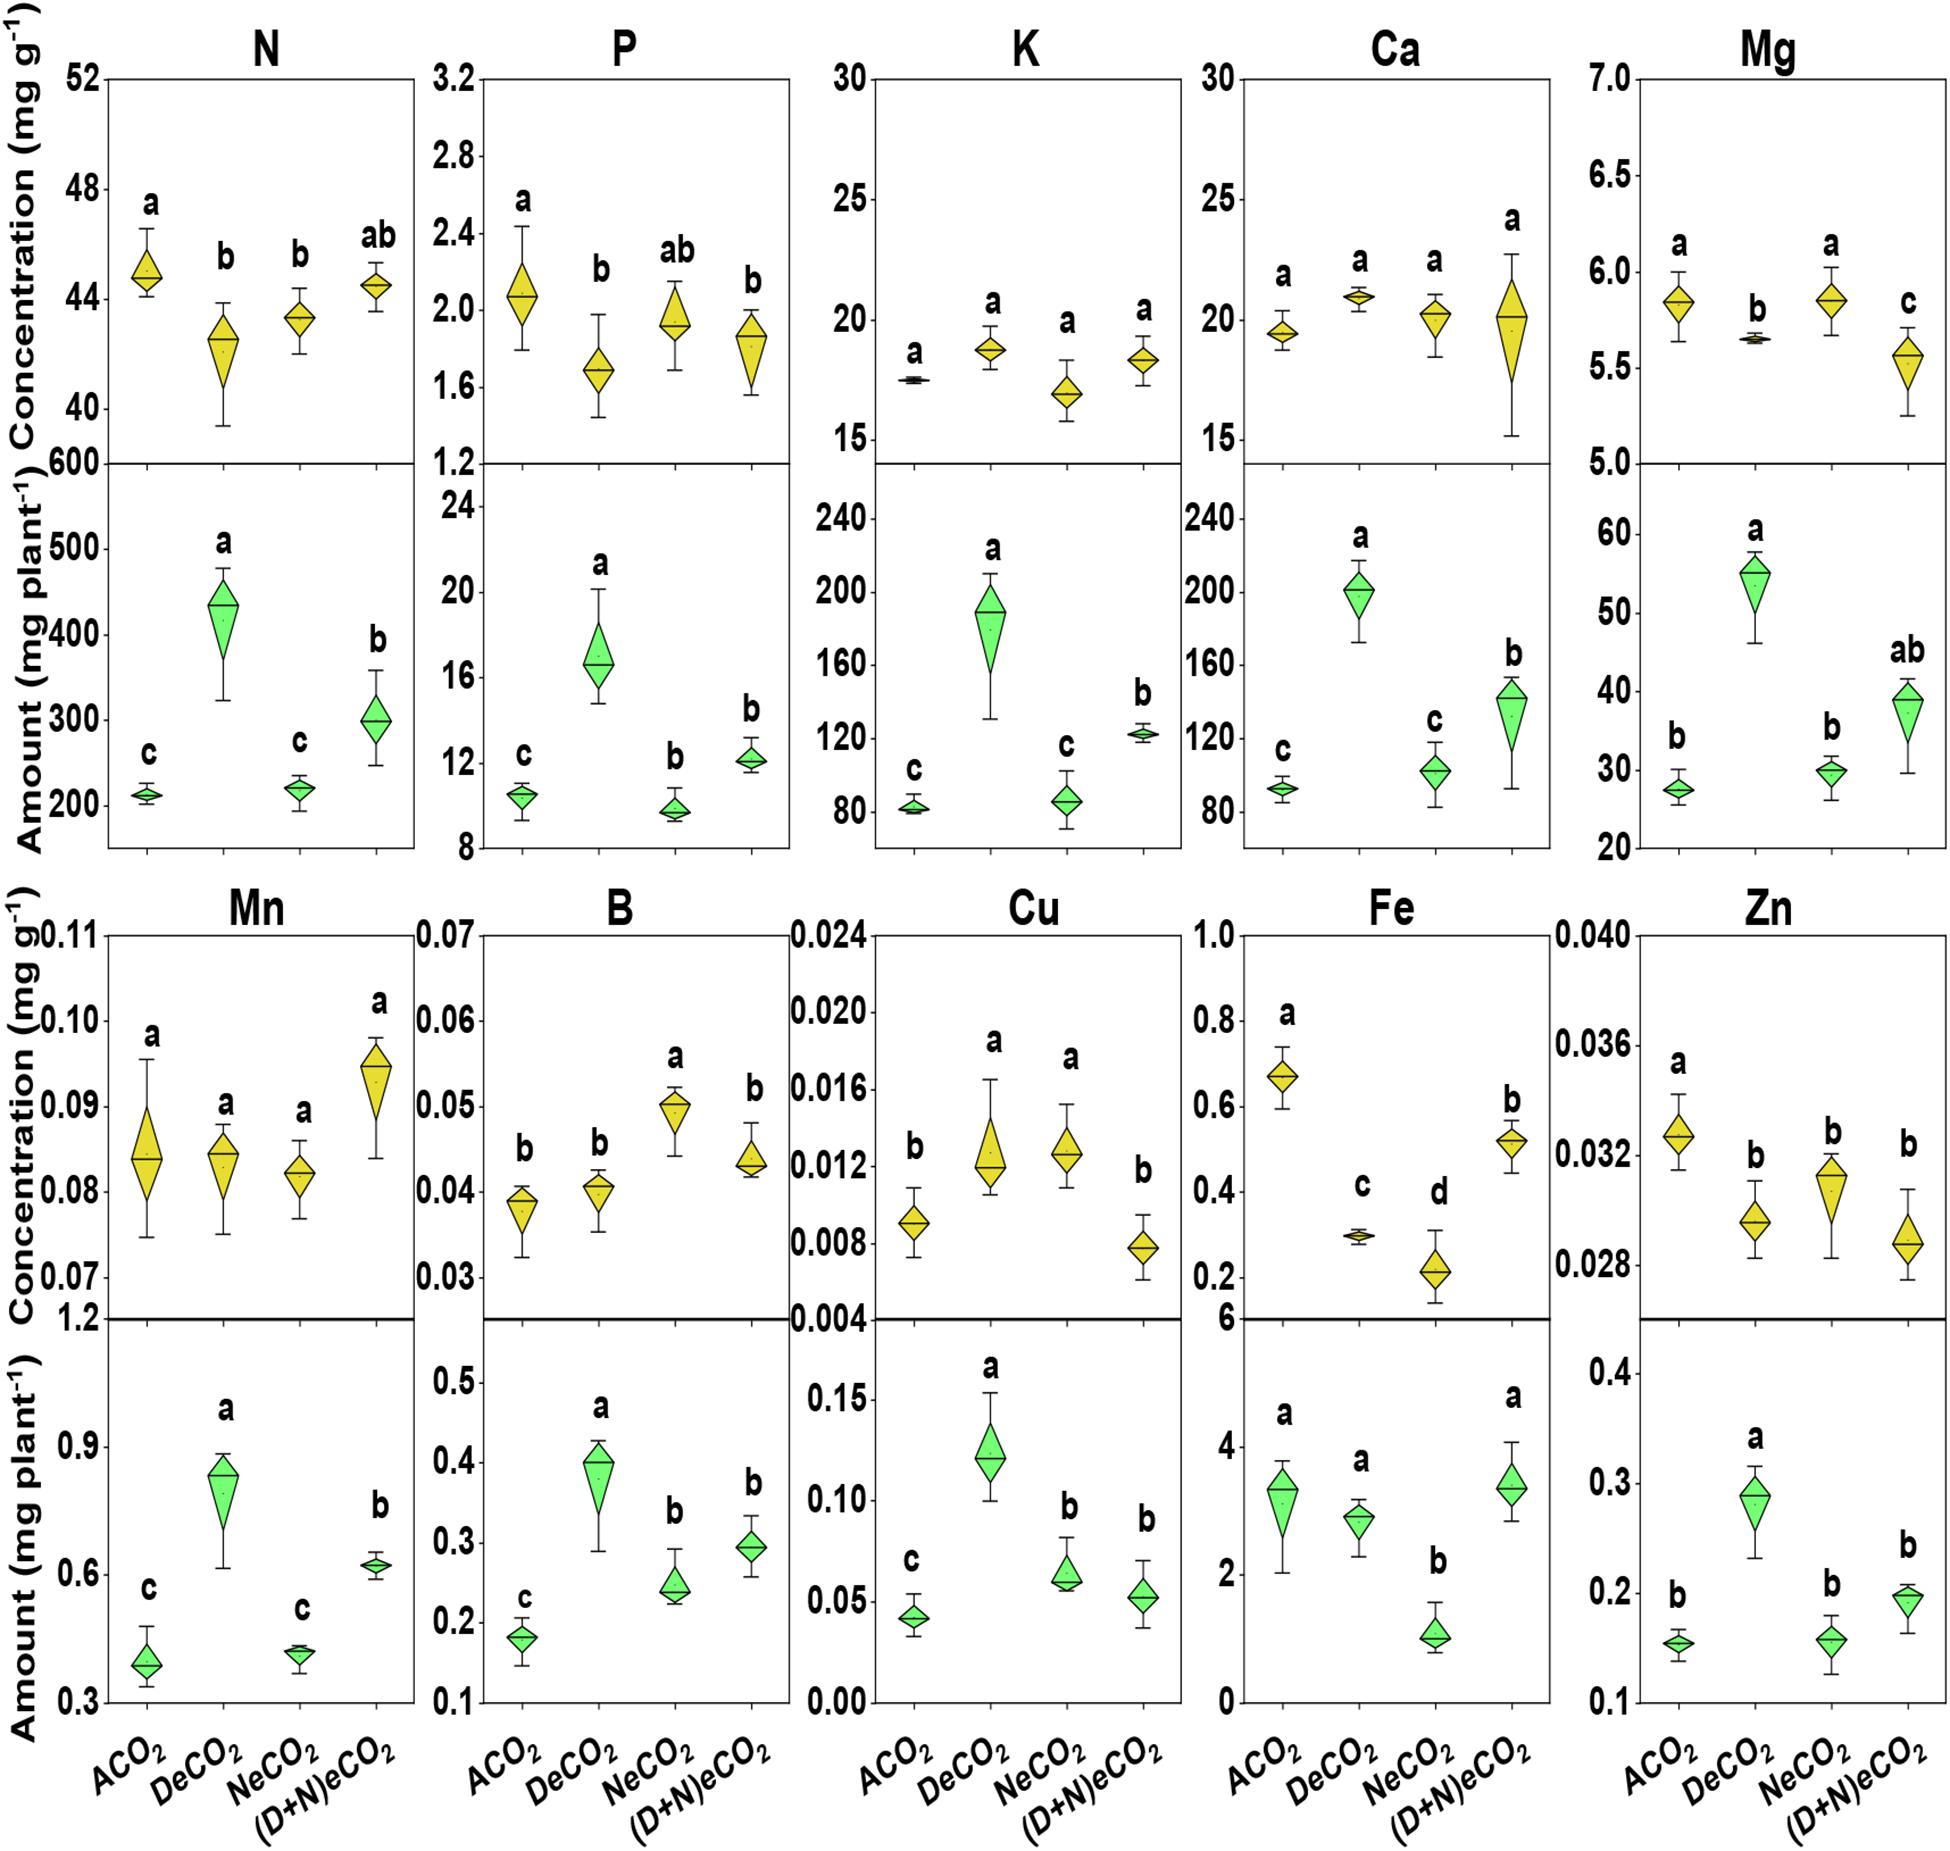
Figure 3. Concentrations and accumulations of leaf macro–micro elements in mulberry seedlings grown for 120 days under four different daytime and nighttime CO2 concentrations inside environmentally controlled glass growth chambers. Different letters indicate significant differences among CO2 treatments at P < 0.05. See treatment abbreviations in Figure 1.
Compared with ACO2, DeCO2 significantly increased accumulations of leaf N, P, K, Ca, Mg, Mn, B, Cu, and Zn, but did not change Fe accumulation (Figure 3); (D + N)eCO2 significantly increased plant N, P, K, Ca, Mg, Mn, B, and Cu accumulations, but had a similar leaf Fe and Zn accumulations (Figure 3). NeCO2 had significantly higher leaf B and Cu, lower leaf Fe accumulation, but no effects on leaf N, P, K, Ca, Mg, Mn, and Zn accumulations, compared with these under ACO2 (Figure 3).
Nutrient Use Efficiency
Compared with ACO2, both DeCO2 and (D + N)eCO2 significantly increased the nutrient use efficiency of N, P, K, Ca, Mg, Mn, B, Cu, and Fe. Both DeCO2 and NeCO2 significantly increased the nutrient use efficiency of Fe. Nutrient use efficiency was highest in the elevated CO2 at daytime (increased by 60–260% compared with ACO2), followed by continuous elevation of CO2 (22–64% increase, compared with ACO2), while no effects were detected under eCO2 at nighttime, except for nutrient use efficiency of Fe (Figure 4).
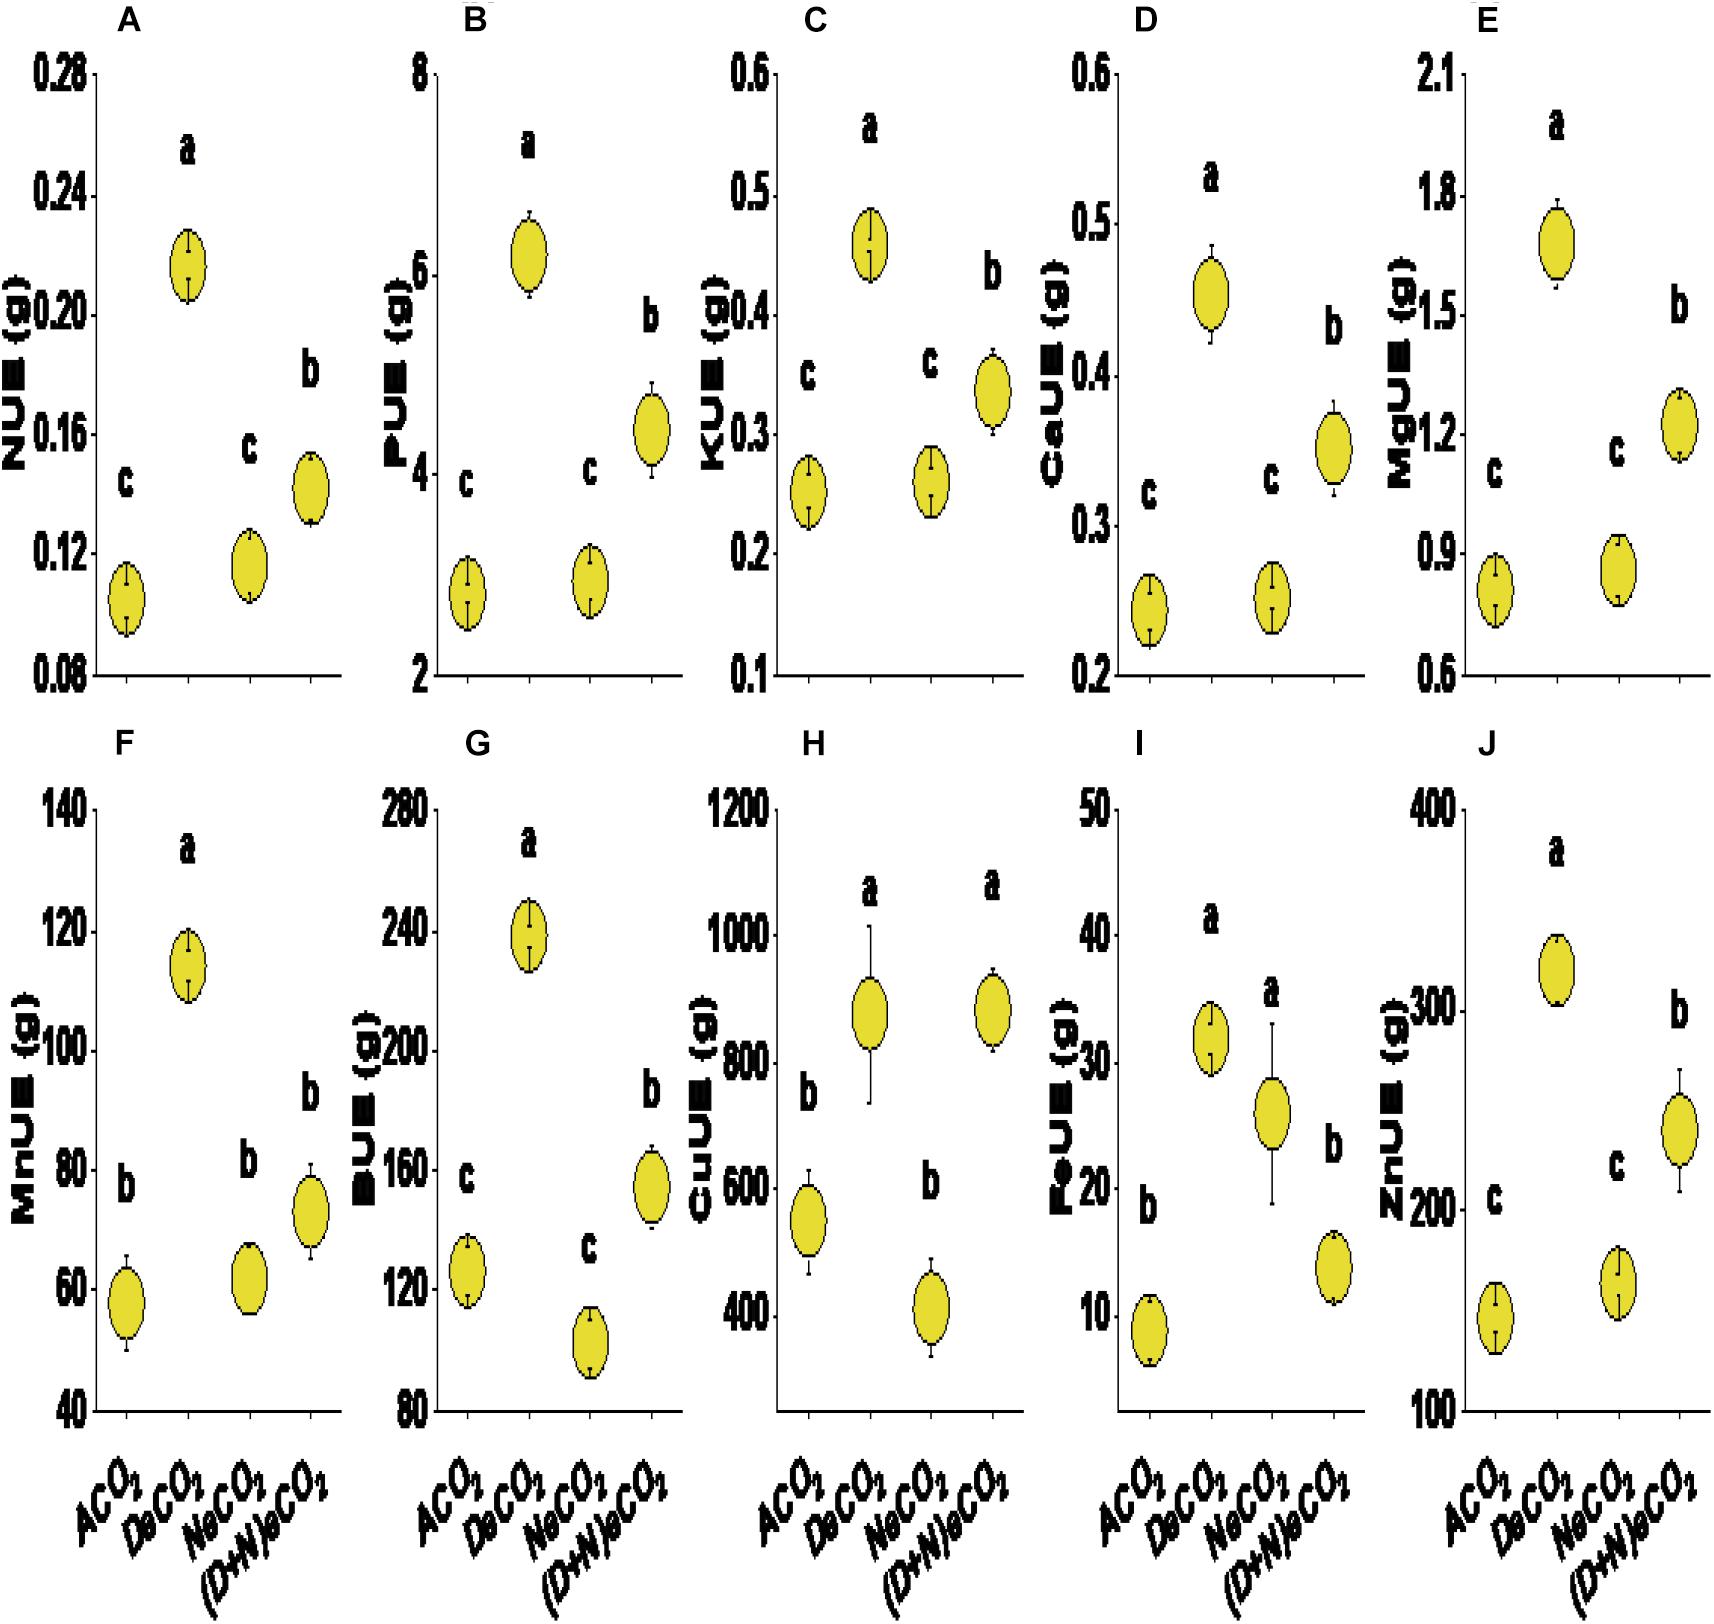
Figure 4. Nitrogen (N, A), phosphorus (P, B), potassium (K, C), calcium (Ca, D), magnesium (Mg, E), manganese (Mn, F), boron (B, G), copper (Cu, H), zinc (Zn, I) and iron (Fe, J) use efficiency in the leaves of mulberry seedlings grown for 120 days under different daytime and nighttime CO2 concentrations inside environmentally controlled glass growth chambers. Different letters indicate significant differences among CO2 treatments at P < 0.05. See treatment abbreviations in Figure 1; UE, use efficiency.
Leaf Quality Variables
eCO2 significantly increased the concentrations of leaf soluble sugar and starch by 13–28 and 31–35%, decreased the concentration of leaf fatty acid and protein by 26–31 and 5.0–6.0%, while it had no effects on the concentrations of leaf free amino acid (Figures 5A–E). However, changes in the accumulations of these leaf quality variables did not correspond to changes in their concentrations as affected by CO2 elevation. Compared with other two CO2 treatments, the accumulations of DeCO2 significantly increased leaf fatty acid, starch, soluble sugar, total free amino acid, and protein by 8–171% (Figures 5F–J). In general, significantly higher differences among CO2 treatments are ranked as DeCO2 > (D + N)eCO2 ≥ NeCO2 > ACO2 for leaf starch and soluble sugar content, asDeCO2 > ACO2 ≈ (D + N)eCO2 ≈ NeCO2 for leaf fatty acid content, and as DeCO2 > (D + N)eCO2 > NeCO2 ≈ ACO2 for leaf total free amino acid and protein content (Figures 5F–J).
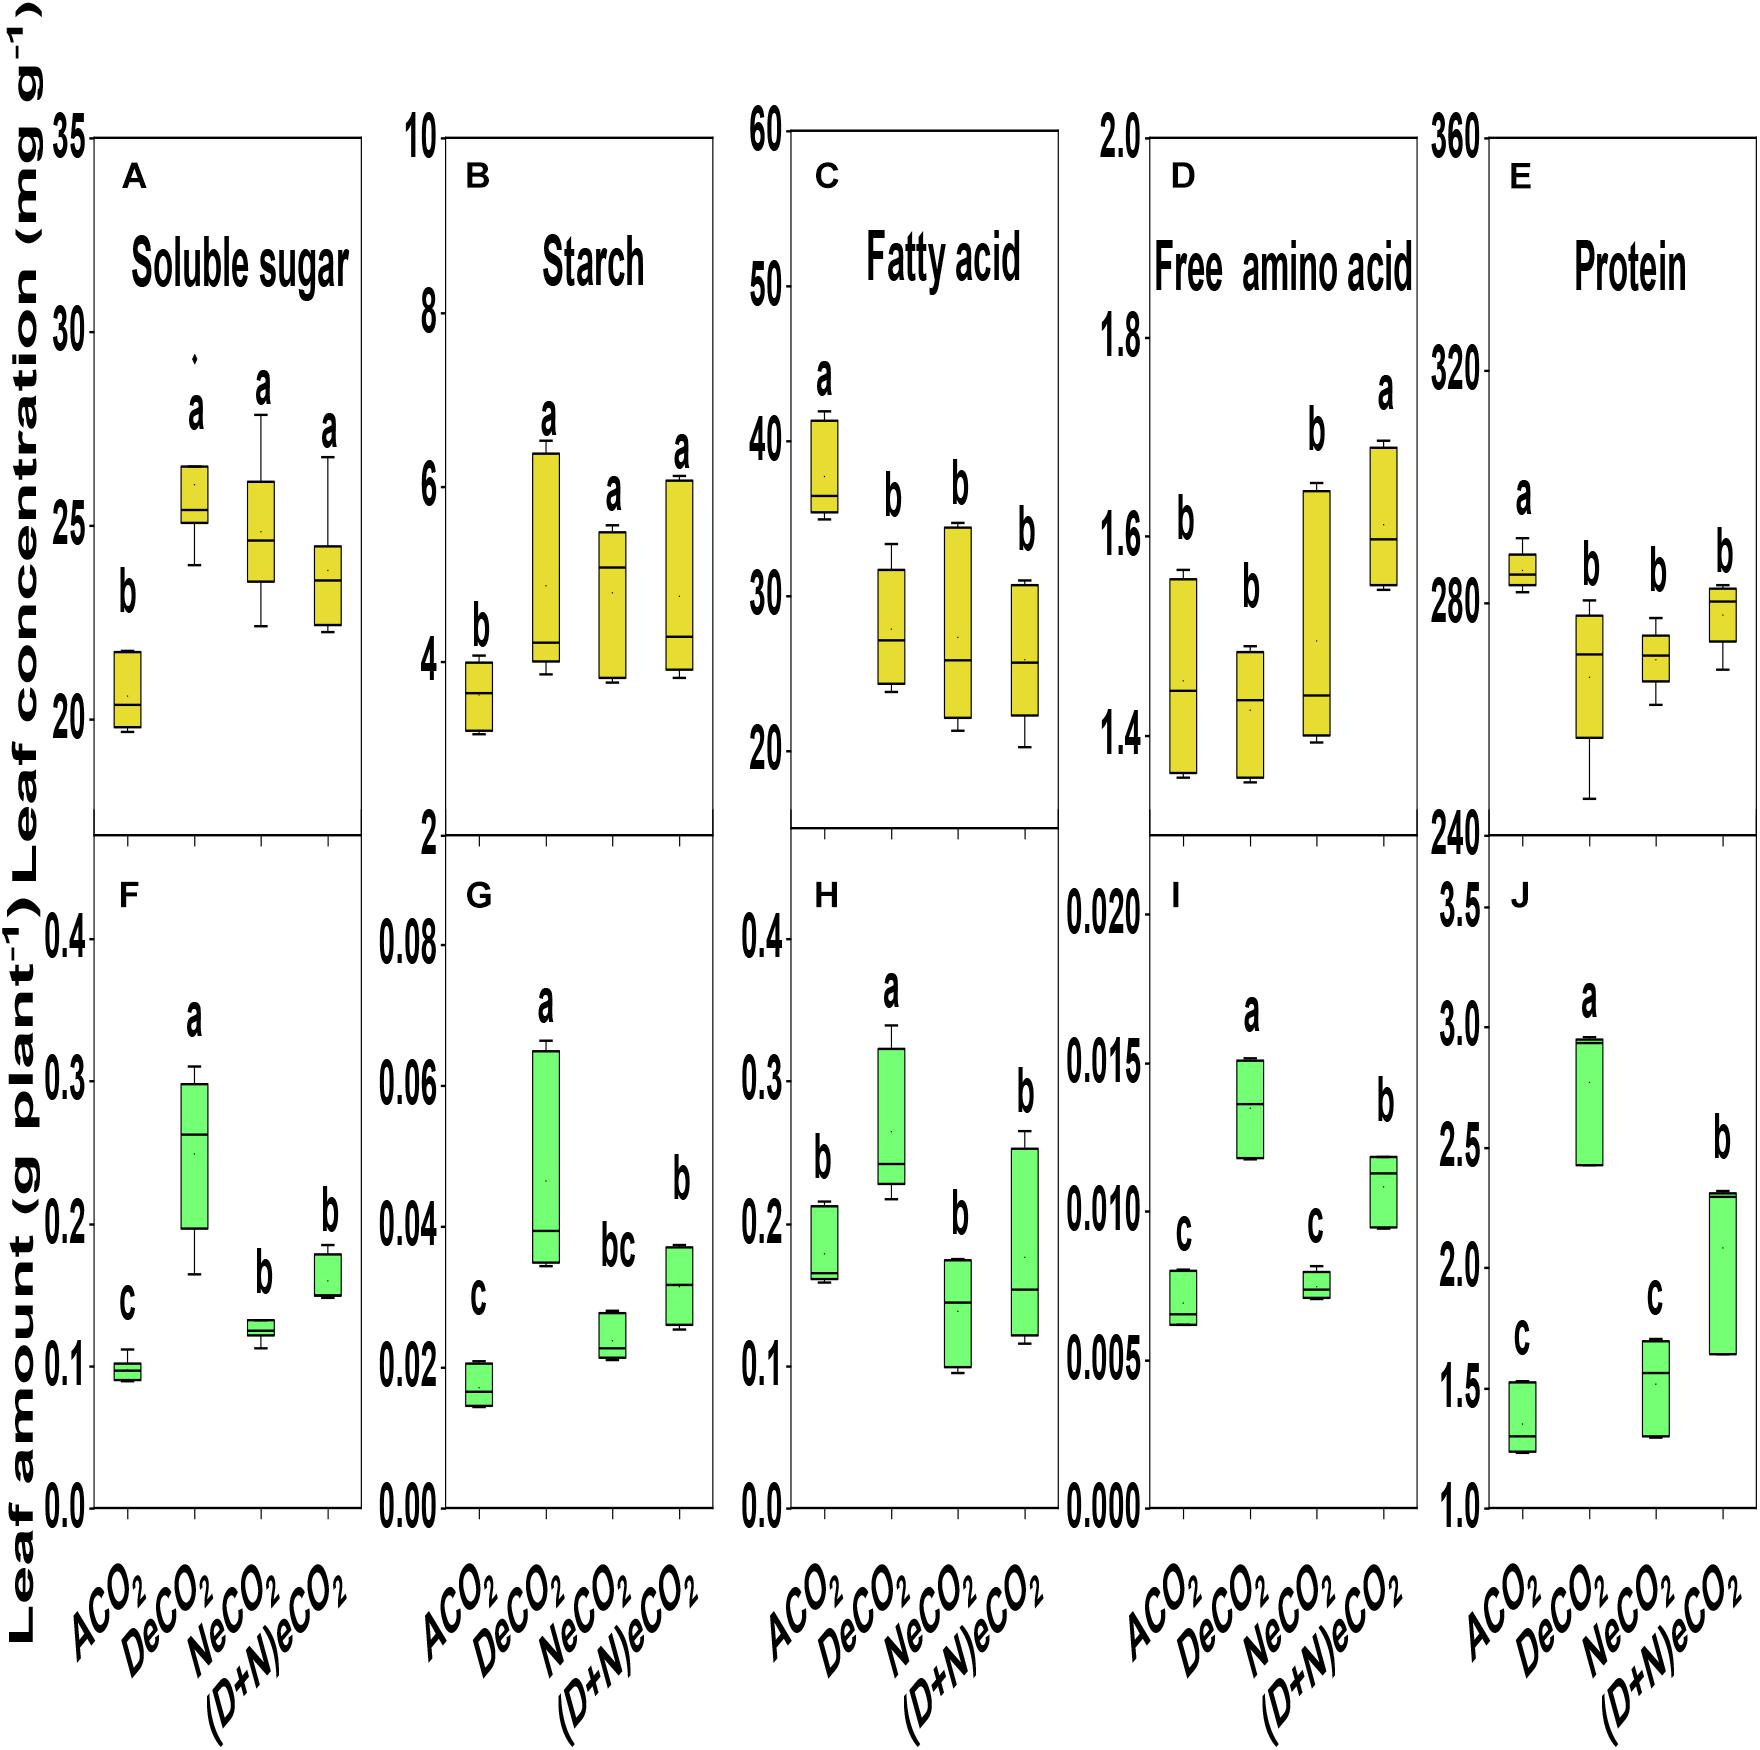
Figure 5. Concentrations and accumulations of leaf soluble sugar (A,F), starch (B,G), fatty acid (C,H), total free amino acid (D,I), and protein (E,J) of mulberry seedlings grown for 120 days under different daytime and nighttime CO2 concentrations inside environmentally controlled glass growth chambers. Different letters indicate significant differencesamong CO2 treatments at P < 0.05.
Discussion
Carbohydrate Accumulations
Carbohydrates in mulberry leaves are the major energy source for Bombyx mori L. (Horie, 1978). In the present study, leaf soluble sugar and starch in mulberry “Gui-sang-you 62” were, respectively, increased by 16 and 34% under 710/760 μmol mol–1 eCO2 (Figures 5F,G). Sekhar et al. (2014, 2015) found that 550/550 μmol mol–1 eCO2 triggered a remarkable increase in leaf total sugar in the mulberry genotypes of S13 and K2 by 23 and 19%, and starch by 30 and 35%, respectively. In addition, compared to S13, K2 had more total soluble sugars (12%) and starch (25%). These results showed that the effects of eCO2 varied from plant species to species. As a substrate for plant photosynthesis, eCO2 certainly affects the CO2 assimilation processes by increasing intercellular CO2 and carboxylation efficiency of Rubisco while reducing stomatal conductance and photorespiration (Sekhar et al., 2014, 2015; Li et al., 2017; Liu et al., 2019), leading to an accumulation of soluble sugar and starch. Interestingly, significant differences in the accumulation of carbohydrates were found in mulberry grown under altered daytime vs. nighttime, and continuous eCO2 treatment (Figures 5F,G). With low daytime CO2 and photosynthesis, NeCO2 could repress functionally important respiration and thus have important consequences for plant growth and yield production (Figure 2A; Bunce, 2002, 2014). When compared with soybean grown under 250/1,000 μmol mol–1 in NeCO2, their respiration was reduced, while photosynthesis was increased when grown under 1,000/1,000 μmol mol–1 (D + N)eCO2, resulting in an increased plant growth (Griffin et al., 1999). However, 710/760 μmol mol–1 (D + N)eCO2 did not result in such a large increase in mulberry biomass production and carbohydrate accumulation as these did under 710/460 μmol mol–1 DeCO2 (Figures 2, 5F,G). These results remain somewhat controversial with other previous outcomes from different plant species. For example, greater biomass in Acer rubrum and Glycine max but less biomass in Amaranthus retroflexus and Medicago sativa were observed when grown under 700/700 μmol mol–1 (D + N)eCO2 compared with under 700/350 μmol mol–1 DeCO2 (Bunce, 2003). Xanthium strumarium grown under 900/900 μmol mol–1 (D + N)eCO2 were greater than those grown under 900/350 μmol mol–1 DeCO2 (Reuveni et al., 1997). In contrast, total plant biomass production was similar, though seed yield was greater, when soybean was grown under 1,000/1,000 μmol mol–1 (D + N)eCO2 compared with under 1,000/250 μmol mol–1 DeCO2 (Griffin et al., 1999). Therefore, these varied results demonstrated that responses of plant performance to different daytime and/or nighttime eCO2 modulations are plant species dependent. With regard to the data presented in this paper, it seemed that the reduced respiration under high CO2 at nighttime had led to a reduced supply of energy-rich compounds including ATP and NADH (Bunce, 2001; Asensio et al., 2015), which could affect the energy required for N assimilation (Bloom et al., 2010; Asensio et al., 2015; Jauregui et al., 2015).
Accumulations of Nitrogen Compounds
Plant carbohydrate concentrations can influence the concentrations of other plant constituents such as nitrogen compounds and mineral content. Mulberry varieties possessing higher leaf N, amino acid, and protein are nutritiously superior to the growth and development of silkworm (Machii and Katagiri, 1991; Sujathamma and Dandin, 2000). Our results showed that eCO2 in daytime and/or nighttime decreased leaf N and protein concentrations (Figures 3F, 5I,J). The decline in N concentration could be caused by an inhibition of leaf N assimilation (Tcherkez et al., 2020). Jauregui et al. (2015) found that a combination of elevated temperature (4°C) and 700 μmol mol–1 CO2 inhibited the activity of leaf nitrate (NO3–) reductase and glutamine synthetase, leading to a decreased synthesis of leaf total amino acid and soluble protein in wheat. Nighttime eCO2 also decreased both NO3– assimilation and dark respiration in plants that relied on NO3– (Asensio et al., 2015). The inhibited nighttime respiration, carbohydrate translocation, and NO3– assimilation most likely explain the slower growth of plants exposed to eCO2 at night (Bunce, 2003; Asensio et al., 2015). Studies had found that the inhibition of leaf N assimilation under eCO2 is because of the reduction in photorespiration rates (Asensio et al., 2015; Jauregui et al., 2015). eCO2 decreases photorespiration and also the availability of NADH in the cytoplasm and thereby decreases the amount of reductant available for NO3– reduction (Bloom et al., 2002, 2010, 2012). The mechanism may also involve processes in the chloroplast stroma that competes for reduced ferredoxin since NO3– assimilation goes ahead only if the availability of reduced ferredoxin exceeds that which is required for the NADPH formation (Backhausen et al., 2000). Indeed, there was a decrease of 24–67% in leaf Fe concentration when plants were grown under eCO2 compared with that grown under ACO2 (Figure 3), while Fe is essential for a variety of ferredoxin relevant enzymes during the photosynthesis and N assimilation processes. Despite the decline in leaf N, amino acid, and protein concentrations, eCO2 did not markedly disturb the balance of C and N metabolism in plants (Figures 3A, 5D,E). Significantly positive linear relationships between leaf N, amino acid or protein accumulation, and biomass production also suggested that an increased plant biomass was associated with an enhanced plant N uptake and accumulation (Supplementary Figures S2B, S3D,E, R2 = 0.91–0.94, P < 0.001).
Accumulations of Mineral Elements
It is documented that plant responses to eCO2 have led to stomatal closure, which directly affects transpiration rates and therefore slows down the mass flow of nutrients (Taub and Wang, 2008; Houshmandfar et al., 2015). Soybeans under eCO2 did have a significantly lower daytime stomatal conductance than those under ACO2 (Griffin et al., 1999). The decline in leaf N concentration exposed to eCO2 (Figure 3) could therefore be due to such a decreased N transport from belowground to aboveground. Our results showed that either DeCO2 (710/460 μmol mol–1), NeCO2 (410/760 μmol mol–1), or (D + N)eCO2 (710/760 μmol mol–1) decreased the concentrations of leaf P, Mg, Fe, Cu, and Zn, but the reduction is the least in NeCO2 (Figure 3). Similar depletions in the nutritional status under eCO2 have been reported in a number of woody species including Quercus serrata and Quercus mongolica (Shi et al., 2016), Coffea arabica (Martins et al., 2014), Norway spruce (Marshall and Linder, 2013), and Larix kaempferi (Shinano et al., 2007). Such declines are very relevant to the plant physiological processes. Mg is essential for the formation of light-harvesting chlorophyll a/b complexes and an indicator of leaf greenness (Shaul, 2002; Teklic et al., 2009). Like the result in Figure 3, a lower leaf Mg was associated with a reduced chlorophyll in two mulberry genotypes (K2 and S13) under 550 μmol mol–1 eCO2 (Sekhar et al., 2014). In terms of Rubisco and chlorophyll, a reduction in Mg content under eCO2 has been proposed as a key response that underlines the importance of transpiration rates and xylem flux (Houshmandfar et al., 2015). More than half of cellular Fe and Cu are found in chloroplasts and participate in photosynthesis, mitochondrial respiration, and N metabolism (Hänsch and Mendel, 2009). As a component of enzymes for protein synthesis, a reduction in grain protein concentration of wheat was well correlated with Fe (R2 = 0.70) and Zn (R2 = 0.50) (Fernando et al., 2012). Overall, in this study, we found significant differences in leaf yield and harvest of nutritious compounds of mulberry grown under eCO2 at 710/460 μmol mol–1 DeCO2, 410/760 μmol mol–1 NeCO2, and 710/760 μmol mol–1 (D + N)eCO2, compared with plants grown under ACO2. We speculated that limited energy levels resulting from a reduced respiratory under NeCO2 could slow plant growth. When compared to DeCO2, (D + N)eCO2 reduced the concentrations of leaf Mg, Cu, and Zn, which associate to plant photosynthesis, mitochondrial respiration, and N metabolism. As a result, lower mulberry leaf yield and harvest of nutritious compounds were displayed under (D + N)eCO2 than under DeCO2, leading to a consequent poor leaf quantity and quality for silkworm.
Conclusion
This study showed that a positive response of mulberry growth and leaf quality to eCO2 was greater at daytime than at nighttime. Compared to ACO2, the amounts of leaf N, P, K, Ca, Mg, Mn, B, Cu, Fe, and Zn were significantly increased under either DeCO2 or (D + N)eCO2, except leaf Fe under NeCO2. Our results also showed that DeCO2 and (D + N)eCO2, not NeCO2, increased biomass production and thus the harvest of nutrients and accumulations of leaf carbohydrates (starch, soluble sugar, and fatty acid) and N-containing compounds (free amino acid and protein), though there were some decreases in the concentration of leaf N, P, Mg, Fe, and Zn. However, (D + N)eCO2 did not result in as large an increase in mulberry leaf yield and harvest of nutritious compounds for silkworm as did DeCO2. Although no significant effects on yield were observed under NeCO2, there was a positive effect on nutritional quality on leaf to an extent. In conclusion, a positive effect of eCO2 on plant biomass production would require an increased nutrient uptake for the synthesis of leaf carbohydrate fatty acid and N-containing compound accumulation. Higher nutrient demand is ranked as DeCO2 > (D + N)eCO2 > NeCO2. The depletion of leaf N, P, Mg, Fe, and Zn, and fatty acid, amino acid, and protein concentrations in mulberry leaves under eCO2 would certainly affect the growth and thus the quality and quantity of cocoons. Therefore, a rational input of external essential elements, particularly N, P, Fe, Mg, and Zn is vital to meet the nutritional requirements of mulberry trees under future CO2 elevation.
Data Availability Statement
The original contributions presented in the study are included in the article/Supplementary Material, further inquiries can be directed to the corresponding author/s.
Author Contributions
XX and XH conceived and designed the experiments. SS, YQ, MW, XD, and CX performed the pot experiments and collected the samples. SS, YQ, and MW were responsible for the determination of the leaf quality parameters. XH, SS, and XX provided fund support. XD analyzed the mineral element data with the help of CX. SS and YQ wrote the manuscript. All authors have read and approved the final manuscript.
Funding
This study was jointly supported by the National Youth Natural Science Foundation of China (4111800096), the Science and Technology Department of Sichuan Province, China (2018JZ0027), the National Base of International S&T Collaboration on Water Environmental Monitoring and Simulation in the Three Gorges Reservoir Region, Chongqing 400716, the China, Biological Science Research Center at Southwest University (100030/2120054019), and the Chongqing Key Laboratory of Plant Resource Conservation and Germplasm Innovation, China.
Conflict of Interest
The authors declare that the research was conducted in the absence of any commercial or financial relationships that could be construed as a potential conflict of interest.
Supplementary Material
The Supplementary Material for this article can be found online at: https://www.frontiersin.org/articles/10.3389/fpls.2020.609031/full#supplementary-material
Footnotes
References
Ahammed, G. J., Li, X., Liu, A., and Chen, S. (2020). Physiological and defense responses of tea plants to elevated CO2: a review. Front. Plant. Sci. 11:305.
Amthor, J. S. (2001). Effects of atmospheric CO2 concentration on wheat yield: review of results from experiments using various approaches to control CO2 concentration. Field Crops Res. 73, 1–34. doi: 10.1016/s0378-4290(01)00179-4
Amthor, J. S., Koch, G. W., and Bloom, A. J. (1992). CO2 inhibits respiration in leaves of Rumex crispus L. Plant Physiol. 98, 98757–98760.
Asensio, J. S., Rachmilevitch, S., and Bloom, A. J. (2015). Responses of Arabidopsis and wheat to rising CO2 depend on nitrogen source and nighttime CO2 levels. Plant Physiol. 168, 156–163. doi: 10.1104/pp.15.00110
Backhausen, J. E., Kitzman, C., Horton, P., and Scheibe, R. (2000). Electron acceptors in isolated intact spinach chloroplasts act heirarchically to prevent over–reduction and competition for electrons. Photosynthesis Res. 64, 1–13. doi: 10.1023/A:1026523809147
Baslam, M., Garmendia, I., and Goicoechea, N. (2012). Elevated CO2 may impair the beneficial effect of arbuscular mycorrhizal fungi on the mineral and phytochemical quality of lettuce. Ann. Appl. Biol. 161, 180–191. doi: 10.1111/j.1744-7348.2012.00563.x
Bloom, A. J., Asensio, J. S. R., Randall, L., Rachmilevitch, S., Cousins, A. B., and Carlisle, E. A. (2012). CO2 enrichment inhibits shoot nitrate assimilation in C3 but not C4 plants and slows growth under nitrate in C3 plants. Ecology 93, 355–367. doi: 10.1890/11-0485.1
Bloom, A. J., Burger, M., Asensio, J. S. R., and Cousins, A. B. (2010). Carbon dioxide enrichment inhibits nitrate assimilation in wheat and Arabidopsis. Science 328, 899–903. doi: 10.1126/science.1186440
Bloom, A., Smart, D., Nguyen, D., and Searles, P. (2002). Nitrogen assimilation and growth of wheat under elevated carbon dioxide. Proc. Natl. Acad. Sci. USA 99, 1730–1735. doi: 10.1073/pnas.022627299
Bunce, J. A. (1995). Effects of elevated carbon dioxide concentration in the dark on the growth of soybean seedlings. Ann. Bot. 75, 365–368. doi: 10.1006/anbo.1995.1034
Bunce, J. A. (2001). Effects of prolonged darkness on the sensitivity of leaf respiration to carbon dioxide concentration in C3 and C4 species. Ann. Bot. 87, 463–468. doi: 10.1006/anbo.2000.1358
Bunce, J. A. (2002). Carbon dioxide concentration at night affects translocation from soybean leaves. Ann. Bot. 90, 399–403. doi: 10.1093/aob/mcf203
Bunce, J. A. (2003). Responses of seedling growth to daytime or continuous elevation of carbon dioxide. Int. J. Plant Sci. 164, 377–382. doi: 10.1086/374195
Bunce, J. A. (2014). Carbon dioxide concentration at night affects translocation from soybean leaves. Crop Sci. 90, 1744–1747.
Butt, M. S., Nazir, A., Sultan, M. T., and Schroën, K. (2008). Morus alba L. nature’s functional tonic. Trends Food Sci. Tech. 19, 505–512. doi: 10.1016/j.tifs.2008.06.002
Carvalho, J. M., Barreto, R. F., Prado, R. D. M., Habermann, E., Martinez, C. A., and Branco, R. B. F. (2020). Elevated [CO2] and warming increase the macronutrient use efficiency and biomass of Stylosanthes capitata vogel under field conditions. J. Agro. Crop Sci. 206, 1–10.
Cheng, W., Yagi, K., Sakai, H., and Kobayashi, K. (2006). Effects of elevated atmospheric CO2 concentrations on CH4 and N2O emission from rice soil: an experiment in controlled-environment chambers. Biogeochemistry 77, 351–373. doi: 10.1007/s10533-005-1534-2
Chumley, H., and Hewlings, S. (2020). The effects of elevated atmospheric carbon dioxide [CO2] on micronutrient concentration, specifically iron (Fe) and zinc (Zn) in rice; a systematic review. J. Plant Nutr. 43, 1571–1578. doi: 10.1080/01904167.2020.1739303
Dietterich, L. H., Zanobetti, A., Kloog, I., Huybers, P., Leakey, A. D., Bloom, A. J., et al. (2015). Impacts of elevated atmospheric CO2 on nutrient content of important food crops. Sci. Data. 2:150036.
Dong, J., Gruda, N., Li, X., Tang, Y., Zhang, P., and Duan, Z. (2020). Sustainable vegetable production under changing climate: the impact of elevated CO2 on yield of vegetables and the interactions with environments-a review. J. Clean. Prod. 253:119920. doi: 10.1016/j.jclepro.2019.119920
Drag, D. W., Slattery, R., Siebers, M., Delucia, E. H., Ort, D. R., and Bernacchi, C. J. (2020). Soybean photosynthetic and biomass responses to carbon dioxide concentrations ranging from pre-industrial to the distant future. J. Exp. Bot. 71, 3690–3700. doi: 10.1093/jxb/eraa133
Fernando, N., Panozzo, J., Tausz, M., Norton, R., Fitzgerald, G., and Seneweera, S. (2012). Rising atmospheric CO2 concentration affects mineral nutrient and protein concentration of wheat grain. Food Chem. 133, 1307–1311. doi: 10.1016/j.foodchem.2012.01.105
Freijer, J., and Bouten, W. (1991). A comparison of field methods for measuring soil carbon dioxide evolution: experiments and simulation. Plant Soil 135, 133–142. doi: 10.1007/bf00014786
Gao, J. F. (2006). Experimental Guidance for Plant Physiology. Beijing: Higher Education Press, 149–150.
Griffin, K., Sims, D., and Seemann, J. (1999). Altered night-time CO2 concentration affects the growth, physiology and biochemistry of soybean. Plant Cell Environ. 22, 91–99. doi: 10.1046/j.1365-3040.1999.00398.x
Guha, A., Sengupta, D., and Reddy, A. R. (2010). Physiological optimality, allocation trade-offs and antioxidant protection linked to better leaf yield performance in drought exposed mulberry. J. Sci. Food Agric. 90, 2649–2659. doi: 10.1002/jsfa.4135
Hänsch, R., and Mendel, R. R. (2009). Physiological functions of mineral micronutrients (Cu, Zn, Mn, Fe, Ni, Mo, B, Cl). Curr. Opin. Plant Biol. 12, 259–266. doi: 10.1016/j.pbi.2009.05.006
Högy, P., Franzaring, J., Schwadorf, K., Breuer, J., Schütze, W., and Fangmeier, A. (2010). Effects of free-air CO2 enrichment on energy traits and seed quality of oilseed rape. Agr. Ecosyst. Environ. 139, 239–244. doi: 10.1016/j.agee.2010.08.009
Horie, T., Nakagawa, H., Nakano, J., Hamotani, K., and Kim, H. (1995). Temperature gradient chambers for research on global environment change. III. a system designed for rice in Kyoto, Japan. Plant Cell Environ. 18, 1064–1069. doi: 10.1111/j.1365-3040.1995.tb00618.x
Horie, Y. (1978). Quantitative requirement of nutrients for growth of the silkworm, Bombyx mori L. JARQ 12, 211–217.
Houshmandfar, A., Fitzgerald, G. J., and Tausz, M. (2015). Elevated CO2 decreases both transpiration flow and concentrations of Ca and Mg in the xylem sap of wheat. J. Plant Physiol. 174, 157–160. doi: 10.1016/j.jplph.2014.10.008
IPCC, (2014). Climate Change 2014: Synthesis Report. Contribution of Working Groups I, II and III to the Fifth Assessment Report of the Intergovernmental Panel on Climate Change. Geneva: IPCC.
Jakobsen, I., Smith, S. E., Smith, F. A., Watts-Williams, S. J., Clausen, S. S., and Gronlund, M. (2016). Plant growth responses to elevated atmospheric CO2 are increased by phosphorus sufficiency but not by arbuscular mycorrhizas. J. Exp. Bot. 67, 6173–6186. doi: 10.1093/jxb/erw383
Jauregui, I., Aroca, R., Garnica, M., Zamarreno, A. M., Garcia-Mina, J. M., Serret, M. D., et al. (2015). Nitrogen assimilation and transpiration: key processes conditioning responsiveness of wheat to elevated [CO2] and temperature. Physiol. Plant. 155, 338–354. doi: 10.1111/ppl.12345
Jin, J., Armstrong, R., and Tang, C. (2019). Impact of elevated CO2 on grain nutrient concentration varies with crops and soils-a long-term FACE study. Sci. Total Environ. 651, 2641–2647. doi: 10.1016/j.scitotenv.2018.10.170
Kohler, I. H., Huber, S. C., Bernacchi, C. J., and Baxter, I. R. (2019). Increased temperatures may safeguard the nutritional quality of crops under future elevated CO2 concentrations. Plant J. 97, 872–886. doi: 10.1111/tpj.14166
Kuzyakov, Y., Horwath, W. R., Dorodnikov, M., and Blagodatskaya, E. (2019). Review and synthesis of the effects of elevated atmospheric CO2 on soil processes: no changes in pools, but increased fluxes and accelerated cycles. Soil Biol. Biochem. 128, 66–78. doi: 10.1016/j.soilbio.2018.10.005
Lawlor, D., and Mitchell, R. (1991). The effects of increasing CO2 on crop photosynthesis and productivity: a review of field studies. Plant Cell Environ. 14, 807–818. doi: 10.1111/j.1365-3040.1991.tb01444.x
Li, D., Dong, T., Zhang, C., Huang, G., Liu, G., and Xu, X. (2019). Effects of elevated temperature and CO2 concentration on floral development and sex differentiation in Morus alba L. Ann. For. Sci. 76:112.
Li, H. S. (2000). The Experiment Principle and Technique on Plant Physiology and Biochemistry. Beijing: Higher Education Press, 78–102.
Li, X., Zhang, L., Ahammed, G. J., Li, Z. X., Wei, J. P., Shen, C., et al. (2017). Stimulation in primary and secondary metabolism by elevated carbon dioxide alters green tea quality in Camellia sinensis L. Sci. Rep. 7:7937. doi: 10.1038/s41598-017-08465-1
Liu, X., Zhang, H., Wang, J., Wu, X., Ma, S., Xu, Z., et al. (2019). Increased CO2 concentrations increasing water use efficiency and improvement PSII function of mulberry seedling leaves under drought stress. J. Plant Interact. 14, 213–223.
Loladze, I. (2014). Hidden shift of the ionome of plants exposed to elevated CO2 depletes minerals at the base of human nutrition. eLife 3:e02245.
Machii, H., and Katagiri, K. (1991). Varietal differences in nutritive values of mulberry leaves for rearing silkworms. Jarq-japan Agr. Res. Q. 25, 202–208.
Maillard, P., Guehl, J.-M., Muller, J.-F., and Gross, P. (2001). Interactive effects of elevated CO2 concentration and nitrogen supply on partitioning of newly fixed 13C and 15N between shoot and roots of pedunculate oak seedlings (Quercus robur). Tree Physiol. 21, 163–172. doi: 10.1093/treephys/21.2-3.163
Marshall, J. D., and Linder, S. (2013). Mineral nutrition and elevated [CO2] interact to modify δ13C, an index of gas exchange, in norway spruce. Tree Physiol. 33, 1132–1144. doi: 10.1093/treephys/tpt004
Martins, L. D., Tomaz, M. A., Lidon, F. C., Damatta, F. M., and Ramalho, J. C. (2014). Combined effects of elevated [CO2] and high temperature on leaf mineral balance in Coffea spp. plants. Clim. Change 126, 365–379. doi: 10.1007/s10584-014-1236-7
Norby, R. J., and Zak, D. R. (2011). Ecological lessons from free-air CO2 enrichment (FACE) experiments. Ann. Rev. Ecol. Evolu. Syst. 42, 181–203. doi: 10.1146/annurev-ecolsys-102209-144647
Papanastasis, V. P., Yiakoulaki, M. D., Decandia, M., and Dini-Papanastasi, O. (2008). Integrating woody species into livestock feeding in the mediterranean areas of Europe. Anim. Feed Sci. Tech. 140, 1–17. doi: 10.1016/j.anifeedsci.2007.03.012
Park, H.-J., Lim, S.-S., Kwak, J.-H., Lee, K.-S., In Yang, H., Kim, H.-Y., et al. (2020). Biomass, chemical composition, and microbial decomposability of rice root and straw produced under co-elevated CO2 and temperature. Biol. Fert. Soils 3, 1–15.
Poorter, H., Gifford, R. M., Kriedemann, P. E., and Wong, S. C. (1992). A quantitative-analysis of dark respiration and carbon content as factors in the growth-response of plants to elevated CO2. Aust. J. Bot. 40, 501–513. doi: 10.1071/bt9920501
Radojkovic, M., Zekovic, Z., Dojcinovic, B., Stojanovic, Z., Cvetanovic, A., and Manojlovic, D. (2014). Characterization of Morus species in respect to micro, macro, and toxic elements. Acta Periodica Technologica 45, 229–237. doi: 10.2298/apt1445229r
Reuveni, J., Gale, J., and Zeroni, M. (1997). Differentiating day from night effects of high ambient [CO2] on the gas exchange and growth of Xanthium strumarium L. exposed to salinity stress. Ann. Bot. 79, 191–196.
Salazar-Parra, C., Aranjuelo, I., Pascual, I., Erice, G., Sanz-Sáez, Á, Aguirreolea, J., et al. (2015). Carbon balance, partitioning and photosynthetic acclimation in fruit-bearing grapevine (Vitis vinifera L. cv. Tempranillo) grown under simulated climate change (elevated CO2, elevated temperature and moderate drought) scenarios in temperature gradient greenhouses. J. Plant Physiol. 174, 97–109. doi: 10.1016/j.jplph.2014.10.009
Sekhar, K. M., Sreeharsha, R. V., and Reddy, A. R. (2015). Differential responses in photosynthesis, growth and biomass yields in two mulberry genotypes grown under elevated CO2 atmosphere. J. Photoch. Photobio. B. 151, 172–179. doi: 10.1016/j.jphotobiol.2015.08.008
Sekhar, K. M., Sreeharsha, R. V., Mudalkar, S., and Reddy, A. R. (2014). Persistent stimulation of photosynthesis in short rotation coppice mulberry under elevated CO2 atmosphere. J Photoch. Photobio. B. 137, 21–30. doi: 10.1016/j.jphotobiol.2014.05.001
Shaul, O. (2002). Magnesium transport and function in plants: the tip of the iceberg. BioMetals 15, 309–323. doi: 10.1023/A:1016091118585
Shi, C., Kitao, M., Agathokleous, E., Watanabe, M., Tobita, H., Yazaki, K. I., et al. (2016). Foliar chemical composition of two oak species grown in a free-air enrichment system with elevated O3 and CO2. J. Agric. Meteorol. 72, 50–58. doi: 10.2480/agrmet.d-14-00018
Shinano, T., Yamamoto, T., Tawaraya, K., Tadokoro, M., Koike, T., and Osaki, M. (2007). Effects of elevated atmospheric CO2 concentration on the nutrient uptake characteristics of Japanese larch (Larix kaempferi). Tree Physiol. 27, 97–104. doi: 10.1093/treephys/27.1.97
Singh, A. K., Rai, A., Kushwaha, M., Chauhan, P. S., Pandey, V., and Singh, N. (2019). Tree growth rate regulate the influence of elevated CO2 on soil biochemical responses under tropical condition. J. Environ. Manag. 231, 1211–1221. doi: 10.1016/j.jenvman.2018.11.025
Sujathamma, P., and Dandin, S. B. (2000). Leaf quality evaluation of mulberry (Morus spp.) genotypes through chemical analysis. Indian J. Seric. 39, 117–121.
Taub, D. R., and Wang, X. (2008). Why are nitrogen concentrations in plant tissues lower under elevated CO2? a critical examination of the hypotheses. J. Integr. Plant Biol. 50, 1365–1374. doi: 10.1111/j.1744-7909.2008.00754.x
Tcherkez, G., Ben Mariem, S., Larraya, L., Garcia-Mina, J. M., Zamarreno, A. M., Paradela, A., et al. (2020). Despite minimal effects on yield, elevated CO2 has concurrent effects on leaf and grain metabolism in wheat. J. Exp. Bot. 71:eraa330.
Teklic, T., Vrataric, M., Sudaric, A., Kovacevic, V., Vukadinovic, V., and Bertic, B. (2009). Relationships among chloroplast pigments concentration and chlorophyllmeter readings in soybean under influence of foliar magnesium application. Commun. Soil Sci. Plant Anal. 40, 706–725. doi: 10.1080/00103620802697939
Xiao, L., Liu, G.-B., and Xue, S. (2016). Elevated CO2 concentration and drought stress exert opposite effects on plant biomass, nitrogen, and phosphorus allocation in bothriochloa ischaemum. J. Plant Growth Regul. 35, 1088–1097. doi: 10.1007/s00344-016-9606-1
Yang, J., Wang, C., and Dai, H. (2008). Soil Agrochemical Analysis and Environmental Monitoring Techniques. Beijing: Chinese Dadi Press, 18–64.
Keywords: biomass production, CO2 enrichment, free amino acid, mineral elements, nutrient use efficiency
Citation: Shi S, Qiu Y, Wen M, Xu X, Dong X, Xu C and He X (2021) Daytime, Not Nighttime, Elevated Atmospheric Carbon Dioxide Exposure Improves Plant Growth and Leaf Quality of Mulberry (Morus alba L.) Seedlings. Front. Plant Sci. 11:609031. doi: 10.3389/fpls.2020.609031
Received: 22 September 2020; Accepted: 22 December 2020;
Published: 04 February 2021.
Edited by:
Chunwu Zhu, Institute of Soil Science (CAS), ChinaReviewed by:
Vijayan Kunjupillai, Central Silk Board, IndiaJinlong Dong, Institute of Soil Science (CAS), China
Copyright © 2021 Shi, Qiu, Wen, Xu, Dong, Xu and He. This is an open-access article distributed under the terms of the Creative Commons Attribution License (CC BY). The use, distribution or reproduction in other forums is permitted, provided the original author(s) and the copyright owner(s) are credited and that the original publication in this journal is cited, in accordance with accepted academic practice. No use, distribution or reproduction is permitted which does not comply with these terms.
*Correspondence: Xinhua He, xinhua.he@uwa.edu.au
†These authors have contributed equally to this work