 Krishna Kishore Gali1
 Bunyamin Tar’an1
 Mohammed-Amin Madoui2Edwin van der Vossen3Jan van Oeveren3
 Karine Labadie3
 Helene Berges4
 Abdelhafid Bendahmane5
 Reddy V. B. Lachagari6Judith Burstin7
 Tom Warkentin1*
- 1Crop Development Centre, University of Saskatchewan, Saskatoon, SK, Canada
- 2Atomic Energy and Alternative Energies Commission (CEA), Genomics Institute (IG), Évry, France
- 3Keygene N.V., Wageningen, Netherlands
- 4INRA-CNRGV, Castanet-Tolosan, France
- 5INRA/CNRS – URGV, Évry, France
- 6AgriGenome Labs Pvt. Ltd., BTIC, MN iHub, Shamirpet, India
- 7J. Burstin, INRA, UMRLEG, Dijon, France
Whole genome profiling (WGP) is a sequence-based physical mapping technology and uses sequence tags generated by next generation sequencing for construction of bacterial artificial chromosome (BAC) contigs of complex genomes. The physical map provides a framework for assembly of genome sequence and information for localization of genes that are difficult to find through positional cloning. To address the challenges of accurate assembly of the pea genome (∼4.2 GB of which approximately 85% is repetitive sequences), we have adopted the WGP technology for assembly of a pea BAC library. Multi-dimensional pooling of 295,680 BAC clones and sequencing the ends of restriction fragments of pooled DNA generated 1,814 million high quality reads, of which 825 million were deconvolutable to 1.11 million unique WGP sequence tags. These WGP tags were used to assemble 220,013 BACs into contigs. Assembly of the BAC clones using the modified Fingerprinted Contigs (FPC) program has resulted in 13,040 contigs, consisting of 213,719 BACs, and 6,294 singleton BACs. The average contig size is 0.33 Mbp and the N50 contig size is 0.62 Mbp. WGPTM technology has proved to provide a robust physical map of the pea genome, which would have been difficult to assemble using traditional restriction digestion based methods. This sequence-based physical map will be useful to assemble the genome sequence of pea. Additionally, the 1.1 million WGP tags will support efficient assignment of sequence scaffolds to the BAC clones, and thus an efficient sequencing of BAC pools with targeted genome regions of interest.
Introduction
Field pea (Pisum sativum L.) is an important grain legume crop, which was domesticated ∼7000 years ago (Ambrose, 1995; Abbo et al., 2010). The crop is valuable both for human nutrition and as animal feed. Gregor Mendel, the father of genetics, used pea as a model plant to uncover the fundamental principles of inheritance mainly because of the easily observable phenotypes and genotypes. However, understanding of quantitative traits and use of genomic tools for breeding is partly restricted by the large expected genome size of 3,947 to 4,397 Mbp/1C (Arumuganathan and Earle, 1991) and the occurrence of highly repetitive sequences in the pea genome. It is estimated that ∼85% of the pea genome is of repetitive sequences (Murray et al., 1978). The majority of pea repetitive DNA is made of LTR retrotransposons, which alone were estimated to contribute to 20–33% of the genome (Macas et al., 2007). In the current study, we have undertaken construction of a sequence-based physical map of pea to address the challenge in the assembly of these repetitive sequences and overcome the shortcomings of traditional restriction digestion based physical maps.
Whole genome profiling (WGP) is a sequence-based physical mapping technology for construction of bacterial artificial chromosome (BAC) contigs of complex genomes (van Oeveren et al., 2011). WGP technology is based on generation of short sequence tags from terminal ends of restriction fragments of individual BAC clones, followed by assembly of BAC clones into contigs based on shared regions containing identical sequence tags. WGP is designed based on the use of sequence tags generated by next generation sequencing (NGS) and is a powerful alternative to traditional DNA fingerprinting based physical mapping technologies, and also simultaneously generates a partial genome sequence. Two-dimensional or multi-dimensional BAC clone pooling is an effective strategy for DNA preparation and sequencing to reduce the costs of sample preparation. The sequence-based physical map also provides information for localization of genes that are difficult to find through positional cloning. WGP was initially tested in Arabidopsis thaliana by using ∼6,100 BAC clones and the assembly order of BAC contigs was verified with the genome sequence, wherein 98% of the BAC clones were assembled correctly (van Oeveren et al., 2011). Following this validation, WGP was used to generate sequence-based physical maps and genome assembly of ∼30 crop species (Ariyadasa and Stein, 2012; Sierro et al., 2013). WGP has been used for generation of physical maps of some individual wheat chromosomes, whose sequences are highly complex and repetitive (Philippe et al., 2012; Poursarebani et al., 2014). Recently, WGP technology was adopted by the International Wheat Genome Sequencing Consortium to generate new sequence information that will improve the quality and utility of physical maps for 15 chromosomes1. To address the challenges of accurate assembly of the massive and complex pea genome, we as part of international pea genome sequencing consortium adopted in the current study the WGP technology for assembly of pea BAC clones into a physical map.
Materials and Methods
BAC Libraries
A total of 295,680 BAC clones derived from pea cv. Cameor available at the CNRGS, Toulouse, France, with an average insert size of 95 Kb and approximately 6.7-fold genome coverage were used to construct a sequence-based physical map2.
Whole Genome Profiling
Generation of BAC Sequence Tags
The BAC clones were subjected to WGP as described by van Oeveren et al. (2011). Pooling of BAC clones and DNA extraction was done by Amplicon Express (Pullman, WA, United States). BAC clones stored in 384-well plates were pooled in a three-dimensional format, into row, column, and split-box pools, with each pool type consisting of 48, 48 and 64 clones, respectively. Illumina grade BAC DNA (high concentration and low E. coli) was extracted from the pooled BAC clones using an optimized alkaline lysis method. The DNA was digested with HindIII and MseI restriction enzymes, ligated with Illumina adaptor sequences containing barcode sequences as sample identification tags and were PCR amplified. The PCR products were pooled, cluster amplified and amplicons were then sequenced from the HindIII restriction site end using the Illumina HiSeq2000 with 100 nt read length. The reads were processed for identification of barcodes and assigned to BAC pools followed by deconvolution, a process to assign sequence reads as WGP tags to individual BAC clones. Deconvolution was successful when the WGP tag was detected in exactly one of each of the three dimensions of the BAC pools. WGP tags were filtered for sequencing quality and used for contig analysis.
Physical Map Construction
A total of 825 million sequence tags were generated by WGP, of which 1.11 million tags were unique (Supplementary Table S1) and corresponded to 220,013 BACs (Supplementary Table S2). The unique sequence tags were used for construction of the physical map. These sequences tagged BACs were used to generate SuperBACs, by grouping all individual BACs with 75% or more similarity, using an improved version of Fingerprinted Contigs Software (FPC; KeygeneTM). FPC was initially developed for analyzing BAC restriction fragment based fingerprint data (Soderlund et al., 1997), and the improved version is capable of processing sequence-based BAC fingerprint data. WGP tags from all the grouped BACs were assigned to the SuperBACs. WGP tags were converted into numbers to yield pseudo restriction fragment sizes for analysis using FPC to generate contigs based on BAC clone overlap. The genome coverage of BAC clones, mean contig size, and N50 contig size were calculated in million base pairs (Mbp) by multiplying FPC band units and the mean distance between two WGP tags.
Results
WGP Tag Generation
Multi-dimensional pooling of the 295,680 BAC clones and sequencing the ends of restriction fragments of pooled DNA generated 825 million deconvolutable reads, which constituted 45.5% of the total number of 1814 million high quality reads sequenced (Table 1). The deconvolutable reads yielded 1.11 million unique WGP tags and the average number of reads per tag was 96.6. The first 51 nucleotide sequence of the unique sequence tags are presented in Supplementary Table S1. These WGP tags were tagged to 220,013 BACs (Supplementary Table S2) with an average of 28.7 tags generated per BAC.
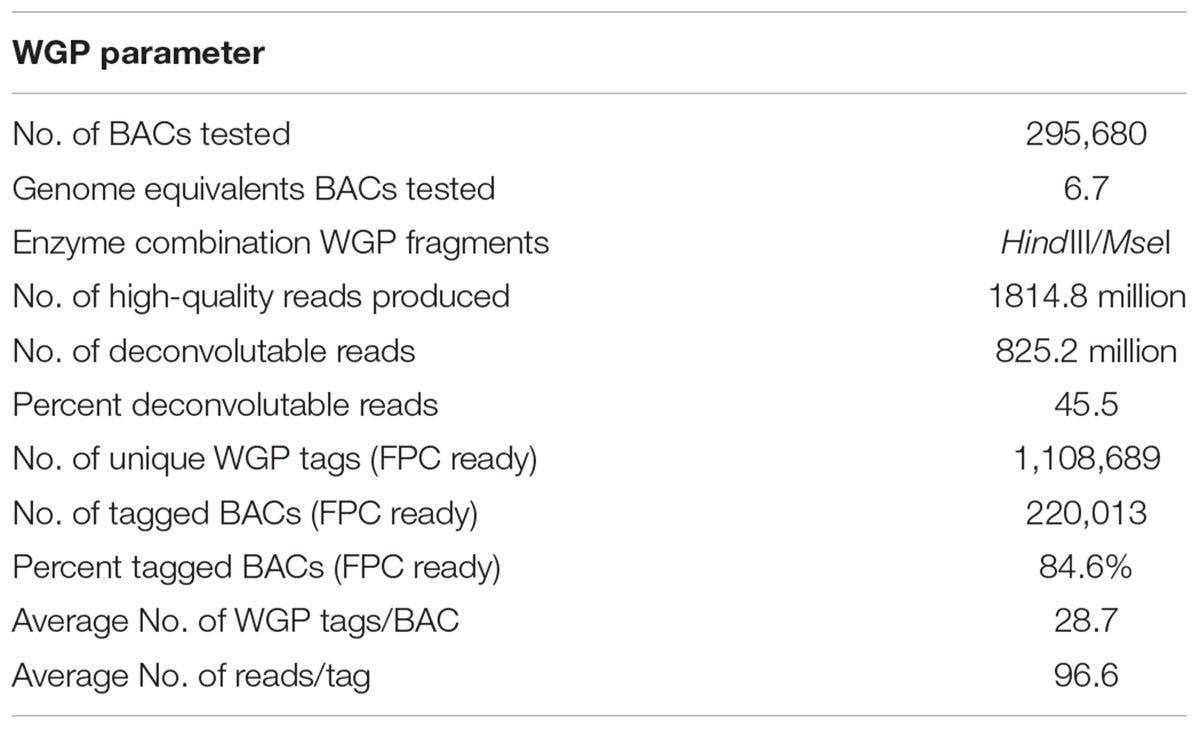
Table 1. Summary of whole genome profiling (WGP) input parameters and sequence data processing.
Physical Map Construction
The WGP tag data of 1.11 million tags tagged to 220,013 BAC clones was used to assemble individual BAC clones into contigs and superBACs using the modified FPC software (Keygene N.V.), capable of processing sequence-based BAC fingerprint data instead of fragment mobility information as used in the original FPC software (Soderlund et al., 1997). A cut-off value of 1e-50 was used initially to assemble the contigs. The cut-off value was reduced step-by-step and a final cut-off value of 1e-01 has resulted in 13,040 BAC contigs and 6294 BAC singletons. The number of BACs in each of the 13,040 contigs was listed in Supplementary Table S3 and the BACs in each contig were listed in Supplementary Table S4. The estimated N50 contig size was 42 BACs and average contig size was 0.329 Mbp. As an example, Figure 1 shows the largest contig in the assembly, selected based on number of BACs and tags. The BACs are ordered to their position in the contig. Horizontal lines indicate relative BAC length and positioning of the lines indicates relative position and degree of overlap between BACs. In Figure 1 (A) only non-buried BACs are shown, i.e., BACs which overlap with another BAC in the contig are not displayed, while Figure 1 (B) shows the same contigs but with all the buried BACs included. The FPC output file was included as Supplementary File S1, which can be opened in FPC program available at http://www.agcol.arizona.edu/software/fpc/ to view the diagrammatic representation of each contig including the representing BACs and their sequence overlaps.
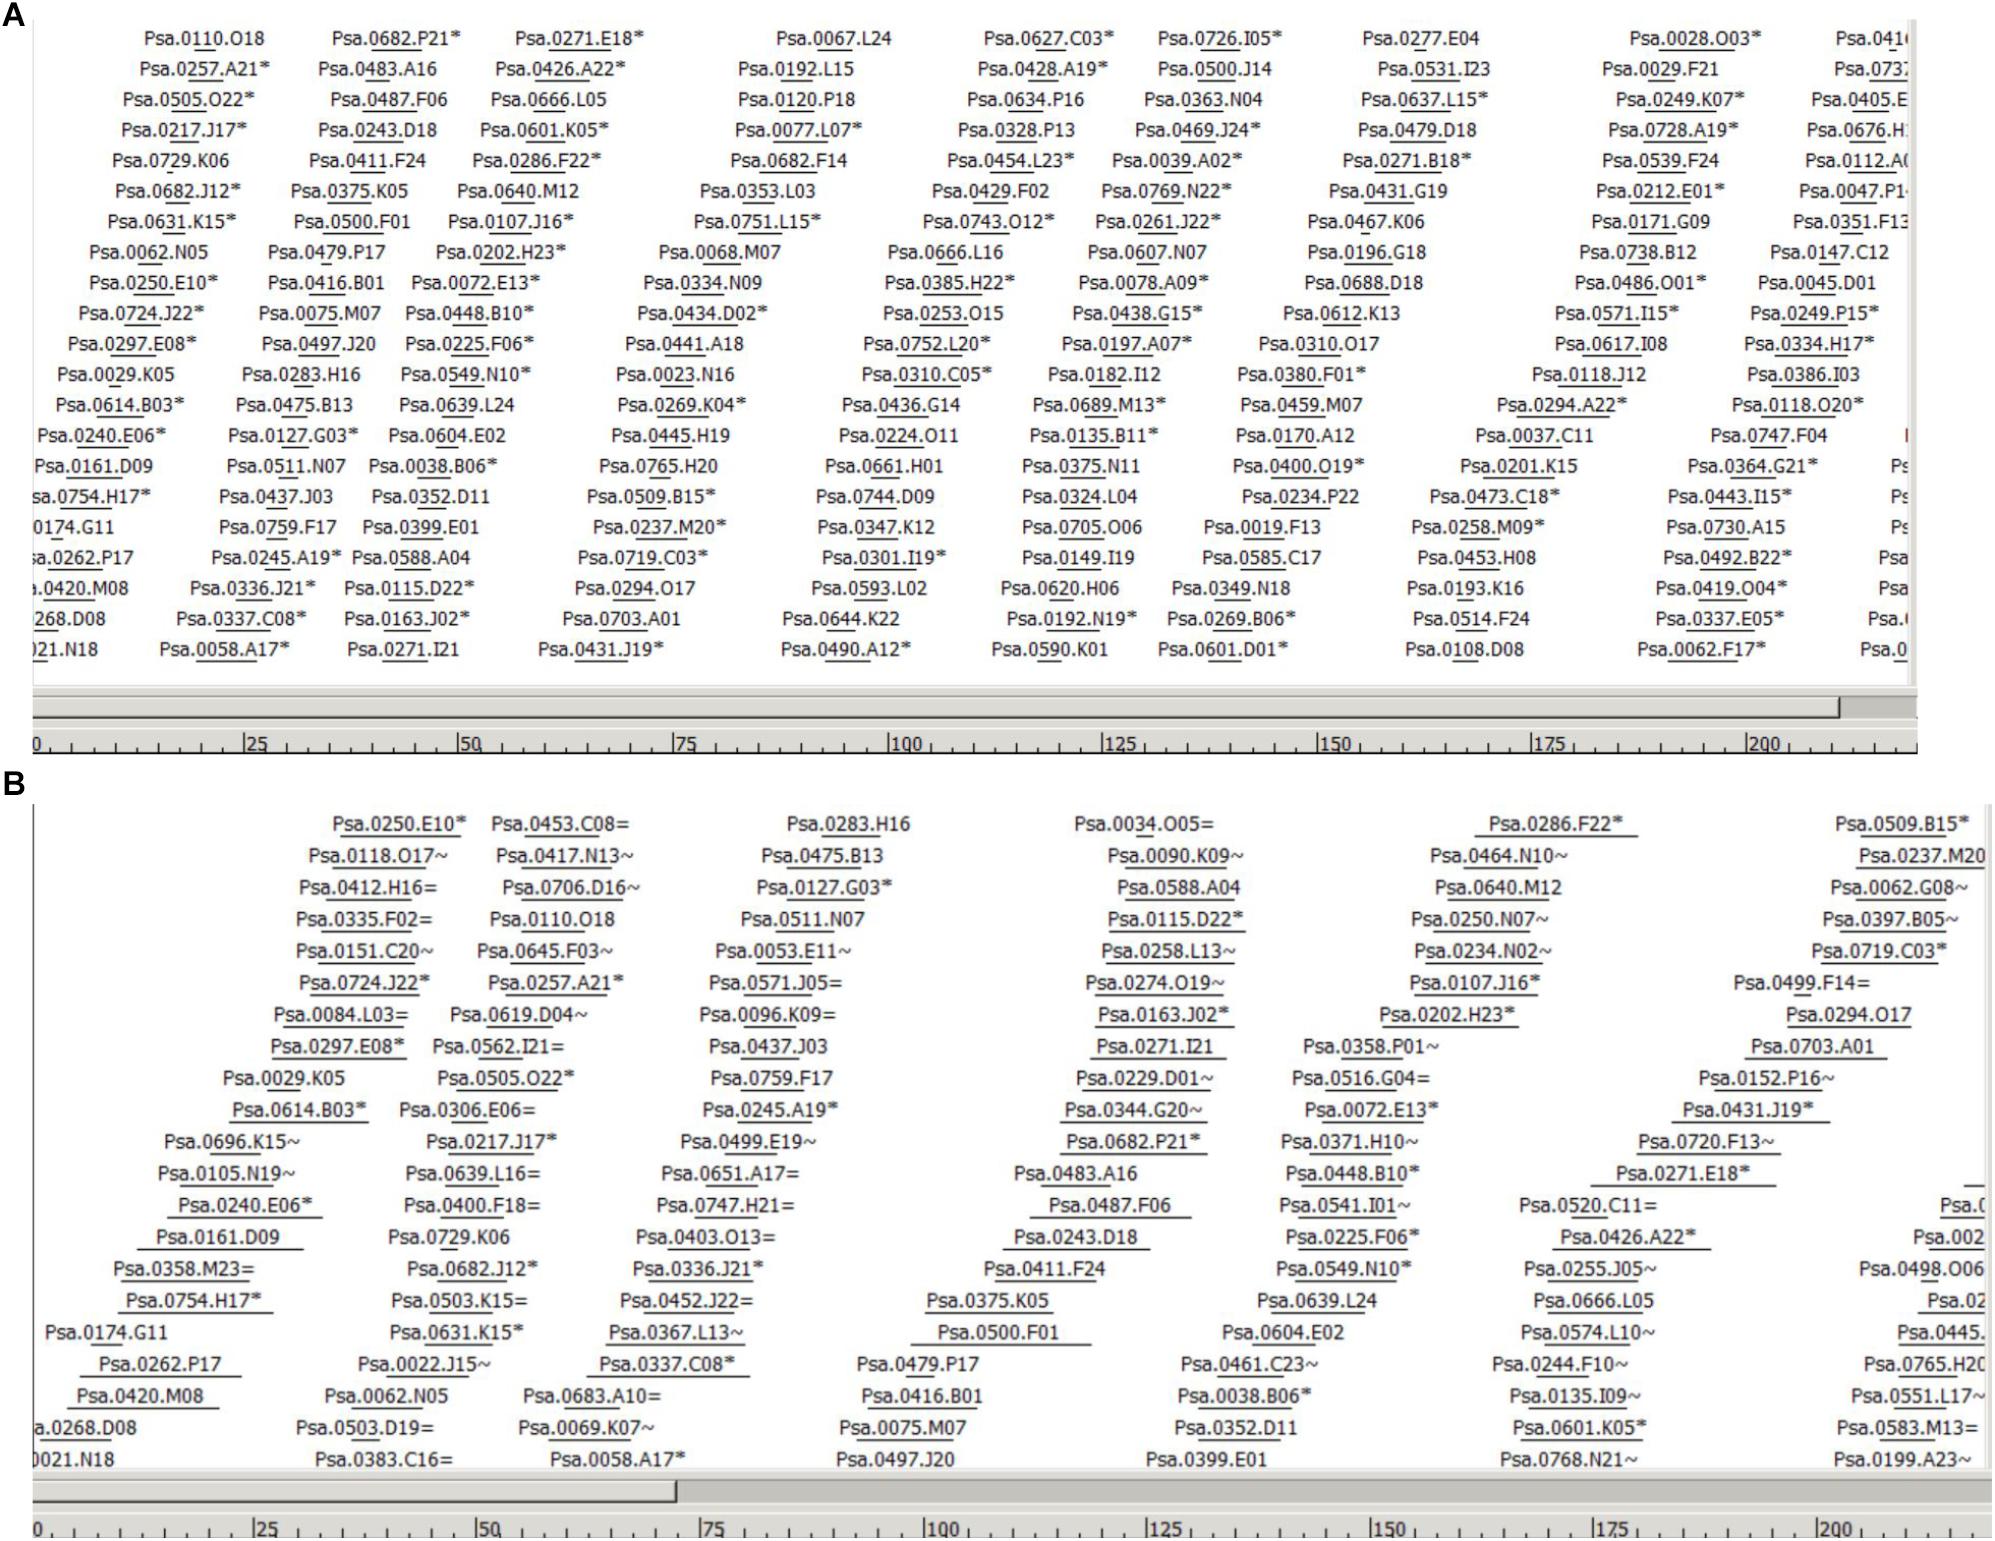
Figure 1. Part of the largest contig in the assembly (Ctg 2178) based on number of BACs and tags. The BACs are ordered to their position in the contig. Horizontal lines indicate relative BAC length and positioning of the lines indicates relative position and degree of overlap between BACs. The scale at the bottom represents the consensus band (CB) scale units. (A) Only non-buried BACs are shown, i.e., a semi-minimal tiling path, meaning that BACs which overlap largely with another BAC in the contig are not displayed. BACs indicated with a ∗ indicate the presence of one or more buried BACs at this position. (B) Part of the same contig in the assembly showing all the buried BACs. Buried BACs are marked with = or ∼, where = means identical and ∼ means nearly identical. The figures are in CB units; the length of the entire contig is 1532 CB units.
The estimated span of the BAC physical map was 4294 Mbp, which is the same as the total estimated size of the pea genome (Table 2). After the deconvolution and filtering of the WGP tags, 27.7% of the BAC clones sequenced were not represented in the contig assembly. The parameters of physical map assembly are presented in Table 2.
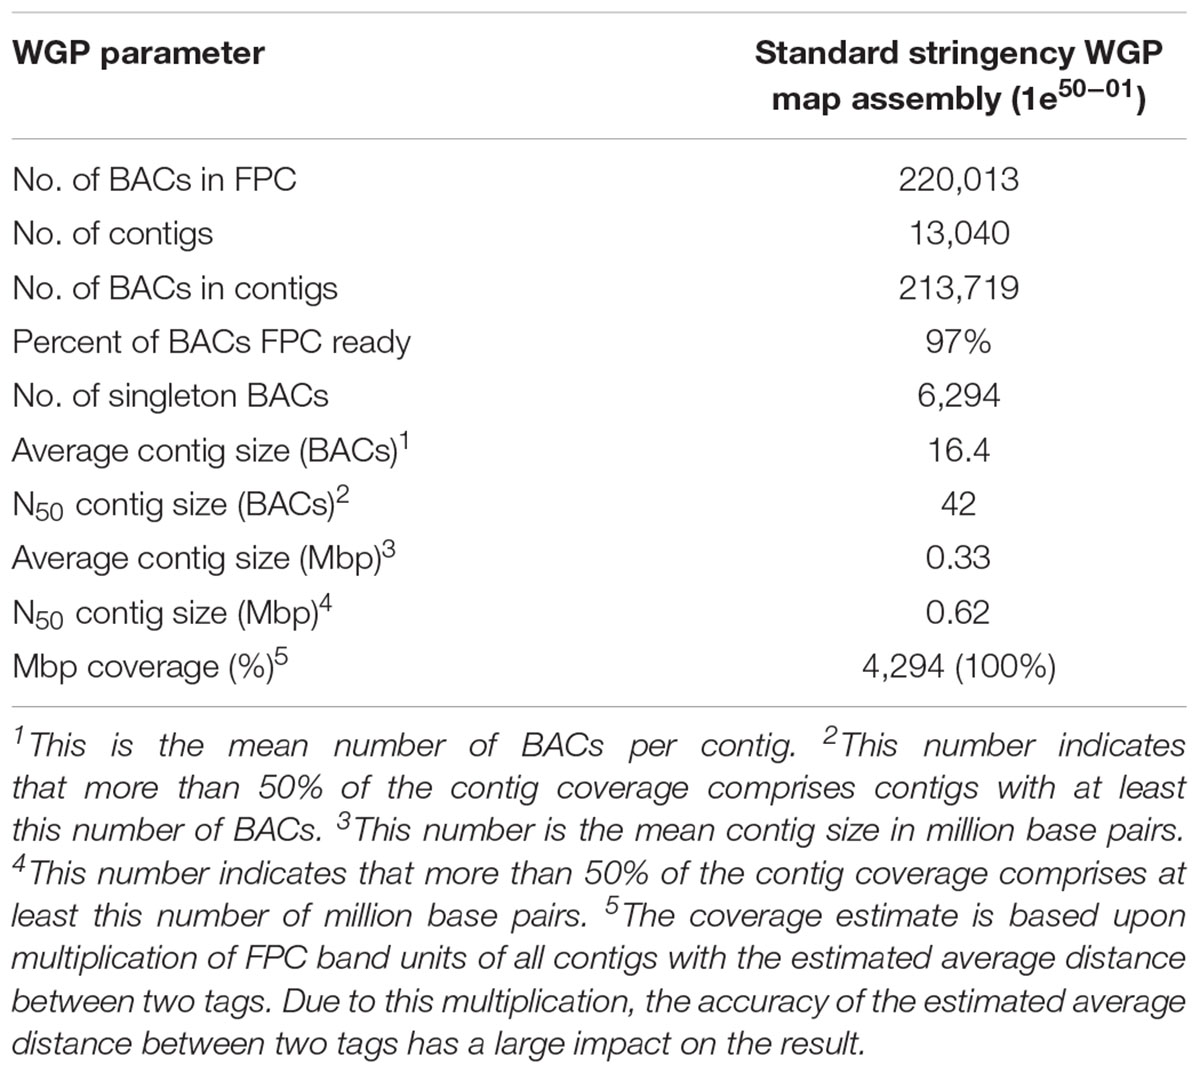
Table 2. Whole genome profiling (WGP) metrics for the pea physical map construction using a 50 nt tag length and standard stringency.
Discussion
The two major steps involved in traditional physical map construction, restriction digestion-based fingerprinting several-fold genome equivalents of BAC clones, and their assembly into contigs, are highly intensive and error prone for a genome as large as pea. Several improvements have been made in BAC fingerprinting techniques (Luo et al., 2003) and contig assembly (Frenkel et al., 2010). The introduction of sequence-based WGP technology for physical map construction has made it possible to tag a large number of BAC clones based on short reads generated on NGS platforms and increase the accuracy of contig assembly (van Oeveren et al., 2011). This technology is particularly useful for large genomes with an abundance of repetitive DNA. Comparison of WGP sequence tags may also provide important biological information such as determination of ancestral origin of polyploids (Sierro et al., 2013).
The parameters of the pea physical map assembly developed here are comparable to WGP-based physical maps of other crops, i.e., the average number of WGP tags per BAC clone (28.7) generated in this study and the percent of BAC clones represented in the contig assembly (72.3%) were comparable with WGP profiling of other complex genomes such as wheat (Poursarebani et al., 2014). Three contigs per Mbp were detected in the current physical map, in comparison to 2.2, 2.6 and 3.1 contigs per Mbp reported in tobacco (Sierro et al., 2013), tomato, and potato (De Boer et al., 2011), respectively. In the pea physical map assembly, the average number of BACs per contig is 16.4 and the average contig size is 0.33 Mbp in comparison to 34 BACs and 0.46 Mbp in tobacco (Sierro et al., 2013).
The size of the current WGP-based physical map assembly corresponded with the estimated genome size of pea. The significance of this research includes the use of a large number of BAC clones, ∼220,000, in WGP assembly and building a contig assembly near the estimated genome size of 4.2 GB, considering the high proportion of repetitive sequences. It is to be noted that the span of physical map is similar to the estimated size of the pea genome though 27.7% of the BAC clones sequenced were not represented in the contig assembly. This could be because of the physical gaps between the FPC contigs which will subsequently be verified in comparison with genetic linkage maps and genome sequence. It is also possible that vast majority of the unassembled 27.7% BAC clones were chimeric BACs and are represented by the BACs in contig assemblies in various proportions.
In this research, we have constructed a high quality physical map of pea based on WGP with the assembly parameters comparable to WGP assembly of other crops. Since the map is based on sequenced DNA tags, the physical map provides the skeleton framework for anchoring the genome sequence to obtain a high quality reference genome sequence to explore the genes governing traits and to study the genome features. The recent improvements of optical mapping of genomes in nanochannel arrays (Bionano) (Lam et al., 2012) and “Chicago” method based on in vitro reconstituted chromatin (Putnam et al., 2016) are further advancements to support physical mapping and sequence assembly in complex genomes and provide substantial improvement in the N50 contig size. Using the Bionano approach, Staòková et al. (2016) obtained contigs of the short arm of chromosome 7D (7DS; 381 Mb) of bread wheat, with a N50 value of 1.3 Mb, and identified ∼800 kb array of tandem repeats.
We have provided information of all the WGP tags in Supplementary Table S1 and the BACs corresponding to these tags are shown in Supplementary Table S2. The map is accessible through the .FPC file (Supplementary File S1), and users can view it in FPC output format, by using FPC software. This information will assist users to navigate and identify the BAC clones of their interest. The international consortium for pea genome sequencing is using the WGP-based physical map in conjunction with Bionano optical mapping to anchor and improve the complex genome sequence of pea.
Data Availability
The datasets generated for this study can be found in bioRxiv, doi: 10.1101/518563.
Author Contributions
TW, BT, JB, and EvdV designed the study. JvO and KL performed the sequence and FPC analysis. HB and AB provided the BACs. KG drafted the manuscript. RL contributed to data analysis. All authors contributed to the manuscript review.
Funding
The study was funded by Saskatchewan Pulse Growers (SPG).
Conflict of Interest Statement
The authors declare that the research was conducted in the absence of any commercial or financial relationships that could be construed as a potential conflict of interest.
Supplementary Material
The Supplementary Material for this article can be found online at: https://www.frontiersin.org/articles/10.3389/fpls.2019.00323/full#supplementary-material
TABLE S1 | Unique sequence tags identified by sequencing ends of restriction fragments of 295,680 BAC clones.
TABLE S2 | BAC clones corresponding to the unique sequence tags identified by sequencing ends of restriction fragments of 295,680 BAC clones.
TABLE S3 | Number of BAC clones in each contig built based on the sequence similarities of unique sequence tags.
TABLE S4 | Distribution of BAC clones in contigs built based on the sequence similarities of unique sequence tags.
FILE S1 | Fingerprinted Contig output file to visualize all the BAC contigs and overlap of each BAC in the reported contigs.
Footnotes
References
Abbo, S., Lev-Yadun, S., and Gopher, A. (2010). Agricultural origins: centers and noncenters; a near eastern reappraisal. Crit. Rev. Plant Sci. 29, 317–328. doi: 10.1080/07352689.2010.502823
Ambrose, M. J. (1995). From near east centre of origin the prized pea migrates throughout world. Diversity 11, 118–119.
Ariyadasa, R., and Stein, N. (2012). Advances in BAC-based physical mapping and map integration strategies in plants. J. Biomed. Biotechnol. 2012:184854. doi: 10.1155/2012/184854
Arumuganathan, K., and Earle, E. D. (1991). Nuclear DNA content of some important plant species. Plant Mol. Biol. Rep. 9, 208–219. doi: 10.1007/BF02672069
De Boer, J. M., Borm, T. J. A., Jesse, T., Brugmans, B., and Tang, X. (2011). A hybrid BAC physical map of potato: a framework for sequencing a heterozygous genome. BMC Genomics 12:594. doi: 10.1186/1471-2164-12-594
Frenkel, Z., Paux, E., Mester, D., Feuillet, C., and Korol, A. (2010). LTC: A novel algorithm to improve the efficiency of contig assembly for physical mapping in complex genomes. BMC Bioinform. 11:584. doi: 10.1186/1471-2105-11-584
Lam, E. T., Hastie, A., Lin, C., Ehrlich, D., Das, S. K., Austin, M. D., et al. (2012). Genome mapping on nanochannel arrays for structural variation analysis and sequence assembly. Nat. Biotechnol. 30, 771–776. doi: 10.1038/nbt.2303
Luo, M. C., Thomas, C., You, F. M., Hsiao, J., Ouyang, S., Buell, C. R., et al. (2003). High-throughput fingerprinting of bacterial artificial chromosomes using the snapshot labeling kit and sizing of restriction fragments by capillary electrophoresis. Genomics 82, 378–389. doi: 10.1016/S0888-7543(03)00128-9
Macas, J., Neumann, P., and Navratilova, A. (2007). Repetitive DNA in the pea (Pisum sativum L.) genome: comprehensive characterization using 454 sequencing and comparison to soybean and Medicago truncatula. BMC Genomics 8:427.
Murray, M. G., Cuellar, R. E., and Thompson, W. F. (1978). DNA sequence organization in the pea genome. Biochemistry 17, 5781–5790. doi: 10.1021/bi00619a027
Philippe, R., Choulet, F., Paux, E., Oeveren, J. V., Tang, J., Wittenberg, A. H. J., et al. (2012). Whole Genome Profiling provides a robust framework for physical mapping and sequencing in the highly complex and repetitive wheat genome. BMC Genomics 13:47. doi: 10.1186/1471-2164-13-47
Poursarebani, N., Nussbaumer, T., Simkova, H., Safar, J., Witsenboer, H., van Oeveren, J., et al. (2014). Whole-genome profiling and shotgun sequencing delivers an anchored, gene-decorated, physical map assembly of bread wheat chromosome 6A. Plant J. 79, 334–347. doi: 10.1111/tpj.12550
Putnam, N. H., O‘Connell, B. L., Stites, J. C., Rice, B. J., Blanchette, M., Calef, R., et al. (2016). Chromosome-scale shotgun assembly using an in vitro method for long-range linkage. Genome Res. 26, 342–350. doi: 10.1101/gr.193474.115
Sierro, N., van Oeveren, J., van Eijk, M. J. T., Martin, F., Stormo, K. E., Peitsch, M. C., et al. (2013). Whole genome profiling physical map and ancestral annotation of tobacco hicks broadleaf. Plant J. 75, 880–889. doi: 10.1111/tpj.12247
Soderlund, C., Longden, I., and Mott, R. (1997). FPC: a system for building contigs from restriction fingerprinted clones. Comput. Appl. Biosci. 13, 523–535. doi: 10.1093/bioinformatics/13.5.523
Staòková, H., Hastie, A. R., Chan, S., Vrana, J., Tulpova, Z., Kubalakova, M., et al. (2016). BioNano genome mapping of individual chromosomes supports physical mapping and sequence assembly in complex plant genomes. Plant Biotech. J. 14, 1523–1531. doi: 10.1111/pbi.12513
Keywords: bacterial artificial chromosome, fingerprinted contigs, Pisum sativum, sequence-based physical map, whole genome profiling
Citation: Gali KK, Tar’an B, Madoui M-A, van der Vossen E, van Oeveren J, Labadie K, Berges H, Bendahmane A, Lachagari RVB, Burstin J and Warkentin T (2019) Development of a Sequence-Based Reference Physical Map of Pea (Pisum sativum L.). Front. Plant Sci. 10:323. doi: 10.3389/fpls.2019.00323
Received: 24 January 2019; Accepted: 28 February 2019;
Published: 15 March 2019.
Edited by:
Alfonso Clemente, Consejo Superior de Investigaciones Científicas (CSIC) Granada, SpainReviewed by:
Steven B. Cannon, Agricultural Research Service (USDA), United StatesMartin Mascher, Leibniz-Institut für Pflanzengenetik und Kulturpflanzenforschung (IPK), Germany
Copyright © 2019 Gali, Tar’an, Madoui, van der Vossen, van Oeveren, Labadie, Berges, Bendahmane, Lachagari, Burstin and Warkentin. This is an open-access article distributed under the terms of the Creative Commons Attribution License (CC BY). The use, distribution or reproduction in other forums is permitted, provided the original author(s) and the copyright owner(s) are credited and that the original publication in this journal is cited, in accordance with accepted academic practice. No use, distribution or reproduction is permitted which does not comply with these terms.
*Correspondence: Tom Warkentin, tom.warkentin@usask.ca