 Yun-Dong Gao
 Xin-Fen Gao
 Aj Harris
- 1CAS Key Laboratory of Mountain Ecological Restoration and Bioresource Utilization and Ecological Restoration and Biodiversity Conservation Key Laboratory of Sichuan Province, Chengdu Institute of Biology, Chinese Academy of Sciences, Chengdu, China
- 2Oberlin College and Conservatory, Department of Biology, Oberlin, OH, United States
Discerning species boundaries among closely related taxa is fundamental to studying evolution and biodiversity. However, species boundaries can be difficult to access in plants because ongoing divergence and speciation may leave an evolutionary footprint similar to introgression, which occurs frequently among species and genera. In this study, we sought to determine species boundaries between two closely related alpine shrubs, Rosa sericea and Rosa omeiensis, using population genetics, environmental data and ecological niche modeling, and morphological traits. We analyzed populations of R. sericea and R. omeiensis using genetic markers comprising a fragment of the single-copy nuclear gene, LEAFY, micro-satellites (EST-SSR), and plastid DNA sequences. The DNA sequence data suggested clusters of populations consistent with geography but not with previously proposed species boundaries based on morphology. Nevertheless, we found that the ecological niches of the previously proposed species only partially overlap. Thus, we suspect that these species are in the process of parapatric speciation; that is, differentiating along an ecological gradient, so that they exhibit differing morphology. Morphology has previously been the basis of recognizing the species R. sericea and R. omeiensis, which are the most widely distributed species within a broader R. sericea complex that includes several other narrow endemics. Here, we recognize R. sericea and R. omeiensis as independent species based on morphological and ecological data under the unified species concept, which emphasizes that these data types are of equal value to DNA for determining species boundaries and refining taxonomic treatments. While the DNA data did not delimit species within the R. sericea complex, we expect to develop and utilize new, robust DNA tools for understanding speciation within this group in future studies.
Introduction
Species comprise a basic unit of biology and are fundamental to elucidating first order patterns in the organization of global, regional and local biodiversity, such as the latitudinal gradient of species richness (von Humboldt, 1807; Willig et al., 2003; Mannion et al., 2014), Asian species bias among eastern Asian-eastern North American disjunct genera (Wen, 1999, 2001; Qian and Ricklefs, 2000), and the species-area relationship (Arrhenius, 1921). Additionally, species are at the heart of calls to document and conserve existing biodiversity in the face of the extinction crisis of the Anthropocene (Wilson, 1988; Agapow et al., 2004; Ceballos et al., 2015).
Equally important to delimiting boundaries among species for all aspects of biodiversity science, is the philosophy that we apply to delimitation; that is the species concept. Despite the centrality of species to understanding biology, biodiversity science, and conservation, delimiting species from one another remains a controversial exercise for biologists, so that dozens of species concept have been raised (De Queiroz, 2005, 2007; Hey, 2006; Freudenstein et al., 2017). For example, in plants alone, authors have debated the merits of an evolutionary species concept (George, 1951), which emphasizes monophyletic lineages, versus a biological one (Mayr, 1942), which emphasizes reproductive isolation as the key and ultimate standard for recognizing species (Coyne and Orr, 2004) reproductive isolation as the key and ultimate standard for recognizing species. Overall, many species concepts are narrow; focusing on one or a few aspects of reproductive isolation, such as genetic or morphological differences (De Queiroz, 2007; Aldhebiani, 2018). These narrow concepts are insufficient, because evolution is ongoing such that divergence may be incomplete in the present [e.g., Orinus Hitchc. (Liu et al., 2018), see also (Funk and Omland, 2003; Arnold, 2016)] and may affect genetics, morphology, ecology, and other aspects of plant biology at different rates. Moreover, species delimitation is frequently confounded in plants during secondary contact that can lead to introgression and hybridization even after 10s of millions of years of evolution in isolation (e.g., in buckeyes; Hardin, 1957; Harris et al., 2009; Aldhebiani, 2018). Therefore, recent species concepts, such as the unified species concept (De Queiroz, 2005, 2007), seek holistic approaches to species delimitation to accommodate these and other complexities of evolutionary divergence. The unified species concept integrates over all of the available kinds of data such as morphology, molecular sequences, and ecology (De Queiroz, 2007). Like the ‘integrative species concept’ (Liu, 2016), the unified species concept aims to strike a balance among rival concepts and provide a practical philosophy of species delimitation.
The unified species concept is especially useful for delimiting species that arise from recent or ongoing parapatric speciation in contrast to biological species concepts, which tend to assume an underlying allopatric speciation model (Mayr, 1942; Coyne and Orr, 2004). In plants, parapatric speciation, or diversification along an environmental gradient, probably occurs commonly (Gavrilets et al., 2000; Stuart et al., 2006; Florio et al., 2012). However, detecting parapatric speciation can be challenging because it may frequently be driven by the same mechanisms that drive other evolutionary modes, such as allopatric speciation and secondary contact leading to introgression. These mechanisms include mountain uplift, climatic perturbations, or, more broadly, ecological disturbance (Colin and Guy, 2015; Zhao et al., 2016). Nevertheless, parapatric speciation in plants is particularly widely hypothesized to occur along elevational gradients (Watson and Spottiswoode, 1835; Bond, 1989; Knox and Palmer, 1995; Carpenter, 2005; Givnish et al., 2009; Sanders and Rahbek, 2012; Caro et al., 2013; Guo et al., 2013), which co-vary with other environmental factors of importance to plants such as temperature, precipitation, and light availability (e.g., Qian and Sandel, 2017). During and immediately following parapatric speciation, species boundaries may be difficult to ascertain using molecular data due to recency of divergence and the lack of strict geographic barriers to gene flow (Abbott and Brennan, 2014). Moreover, morphological differences between the new or emerging species may (Harrison, 2012; Harrison and Larson, 2014) or may not be detectable (Stuart et al., 2006; Florio et al., 2012). However, thorough integration of morphological, molecular, and ecological data may help to discern parapatric speciation from among other evolutionary processes, determine species boundaries, and provide the basis for application of a unified species concept of taxonomic revisions.
Within the mountainous region of southwestern China, including the Himalayas and the Hengduan Mountains, many recent environmental perturbations, such as uplift, glaciation, and shifts in the monsoon climate, represent possible drivers of speciation and, consequently, explanations for the vast botanical biodiversity of the region (Myers et al., 2000; An et al., 2001; Wharton et al., 2005; Ju et al., 2007; Xing and Ree, 2017). For example, uplift within the Hengduan Mountains 3–4 million years (m.y.) ago (Chen, 1992, 1996) may have presented new ecological opportunities for plants (and animals) along emerging elevational gradients (e.g., Liu et al., 2006; Gao et al., 2013, 2015a; Xing and Ree, 2017). Similarly, glacial cycles (0.9–2.4 m.y. ago) during the Quaternary also resulted in shifting vegetational patterns along elevational gradients as well as isolation within refugia and subsequent secondary contact (Williams et al., 1998; Hewitt, 2000). Therefore, the mountains of southwestern China represent an area ripe for parapatric speciation events, though these are likely to have co-occurred with other modes of speciation.
Here, we investigate the evolutionary mechanism of speciation within two well-recognized sister species that are endemic to the mountains of southwestern China (Gao et al., 2015b): Rosa sericea Lindley and Rosa omeiensis Rolfe. Both species occur along a high latitudinal gradient from 1000 to 4000 m above sea level within the Qinghai-Tibetan Plateau (QTP), the Hengduan Mountains, and adjacent uplands. Rosa sericea comprises understory plants within forested areas while R. omeiensis occurs above the tree line as an alpine shrub. The two species have large populations and relatively distinct morphologies, which intergrade within parts of the geographic range. Rosa sericea is distinguished from R. omeiensis by having fewer leaflets (7–11 compared to 9–17) and by an obovoid or globose hip with slim pedicle (compared to an obovoid or pyriform hip, with a conspicuous, stout, tapering pedicel, Figure 1; Ku, 1985; Ku and Robertson, 2003). However, intergrading morphology has made delimitation of these species challenging (Ku, 1985; Ku and Robertson, 2003; Fang et al., 2011; Gao et al., 2015b).
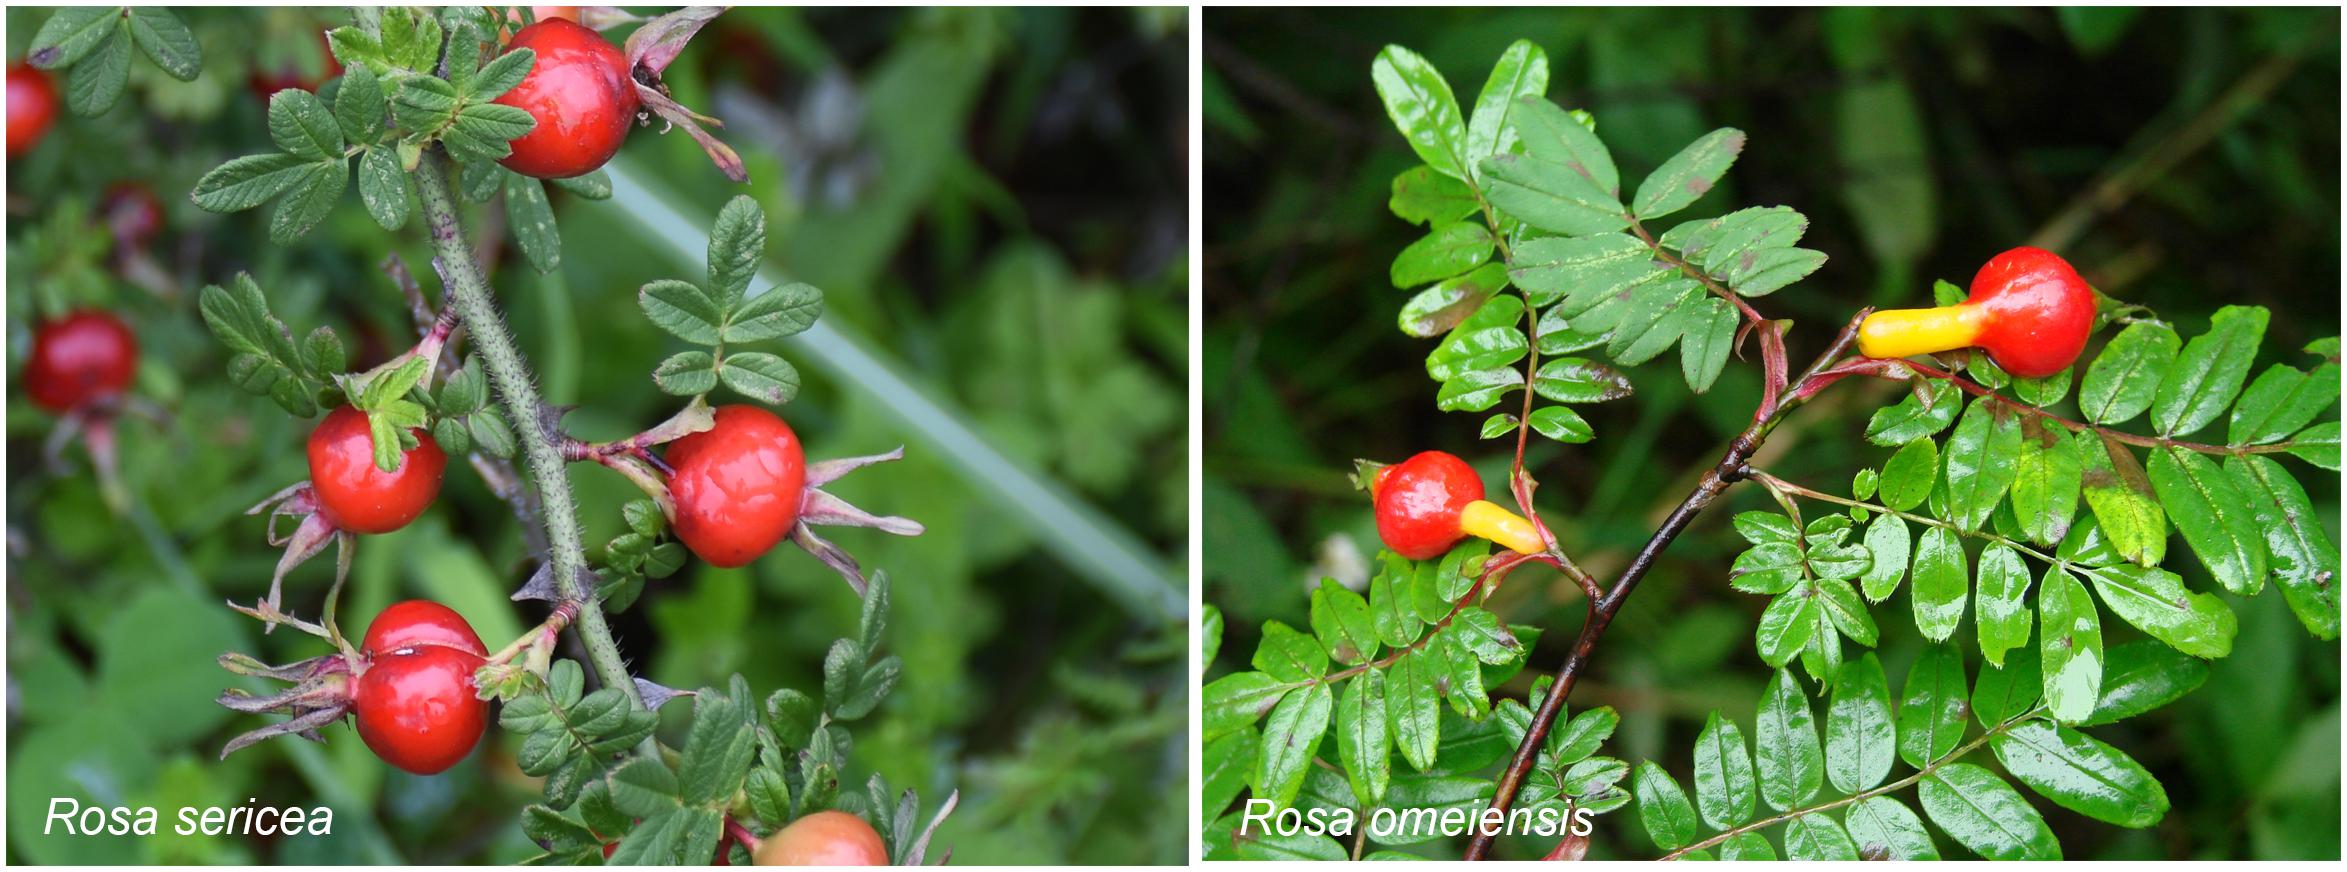
Figure 1. Representative individuals of Rosa sericea and Rosa omeiensis showing their morphological differences according to their treatment in the Flora of China. Images show individuals at roughly the same stage of fruit development.
We hypothesized that R. sericea and R. omeiensis represent independent species based on morphology and that they have diverged or are diverging along an altitudinal gradient consistent with our observations in the field. Therefore, we applied population genetics and morphological and ecological data to attain the following objectives: (1) assess species boundaries between R. sericea and R. omeiensis; (2) evaluate gene flow and divergence between the species and determine the mode of speciation if any; and (3) discuss our results within the context of species concepts.
Materials and Methods
Plant Sampling
From 2010–2011, we collected 459 samples from 42 populations representing R. sericea and R. omeiensis from across their distributional ranges (hereafter RS and RO; Figure 2 and Supplementary Table S1). There are several other species of R. sericea comprising a species complex, but these species are narrowly endemic with only a few specimen records each and, thus, difficult to assess. For each population, we sampled 10 or more individuals except at sites where the species was rare, and our smallest sample comprised seven individuals (Table 1). Each population consisted of either RS or RO, and there were no populations containing both species based on morphology. Our collections consisted of leaves, which we dried in silica gel in the field and then stored at -80°C until used, and one voucher specimen per population, which we deposited in the herbarium at the Chengdu Institute of Biology, Chinese Academy of Sciences (CDBI, Table 1). We also recorded the geolocations of each sampled population.
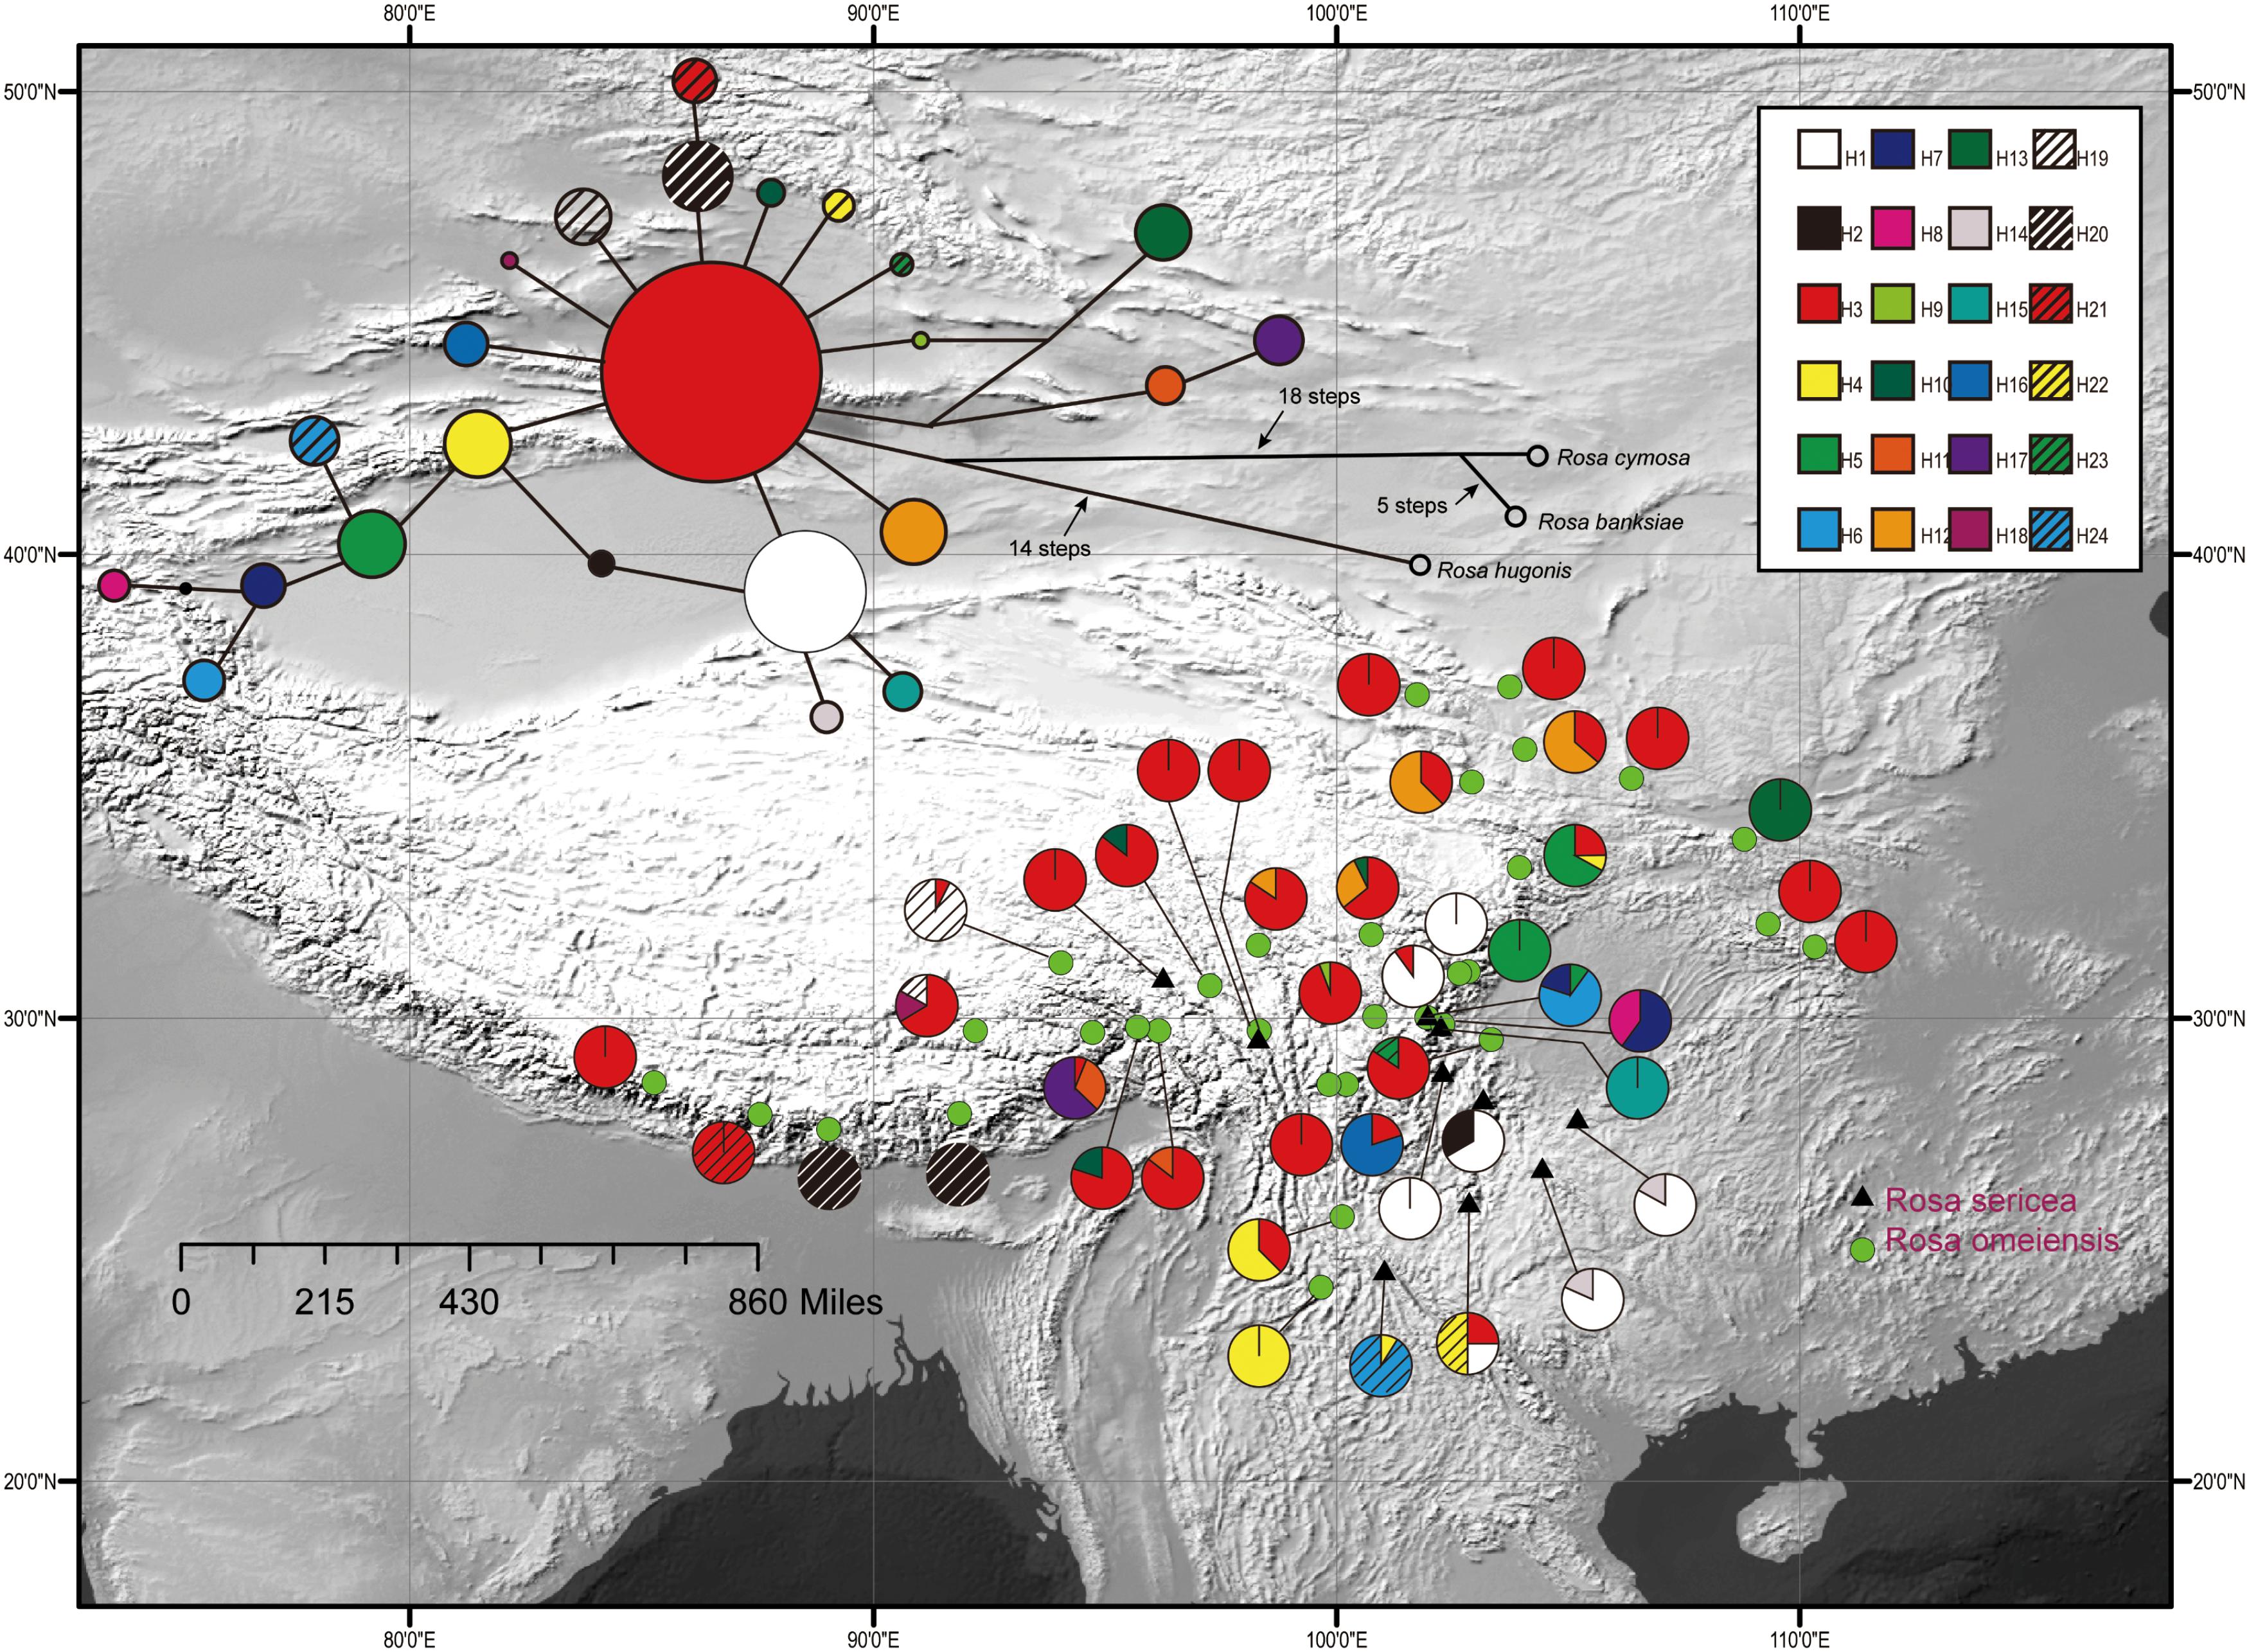
Figure 2. Geographic distribution of 24 cpDNA haplotypes (H1–H24) detected among 42 populations of R. sericea and R. omeiensis. Network of cpDNA haplotypes with outgroup taxa constructed by TCS 1.21. Size of circles in network are proportional to observed frequencies of haplotypes. Map generated in ESRI ArcGIS 10.0 (Esri, 2010).
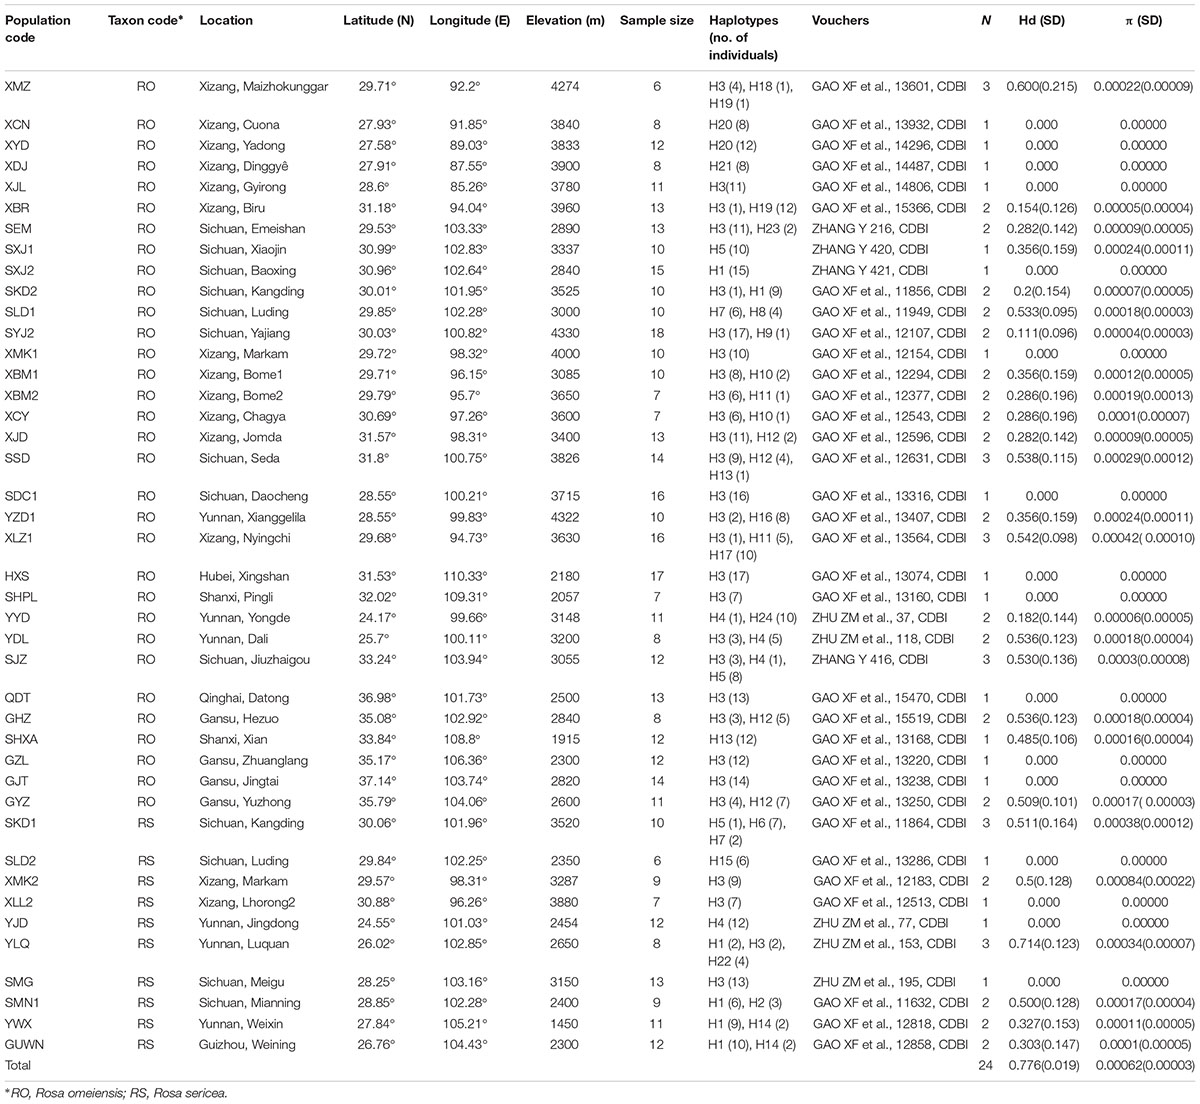
Table 1. Plant material, sources, detected chlorotypes and the genetic diversity indetified in this study.
DNA Extraction, Sequencing, and Microsatellite Genotyping
We extracted total genomic DNA from the dried leaf tissue via a modified cetyltrimethyl ammonium bromide (CTAB) method (Doyle and Doyle, 1987). In a preliminary screening, we surveyed 12 intergenic spacer (IGS) regions of the chloroplast (cp) genome of RS and RO (data not shown). Based on these results, we used the cpDNA regions tabE-ndhJ, trnL-trnF, and ndhF-rpl32 for further analysis due to their high levels of polymorphism and amplification efficiency. Additionally, we amplified the second exon of LEAFY, a floral meristem identity gene, initially using primers designed by Ritz et al. (2011) and then with primers designed specifically for this study (RSLEAFY-2F, 5′-GCTGCGGAGGATTAGGAGAGGAGT-3′, RSLEAFY-2R, 5′-GCAGCGCATAGCAGTGAACATAGT-3′). We sampled LEAFY for the ingroup only. We performed all amplifications using standard PCR in 25 μL volume with ca. 50 ng of template DNA, 2.5 μL of 10×PCR buffer, 2 μL of 2.5 mM dNTPs, 0.5 μL of 10 μM each primer and 0.5 unit of TaKaRa ExTaq (Takara Biomedical Technology, Co., Ltd., Beijing, China). The PCR cycle for all three cpDNA fragments was as follows: enzyme activation at 94°C for 3 min, followed by 35 cycles of denaturation at 94°C for 1 min, annealing at 55°C for 1 min and extension at 72°C for 1.5 min; followed by a final extension of 72°C for 10 min. We purified the PCR products using standard methods and sequenced them on an ABI PRISM 3730 (Applied Biosystems) using the same primers for PCR. For the resulting sequences, we performed manual editing in SeqMan Pro 7.1 (implemented in DNASTAR, Lasergene) and sequence alignment in MEGA 4 (Tamura et al., 2007) using the ClustalX method (Thompson et al., 1994, 1997) under default settings. We removed all indels, which were exclusively repeats of adjacent bases and unstable in sequencing. For LEAFY, we extracted independent, polymorphic alleles, or haplotypes, using the algorithm for phasing in DnaSP (Librado and Rozas, 2009) with an output threshold of 0.7 (Stephens et al., 2001; Stephens and Donnelly, 2003). We deposited all cpDNA and LEAFY haplotypes in GenBank under Accession Nos. KF850715–KF850751, KF850756–KF850792, KF851050–KF851086, and MH258749–MH258789. We also genotyped eight EST-nSSR loci in the RS and RO using primers and amplification protocols developed for the Rosa genus (see Supplementary Table S2). In a preliminary analysis, we investigated 20 pairs of EST primers, and, based on the results, we selected eight highly polymorphic primer pairs that could produce good quality amplicons (Gao et al., 2015b). We separated the PCR amplicons on a MegaBACE 1000 (GE Healthcare Biosciences, Sunnyvale, CA, United States) and scored alleles manually using GENETIC PROFILER software (version 2.2; GE Healthcare Biosciences).
Population Genetic and Phylogeographic Data Analyses
To verify congruence in phylogenetic signal among the three cpDNA fragments, we carried out a partition-homogeneity test (Farris et al., 1994) using the software PAUP∗ 4.0b (Swofford, 2003). Based on the results, we used the combined cpDNA data set for all subsequent analyses. For the combined cpDNA, we analyzed sequence variation in MEGA4 (Tamura et al., 2007) and calculated nucleotide (π) and haplotype (h) diversity (Nei, 1987) in DnaSP 5 (Librado and Rozas, 2009). We also compared population differentiation for phylogenetically ordered (NST) and unordered (GST) haplotypes and for all populations using PERMUT1.0 (Pons and Petit, 1996). We used the results and a test of significance comprising 1000 permutations to determine if NST > GST, which constitutes a test for phylogeographic structure. We investigated the phylogenetic relationships among populations (represented by haplotypes) using the statistical parsimony procedure for phylogenetic network estimations implemented in TCS 1.21 (Clement et al., 2000) with a 95% criterion for parsimonious connections. We also reconstructed a phylogeny from all unique chloroplast haplotypes with maximum likelihood (ML) and neighbor-joining (NJ) methods with four accessions of three species, Rosa hugonis Hemsl. R. cymosa Tratt. and R. banksiae R. Br., constituting the outgroup based on the framework of Rosa phylogeny (Fougere-Danezan et al., 2015). The accession numbers from GenBank are as follows: R. hugonis (two accessions), R. banksiae and R. cymosa (KF850752–KF850755, KF850793–KF850796, KF851087–KF851090). We conducted the NJ analysis with MEGA7 (Kumar et al., 2016), incorporating the Kimura 2-parameter (K2P) model of DNA evolution. To evaluate support for clades, we performed 100 bootstrap replicates. For the ML estimate, we first determined partitions and models of evolution for each within PartitionFinder v.2.1.1 (Lanfear et al., 2017). We performed the ML analysis in RAxML HPC BlackBox (version 8.2.10) (Stamatakis, 2014) with 100 bootstrap replicates. We conducted NJ and ML analyses and the analysis in PartitionFinder2 on the Cipres Science Gateway (Miller et al., 2010).
Additionally, we constructed a network of the unphased sequences of LEAFY using SplitsTree4 (Huson and Bryant, 2006) and implementing the NeighborNet algorithm with Kimura 2-parameter (K2P) distances and ordinary least squares inference of branch lengths. We performed a bootstrap analysis in SplitTree4 with 1000 replicates and we recorded the bootstrap values for major splits.
To identify population groups and genetic barriers, we conducted a spatial analysis of molecular variance (SAMOVA) in SAMOVA 1.0 (Dupanloup et al., 2002) on plastid makers. The SAMOVA algorithm uses geolocations of populations and genetic data to generate a user-defined number of geographically adjacent groups (K) that have maximal among-group genetic variability and minimal within-group variability. Our SAMOVA analyses comprised five independent analyses of 1000 iterations each for K = 2–20, and the asymptotic shape of the distribution of SAMOVA results showed that this range K was sufficient to capture the best-fit number of groups. We compared the groups inferred using SAMOVA to determine if they exhibited distinguishing morphological characters. We also performed analyses of molecular variance (AMOVA) (Excoffier et al., 1992) in the software package ARLEQUIN 3.5 (Excoffier et al., 2005) using all the populations under the null hypotheses that only one species exists.
For the nSSRs, we calculated the total number of detected alleles (NA), allelic richness (RS), and gene diversity (HS). We also computed differentiation between populations using FST (Weir and Cockerham, 1984), for which we determined significance at each locus and overall using 1000 bootstrap permutations. We performed all analyses of the nSSR data in GenALEx (version 6.501; Peakall and Smouse, 2012) and GENEPOP version 4.0 (Raymond and Rousset, 1995). We used the complete nSSR dataset (i.e., 42 populations) to infer population structure in STRUCTURE version 2.3 (Pritcharda et al., 2009), which we ran under the admixture model with independent allele frequencies for 100,000 Markov chain Monte Carlo (MCMC) generations following 10,000 burn-in generations. We performed 10 replications each in STRUCTURE for K = 1–20, and we selected the optimal K according to Evanno et al., 2005) for downstream analyses.
Present Distribution Modeling and ENM Identity Test
We sought to compare and contrast the geographic ranges and environmental tolerances of putative species within RS and RO. Unfortunately, the only preexisting, comprehensive, geographic range maps for these species have coverage limited to China (Fang et al., 2011), and even these may inadvertently integrate ongoing taxonomic controversies and confusion within RS and RO. Therefore, we performed presence-only ecological niche modeling (ENM) in MaxEnt 3.3.3k (Phillips et al., 2006) to infer species environmental tolerances and, consequently, their probable geographic ranges. We generated ENMs using occurrence data from our field collections as well as vetted specimens from A, BM, CDBI, E, HNWP, IBSC, K, KATH, KUN, PE, TUCH, and WUK and vetted specimen records in the Global Biodiversity Information Facility (GBIF) and the Chinese Virtual Herbarium (CVH). For all herbarium records, we verified the taxonomic identity by personally examining the specimens or specimen images, and we ensured that geolocations were consistent with known ranges. In total, we obtained 354 high quality records that were spatially unique at 2.5 arc minutes resolution (∼5 km2 at the equator) representing 121 RS and 233 RO. We used 19 temperature, perception, and seasonality variables from WorldClim (Hijmans et al., 20051), also at 2.5 arc minutes resolution, to generate the ENMs in MaxEnt. We assessed model quality with cross-validation comprising 100 replicates using 25% of the data for model testing, and we evaluated the accuracy of each cross validation test using the area under the ROC curve (AUC) (Fawcett, 2006).
Identity Test and Niche Overlap Test
We compared the environmental niches of the two putative species using niche-identity tests, in which the difference between the actual niches were contrasted with null models generated from randomly reshuffled occurrence points (Warren et al., 2008). We calculated niche identity using Schoener’s D similarity index (Schoener, 1968) and Warren’s I (Warren et al., 2008) implemented in ENMTools (Warren et al., 2010). We conducted 100 pseudoreplicates of shuffling to generate null models for these statistics.
Principal Component Analysis (PCA) of Environment Factors
We used principal components analyses (PCA) to better understand and visualize the similarities and differences between the environments in which RS and RO occur. We conducted the PCAs using the same 19 temperature, precipitation, and seasonality variables used for ENMs, as well as average high and low temperatures and precipitation for each of 12 months from WorldClim (Hijmans et al., 2005; Fick and Hijmans, 2017) and elevation, which we obtained from specimen records. For each variable, we extracted values in ArcGIS (Esri, 2010) for the same 354 occurrence data points used for ENM, and we performed the PCAs on matrices of the environmental values standardized using z-scores. We simultaneously visualized the distributions of species in environmental space and along a potential elevational gradient by adding elevation contours to the PCA plots using the Vegan library (Dixon, 2003). We also visualized the same data according to groups of populations identified using STRUCTURE. Additionally, we performed a more stringent PCA analysis using only the data points comprising our field collections, which are the best vetted for geolocation and taxonomic identity. Within this more stringent analysis, we reduced the number of variables to one each from among UPGMA clusters in order to limit redundancy due to co-variance. We performed the UPGMA in R using a core hierarchical clustering function on the standardized environmental variables, and we selected variables from clusters more divergent than height five, where height is roughly equivalent to units of standard deviation.
Results
Sequence Characteristics and Within-Population Genetic Diversity
The aligned cpDNA-IGS data represented all 459 individuals from 42 populations and comprised 3057 bp (2962 bp when indels were excluded) with 26 single nucleotide polymorphisms, of which 25 were parsimony informative. There were also 10 homopolymeric indels ranging from 1 to 24 bp that we removed. From among the 459 individuals, we identified 24 unique haplotypes based on single nucleotide polymorphisms. Among the haplotypes, H3 exhibits a broad east-west distribution across the northern range of RS and RO within the southwestern mountains of China and adjacent areas, and H1 is regionally common within the southeastern part of the range (i.e., southeastern Hengduan Mountains, Figure 2). The network analysis shows haplotype H3 in a central position with many connections, suggesting that it is ancestral to the others (Figure 2). However, chloroplast data resolved no significant differences between these two putative species.
The matrix for phylogeny represented 25 haplotypes and 4 samples comprising the outgroup, and consisted of 3068 bp with 60 variable sites, of which 38 were parsimony informative. PartitionFinder yielded two partitons (trnL-trnf + tabE-ndhJ, ndhF-rpl32) with the best models as GTR and GTR + I, respectively. Topologies generated by NJ and ML were congruent in terms of major clades, thus only the NJ tree is presented in Supplementary Figure S1. The monophyly of RS-RO was strongly supported with NJ bootstrap values (87%), although lineages within RS-RO were not well-resolved.
Genetic statistics representing the cpDNA generally revealed high diversity values. In particular, genetic differentiation (GST = 0.695, NST = 0.811) was high, and NST was greater than GST for all populations and in the metapopulation (p < 0.01, Supplementary Table S1) based on permutation tests, suggesting the existence of phylogeographic structure. Moreover, the total nucleotide (π) and haplotype (Hd) diversity across the metapopulation were 0.00062 and 0.766, respectively, and genetic diversity for the metapopulation (HT = 0.790) was higher than the average diversity within populations (HS = 0.241).
The single copy nuclear gene, LEAFY, comprised 752 bi-parental alleles of 619 bp in alignment with 38 variable sites representing 41 unique haplotypes. The haplotypes were clustered in three groups within the network analysis, which showed moderate support a split between cluster I and clusters II and III (95% bootstrap support (BS), 500 replicates, Figure 3), and lower support for a split between cluster III and the others (<10% BS; Figure 3). Based on the LEAFY haplotypes, we found that total nucleotide (π) and haplotype (Hd) diversity in all populations was 0.010 and 0.937. Genetic diversity calculated for all populations (HT = 0.950) was higher than the average intrapopulation diversity (HS = 0.520). We also detected significant phylogeographic structure due to genetic differentiation based on NST (0.798) being much greater than GST (0.452) in all populations and within the metapopulation (p < 0.01, Supplementary Table S1).
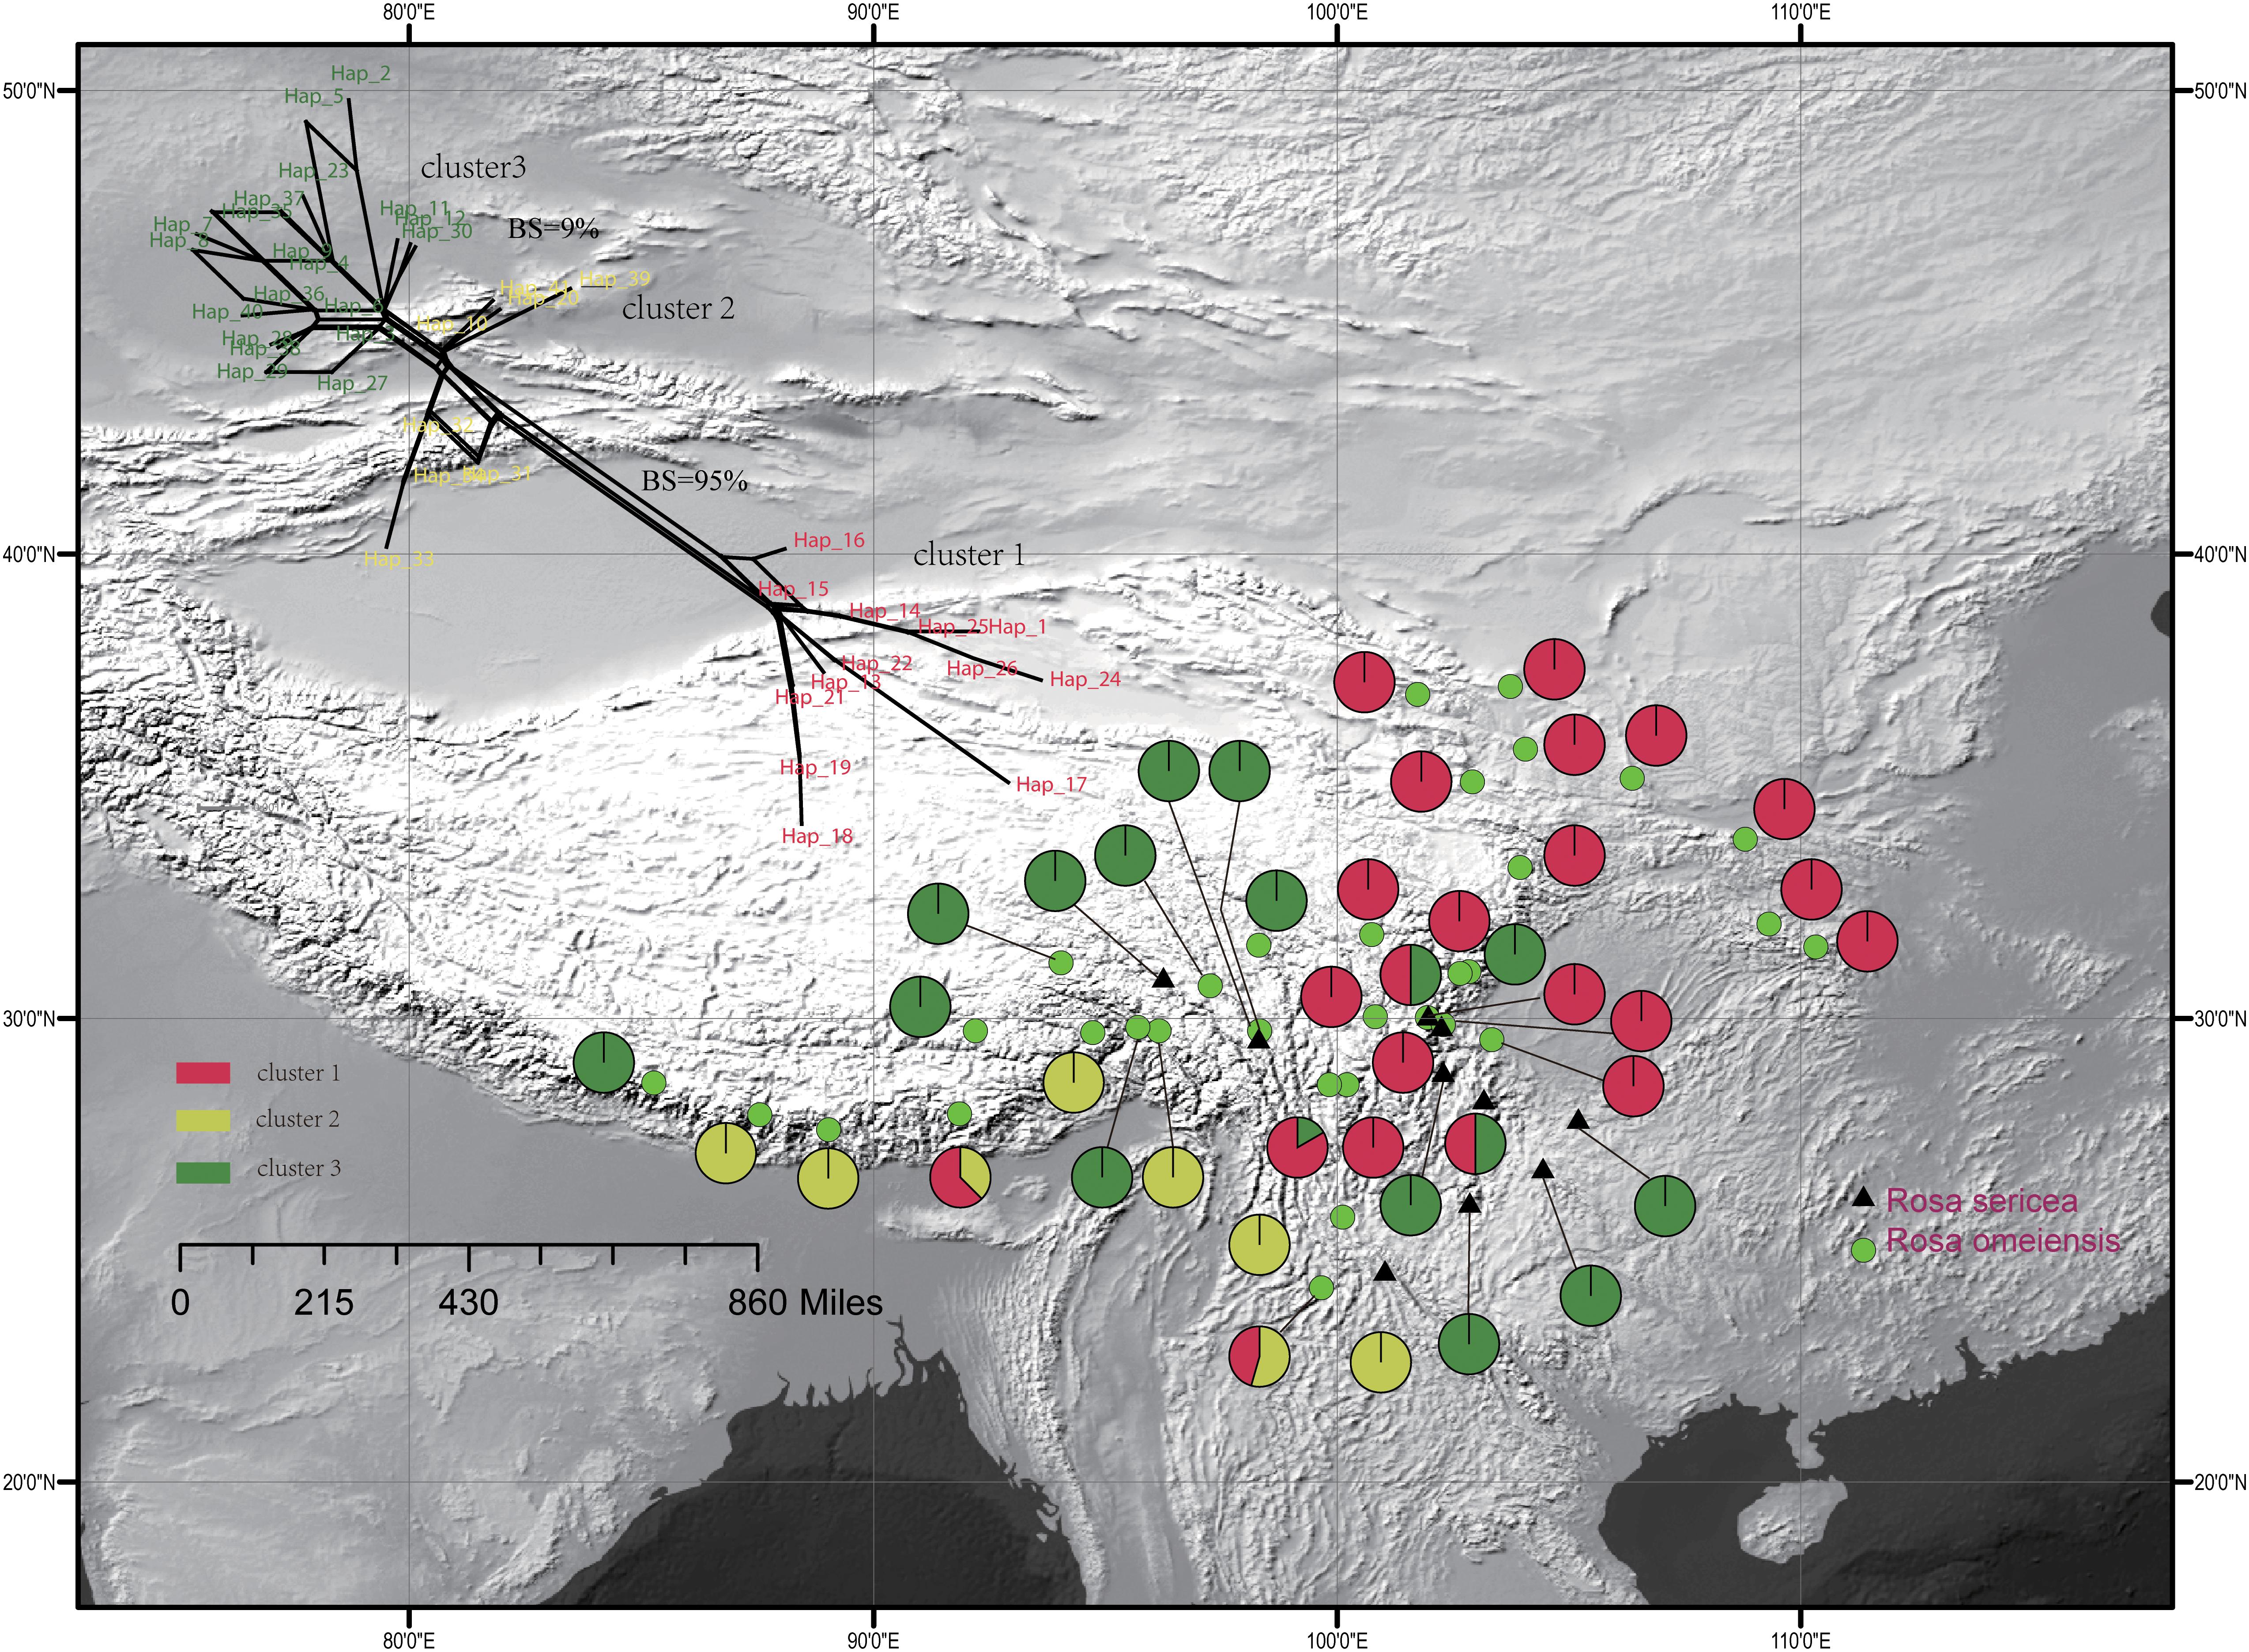
Figure 3. Geographic distribution of the 42 populations of the R. sericea complex color-coded according to the network analysis of the phased genetic sequences from LEAFY. Network shown at top and constructed in SplitsTree. Map generated in ESRI ArcGIS 10.0 (Esri, 2010).
Nuclear Microsatellite Genotyping
From the 42 populations representing the RS-RO, we detected a total of 186 alleles from among the eight nSSR loci surveyed, and we inferred high mean per-locus allele and gene diversity (NA = 23.25; HS = 0.578; HT = 0.806; see Supplementary Table S2). Population differentiation (FST) was significant at each locus (P < 0.05) and averaged across all loci (0.283; Supplementary Table S2).
For the entire nSSR dataset (42 populations, n = 507), STRUCTURE yielded the highest likelihood when samples were clustered into two groups (K = 2, Supplementary Figure S2). The STRUCTURE results showed distinct geographic patterns (Figure 4); namely western, northwestern, and northeastern populations were more genetically isolated than central and south-central populations, which were more admixed (Figure 4). However, there was no observable relationship between the clusters inferred in STRUCTURE and recognized species within RS and RO or between the clusters and morphology. The two major clusters revealed by nSSR were largely congruent with the two highly supported clusters in LEAFY (Figures 3, 4; excluding the weakly supported split between Clusters II and III in LEAFY).
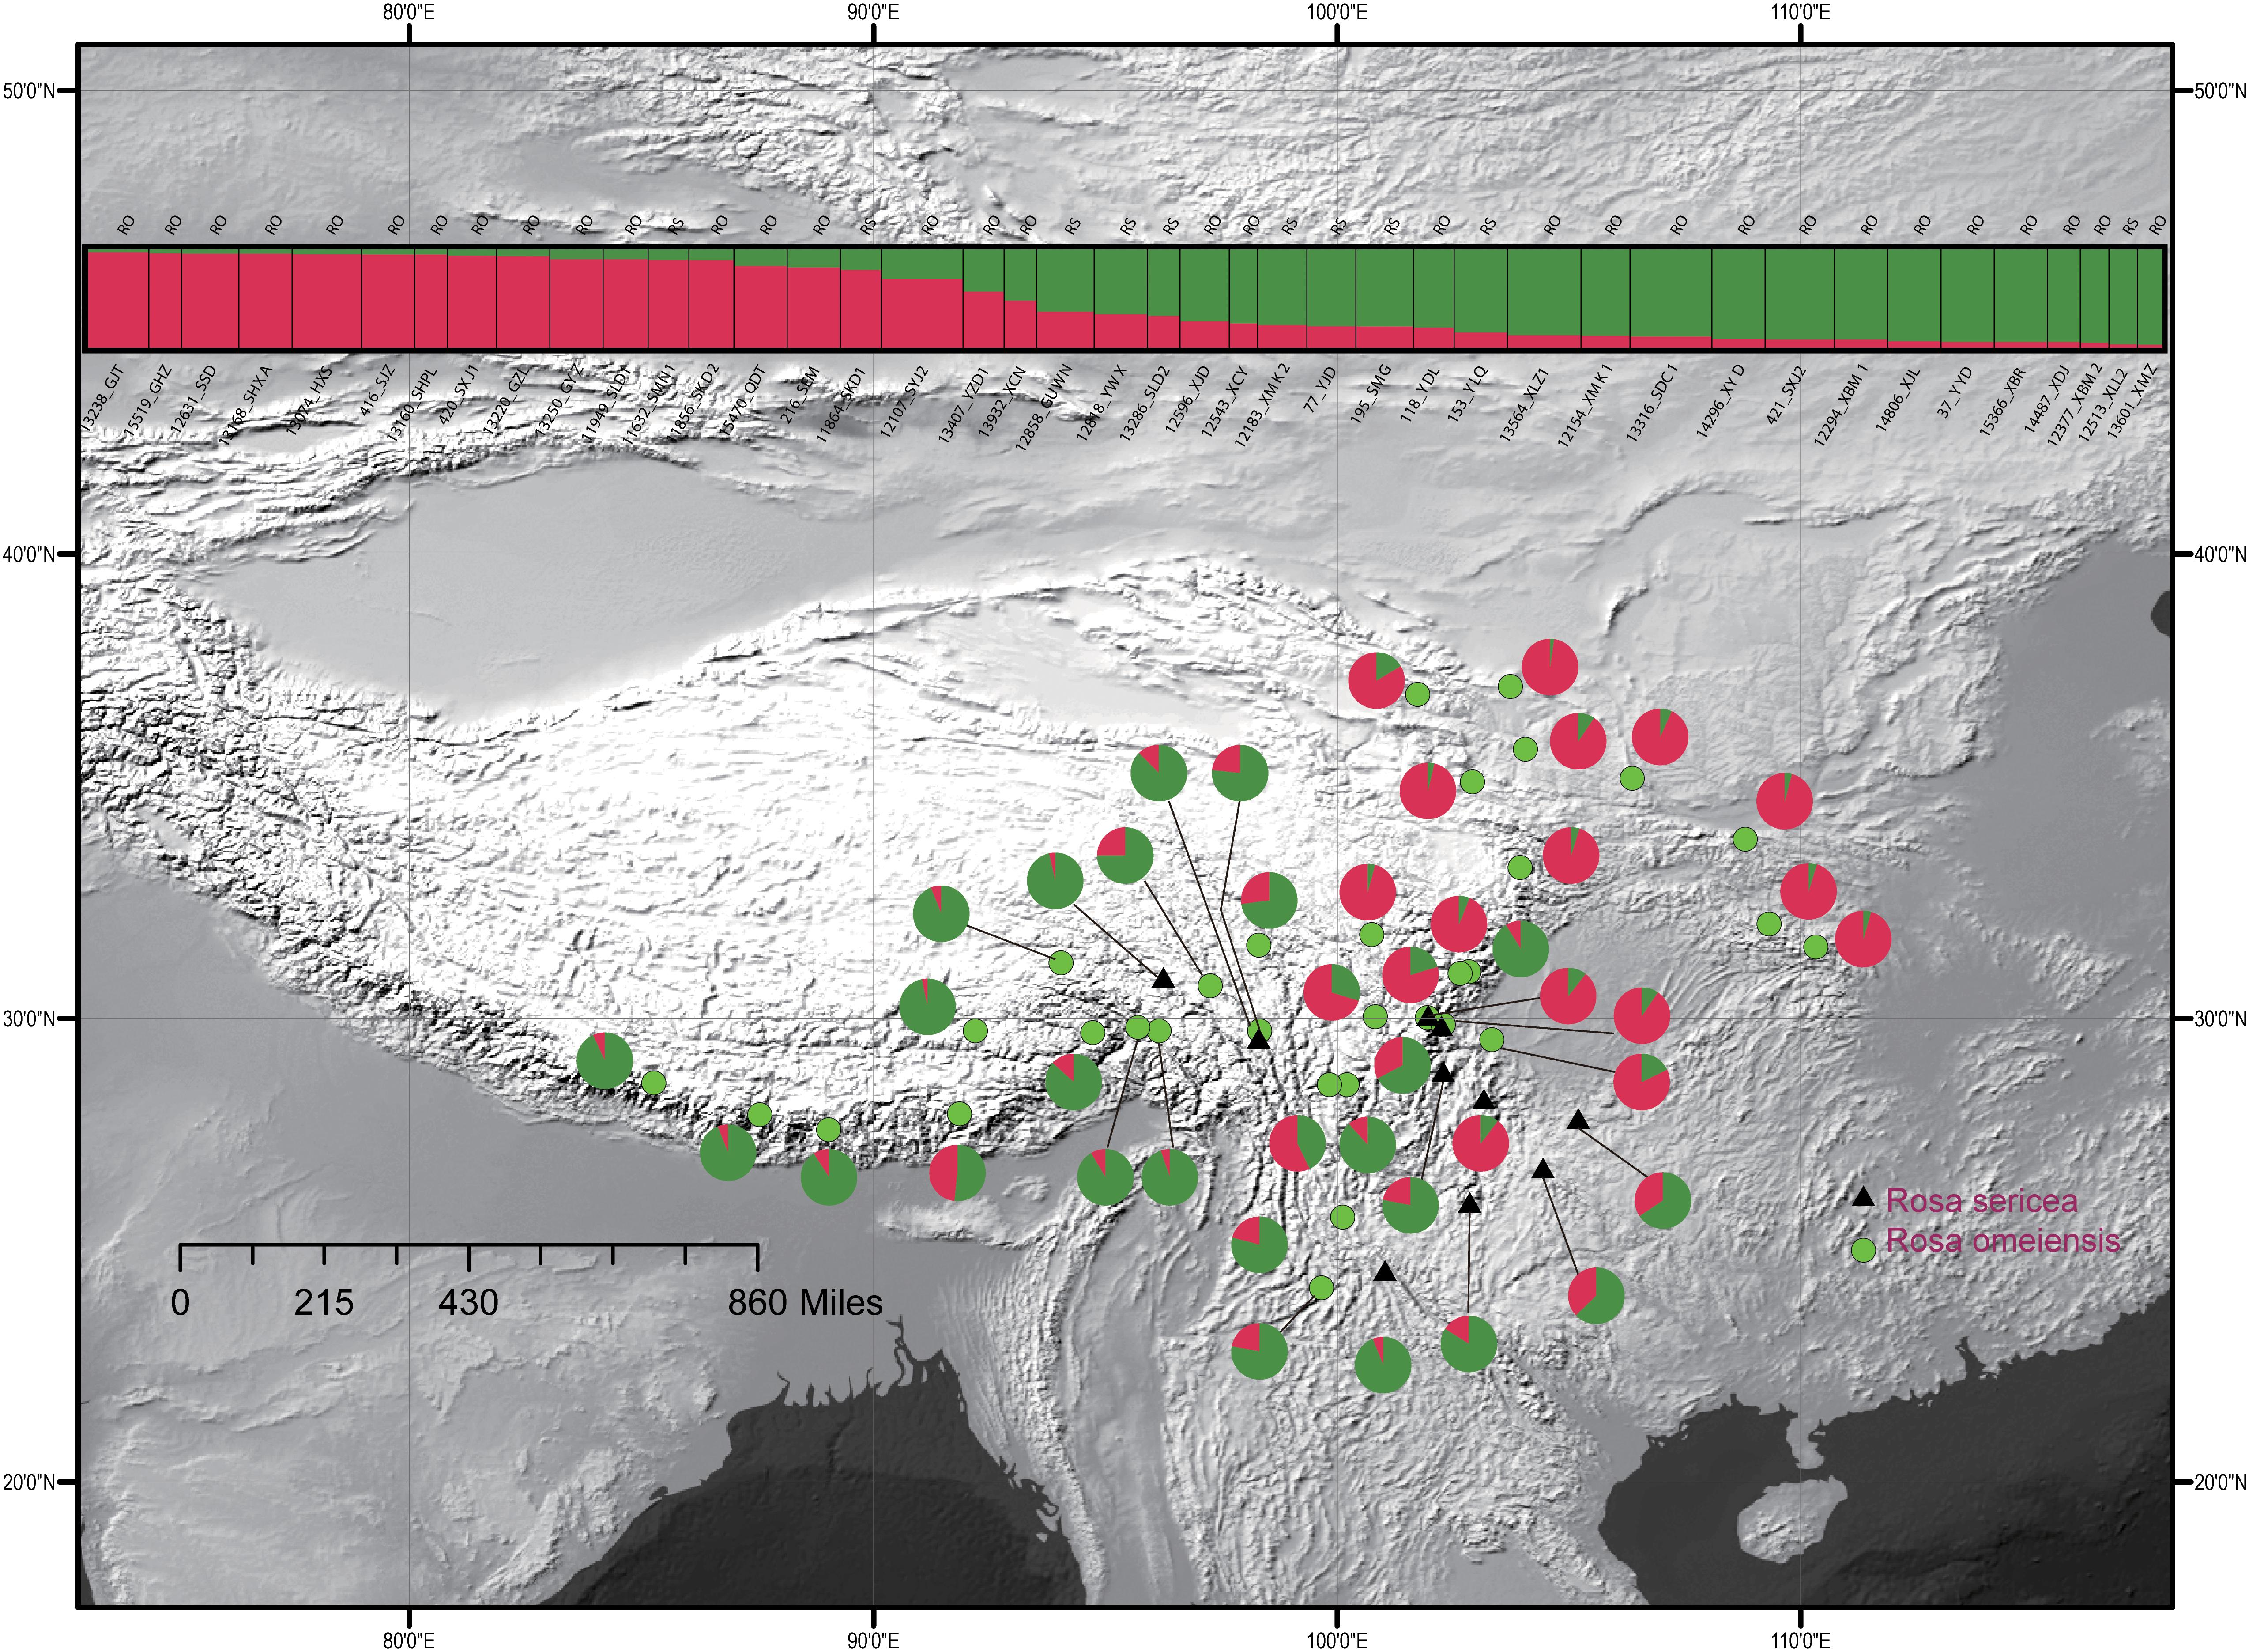
Figure 4. Geographic distribution of the 42 populations of the R. sericea complex color-coded according their groups inferred with analysis in STRUCTURE of eight nuclear microsatellite (nSSR) loci. Histogram of the STRUCTURE assignment test for 42 populations (507 individuals) shown at top. Population codes and abbreviation for species are identified in Table 1. Map generated in ESRI ArcGIS 10.0 (Esri, 2010).
Population Genetic and Phylogeographic Structure
Spatial genetic analyses of cpDNA haplotypes from 42 populations using SAMOVA indicated that FCT increased asymptotically with K clusters from 2 to 20 such that K > 12 did relatively little to improve the clusters by further reducing variation within them (data not shown). None of the 2–20 ways of clustering the populations showed a relationship to morphology or, consequently, to current taxonomic treatments. Therefore, we used taxonomy to divide the sampled populations into two groups for AMOVA analysis (Figure 2 and Table 1) and conducted the analyses on both nuclear and plastid datasets. The AMOVA analyses based on LEAFY (PV = 5.05%, FCT = 0.05046, P < 0.005, Supplementary Table S3) and cpDNA (PV = 11.52%, FCT = 0.11518, P < 0.01, Supplementary Table S4) showed a very low level of variation among groups defined according to morphology and classical taxonomy. Thus, neither genetic dataset supports treating RS and RO as independent species. Within species, the LEAFY dataset revealed higher variation within populations rather than among them, while the opposite was true for the cpDNA (Supplementary Table S3).
Environment Niche Modeling (ENM)
The Maxent models had strong predictive power based on 10 replicates: AUC = 0.989 ± 0.005 (mean ± SD) in RS and AUC = 0.987 ± 0.002, in RO. The models yielded predictions that were similar to the known geographic distributions of both species at a threshold of 0.50 (Figures 5A,B). The main geographic distributional areas for both species were predicted within southwestern China, mainly at high elevations. Though the modeled ranges of the species overlap, the range of RO appears to include higher elevation areas compared to RS.
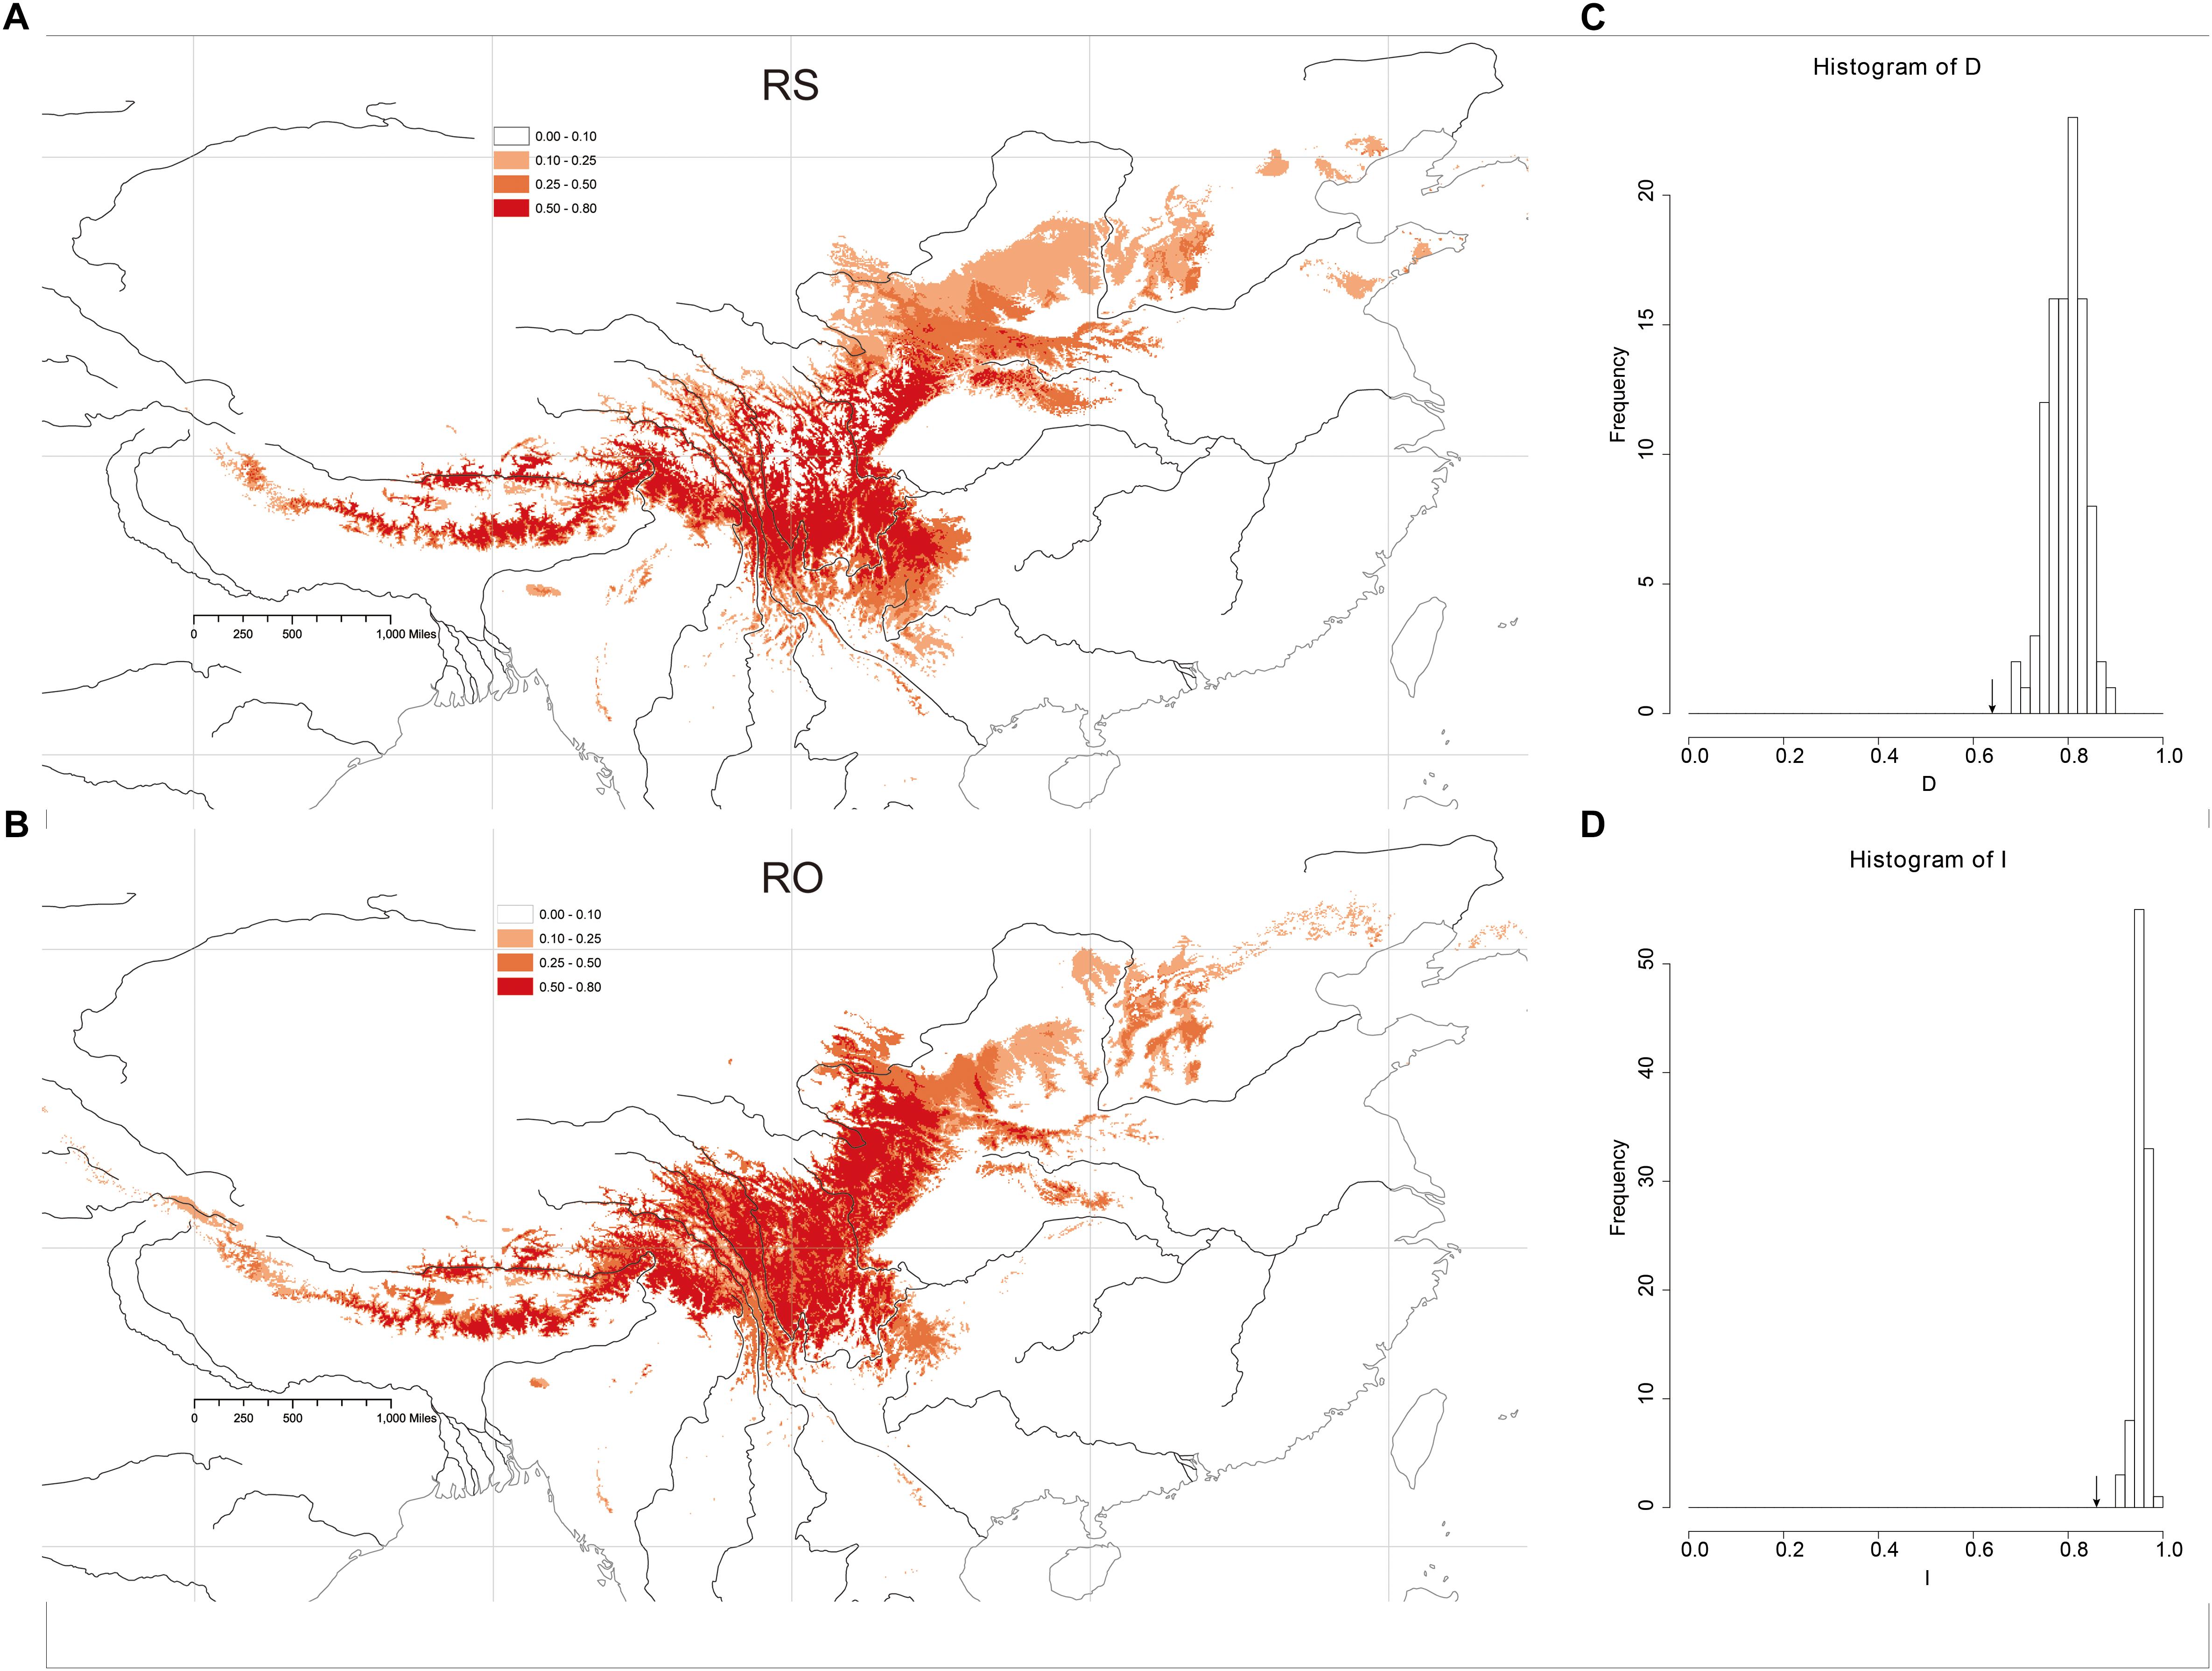
Figure 5. Heat map representing probability of geographic distribution of (A) R. sericea and (B) R. omeiensis based on ENM (logistical values from MaxEnt). Shown at 2.5 arc minute resolution and projected based on present day climatic conditions. Occurrence records plotted as black points on maps generated by ESRI ArcGIS 9.3 (Esri, 2010). (C,D) Shows histograms of niche identity tests: Schoener’s D and Warren’s I, respectively.
Niche Comparation and Principal Component Analysis (PCA)
Niche-identity tests comparing the niches of the two Rosa species yielded similarity values of 0.860 according to Warren’s I and 0.609 based on Schoener’s D. Comparisons of the observed I and D values to null distributions showed that the species did not occupy identical niches (P < 0.01, P < 0.01, respectively) (Figures 5C,D). Thus, the niche of each species includes some distinct environments.
The PCA analyses also do not show strong niche differentiation between RS and RO according to 55 total temperature and precipitation variables (Figure 6). However, some niche differentiation is apparent from PC axis 1. The hierarchical clustering of environmental variables revealed eight distinct clusters of variables, which are also apparent from the plot of our PCA (Figure 6). Among the clusters, the variables with the highest loadings on PC axis 1 were: average precipitation during November (prec11), average minimum temperature during November (temp11), mean diurnal temperature range (bio2), temperature isothermality (bio3), temperature seasonality (bio4), elevation (alt; altitude), temperature annual range (bio7), and precipitation seasonality (bio15). In the analysis using only these variables and our field collected data, clear, though limited, separation of putative species along PC axis 1 was apparent (Supplementary Figure S3). The importance of elevation was apparent from the contours, which showed that the lowest elevation populations were those of RS while the highest elevations were most often RO (Figure 6 and Supplementary Figure S3).
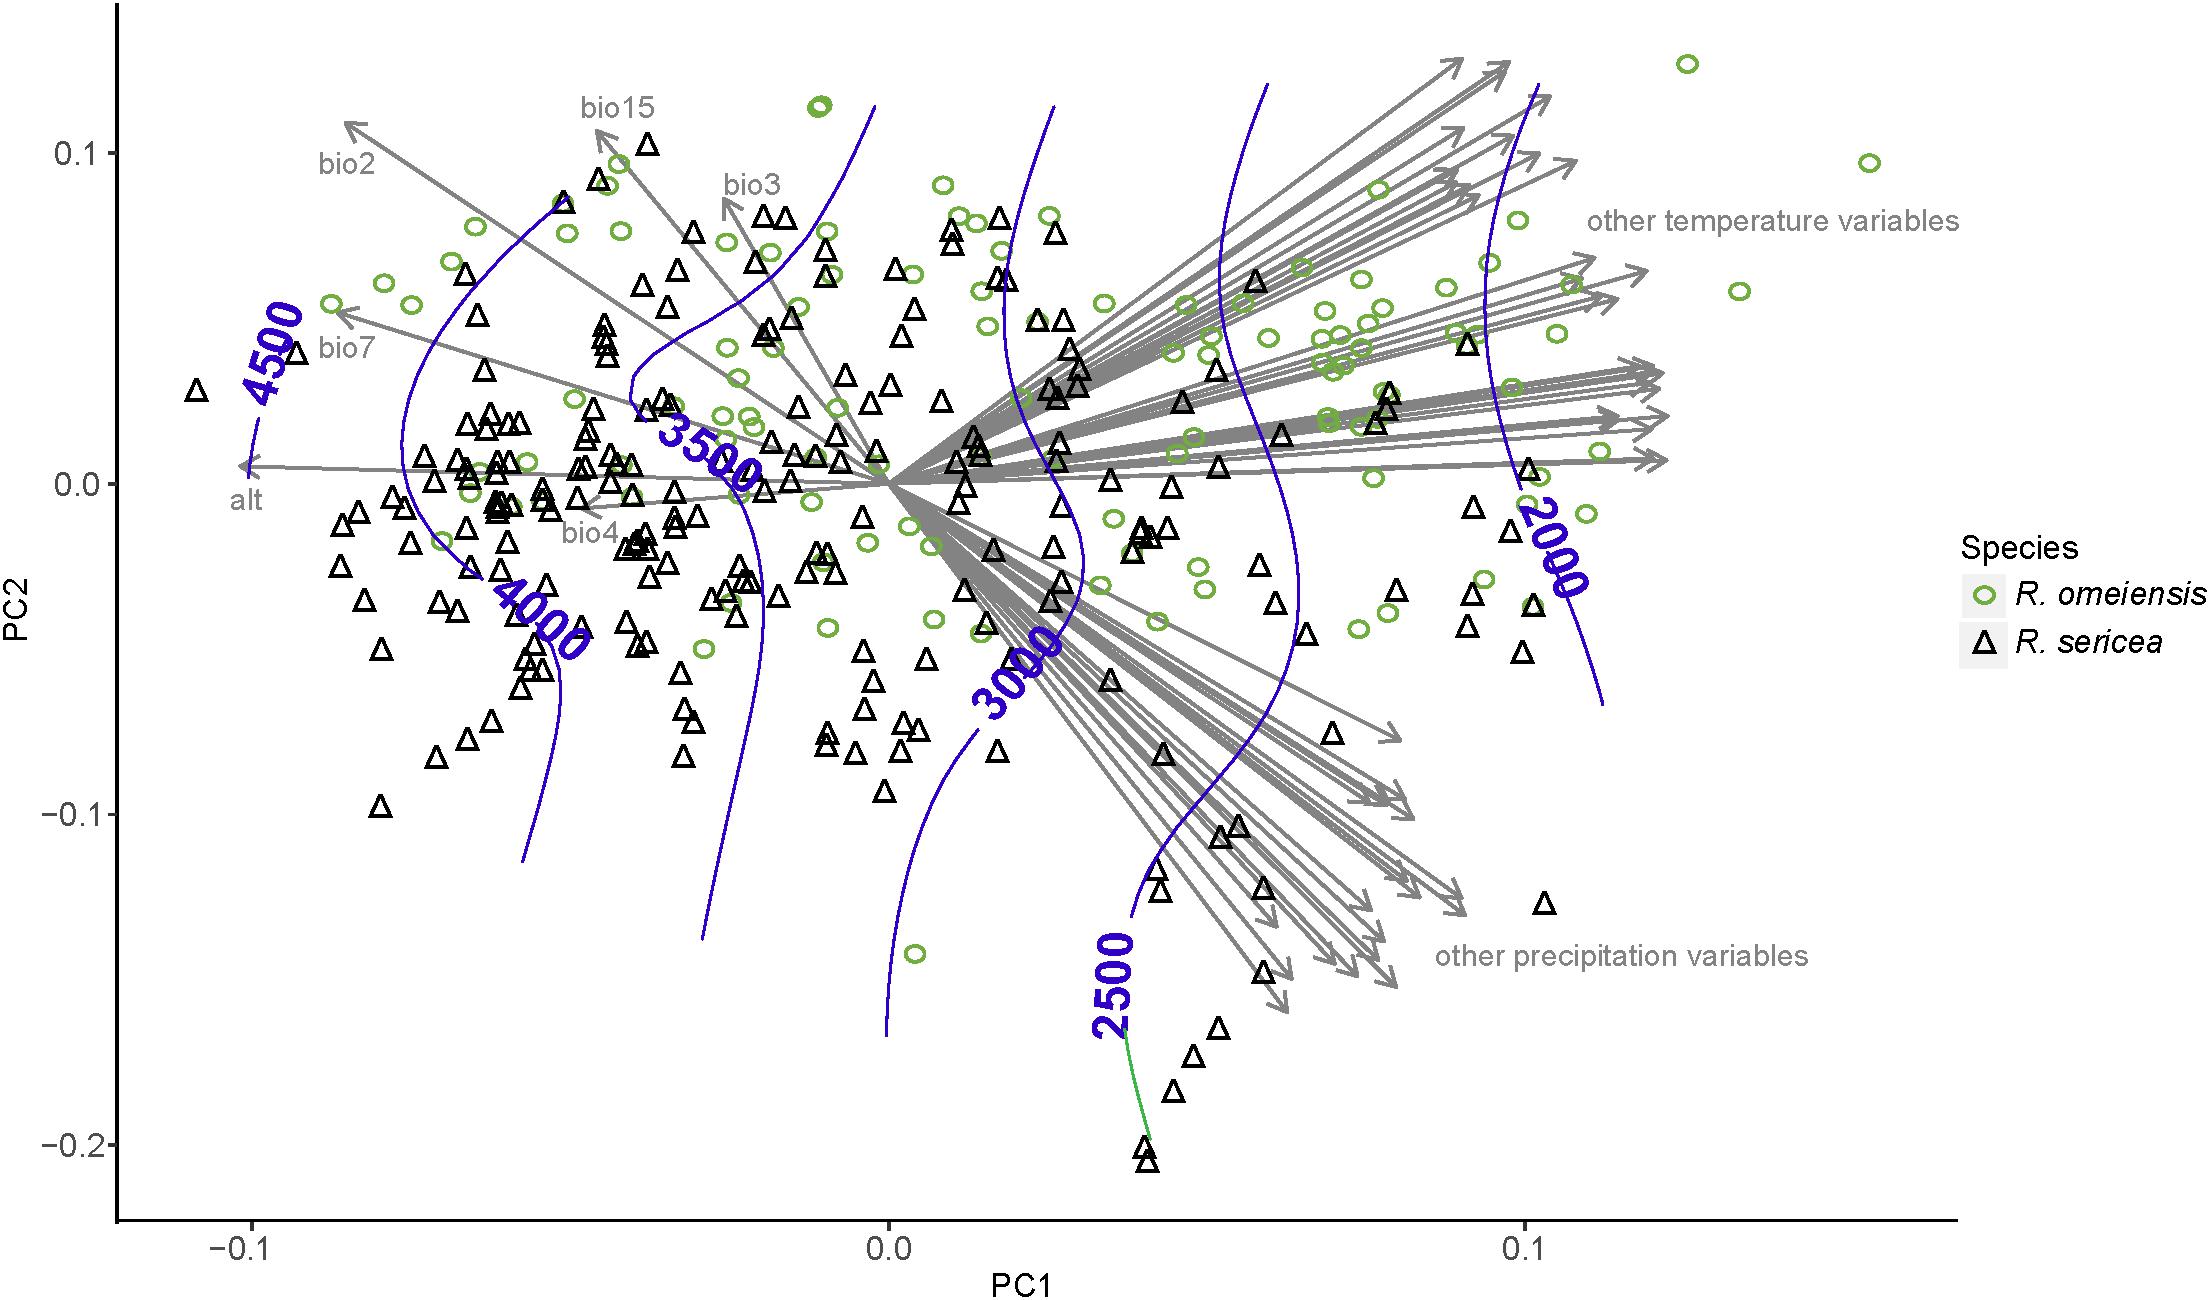
Figure 6. Results of a principal component analysis (PCA) using environmental variables from all vetted occurrence data points, including field collections, herbarium specimens, and records from databases. The variables with the highest loadings on PC axis 1 were: mean diurnal temperature range (bio2), temperature isothermality (bio3), temperature seasonality (bio4), elevation (alt; altitude), temperature annual range (bio7), and precipitation seasonality (bio15). All abbreviations of variables follow WorldClim (Hijmans et al., 2005); http://www.worldclim.org/.
Discussion
RS, RO, and Modes and Mechanisms of Divergence
Populations within RS and RO exhibit clear morphological variation (Figure 1), leading to the recognition of several different species, including RS and RO. The morphological differences among entities within RS-RO may be explained by one or several historical or ongoing evolutionary processes. One possible explanation is that RS-RO represents a single, hyperdiverse species. As a hyperdiverse species, RS-RO would likely exhibit genetic panmixia or high levels of gene flow due to more-or-less continuous contact among populations (Hamrick and Godt, 1990; Constance and William, 1991). The morphology of a hyperdiverse species may be intergrading or show some association with the local environment. RS-RO as a single hyperdiverse species comprises a null taxonomic hypothesis (Link-Pérez, 2010) while the alternative is that speciation has occurred or is occurring. If speciation has occurred or is occurring, we would expect to detect clear genetic differentiation, which may be stronger if speciation is complete, or weaker if it is ongoing or confounded by introgression (Nosil, 2008; Liu et al., 2018).
Genetic differentiation between RS and RO is apparent but limited. For example, the AMOVA analyses of the LEAFY (Supplementary Table S3) and cpDNA data (Supplementary Table S4) show low to moderate genetic differentiation, respectively (following criteria in Hartl and Clark, 1997). Moreover, the cpDNA haplotypes, notwithstanding haplotype H3, are largely unique within each traditionally recognized taxon even when populations of RS and RO are geographically proximal (Figure 2). Based on these findings, we reject the null hypothesis that the RS-RO comprises one species but suggest that the signal supporting a speciation hypothesis is limited due to confounding effects. The weak signal most likely arises from recent initiation of speciation within the complex and continued gene flow among differentiating lineages (Arnold, 2016).
Speciation in RS-RO may be allopatric, sympatric, or parapatric (Ridley, 2004). Allopatric speciation should be detectable according to separation in geographic space while, sympatric species should co-occur in geographic space. In contrast to these, parapatry should lead to differentiation along an environmental gradient or possibly at the edges of the geographic range (Helbig et al., 2002).
In RS-RO, parapatric speciation, or ecological differentiation, is congruent with our observations in the field and analyses based on ENM (Figure 5) and PCA results (Figure 6 and Supplementary Figure S3). In the field, we observed that several populations of RS-RO represented co-occurrences of the two species along mountainous slopes at lower and higher elevations, respectively (e.g., SLD1 and SLD2, Table 1). The ENM and PCA show incompletely overlapping distributions in geographic and environmental space, respectively, and indicate that the non-overlapping portions of the ranges are at elevational extremes. Therefore, the ENM and PCAs support our observations in the field, which led us to believe that RS-RO is diversifying along an elevational gradient.
Although we suspect that speciation within the RS-RO is best classified as parapatric, we detected isolation by distance in both the cpDNA and LEAFY datasets as would be expected in the case of allopatric speciation. However, isolation by distance is not uncommon even among single, hyperdiverse species (e.g., Andrew et al., 2012). Moreover, a previous study (Gao et al., 2015b) showed recent differentiation between RS and RO, and this helps to rule out allopatry with secondary contact as the explanation for limited observed genetic diversity.
Diversification in RS-RO may have begun during Last Glacial Maximum (LGM, 1.8k yr) (Gao et al., 2015b). During the LGM, the colder climate probably resulted in a lower tree line (Hewitt, 1996, 1999, 2000), generating additional open, alpine habitat suitable for these roses. These alpine habitats may have been broader and more highly connected geographically so that gene flow among populations of RS-RO could readily occur. Within the broadly available alpine habitats, populations constituting RS and RO may have begun to diversify ecologically. Recent initiation of speciation, such as following the LGM, is consistent with the short branches connecting diverse haplotypes of the ancestral type, H3 (Figure 2).
Many prior studies have inferred the importance of Pleistocene glaciations and climatic oscillations (e.g., Sage and Selander, 1975; Rainey and Travisano, 1998) on plant demography in mountainous southwestern China (reviewed in Qiu et al., 2011). During glacial periods, cool-adapted plant species, such as Rosa, may have radiated within lower elevations but have had fragmented refugial ranges at higher elevations during interglacials (DeChaine and Martin, 2004; Jaramillo-Correa et al., 2006, 2008; Yuan et al., 2006). Repeated radiation and fragmentation events probably may have facilitated allopatric divergence and opportunities for secondary contact. However, the predominate demographic pattern that we detected in the RS-RO is inconsistent with this commonly inferred scenario, under which we would expect to detect genetically diverse, geographically limited refugial areas with ancestral haplotypes as well as ecological stasis among populations (Constance and William, 1991; Hewitt, 1996, 1999, 2000; Provan and Bennett, 2008; Falcon-Lang and Dimichele, 2010). In contrast, the RS-RO exhibits a widespread ancestral haplotype, H3, broad diversity of genotypes geographically, and ecological divergence, especially for tolerances of elevation range, climatic seasonality, and weather during some of the coldest months of the year (Figure 6 and Supplementary Figure S3).
Differing Demographic Patterns According to cpDNA and Nuclear DNA
We observed different demographic patterns of isolation by distance based on the cpDNA and nuclear datasets. In particular, the cpDNA data showed notable divergence across a north to south axis (i.e., widespread haplotypes H3 in the north and H1 in the south; Figure 2) while the nuclear data revealed predominant divergence along a northeast–southwest axis (Figures 3, 4). These discordant demographic patterns may result from different dispersal vectors for seeds, which transmit the cpDNA genome, and pollen, which carries one half of the information transmitted within the biparentally-inherited nuclear genome.
Pollen and seed dispersal are known to be important for determining the spatial patterns of gene flow among plant populations, and, for plant species relying on zoonotic pollinators and frugivores as dispersal vectors, animal behaviors are also determinants of demography (Ennos, 1994; Garcia et al., 2007; Krauss et al., 2009; Marsico et al., 2009; Jordano, 2010; Calvino-Cancela et al., 2012). Pollen dispersal in the genus Rosa is reportedly carried out by insects, especially Aculeate of Hymenoptera (bees and wasps), Diptera (true flies), and Lepidoptera (moths and butterflies) (summarized in Jacobs et al., 2009), while the seeds of Rosa are dispersed within nutritive, fleshy fruits primarily by birds and other vertebrates (Herrera, 1984). Therefore, differences among the behaviors of these animal groups could lead to discordance between the demographies of the cpDNA and nuclear genotypes. Conversely, broad groups of pollinators are largely constrained to plant community types, which are more similar east to west and differ markedly differ more markedly along a steep north-south latitudinal gradient (Stibig et al., 2004; Kato et al., 2008). While pollen dispersal by insects tends to be local and is regarded as “long distance” when it occurs over 100s of meters or a few kilometers (Nason et al., 1996; Schulke and Waser, 2001), pollination across local and “long” distances would be sufficient to maintain gene flow between adjacent populations.
Species Concept: Integrating Ecology
RS and RO exhibit clear morphological differentiation (e.g., Ku and Robertson, 2003), and in our field studies, we did not observe intergrading morphology, even when populations were geographically proximal or intermixed, except uncommonly among a few individuals. Nevertheless, morphology alone has been insufficiently convincing to resolve taxonomic difficulties within the RS-RO because these traits could represent acclimation instead of evolutionary adaptation. This is especially true given limited genetic variability between the putative species and the occasional individual with intermediate traits. Thus, only by integrating ecology, are we able to infer recent or ongoing speciation within RS-RO and show support for the existing taxonomic opinion that R. sericea and R. omeiensis represent unique, divergent or diverging entities. Ecological features are now widely used as a component of species delimitation as well as to detect cryptic species [e.g., Madagascar day geckos and other vertebrate species in Madagascar (Raxworthy et al., 2003, 2007)].
The traits that distinguish RS and RO are likely to have ecological importance as adaptations along the environmental gradient over which these two species are diverging. In RS, the smaller number of leaflets may represent an adaptation to temperature, which is higher in the lower elevations where the species occurs and, thus, increases potential for water loss. Plants can mitigate water loss in higher temperature environments with smaller leaf surface areas (Givnish and Kriebel, 2017), such as from the smaller number of leaflets in RS. The relationship of pedicel thickness to the environments favored by RS and RO is more difficult to assess. However, in general, greater investment in fruits is known to be correlated with attracting dispersal vectors and providing protection and nutrition for embryos (Salisbury, 1942).
Several recent proposals for species concepts assert the importance of integration of ecology with morphology and genetic evidence. For example, under the unified species concept of De Queiroz (2005, 2007), ecological divergence is one of many equally important lines of evidence that can support the existence of a unique evolutionary lineage. Similarly, Freudenstein et al. (2017), argued that species are distinguished within lineages by having unique ecological roles, which represent the interactions of their morphology with the environment. Although these modern concepts have highlighted the importance of integrating ecology alongside other aspects of species biology into taxonomic thinking, the notion that speciation is influenced or mitigated by ecological interactions dates at least to the 1940s (Mayr, 1942; Schluter, 2001) if not to Darwin and Wallace (1858), who posited that environmental factors were the mechanisms of natural selection. Here, we loosely adopt the highly theoretical unified species concept of De Queiroz, 2007) for RS and RO, between which we show evidence of ecological divergence and in which we and others have observed clear morphological differences. Future studies may examine the ecological impacts of the morphological differences between the two species and develop a more mechanistic taxonomic concept consistent with Freudenstein et al. (2017).
Conclusion
While a traditional genetics method failed to recover a clear boundary between two morphologically distinct, well-recognized entities, R. sericea and R. omeiensis, we detected differing ecological preferences along an environmental gradient between these entities suggesting ongoing parapatric speciation. We advocate that the clear morphological and ecological differences R. sericea and R. omeiensis are sufficient for their delimitation as independent species. In fact, species concepts require integrated evidence such as monophyly, genetic diversity, ecology, morphology, and so on to delimit evolutionarily unique entities, because evolution is continuous and leaves different, detectable footprints within different groups of organisms. Moreover, integrative species concepts are particularly important for plants, which sometimes maintain gene flow at low levels even among long-diverged lineages. Recognition of unique entities, such as R. sericea and R. omeiensis, has important implications for conservation decisions and robust estimates of biodiversity.
Author Contributions
X-FG: conceive and design the experiments. Y-DG: perform the experiments. Y-DG and AH: analysis the data. X-FG, Y-DG, and AH: contributed reagents, materials, analysis tools, and wrote the manuscript.
Funding
This research was supported by grants from The National Natural Science Foundation of China (NSFC Grant No. 31670192), Science & Technology Basic Resources Investigation Program of China: Survey and Germplasm Conservation of Plant Species with Extremely Small Population in South-west China (2017FY100104), and The China Postdoctoral Science Foundation (Grant No. 2013M542296) to Y-DG.
Conflict of Interest Statement
The authors declare that the research was conducted in the absence of any commercial or financial relationships that could be construed as a potential conflict of interest.
Acknowledgments
We are grateful to Drs. Yulan Peng, Bo Xu, Liang Zhang, Xueli Zhao, Zhangming Zhu, and Mr. Wenbin Ju who joined in some of the field surveys. We appreciate Ms. Xuexian Wu, Mr. Kun Yang, and Ms. Shiqi Li for assistance with lab work, and we thank the curators and staff people of the herbaria A/GH, BM, CDBI, E, HNWP, IBSC, K, KATH, KUN, PE, TUCH, and WUK for their help when X-FG visited in person.
Supplementary Material
The Supplementary Material for this article can be found online at: https://www.frontiersin.org/articles/10.3389/fpls.2019.00321/full#supplementary-material
Footnotes
References
Abbott, R. J., and Brennan, A. C. (2014). Altitudinal gradients, plant hybrid zones and evolutionary novelty. Philos. Trans. R. Soc. B Biol. Sci. 369:20130346. doi: 10.1098/rstb.2013.0346
Agapow, P. M., Bininda-Emonds, O. R., Crandall, K. A., Gittleman, J. L., Mace, G. M., Marshall, J. C., et al. (2004). The impact of species concept on biodiversity studies. Q. Rev. Biol. 79, 161–179. doi: 10.1086/383542
Aldhebiani, A. Y. (2018). Species concept and speciation. Saudi J. Biol. Sci. 25, 437–440. doi: 10.1016/j.sjbs.2017.04.013
An, Z.-S., Kutzbach, J. E., Prell, W. L., and Porter, S. C. (2001). Evolution of Asian monsoons and phased uplift of the himalaya-tibetan plateau since late miocene times. Nature 411, 62–66. doi: 10.1038/35075035
Andrew, R. L., Ostevik, K. L., Ebert, D. P., and Rieseberg, L. H. (2012). Adaptation with gene flow across the landscape in a dune sunflower. Mol. Ecol. 21, 2078–2091. doi: 10.1111/j.1365-294X.2012.05454.x
Bond, W. J. (1989). The tortoise and the hare: ecology of angiosperm dominance and gymnosperm persistence. Biol. J. Linnean Soc. 36, 227–249. doi: 10.1111/j.1095-8312.1989.tb00492.x
Calvino-Cancela, M., Escudero, M., Rodriguez-Perez, J., Cano, E., Vargas, P., Velo-Anton, G., et al. (2012). The role of seed dispersal, pollination and historical effects on genetic patterns of an insular plant that has lost its only seed disperser. J. Biogeogr. 39, 1996–2006. doi: 10.1111/j.1365-2699.2012.02732.x
Caro, L., Caycedo-Rosales, P., Bowie, R., Slabbekoorn, H., and Cadena, C. (2013). Ecological speciation along an elevational gradient in a tropical passerine bird? J. Evol. Biol. 26, 357–374. doi: 10.1111/jeb.12055
Carpenter, C. (2005). The environmental control of plant species density on a Himalayan elevation gradient. J. Biogeogr. 32, 999–1018. doi: 10.1111/j.1365-2699.2005.01249.x
Ceballos, G., Ehrlich, P. R., Barnosky, A. D., García, A., Pringle, R. M., and Palmer, T. M. (2015). Accelerated modern human–induced species losses: entering the sixth mass extinction. Sci. Adv. 1:e1400253. doi: 10.1126/sciadv.1400253
Chen, F. B. (1992). H-D event: an important tectonic event of the late Cenozoic in Eastern Asia. Mt. Res. 10:8.
Clement, M., Posada, D., and Crandall, K. A. (2000). TCS: a computer program to estimate gene genealogies. Mol. Ecol. 9, 1657–1659. doi: 10.1046/j.1365-294x.2000.01020.x
Colin, E. H., and Guy, W. A. (2015). The ubiquity of alpine plant radiations: from the andes to the Hengduan Mountains. New Phytol. 207, 275–282. doi: 10.1111/nph.13230
Constance, I. M., and William, J. L. (1991). “Strategies for conserving clinal, ecotypic, and disjunct population diversity in widespread species,” in Genetics and Conservation of Rare Plants, ed. D. A. Falk (Oxford: Oxford University Press), 283.
Darwin, C., and Wallace, A. R. (1858). On the tendency of species to form varieties; and on the perpetuation of varieties and species by natural means of selection. Zool. J. Linnean Soc. 3, 45–62. doi: 10.1111/j.1096-3642.1858.tb02500.x
De Queiroz, K. (2005). Different species problems and their resolution. Bioessays 27, 1263–1269. doi: 10.1002/bies.20325
De Queiroz, K. (2007). Species concepts and species delimitation. Syst. Biol. 56, 879–886. doi: 10.1080/10635150701701083
DeChaine, E. G., and Martin, A. P. (2004). Historic cycles of fragmentation and expansion in Parnassius smintheus (papilionidae) inferred using mitochondrial DNA. Evolution 58, 113–127. doi: 10.1111/j.0014-3820.2004.tb01578.x
Dixon, P. (2003). VEGAN, a package of R functions for community ecology. J. Veg. Sci. 14, 927–930. doi: 10.1111/j.1654-1103.2003.tb02228.x
Doyle, J. J., and Doyle, J. L. (1987). A rapid DNA isolation procedure for small quantities of fresh leaf tissue. Phytochem. Bull. 19, 11–15.
Dupanloup, I., Schneider, S., and Excoffier, L. (2002). A simulated annealing approach to define the genetic structure of populations. Mol. Ecol. 11, 2571–2581. doi: 10.1046/j.1365-294X.2002.01650.x
Ennos, R. A. (1994). Estimating the relative rates of pollen and seed migration among plant-populations. Heredity 72, 250–259. doi: 10.1038/hdy.1994.35
Evanno, G., Regnaut, S., and Goudet, J. (2005). Detecting the number of clusters of individuals using the software STRUCTURE: a simulation study. Mol. Ecol. 14, 2611–2620. doi: 10.1111/j.1365-294X.2005.02553.x
Excoffier, L., Laval, G., and Schneider, S. (2005). ARLEQUIN (version 3.0), an integrated software package for population genetic data analysis. Evol. Bioinform. Online 1, 47–50. doi: 10.1177/117693430500100003
Excoffier, L., Smouse, P. E., and Quattro, J. M. (1992). Analysis of molecular variance inferred from metric distances among DNA haplotypes, application to human mitochondrial DNA restriction data. Genetics 131, 479–491.
Falcon-Lang, H. J., and Dimichele, W. A. (2010). What happened to the coal forests during Pennsylvanian glacial phases? PALAIOS 25, 611–617. doi: 10.2110/palo.2009.p09-162r
Fang, J. Y., Wang, Z. H., and Wang, Z. Y. (2011). Atlas of Woody Plants in China: Distribution and Climate. Berlin: Springer Science & Business Media. doi: 10.1007/978-3-642-15017-3
Farris, J. S., Kallersjo, M., Kluge, A. G., and Bult, C. (1994). Testing significance of incongruence. Cladistics 10, 315–319. doi: 10.1111/j.1096-0031.1994.tb00181.x
Fawcett, T. (2006). An introduction to ROC analysis. Pattern Recognit. Lett. 27, 861–874. doi: 10.1016/j.patrec.2005.10.010
Fick, S. E., and Hijmans, R. J. (2017). WorldClim 2: new 1-km spatial resolution climate surfaces for global land areas. Int. J. Climatol. 37, 4302–4315. doi: 10.1038/sdata.2018.254
Florio, A. M., Ingram, C. M., Rakotondravony, H. A., Louis, E. E., and Raxworthy, C. J. (2012). Detecting cryptic speciation in the widespread and morphologically conservative carpet chameleon (Furcifer lateralis) of Madagascar. J. Evol. Biol. 25, 1399–1414. doi: 10.1111/j.1420-9101.2012.02528.x
Fougere-Danezan, M., Joly, S., Bruneau, A., Gao, X. F., and Zhang, L. B. (2015). Phylogeny and biogeography of wild roses with specific attention to polyploids. Ann. Bot. 115, 275–291. doi: 10.1093/aob/mcu245
Freudenstein, J. V., Broe, M. B., Folk, R. A., and Sinn, B. T. (2017). Biodiversity and the species concept lineages are not enough. Syst. Biol. 66, 644–656. doi: 10.1093/sysbio/syw098
Funk, D. J., and Omland, K. E. (2003). Species-level paraphyly and polyphyly: frequency, causes, and consequences, with insights from animal mitochondrial DNA. Annu. Rev. Ecol. Evol. Syst. 34, 397–423. doi: 10.1016/j.ympev.2009.08.024
Gao, Y. D., Harris, A. J., and He, X. J. (2015a). Morphological and ecological divergence of Lilium and Nomocharis within the Hengduan Mountains and Qinghai-Tibetan plateau may result from habitat specialization and hybridization. BMC Evol. Biol. 15:147. doi: 10.1186/s12862-015-0405-2
Gao, Y. D., Zhang, Y., Gao, X. F., and Zhu, Z. M. (2015b). Pleistocene glaciations, demographic expansion and subsequent isolation promoted morphological heterogeneity: a phylogeographic study of the alpine rosa sericea complex (Rosaceae). Sci. Rep. 5:11698. doi: 10.1038/srep11698
Gao, Y. D., Harris, A. J., Zhou, S. D., and He, X. J. (2013). Evolutionary events in Lilium (including Nomocharis, Liliaceae) are temporally correlated with orogenies of the Q-T plateau and the Hengduan Mountains. Mol. Phylogenet. Evol. 68, 443–460. doi: 10.1016/j.ympev.2013.04.026
Garcia, C., Jordano, P., and Godoy, J. A. (2007). Contemporary pollen and seed dispersal in a Prunus mahaleb population: patterns in distance and direction. Mol. Ecol. 16, 1947–1955. doi: 10.1111/j.1365-294X.2006.03126.x
Gavrilets, S., Li, H., and Vose, M. D. (2000). Patterns of parapatric speciation. Evolution 54, 1126–1134. doi: 10.1111/j.0014-3820.2000.tb00548.x
George, G. S. (1951). The species concept. Evolution 5, 285–298. doi: 10.1111/j.1558-5646.1951.tb02788.x
Givnish, T. J., and Kriebel, R. (2017). Causes of ecological gradients in leaf margin entirety: evaluating the roles of biomechanics, hydraulics, vein geometry, and bud packing. Am. J. Bot. 104, 354–366. doi: 10.3732/ajb.1600287
Givnish, T. J., Millam, K. C., Mast, A. R., Paterson, T. B., Theim, T. J., Hipp, A. L., et al. (2009). Origin, adaptive radiation and diversification of the Hawaiian lobeliads (Asterales: Campanulaceae). Proc. R. Soc. B Biol. Sci. 276, 407–416. doi: 10.1098/rspb.2008.1204
Guo, Q., Kelt, D. A., Sun, Z., Liu, H., Hu, L., Ren, H., et al. (2013). Global variation in elevational diversity patterns. Sci. Rep. 3:3007. doi: 10.1038/srep03007
Hamrick, J. L., and Godt, M. W. (1990). “Allozyme diversity in plant species,” in Plant Population Genetics, Breeding, and Genetic Resources, eds A. H. D. Brown, M. T. Clegg, A. L. Kahler, and B. S. Weir (Sunderland, MA: Sinauer), 43–63.
Hardin, J. W. (1957). Studies in the Hippocastanaceae, IV. hybridization in aesculus. Rhodora 59, 185–203.
Harris, A. J., Xiang, Q.-Y., and Thomas, D. T. (2009). Phylogeny, origin, and biogeographic history of Aesculus L. (Sapindales) an update from combined analysis of DNA sequences, morphology, and fossils. Taxon 58, 108–126. doi: 10.1002/tax.581012
Harrison, R. G. (2012). The language of speciation. Evolution 66, 3643–3657. doi: 10.1111/j.1558-5646.2012.01785.x
Harrison, R. G., and Larson, E. L. (2014). Hybridization, introgression, and the nature of species boundaries. J. Heredity 105(Suppl. 1), 795–809. doi: 10.1093/jhered/esu033
Hartl, D. L., and Clark, A. G. (1997). Principles of Population Genetics. Sunderland, MA: Sinauer Associates.
Helbig, A. J., Knox, A. G., Parkin, D. T., Sangster, G., and Collinson, M. (2002). Guidelines for assigning species rank. IBIS 144, 518–525. doi: 10.1046/j.1474-919X.2002.00091.x
Herrera, C. M. (1984). Seed dispersal and fitness determinants in wild rose: combined effects of hawthorn, birds, mice, and browsing ungulates. Oecologia 63, 386–393. doi: 10.1007/BF00390670
Hewitt, G. M. (1996). Some genetic consequences of ice ages, and their role in divergence and speciation. Biol. J. Linnean Soc. 58, 247–276. doi: 10.1111/j.1095-8312.1996.tb01434.x
Hewitt, G. M. (1999). Post-glacial re-colonization of European Biota. Biol. J. Linnean Soc. 68, 87–112. doi: 10.1111/j.1095-8312.1999.tb01160.x
Hewitt, G. M. (2000). The genetic legacy of the Quaternary ice ages. Nature 405, 907–913. doi: 10.1038/35016000
Hey, J. (2006). On the failure of modern species concepts. Trends Ecol. Evol. 21, 447–450. doi: 10.1016/j.tree.2006.05.011
Hijmans, R., Cameron, S., Parra, J., Jones, P., and Jarvis, A. (2005). Very high resolution interpolated climate surfaces for global land areas. Int. J. Climatol. 25, 1965–1978. doi: 10.1038/sdata.2018.254
Huson, D. H., and Bryant, D. (2006). Application of phylogenetic networks in evolutionary studies. Mol. Biol. Evol. 23, 254–267. doi: 10.1093/molbev/msj030
Jacobs, J. H., Clark, S. J., Denholm, I., Goulson, D., Stoate, C., and Osborne, J. L. (2009). Pollination biology of fruit-bearing hedgerow plants and the role of flower-visiting insects in fruit-set. Ann. Bot. 104, 1397–1404. doi: 10.1093/aob/mcp236
Jaramillo-Correa, J. P., Aguirre-Planter, E., Khasa, D. P., Eguiarte, L. E., Pinero, D., Furnier, G. R., et al. (2008). Ancestry and divergence of subtropical montane forest isolates: molecular biogeography of the genus Abies (Pinaceae) in southern Mexico and Guatemala. Mol. Ecol. 17, 2476–2490. doi: 10.1111/j.1365-294X.2008.03762.x
Jaramillo-Correa, J. P., Beaulieu, J., Bedig, F. T., and Bousquet, J. (2006). Decoupled mitochondrial and chloroplast DNA population structure reveals holocene collapse and population isolation in a threatened Mexican-endemic conifer. Mol. Ecol. 15, 2787–2800. doi: 10.1111/j.1365-294X.2006.02974.x
Jordano, P. (2010). Pollen, seeds and genes: the movement ecology of plants. Heredity 105, 329–330. doi: 10.1038/hdy.2010.28
Ju, L., Wang, H., and Jiang, D. (2007). Simulation of the Last Glacial Maximum climate over East Asia with a regional climate model nested in a general circulation model. Palaeogeogr. Palaeoclimatol. Palaeoecol. 248, 376–390. doi: 10.1016/j.palaeo.2006.12.012
Kato, M., Kosaka, Y., Kawakita, A., Okuyama, Y., Kobayashi, C., Phimminith, T., et al. (2008). Plant–pollinator interactions in tropical monsoon forests in Southeast Asia. Am. J. Bot. 95, 1375–1394. doi: 10.3732/ajb.0800114
Knox, E. B., and Palmer, J. D. (1995). Chloroplast DNA variation and the recent radiation of the giant senecios (Asteraceae) on the tall mountains of eastern Africa. Proc. Natl. Acad. Sci. U.S.A. 92, 10349–10353. doi: 10.1073/pnas.92.22.10349
Krauss, S. L., He, T., Barrett, L. G., Lamont, B. B., Enright, N. J., Miller, B. P., et al. (2009). Contrasting impacts of pollen and seed dispersal on spatial genetic structure in the bird-pollinated Banksia hookeriana. Heredity 102, 274–285. doi: 10.1038/hdy.2008.118
Ku, T. C. (1985). “Rosa,” in Flora Reipublicae Popularis Sinicae, eds T. T. Yu and T. C. Ku (Beijing: Science Press), 37.
Ku, T. C., and Robertson, K. R. (2003). “Rosa (Rosaceae),” in Flora of China, eds Z. Y. Wu and P. H. Raven (St. Louis, MO: Missouri Botanical Garden Press), 339–381.
Kumar, S., Stecher, G., and Tamura, K. (2016). MEGA7: molecular evolutionary genetics analysis version 7.0 for bigger datasets. Mol. Biol. Evol. 33, 1870–1874. doi: 10.1093/molbev/msw054
Lanfear, R., Frandsen, P. B., Wright, A. M., Senfeld, T., and Calcott, B. (2017). PartitionFinder 2: new methods for selecting partitioned models of evolution for molecular and morphological phylogenetic analyses. Mol. Biol. Evol. 34, 772–773. doi: 10.1093/molbev/msw260
Librado, P., and Rozas, J. (2009). DnaSP v5: a software for comprehensive analysis of DNA polymorphism data. Bioinformatics 25, 1451–1452. doi: 10.1093/bioinformatics/btp187
Link-Pérez, M. A. (2010). Revision and Molecular Systmatics of the Neotrpical Fern Genus Adiantopsis (Pteridaceae). Doctoral Dissertation, Miami University, Miami.
Liu, J. Q. (2016). The integrative species concept and species on the speciation way. Biodivers. Sci. 24, 1004–1008. doi: 10.17520/biods.2016222
Liu, J.-Q., Wang, Y.-J., Wang, A.-L., Hideaki, O., and Abbott, R. J. (2006). Radiation and diversifcation within the Ligularia–Cremanthodium–Parasenecio complex (Asteraceae) triggered by uplift of the Qinghai-Tibetan Plateau. Mol. Phylogenet. Evol. 38, 31–49. doi: 10.1016/j.ympev.2005.09.010
Liu, Y. P., Ren, Z., Harris, A. J., Peterson, P. M., Wen, J., and Su, X. (2018). Phylogeography of Orinus (Poaceae), a dominant grass genus on the Qinghai-Tibet Plateau. Bot. J. Linnean Soc. 186, 202–223. doi: 10.1093/botlinnean/box091
Mannion, P. D., Upchurch, P., Benson, R. B., and Goswami, A. (2014). The latitudinal biodiversity gradient through deep time. Trends Ecol. Evol. 29, 42–50. doi: 10.1016/j.tree.2013.09.012
Marsico, T. D., Hellmann, J. J., and Romero-Severson, J. (2009). Patterns of seed dispersal and pollen flow in Quercus garryana (Fagaceae) following post-glacial climatic changes. J. Biogeogr. 36, 929–941. doi: 10.1111/j.1365-2699.2008.02049.x
Mayr, E. (1942). Systematics and the Origin of Species, From the Viewpoint of a Zoologist. New York, NY: Columbia University Press.
Miller, M. A., Pfeiffer, W., and Schwartz, T. (2010). “Creating the CIPRES science gateway for inference of large phylogenetic trees,” in Proceedings of the Gateway Computing Environments Workshop (GCE), (New Orleans), 1–8. doi: 10.1109/GCE.2010.5676129
Myers, N., Mittermeier, R. A., Mittermeier, C. G., Da Fonseca, G. A., and Kent, J. (2000). Biodiversity hotspots for conservation priorities. Nature 403, 853–858. doi: 10.1038/35002501
Nason, J. D., Herre, E. A., and Hamrick, J. L. (1996). Paternity analysis of the breeding structure of strangler fig populations: evidence for substantial long-distance wasp dispersal. J. Biogeogr. 23, 501–512. doi: 10.1111/j.1365-2699.1996.tb00012.x
Nosil, P. (2008). Speciation with gene flow could be common. Mol. Ecol. 17, 2103–2106. doi: 10.1111/j.1365-294X.2008.03715.x
Peakall, R., and Smouse, P. E. (2012). GenAlEx 6.5: genetic analysis in Excel. Population genetic software for teaching and research–an update. Bioinformatics 28, 2537–2539. doi: 10.1093/bioinformatics/bts460
Phillips, S. J., Anderson, R. P., and Schapire, R. E. (2006). Maximum entropy modelling of species’ geographic distributions. Ecol. Model. 190, 231–259. doi: 10.1371/journal.pone.0187602
Pons, O., and Petit, R. J. (1996). Measuring and testing genetic differentiation with ordered versus unordered alleles. Genetics 144, 1237–1245.
Pritcharda, J. K., Wena, X., and Falush, D. (2009). Documentation for Structure Software: Version 2.3. [Internet]. Available at: http://pritch.bsd.uchicago.edu/structure_software/release_versions/v2.3.2/structure_doc.pdf.2009
Provan, J., and Bennett, K. D. (2008). Phylogeographic insights into cryptic glacial refugia. Trends Ecol. Evol. 23, 564–571. doi: 10.1016/j.tree.2008.06.010
Qian, H., and Ricklefs, R. E. (2000). Large-scale processes and the Asian bias in species diversity of temperate plants. Nature 407, 180–182. doi: 10.1038/35025052
Qian, H., and Sandel, B. (2017). Phylogenetic structure of regional angiosperm assemblages across latitudinal and climatic gradients in North America. Glob. Ecol. Biogeogr. 26, 1258–1269. doi: 10.1111/geb.12634
Qiu, Y. X., Fu, C. X., and Comes, H. P. (2011). Plant molecular phylogeography in China and adjacent regions, tracing the genetic imprints of quaternary climate and environmental change in the world’s most diverse temperate flora. Mol. Phylogenet. Evol. 59, 225–244. doi: 10.1016/j.ympev.2011.01.012
Rainey, P. B., and Travisano, M. (1998). Adaptive radiation in a heterogeneous environment. Nature 394, 69–72. doi: 10.1038/27900
Raxworthy, C. J., Ingram, C. M., Rabibisoa, N., and Pearson, R. G. (2007). Applications of ecological niche modeling for species delimitation: a review and empirical evaluation using day geckos (Phelsuma) from Madagascar. Syst. Biol. 56, 907–923. doi: 10.1080/10635150701775111
Raxworthy, C. J., Martinez-Meyer, E., Horning, N., Nussbaum, R. A., Schneider, G. E., Ortega-Huerta, M. A., et al. (2003). Predicting distributions of known and unknown reptile species in Madagascar. Nature 426, 837–841. doi: 10.1038/nature02205
Raymond, M., and Rousset, F. (1995). Genepop (version-1.2) population-genetics software for exact tests and ecumenicism. J. Heredity 86, 248–249. doi: 10.1093/oxfordjournals.jhered.a111573
Ritz, C. M., Kohnen, I., Groth, M., Theissen, G., and Wissemann, V. (2011). To be or not to be the odd one out–allele-specific transcription in pentaploid dogroses (Rosa L. sect. Caninae (DC.) Ser). BMC Plant Biol. 11:37. doi: 10.1186/1471-2229-11-37
Sage, R. D., and Selander, R. K. (1975). Trophic radiation through polymorphism in cichlid fishes. Proc. Natl. Acad. Sci. U.S.A. 72, 4669–4673. doi: 10.1073/pnas.72.11.4669
Sanders, N. J., and Rahbek, C. (2012). The patterns and causes of elevational diversity gradients. Ecography 35, 1–3. doi: 10.1111/j.1600-0587.2011.07338.x
Schluter, D. (2001). Ecology and the origin of species. Trends Ecol. Evol. 16, 372–380. doi: 10.1016/S0169-5347(01)02198-X
Schoener, T. W. (1968). The anolis lizards of bimini: resource partitioning in a complex fauna. Ecology 49, 704–726. doi: 10.2307/1935534
Schulke, B., and Waser, N. M. (2001). Long-distance pollinator flights and pollen dispersal between populations of Delphinium nuttallianum. Oecologia 127, 239–245. doi: 10.1007/s004420000586
Stamatakis, A. (2014). RAxML version 8: a tool for phylogenetic analysis and post-analysis of large phylogenies. Bioinformatics 30, 1312–1313. doi: 10.1093/bioinformatics/btu033
Stephens, M., and Donnelly, P. (2003). A comparison of bayesian methods for haplotype reconstruction from population genotype data. Am. J. Hum. Genet. 73, 1162–1169. doi: 10.1086/379378
Stephens, M., Smith, N. J., and Donnelly, P. (2001). A new statistical method for haplotype reconstruction from population data. Am. J. Hum. Genet. 68, 978–989. doi: 10.1086/319501
Stibig, H.-J., Achard, F., and Fritz, S. (2004). A new forest cover map of continental southeast Asia derived from SPOT-VEGETATION satellite imagery. Appl. Veg. Sci. 7, 153–162. doi: 10.1111/j.1654-109X.2004.tb00606.x
Stuart, B. L., Inger, R. F., and Voris, H. K. (2006). High level of cryptic species diversity revealed by sympatric lineages of Southeast Asian forest frogs. Biol. Lett. 2, 470–474. doi: 10.1098/rsbl.2006.0505
Swofford, D. L. (2003). PAUP∗ Phylogenetic Analysis Using Parsimony (and Other Methods). Sunderland, MA: Sinauer Associates.
Tamura, K., Dudley, J., Nei, M., and Kumar, S. (2007). MEGA4, Molecular Evolutionary Genetics Analysis (MEGA) software version 4.0. Mol. Biol. Evol. 24, 1596–1599. doi: 10.1093/molbev/msm092
Thompson, J. D., Gibson, T. J., Plewniak, F., Jeanmougin, F., and Higgins, D. G. (1997). The CLUSTAL_X windows interface: flexible strategies for multiple sequence alignment aided by quality analysis tools. Nucleic Acids Res. 25, 4876–4882. doi: 10.1093/nar/25.24.4876
Thompson, J. D., Higgins, D. G., and Gibson, T. J. (1994). CLUSTAL W: improving the sensitivity of progressive multiple sequence alignment through sequence weighting, position-specific gap penalties and weight matrix choice. Nucleic Acids Res. 22, 4673–4680. doi: 10.1093/nar/22.22.4673
von Humboldt, A. (1807). Essai Sur Sur La Géographie Des Plantes. Chicago: University of Chicago Press.
Warren, D. L., Glor, R. E., and Turelli, M. (2008). Environmental niche equivalency versus conservatism: quantitative approaches to niche evolution. Evolution 62, 2868–2883. doi: 10.1111/j.1558-5646.2008.00482.x
Warren, D. L., Glor, R. E., and Turelli, M. (2010). ENMTools: a toolbox for comparative studies of environmental niche models. Ecography 33, 607–611. doi: 10.1111/j.1600-0587.2009.06142.x
Watson, H. C., and Spottiswoode, A. (1835). Remarks on the Geographical Distribution of British Plants: Chiefly in Connection with Latitude, Elevation, and Climate. London: Longman. doi: 10.5962/bhl.title.59223
Weir, B. S., and Cockerham, C. C. (1984). Estimating F-statistics for the analysis of population structure. Evolution 38, 1358–1370.
Wen, J. (1999). Evolution of the eastern Asian and eastern North American disjunct distributions in flowering plants. Annu. Rev. Ecol. Syst. 30, 421–455. doi: 10.1016/j.ympev.2012.05.003
Wen, J. (2001). Evolution of eastern Asian–eastern North American biogeographic disjunctions: a few additional issues. Int. J. Plant Sci. 162, S117–S122. doi: 10.1086/322940
Wharton, P., Hine, B., and Justice, D. (2005). The Jade Garden: New & Notable Plants from Asia. Portland: Timber Press.
Williams, D., Dunkerley, D., DeDeckker, P., Kershaw, P., and Chappell, M. (1998). Quaternary Environments. London: Arnold.
Willig, M. R., Kaufman, D. M., and Stevens, R. D. (2003). Latitudinal gradients of biodiversity: pattern, process, scale, and synthesis. Annu. Rev. Ecol. Evol. Syst. 34, 273–309. doi: 10.1146/annurev.ecolsys.34.012103.144032
Wilson, E. O. (1988). “The current state of biological diversity,” in Biodiversity, eds E. O. Wilson and F. M. Peter (Washington, DC: The National Academies Press), 521.
Xing, Y., and Ree, R. H. (2017). Uplift-driven diversification in the Hengduan Mountains, a temperate biodiversity hotspot. Proc. Natl. Acad. Sci. U.S.A. 114, E3444–E3451. doi: 10.1073/pnas.1616063114
Yuan, S. L., Lin, L. K., and Oshida, T. (2006). Phylogeography of the mole-shrew (Anourosorex yamashinai) in Taiwan, implications of interglacial refugia in a high elevation small mammal. Mol. Ecol. 15, 2119–2130. doi: 10.1111/j.1365-294X.2006.02875.x
Keywords: biodiversity, eastern Himalayas, ecological niche modeling, ecological speciation, population genetics, species concept
Citation: Gao Y-D, Gao X-F and Harris AJ (2019) Species Boundaries and Parapatric Speciation in the Complex of Alpine Shrubs, Rosa sericea (Rosaceae), Based on Population Genetics and Ecological Tolerances. Front. Plant Sci. 10:321. doi: 10.3389/fpls.2019.00321
Received: 19 August 2018; Accepted: 27 February 2019;
Published: 18 March 2019.
Edited by:
Naoki Osada, Hokkaido University, JapanReviewed by:
Nakatada Wachi, University of the Ryukyus, JapanPablo Vargas, Spanish National Research Council (CSIC), Spain
Copyright © 2019 Gao, Gao and Harris. This is an open-access article distributed under the terms of the Creative Commons Attribution License (CC BY). The use, distribution or reproduction in other forums is permitted, provided the original author(s) and the copyright owner(s) are credited and that the original publication in this journal is cited, in accordance with accepted academic practice. No use, distribution or reproduction is permitted which does not comply with these terms.
*Correspondence: Yun-Dong Gao, gaoyd@cib.ac.cn Xin-Fen Gao, xfgao@cib.ac.cn