 Kaiyang Qu
 Leyi Wei
 Jiantao Yu
 Chunyu Wang
- 1College of Intelligence and Computing, Tianjin University, Tianjin, China
- 2College of Information Engineering, North-West A&F University, Yangling, China
- 3School of Computer Science and Technology, Harbin Institute of Technology, Harbin, China
- 4Department of Electrical Engineering and Computer Science, University of Missouri, Columbia, MO, United States
Motivation: Pentatricopeptide repeat (PPR) is a triangular pentapeptide repeat domain that plays a vital role in plant growth. In this study, we seek to identify PPR coding genes and proteins using a mixture of feature extraction methods. We use four single feature extraction methods focusing on the sequence, physical, and chemical properties as well as the amino acid composition, and mix the features. The Max-Relevant-Max-Distance (MRMD) technique is applied to reduce the feature dimension. Classification uses the random forest, J48, and naïve Bayes with 10-fold cross-validation.
Results: Combining two of the feature extraction methods with the random forest classifier produces the highest area under the curve of 0.9848. Using MRMD to reduce the dimension improves this metric for J48 and naïve Bayes, but has little effect on the random forest results.
Availability and Implementation: The webserver is available at: http://server.malab.cn/MixedPPR/index.jsp.
Introduction
Pentatricopeptide repeat (PPR) proteins include tandem repeats of degenerate 35-amino-acid motifs (PPR motifs) (Chen et al., 2018; Rojas et al., 2018). They form a class of nuclear-encoded proteins arranged in series by multiple repeating units (Li and Jiang, 2018). PPR proteins play a vital role in plant growth and development, and are widely found in eukaryotes and terrestrial plants (Ruida et al., 2013; Wang et al., 2018a). The majority of PPR proteins have mitochondrial or chloroplast localization sequences at the N-terminus, making them an ideal model for studying plant cytoplasmic and nuclear interactions (Wang et al., 2008b). Because of the importance of PPR, this study uses machine learning methods to predict sequences in this class of protein.
As PPRs are proteins, protein prediction methods are applicable to PPR. To predict proteins, some algorithm must be employed to extract features from the sequences. With the development of bioinformatics, many feature extraction methods have been developed. The extraction methods are divided into two categories. Based on amino acid composition, only consider the sequence information and the properties of the amino acids. The second, based on protein structure, considers both sequence information and spatial structure information. The N-gram model is a probabilistic language model based on the Markov assumption (Zhu et al., 2015; Lai et al., 2017; Wei et al., 2017a). Chou et al. (Chou, 2010) proposed a method based on the pseudo amino acid composition (Pse-AAC) that has since been used to predict various protein attributes, such as structural class (Sahu and Panda, 2010; Zhu et al., 2018), subcellular location (Wang et al., 2008b; Yang et al., 2016), essential protein (Sarangi et al., 2013), protein secondary structural content (Chen et al., 2009), T-cell epitope (Zhang et al., 2015), and protein remote homology (Liu et al., 2013, 2015a, 2016a). Liu et al. (2014) enhanced this method by reducing the amino acid alphabet profile, and proposed the physicochemical distance transformation (PDT) (Liu et al., 2012), which is similar to PseAAC. The position-specific scoring matrix (PSSM) (Jones, 1999; Kong et al., 2017) contains abundant evolutionary information and is generated by the Position-Specific Iterated Basic Local Alignment Search Tool (PSI-BLAST) (Altschul and Koonin, 1998; Altschul et al., 1998). Kumar et al. (2007) were able to extract features according to amino acid or dipeptide composition, PSSM, and four-part amino acid compositions. Classifiers such as support vector machines, random forests, and artificial neural networks can be applied to the extracted features.
In this study, four feature extraction methods and three classifiers are used to predict PPR proteins. The four feature extraction methods not only consider sequence information, but also include the properties of amino acids. We combine these feature extraction methods, and then use the Max-Relevance-Max-Distance (MRMD) method to reduce the dimension. The overall process is shown in Figure 1.
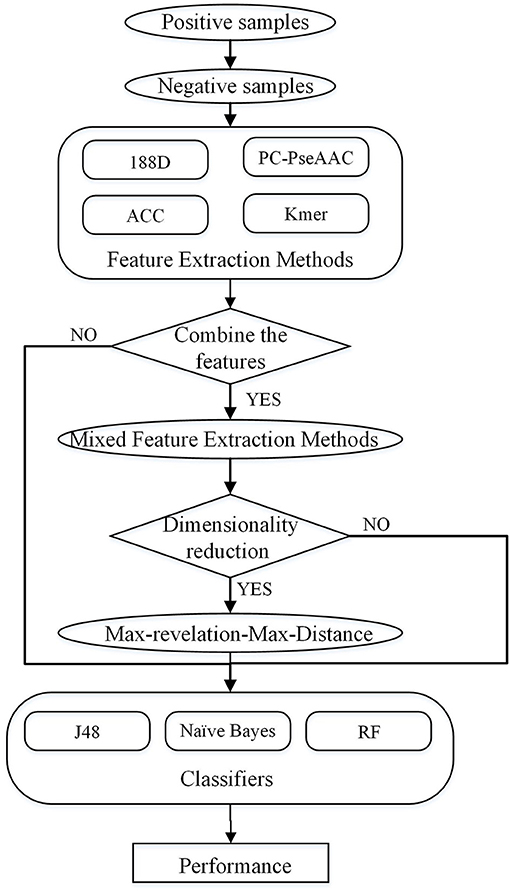
Figure 1. Overall process of the method described in this paper.
Methods
Dataset
For this study, a dataset was extracted from UniPort using the key word “pentatricopeptide repeat” to search the sequences. This search produced 534 reviewed samples, which we used as the positive set. Based on this positive set, we then constructed a negative set as follows. First, we found the Uniport ID of proteins, which have the following symbol: |. Second, we used the Uniport ID to query the proteins' PFAM family. Each sequence belongs to a PFAM family, and similar sequences belong to the same family. After finding all the PFAM families of the PPR positive samples, duplicate PFAM families were deleted to obtain a non-repeating positive family set. We then deleted the positive samples in all families, leaving a set of negative families. Finally, we used the longest protein sequence in each negative family as the negative samples. From the above steps, we obtained 21,960 negative sequences. As some sequences may be redundant, we used CD-HIT (Fu et al., 2012) to reduce the data with a threshold of 0.7 and deleted sequences that included illegal characters. The final dataset contained 487 positive samples and 9,590 negative samples.
To overcome this imbalance in the dataset, we randomly extracted 10 sets of negative samples, and averaged the results of 10 experiments using these 10 sets. Among the negative sequences, the longest had 35,214 amino acids and the shortest had 11 amino acids. The positive sequences ranged from 196 to 1,863 amino acids in length. Thus, we divided the negative samples into four parts according to their length, and extracted 487 sequences from these four parts in proportion.
Feature Extraction Methods
Based on Sequence, Physical, and Chemical Properties
This method can extract 188 features (hereinafter referred to as 188D) covering sequence information and amino acid properties (Zhang et al., 2012; Song et al., 2014; Xu et al., 2014). The first 20 features are the frequency of 20 amino acids in the protein sequence. Furthermore, the content, distribution, and dipeptide composition are essential in protein predictions (Song et al., 2014). We divided the 20 amino acids into three groups according to their properties which were shown in Figure 2.
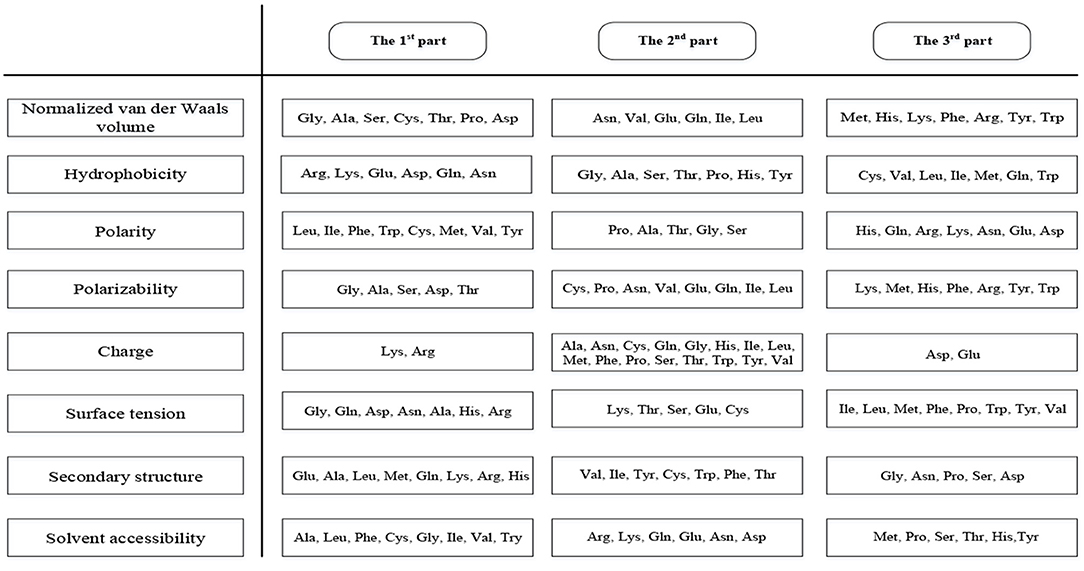
Figure 2. Three groups of amino acids divided according to properties.
The amino acids were divided into three groups according to their properties, and then we calculated the proportion of the three groups in the sequences for eight properties, giving 3 × 8 = 24 features to be extracted (Cai et al., 2003; Lin et al., 2013). Next, we identified the distribution of the three groups of amino acids at five positions (beginning, 25, 50, 75, and end), giving a further 3 × 5 × 8 = 120 features to be extracted (Cai et al., 2003). Finally, we calculated the number of the three types of dipeptides containing two amino acids from different groups, so another 3 × 8 = 24 features will be extracted. Therefore, the algorithm produces 20 + 24 + 120 + 24 = 188 features (Lin et al., 2013).
Pse-in-One
The other three methods are implemented by Pse-in-one, which was proposed by Liu (Liu et al., 2015b) and BioSeq-Analysis (Liu, 2018). We briefly introduce these methods in this section.
Kmer
Similar to the N-gram model, kmer extracts features using the amino acid spacer. This method uses the frequency of k adjacent amino acid fragments to reflect the sequence composition of the protein. Since there are 20 possibilities for each position, 20k features can be extracted. For example, when k = 2, the feature is the frequency of amino acid fragments that have two amino acids in the sequence. It can be expressed as follows (Liu et al., 2008):
Auto-cross covariance
The auto-cross covariance (ACC) transforms the protein sequence to a certain length by measuring the relationship between any two properties of the amino acids (Dong et al., 2009). ACC includes two parts: the auto covariance (AC) calculates the relevance of the same property between two residues along sequence intervals of length lg (Dong et al., 2009), and the cross-covariance (CC) measures the differences between two properties (Guo et al., 2008). For a protein sequence P, the transformation can be written as (Liu et al., 2016b):
where N represents the number of amino acid properties and φn is calculated as (Liu et al., 2016c):
CC transforms the sequence to the vector set:
and then calculates (Guo et al., 2008):
where i denotes the residues, L represents the length of the sequence, Si, j is the score of the j-th amino acid with respect to the i-th property, and is the average score for i along the sequence.
In this study, we selected three properties and set lg = 2.
Parallel correlation pseudo amino acid composition
Parallel correlation pseudo amino acid composition (PC-Pse-AAC) considers composition, properties, and sequence orders (Chou, 2010; Xiao and Chou, 2011).
We consider a protein sequence P containing L amino acids. The sequence can be represented by 20 + λ features as:
where λ is a distance parameter that reflects the effect of the amino acid sequence-order (Pan G. et al., 2018).
The first 20 features are the frequencies at which 20 amino acids appear in the sequence. The other features are given by (Mei and Zhao, 2018):
where Ai represents the i-th amino acid in the protein sequence, and k denotes the distance between two amino acids along the protein sequences. T is the number of physicochemical properties, and Ij(Ai) is the j-th property of indicates the original physicochemical property score of amino acid Ai with respect to property j, and Rm represents the 20 amino acids.
In this study, we selected three properties and set λ = 2.
Mixed Feature Extraction Methods
The Max-Relevance-Max-Distance (MRMD) (Zou et al., 2016; Qu et al., 2017; Wei et al., 2017b) technique was used to reduce the dimension. We used the Pearson correlation coefficient (PCC) to measure the relevance and the Euclidean distance function to identify instances of redundancy.
The PCC can calculate continuous variables and is easy to implement. Therefore, the PCC (Ahlgren et al., 2014) was used to measure the relationship between the features and the target class in the MRMD feature dimension reduction method. The formula for the PCC is (Zou et al., 2016):
where xk represents the kth element in , and , are vectors composed of each instance's features. Thus, the maximum relevance of the ith feature is:
The Euclidean distance is given by:
We selected features according to:
As the PCC increases, the relationship between the features and the target classes becomes stronger. The greater the distance between features, the less redundancy exists in the vectors. The final feature set created by this method has less redundancy and greater correlation with the target set (Xu et al., 2016, 2018; Jiang et al., 2017; Wei et al., 2017c).
Feature selection method
Classifiers
We used three classifiers in this study: random forest (RF), naïve Bayes (NB), and J48. The classifiers can be implemented in WEKA, which is based on the Java environment.
J48
The J48 method is a decision tree algorithm based on C4.5 (Mohasseb et al., 2018). Decision trees (Quinlan, 1986) are a graphical approach using probability analysis. J48 is a kind of supervised learning, whereby each sample has a set of attributes and a predetermined label. By learning about the samples, a classifier can be taught to generate classification results for new instances (Rondovic et al., 2019).
In each step, decision trees select an attribute to split. Ideally, the optimal attribute should be selected so that the samples included in the branch nodes of the decision tree belong to the same class (Kothandan and Biswas, 2016; Zhong et al., 2018). The selection of attributes is an important problem, and many methods have been derived for this purpose, such as information gain, and information gain ratio. The C4.5 method uses the information gain ratio to select which attributes to split.
Random Forest
Ensemble learning is an effective technique that has been applied to many fields of bioinformatics (Li et al., 2016; Liu et al., 2016d, 2018; Zhang et al., 2016a; Tang et al., 2017; Pan Y. et al., 2018; Wang H. et al., 2018; Wei et al., 2018a,b). The RF approach (Wang S. P. et al., 2018) is an ensemble learning method that employs many decision trees, with the output result dependent on “votes” cast by each tree. The construction process is as follows.
First, we determine the quantity of decision trees (m), the depth of each tree (d), and the number of features (f) used by each node. Then, n samples are selected at random from the samples set. In addition, f features are randomly selected, and the selected samples use these features to build decision trees. This step is repeated m times to give m decision trees, forming the random forest. Each decision tree classifies each sample, so each decision tree outputs a value. For classification problems, the final result is the class that has the most votes. For regression problems, the final result is the average of the output of all decision trees (Song et al., 2017).
Naïve Bayes
NB (Rajaraman and Chokkalingam, 2014; Deng and Chen, 2015) is a classical classifier based on conditional probability. The most important component of NB is the Bayesian rule, which is given by (Yu et al., 2015):
where p(Bi|A) represents the conditional probability of event Bi occurring under event A. p(Bi) is the marginal probability of independent event Bi.
The classification principle is that use the Bayesian rule to calculate the posterior probability of an object based on its prior probability, and then select the class with the largest posterior probability as the class to which the object belongs. In this method, all features are statistically independent. So according to the above formula, we can get the following formula:
Then, the above formula can be converted into:
Where, y represents class variables and xi represents features. ŷ represents the predicted class.
Measurement
As we have an imbalanced dataset, we use the area under the receiver operating characteristic (ROC) curve (AUC) and the F-Measure to evaluate the performance of the classifiers.
The abscissa of the ROC curve is the false positive rate (FPR), and the ordinate is the true positive rate (TPR). AUC is the area under the ROC curve, which always has a value of less than one (Lobo et al., 2010; Pan et al., 2017; Wei et al., 2018d). As the ROC curve is generally above the straight line y = x, the value of AUC tends to be greater than 0.5 (Fawcett, 2005). The larger the value of AUC, the better the classification performance.
The F-measure (Nan et al., 2012) is a weighted harmonic average of precision and recall. This metric, which is often used to evaluate the quality of classification models, is computed as follows:
Typically, α = 1, so that:
Results and Discussion
Experiments were conducted using 10-fold cross-validation (Wei et al., 2018c; Zhao et al., 2018), whereby the dataset is divided into 10 sections, with nine parts used to train the model and the remaining one used for testing. This process is repeated 10 times, and the average of all the tests gives the final result.
Results Using Individual Feature Extraction Methods
In this section, we discuss the performance of each individual feature extraction method. The four feature extraction methods focus on different aspects. 188D considers information about the sequence composition and amino acid properties, whereas kmer considers the frequency of amino acid fragments in the sequence. ACC considers three properties, hydrophobicity, hydrophilicity, and mass, and PC-PseAAC considers the amino acids' distance and properties. Table 1 presents the results using these methods with each classifier.
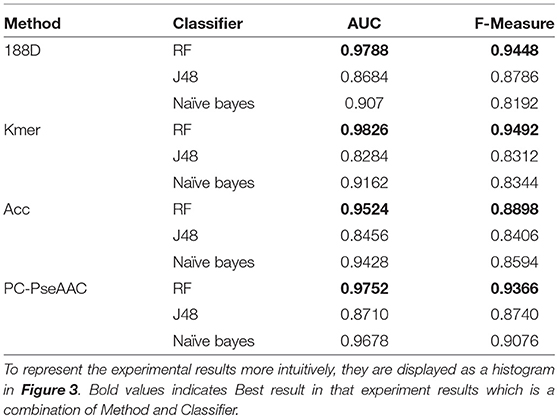
Table 1. PPR prediction results using a single feature extraction method.
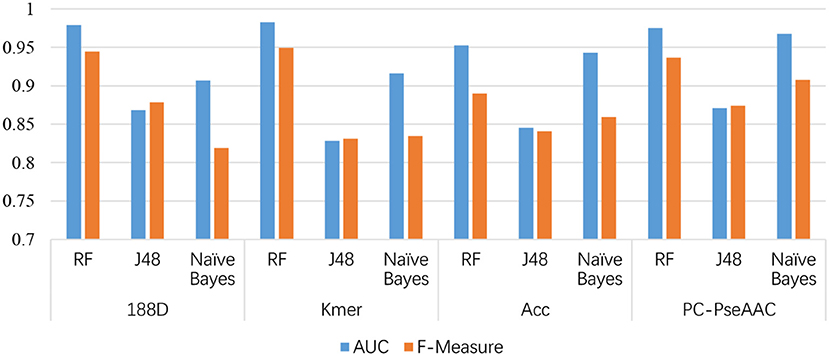
Figure 3. Comparison of AUCs among the four feature extraction methods and three classifiers.
From Table 1, it is clear that the performance is generally good. RF produced the best performance, especially with the kmer feature extraction method, achieving an AUC score of 0.9826. J48 has the worst performance, although this method attained an AUC score of 0.8710 when used with PC-PseAAC. NB performed best with the PC-PseAAC feature extraction method. Obviously, RF is better than J48. This may be because the random forest uses results from multiple decision trees, thus avoiding some exceptional cases.
Performance of Joint Feature Extraction Methods
Next, we connected the feature extraction methods to give six new feature sets: 188D + ACC (206D), 188D + kmer (588D), 188D + Pse-AAC (210D), ACC + kmer (418D), ACC + Pse-AAC (40D), Pse-AAC + kmer (422D).
Table 2 presents the results given by mixing the features. And we add the best performance of single into Table 2, which can make a more intuitive comparison. From the table, we can see that the performance using the RF classifier is slightly better than for the single 188D method. The highest AUC is 0.9820 and the lowest AUC is 0.8554.
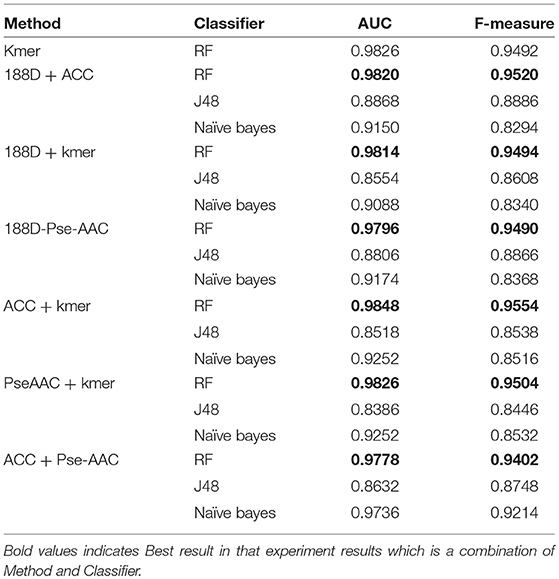
Table 2. Results from mixing the features.
Next, we combined kmer with another method. The results are presented in Table 2. In this case, the best AUC is 0.9848 and the lowest AUC is 0.8386, which are both higher than the scores achieved using the kmer method alone. RF gives the best performance, and J48 is again the worst classifier.
The results from combining Pse-AAC with another method are presented in Table 2. We can see that the overall performance is worse than in the above cases. With the exception of the RF results, the performance is worse than when using the Pse-AAC method on its own. In this case, the best AUC score is 0.9826 and the worst is 0.8386.
The results from combining ACC with another method are shown in Table 2. Compared with the results using ACC alone, the performance has improved, except when using the NB classifier. RF again gives the best results and J48 gives the worst. The highest AUC score is 0.9848 and the lowest is 0.8518.
From the above results, we can conclude that RF is the best classifier for this task, whereas J48 is unsuitable in this case. The best PPR prediction method is to combine ACC and kmer and use the RF classifier, which achieves the highest AUC of 0.9848.
Performance Using MRMD to Reduce the Dimension
Next, we used MRMD to reduce the dimension of the features considered in section Performance of Joint Feature Extraction Methods, resulting in six new feature sets. As the features were randomly extracted from the dataset 10 times, the number of features after dimension reduction was inconsistent. We conducted experiments using 10 separate sets of data. We then selected the feature set with the best AUC performance and applied this feature set to the remaining nine datasets. The final results are the average of 10 experiments.
The results are shown in Table 3, Figures 4, 5. The highest AUC value is 0.9840, and the lowest is 0.8400. Again, RF gives the best performance and J48 is the worst classifier. From the figures, although J48 has the worst performance, the AUCs have improved. In particular, using MRMD for dimension reduction results in better performance by the NB classifier.
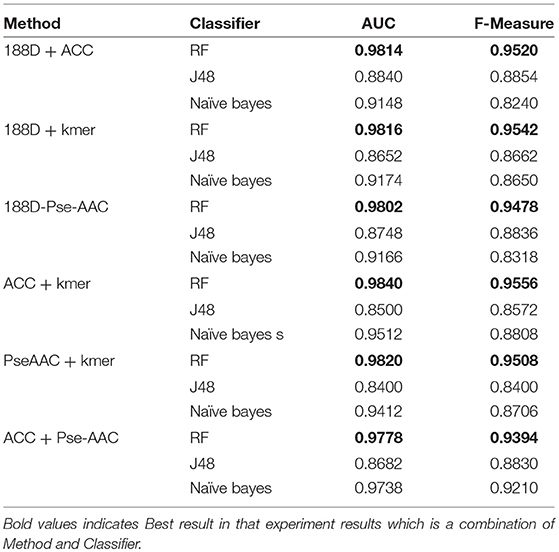
Table 3. Results from reduction the features.
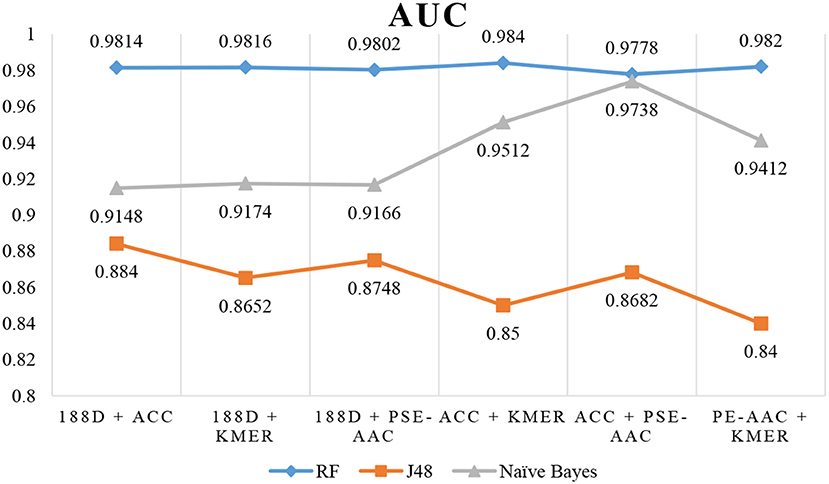
Figure 4. AUC when using MRMD to reduce the dimension.
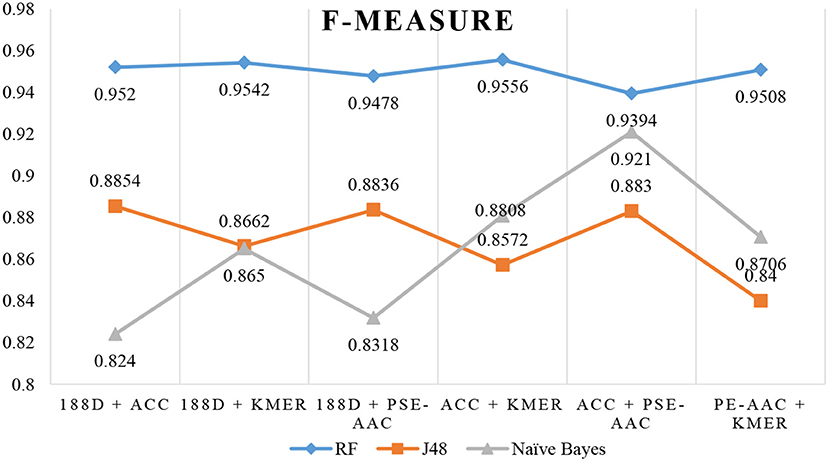
Figure 5. F-Measure when using MRMD to reduce the dimension.
Conclusion
PPR proteins play an important role in plants. In this study, we used machine-learning methods to predict this type of protein. To find the best performance, we used four feature extraction methods that consider sequence, physical, and chemical properties as well as the amino acid composition, and three classifiers. In terms of the individual feature extraction methods, using kmer with the RF classifier gave the highest AUC. Next, we combined the feature extraction methods, and found that RF still achieved the best performance while J48 gave the worst results. Finally, we used MRMD to reduce the feature dimension. This improved the AUCs for the J48 and NB classifiers, but had little effect on the RF results. The highest AUC score of 0.9848 was achieved by combining ACC and kmer and using RF as the classifier. The webserver is freely available at: http://server.malab.cn/MixedPPR/index.jsp. In future work, it can be expected to further improve the performance by integrating other informative features such as motif-based features (Li et al., 2010; Ma et al., 2013; Yang et al., 2017), and validate the reliability of our method using next-generation sequencing analysis (Zhang et al., 2016b; Liu et al., 2017).
Author Contributions
KQ implemented the experiments and drafted the manuscript. LW and CW initiated the idea, conceived the whole process, and finalized the paper. KQ and JY helped with data analysis and revised the manuscript. All authors have read and approved the final manuscript.
Conflict of Interest Statement
The authors declare that the research was conducted in the absence of any commercial or financial relationships that could be construed as a potential conflict of interest.
Acknowledgments
The work was supported by the National Key R&D Program of China (SQ2018YFC090002), the Natural Science Foundation of China (No.61872114, 91735306, 61701340), the Natural Science Fundamental Research Plan of Shaanxi Province (2016JM6038), and the Fundamental Research Funds for the Central Universities, NWSUAF, China (2452015060). The funders had no role in study design, data collection and analysis, decision to publish, or preparation of the manuscript. We thank Stuart Jenkinson, Ph.D., from Liwen Bianji, Edanz Group China (www.liwenbianji.cn/ac), for editing the English text of a draft of this manuscript.
References
Ahlgren, P., Jarneving, B., and Rousseau, R. (2014). Requirements for a cocitation similarity measure, with special reference to Pearson's correlation coefficient. J. Am. Soc. Inform. Sci. Technol. 54, 550–560. doi: 10.1002/asi.10242
Altschul, S. F., and Koonin, E. V. (1998). Iterated profile searches with PSI-BLAST - a tool for discovery in protein databases. Trends Biochem. Sci. 23, 444–447. doi: 10.1016/S0968-0004(98)01298-5
Altschul, S. F., Madden, T. L., Schäffer, A. A., Zhang, J., Zhang, Z., Miller, W., et al. (1998). Gapped BLAST and PSI-BLAST: a new generation of protein database search programs. FASEB J. 12, A1326–A1326.
Cai, C. Z., Han, L. Y., Ji, Z. L., Chen, X., and Chen, Y. Z. (2003). SVM-Prot: web-based support vector machine software for functional classification of a protein from its primary sequence. Nucleic Acids Res. 31, 3692–3697. doi: 10.1093/nar/gkg600
Chen, C., Chen, L., Zou, X., and Cai, P. (2009). Prediction of protein secondary structure content by using the concept of Chou's pseudo amino acid composition and support vector machine. Protein Pept. Lett. 16, 27–31. doi: 10.2174/092986609787049420
Chen, G., Zou, Y., Hu, J., and Ding, Y. (2018). Genome-wide analysis of the rice PPR gene family and their expression profiles under different stress treatments. BMC Genomics 19:720. doi: 10.1186/s12864-018-5088-9
Chou, K. C. (2010). Prediction of protein cellular attributes using pseudo-amino acid composition. Proteins Struct. Funct. Bioinform. 43, 246–255. doi: 10.1002/prot.1035
Deng, L., and Chen, Z. (2015). An integrated framework for functional annotation of protein structural domains. IEEE/ACM Trans. Comput. Biol. Bioinform. 12, 902–913. doi: 10.1109/TCBB.2015.2389213
Dong, Q. W., Zhou, S. G., and Guan, J. H. (2009). A new taxonomy-based protein fold recognition approach based on autocross-covariance transformation. Bioinformatics 25, 2655–2662. doi: 10.1093/bioinformatics/btp500
Fawcett, T. (2005). An introduction to ROC analysis. Pattern Recognit. Lett. 27, 861–874. doi: 10.1016/j.patrec.2005.10.010
Fu, L., Niu, B., Zhu, Z., Wu, S., and Li, W. (2012). CD-HIT: accelerated for clustering the next-generation sequencing data. Bioinformatics 28, 3150–3152. doi: 10.1093/bioinformatics/bts565
Guo, Y., Yu, L., Wen, Z., and Li, M. (2008). Using support vector machine combined with auto covariance to predict proteinprotein interactions from protein sequences. Nucleic Acids Res. 36, 3025–3030. doi: 10.1093/nar/gkn159
Jiang, L., Liao, Z., Su, R., and Wei, L. (2017). Improved identification of cytokines using feature selection techniques. Lett. Org. Chem. 14, 632–641. doi: 10.2174/1570178614666170227143434
Jones, D. T. (1999). Protein secondary structure prediction based on position-specific scoring matrices. J. Mol. Biol. 292, 195–202. doi: 10.1006/jmbi.1999.3091
Kong, L., Kong, L., Wang, C., Jing, R., and Zhang, L. (2017). Predicting protein structural class for low-similarity sequences via novel evolutionary modes of PseAAC and recursive feature elimination. Lett. Org. Chem. 14, 673–683. doi: 10.2174/1570178614666170511165837
Kothandan, R., and Biswas, S. (2016). Comparison of Kernel and decision tree-based algorithms for prediction of MicroRNAs associated with cancer. Curr. Bioinform. 11, 143–151. doi: 10.2174/1574893611666151120102307
Kumar, M., Gromiha, M. M., and Raghava, G. P. (2007). Identification of DNA-binding proteins using support vector machines and evolutionary profiles. BMC Bioinform. 8:463. doi: 10.1186/1471-2105-8-463
Lai, H. Y., Chen, X. X., Chen, W., Tang, H., and Lin, H. (2017). Sequence-based predictive modeling to identify cancerlectins. Oncotarget 8, 28169–28175. doi: 10.18632/oncotarget.15963
Li, D., Luo, L., Zhang, W., Liu, F., and Luo, F. (2016). A genetic algorithm-based weighted ensemble method for predicting transposon-derived piRNAs. BMC Bioinform. 17:329. doi: 10.1186/s12859-016-1206-3
Li, G., Liu, B., Ma, Q., and Xu, Y. (2010). A new framework for identifying cis-regulatory motifs in prokaryotes. Nucleic Acids Res. 39, e42–e42. doi: 10.1093/nar/gkq948
Li, X., and Jiang, Y. (2018). The roles of PPR proteins on plant organelle RNA processing. Chin. J. Biochem. Mol. Biol. 34, 713–718. doi: 10.13865/j.cnki.cjbmb.2018.07.04
Lin, C., Zou, Y., Qin, J., Liu, X., Jiang, Y., Ke, C., et al. (2013). Hierarchical classification of protein folds using a novel ensemble classifier. PLoS ONE 8:e56499. doi: 10.1371/journal.pone.0056499
Liu, B. (2018). BioSeq-analysis: a platform for DNA, RNA, and protein sequence analysis based on machine learning approaches. Briefings Bioinform. doi: 10.1093/bib/bbx165
Liu, B., Chen, J. J., and Wang, S. Y. (2016a). Protein remote homology detection by combining pseudo dimer composition with an ensemble learning method. Curr. Proteomics 13, 86–91. doi: 10.2174/157016461302160514002939
Liu, B., Chen, J. J., and Wang, X. L. (2015a). Protein remote homology detection by combining Chou's distance-pair pseudo amino acid composition and principal component analysis. Mol. Genet. Genomics 290, 1919–1931. doi: 10.1007/s00438-015-1044-4
Liu, B., Liu, F., Wang, X., Chen, J., Fang, L., and Chou, K. C. (2015b). Pse-in-One: a web server for generating various modes of pseudo components of DNA, RNA, and protein sequences. Nucleic Acids Res. 43, W65–W71. doi: 10.1093/nar/gkv458
Liu, B., Liu, Y., Jin, X., Wang, X., and Liu, B. (2016b). iRSpot-DACC: a computational predictor for recombination hot/cold spots identification based on dinucleotide-based auto-cross covariance. Sci. Rep. 6:3348. doi: 10.1038/srep33483
Liu, B., Long, R., and Chou, K. -C. (2016d). iDHS-EL: identifying DNase I hypersensitive sites by fusing three different modes of pseudo nucleotide composition into an ensemble learning framework. Bioinformatics 32, 2411–2418. doi: 10.1093/bioinformatics/btw186
Liu, B., Wang, S., Dong, Q., Li, S., and Liu, X. (2016c). Identification of DNA-binding proteins by combining auto-cross covariance transformation and ensemble learning. IEEE Trans. Nanobiosci. 15, 328–334. doi: 10.1109/TNB.2016.2555951
Liu, B., Wang, X., Chen, Q., Dong, Q., and Lan, X. (2012). Using amino acid physicochemical distance transformation for fast protein remote homology detection. PLoS ONE 7:10. doi: 10.1371/journal.pone.0046633
Liu, B., Wang, X., Lin, L., Dong, Q., and Wang, X. (2008). A discriminative method for protein remote homology detection and fold recognition combining Top-n-grams and latent semantic analysis. BMC Bioinform. 9:510. doi: 10.1186/1471-2105-9-510
Liu, B., Wang, X., Zou, Q., Dong, Q., and Chen, Q. (2013). Protein remote homology detection by combining Chou's pseudo amino acid composition and profile-based protein representation. Mol. Inform. 32, 775–782. doi: 10.1002/minf.201300084
Liu, B., Xu, J., Lan, X., Xu, R., Zhou, J., Wang, X., et al. (2014). iDNA-Prot vertical bar dis: identifying DNA-binding proteins by incorporating amino acid distance-pairs and reduced alphabet profile into the general pseudo amino acid composition. PLoS ONE 9:12. doi: 10.1371/journal.pone.0106691
Liu, B., Yang, F., Huang, D. S., and Chou, K. C. (2018). iPromoter-2L: a two-layer predictor for identifying promoters and their types by multi-window-based PseKNC. Bioinformaitcs 34, 33–40. doi: 10.1093/bioinformatics/btx579
Liu, B., Yang, J., Li, Y., McDermaid, A., and Ma, Q. (2017). An algorithmic perspective of de novo cis-regulatory motif finding based on ChIP-seq data. Briefings Bioinform. 19, 1069–1081. doi: 10.1093/bib/bbx026
Lobo, J. M., Jiménez-Valverde, A., and Real, R. (2010). AUC: a misleading measure of the performance of predictive distribution models. Glob. Ecol. Biogeogr. 17, 145–151. doi: 10.1111/j.1466-8238.2007.00358.x
Ma, Q., Liu, B., Zhou, C., Yin, Y., Li, G., and Xu, Y. (2013). An integrated toolkit for accurate prediction and analysis of cis-regulatory motifs at a genome scale. Bioinformatics 29, 2261–2268. doi: 10.1093/bioinformatics/btt397
Mei, J., and Zhao, J. (2018). Analysis and prediction of presynaptic and postsynaptic neurotoxins by Chou's general pseudo amino acid composition and motif features. J. Theor. Biol. 447, 147–153. doi: 10.1016/j.jtbi.2018.03.034
Mohasseb, A., Bader-El-Den, M., and Cocea, M. (2018). Question categorization and classification using grammar based approach. Inform. Process. Manag. 54, 1228–1243. doi: 10.1016/j.ipm.2018.05.001
Nan, Y., Chai, K. M., Lee, W. S., and Chieu, H. L. (2012). “Optimizing F-measure: a tale of two approaches,” in Proceedings of the 29th International Conference on Machine Learning (ICML2012) (Edinburgh), 289–296.
Pan, G., Jiang, L., Tang, J., and Guo, F. (2018). A novel computational method for detecting DNA methylation sites with DNA sequence information and physicochemical properties. Int. J. Mol. Sci. 19:E511. doi: 10.3390/ijms19020511
Pan, G. F., Tang, J. J., and Guo, F. (2017). Analysis of co-associated transcription factors via ordered adjacency differences on Motif distribution. Sci. Rep. 7:43597. doi: 10.1038/srep43597
Pan, Y., Wang, Z., Zhan, W., and Deng, L. (2018). Computational identification of binding energy hot spots in protein-RNA complexes using an ensemble approach. Bioinformatics 34, 1473–1480. doi: 10.1093/bioinformatics/btx822
Qu, K., Han, K., Wu, S., Wang, G., and Wei, L. (2017). Identification of DNA-binding proteins using mixed feature representation methods. Molecules 22:E1602. doi: 10.3390/molecules22101602
Rajaraman, S., and Chokkalingam, A. (2014). Classification of denver system of chromosomes using similarity classifier guided by OWA operators. Curr. Bioinform. 9, 499–508. doi: 10.2174/1574893608666131231231238
Rojas, M., Ruwe, H., Miranda, R. G., Zoschke, R., Hase, N., Schmitz-Linneweber, C., et al. (2018). Unexpected functional versatility of the pentatricopeptide repeat proteins PGR3, PPR5 and PPR10. Nucleic Acids Res. 46, 10448–10459. doi: 10.1093/nar/gky737
Rondovic, B., Djurickovic, T., and Kascelan, L. (2019). Drivers of E-business diffusion in tourism: a decision tree approach. J. Theor. Applied Electron. Commer. Res. 14, 30–50. doi: 10.4067/S0718-18762019000100104
Ruida, G., Fangsuo, Z., Yaguang, Z., Shujuan, L., Huijie, G., Guiqin, Z., et al. (2013). Variation analysis of traits of seeds on interspecific hybrid F1 of fraxinus. Forest Eng. 29, 39–43. doi: 10.16270/j.cnki.slgc.2013.05.040
Sahu, S. S., and Panda, G. (2010). A novel feature representation method based on Chou's pseudo amino acid composition for protein structural class prediction. Comput. Biol. Chem. 34, 320–327. doi: 10.1016/j.compbiolchem.2010.09.002
Sarangi, A. N., Lohani, M., and Aggarwal, R. (2013). Prediction of essential proteins in prokaryotes by incorporating various physico-chemical features into the general form of Chou's pseudo amino acid composition. Protein Pept. Lett. 20, 781–795. doi: 10.2174/0929866511320070008
Song, J. N., Li, C., Zheng, C., Revote, J., Zhang, Z., and Webb, G. I. (2017). MetalExplorer, a bioinformatics tool for the improved prediction of eight types of metal-binding sites using a random forest algorithm with two-step feature selection. Curr. Bioinform. 12, 480–489. doi: 10.2174/2468422806666160618091522
Song, L., Li, D., Zeng, X., Wu, Y., Guo, L., and Zou, Q. (2014). nDNA-prot: identification of DNA-binding proteins based on unbalanced classification. BMC Bioinform. 15:298. doi: 10.1186/1471-2105-15-298
Tang, Y., Liu, D., Wang, Z., Wen, T., and Deng, L. (2017). A boosting approach for prediction of protein-RNA binding residues. BMC Bioinform. 18(Suppl. 13):465. doi: 10.1186/s12859-017-1879-2
Wang, H., Liu, C., and Deng, L. (2018). Enhanced prediction of hot spots at protein-protein interfaces using extreme gradient boosting. Sci. Rep. 8:14285. doi: 10.1038/s41598-018-32511-1
Wang, S. P., Zhang, Q., Lu, J., and Cai, Y.-D. (2018). Analysis and prediction of nitrated tyrosine sites with the mrmr method and support vector machine algorithm. Curr. Bioinform. 13, 3–13. doi: 10.2174/1574893611666160608075753
Wang, W., Fang, H., Groom, L., Cheng, A., Zhang, W., Liu, J., et al. (2008b). Superoxide flashes in single mitochondria. Cell 134, 279–290. doi: 10.1016/j.cell.2008.06.017
Wang, W., Tian, F., Ren, Y., Miao, Y., et al. (2018a). Research progress on functions of PPR proteins in plant mitochondria and chloroplasts. J. Fujian Agric. Forest. Univ. 47, 257–266. doi: 10.13323/j.cnki.j.fafu(nat.sci.).2018.03.001
Wei, L., Chen, H., and Su, R. (2018a). M6APred-EL: a sequence-based predictor for identifying n6-methyladenosine sites using ensemble learning. Mol. Ther. Nucleic Acids 12, 635–644. doi: 10.1016/j.omtn.2018.07.004
Wei, L., Hu, J., Li, F., Song, J., Su, R., and Zou, Q. (2018b). Comparative analysis and prediction of quorum-sensing peptides using feature representation learning and machine learning algorithms. Briefings Bioinform. doi: 10.1093/bib/bby107. [Epub ahead of print].
Wei, L., Su, R., Wang, B., Li, X., Zou, Q., Xing, G., et al. (2018c). Integration of deep feature representations and handcrafted features to improve the prediction of N 6-methyladenosine sites. Neurocomputing 324, 3–9. doi: 10.1016/j.neucom.2018.04.082
Wei, L., Tang, J., and Zou, Q. (2017a). SkipCPP-Pred: an improved and promising sequence-based predictor for predicting cell-penetrating peptides. BMC Genomics 18(Suppl. 7), 1–11. doi: 10.1186/s12864-017-4128-1
Wei, L., Xing, P., Shi, G., Ji, Z. L., and Zou, Q. (2017b). Fast prediction of methylation sites using sequence-based feature selection technique. IEEE/ACM Trans. Comput. Biol. Bioinform. 1. doi: 10.1109/TCBB.2017.2670558
Wei, L., Xing, P., Tang, J., and Zou, Q. (2017c). PhosPred-RF: a novel sequence-based predictor for phosphorylation sites using sequential information only. IEEE Trans. Nanobiosci. 16, 240–247. doi: 10.1109/TNB.2017.2661756
Wei, L., Zhou, C., Chen, H., Song, J., and Su, R. (2018d). ACPred-FL: a sequence-based predictor based on effective feature representation to improve the prediction of anti-cancer peptides. Bioinformatics 34, 4007–4016. doi: 10.1093/bioinformatics/bty451
Xiao, X., and Chou, K. C. (2011). Using pseudo amino acid composition to predict protein attributes via cellular automata and other approaches. Curr. Bioinform. 6, 251–260. doi: 10.2174/1574893611106020251
Xu, L., Liang, G., Shi, S., and Liao, C. (2018). SeqSVM: a sequence-based support vector machine method for identifying antioxidant proteins. Int. J. Mol. Sci. 19:E1773. doi: 10.3390/ijms19061773
Xu, R., Zhou, J., Liu, B., Yao, L., He, Y., Zou, Q., et al. (2014). enDNA-Prot: identification of DNA-binding proteins by applying ensemble learning. Biomed. Res. Int. 294279:10. doi: 10.1155/2014/294279
Xu, Y., Guo, M., Liu, X., Wang, C., Liu, Y., and Liu, G. (2016). Identify bilayer modules via pseudo-3D clustering: applications to miRNA-gene bilayer networks. Nucleic Acids Res. 44, e152–e152. doi: 10.1093/nar/gkw679
Yang, H., Tang, H., Chen, X. X., Zhang, C. J., Zhu, P. P., Ding, H., et al. (2016). Identification of secretory proteins in Mycobacterium tuberculosis using pseudo amino acid composition. Biomed. Res. Int. 2016:5413903. doi: 10.1155/2016/5413903
Yang, J., Chen, X., McDermaid, A., and Ma, Q. (2017). DMINDA 2.0: integrated and systematic views of regulatory DNA motif identification and analyses. Bioinformatics 33, 2586–2588. doi: 10.1093/bioinformatics/btx223
Yu, H. L., Sun, C., Yang, W., Xu, S., and Dan, Y. (2015). A review of class imbalance learning methods in bioinformatics. Curr. Bioinforma. 10, 360–369. doi: 10.2174/1574893609666140829204535
Zhang, W., Chen, Y., Liu, F., Luo, F., Tian, G., and Li, X. (2016a). Predicting potential side effects of drugs by recommender methods and ensemble learning. Neurocomputing 173, 979–987. doi: 10.1016/j.neucom.2015.08.054
Zhang, W., Liu, J., Zhao, M., and Li, Q. (2012). Predicting linear B-cell epitopes by using sequence-derived structural and physicochemical features. Int. J. Data Mining Bioinform. 6, 557–569. doi: 10.1504/IJDMB.2012.049298
Zhang, W., Niu, Y., Zou, H., Luo, L., Liu, Q., and Wu, W. (2015). Accurate prediction of immunogenic T-cell epitopes from epitope sequences using the genetic algorithm-based ensemble learning. PLoS ONE 10:e0128194. doi: 10.1371/journal.pone.0128194
Zhang, Y., Xie, J., Yang, J., Fennell, A., Zhang, C., and Ma, Q. (2016b). QUBIC: a bioconductor package for qualitative biclustering analysis of gene co-expression data. Bioinformatics 33, 450–452. doi: 10.1093/bioinformatics/btw635
Zhao, L., Wang, J., Nabil, M. M., and Zhang, J. (2018). Prediction of human protein subcellular localization using deep learning. J. Parallel Distribut. Comput. 117, 212–217. doi: 10.1016/j.jpdc.2017.08.009
Zhong, T., Zhang, S., Cai, G., and Huang, N. (2018). Power-quality disturbance recognition based on time-frequency analysis and decision tree. Iet Generat. Transm. Distrib. 12, 4153–4162. doi: 10.1049/iet-gtd.2018.5780
Zhu, P. P., Li, W. C., Zhong, Z. J., Deng, E. Z., Ding, H., Chen, W., et al. (2015). Predicting the subcellular localization of mycobacterial proteins by incorporating the optimal tripeptides into the general form of pseudo amino acid composition. Mol. Biosyst. 11, 558–563. doi: 10.1039/C4MB00645C
Zhu, X.-J., Feng, C.-Q., Lai, H.-Y., Chen, W., and Hao, L. (2018). Predicting protein structural classes for low-similarity sequences by evaluating different features. Knowl. Based Syst. 163, 787–793. doi: 10.1016/j.knosys.2018.10.007
Keywords: pentatricopeptide repeat, mixed feature extraction methods, maximum relevant maximum distance, random forest, J48, naïve bayes
Citation: Qu K, Wei L, Yu J and Wang C (2019) Identifying Plant Pentatricopeptide Repeat Coding Gene/Protein Using Mixed Feature Extraction Methods. Front. Plant Sci. 9:1961. doi: 10.3389/fpls.2018.01961
Received: 20 November 2018; Accepted: 17 December 2018;
Published: 10 January 2019.
Edited by:
Arun Kumar Sangaiah, VIT University, IndiaReviewed by:
Qin Ma, South Dakota State University, United StatesShijia Zhu, University of Texas Southwestern Medical Center, United States
Copyright © 2019 Qu, Wei, Yu and Wang. This is an open-access article distributed under the terms of the Creative Commons Attribution License (CC BY). The use, distribution or reproduction in other forums is permitted, provided the original author(s) and the copyright owner(s) are credited and that the original publication in this journal is cited, in accordance with accepted academic practice. No use, distribution or reproduction is permitted which does not comply with these terms.
*Correspondence: Chunyu Wang, chunyu@hit.edu.cn