 Yating Dong
 Cong Li
 Yi Zhang
 Qiuling He1
 Muhammad K. Daud
 Jinhong Chen
 Shuijin Zhu
- 1Department of Agronomy, Zhejiang University, Hangzhou, China
- 2Department of Biotechnology and Genetic Engineering, Kohat University of Science and Technology, Kohat, Pakistan
Glutathione S-transferases (GSTs) play versatile functions in multiple aspects of plant growth and development. A comprehensive genome-wide survey of this gene family in the genomes of G. raimondii and G. arboreum was carried out in this study. Based on phylogenetic analyses, the GST gene family of both two diploid cotton species could be divided into eight classes, and approximately all the GST genes within the same subfamily shared similar gene structure. Additionally, the gene structures between the orthologs were highly conserved. The chromosomal localization analyses revealed that GST genes were unevenly distributed across the genome in both G. raimondii and G. arboreum. Tandem duplication could be the major driver for the expansion of GST gene families. Meanwhile, the expression analysis for the selected 40 GST genes showed that they exhibited tissue-specific expression patterns and their expression were induced or repressed by salt stress. Those findings shed lights on the function and evolution of the GST gene family in Gossypium species.
Introduction
Glutathione S-transferases (GSTs; EC 2.5.1.18) are ancient and ubiquitous proteins encoded by a large gene family that function versatilely in organism. As a kind of detoxification enzymes, GSTs catalyze the conjugation of the tripeptide glutathione (GSH) to a variety of hydrophobic, electrophilic, and usually cytotoxic exogenous compounds (Marrs, 1996). There are cytosolic, mitochondrial and microsomal GSTs derived from a gene superfamily that are involved in the metabolism of xenobiotics (Armstrong, 1997). In general, microsomal and mitochondrial GSTs show great differences in biosynthesis and sequence identity with cytosolic GSTs (Mohsenzadeh et al., 2011). In plants, most cytosolic GSTs typically function as either heterodimer or homodimer of subunits ranging from 23 to 29 kDa in molecular weight (Frova, 2006). Each subunit contains a conserved GSH-binding site (G-site) in the N-terminal domain and an electrophilic substrate binding site (H-site) located in the C-terminal domain (Edwards et al., 2000). GSTs can also be monomeric, like DHAR and Lambda GST in Arabidopsis (Dixon et al., 2002). GSTs comprise ~2% of soluble proteins in plants (Rezaei et al., 2013). Based on gene organization and amino acid sequence similarity, the soluble GSTs can be divided into eight classes, including Phi (F), Tau (U), Lambda (L), dehydroascorbate reductase (DHAR), Theta (T), Zeta (Z), γ-subunit of translation elongation factor 1B (EF1Bγ), and tetrachlorohydroquinone dehalogenase (TCHQD; Sheehan et al., 2001; Dixon et al., 2002; Liu et al., 2013). Among these, the first four classes are specific to plant. Genome-wide analyses have indicated that there were 55 GST genes in Arabidopsis (Sappl et al., 2009), 79 in rice (Soranzo et al., 2004; Jain et al., 2010), 84 in barley (Rezaei et al., 2013), 23 in sweet orange (Licciardello et al., 2014), and 27 in Japanese larch (Yang et al., 2014).
Since the function for plant GSTs in herbicides detoxification was firstly detected, many researches have focused on their functions under various stimulations. It has been confirmed that GSTs can be induced by plant hormones such as auxins, ABA, and ethylene, as well as biotic and abiotic stresses (Dixon et al., 1998). To date, abundant GST genes have been characterized from numerous plant species. Among these GST genes, Tau and Phi classes are most investigated probably because of their abundant presence in plant kingdom. AtGSTU26 in Arabidopsis was induced by the chloroacetanilide herbicides, alachlor and metolachlor, the safener benoxacor, and low temperatures (Nutricati et al., 2006). The OsGSTU5 in rice shown high activity toward chloro-s-triazine and acetanilide herbicides (Cho et al., 2006), and overexpression of OsGSTU4 in Arabidopsis improved the tolerance to salinity and oxidative stresses (Sharma et al., 2014). The expression levels of TaGSTU1B and TaGSTF6 were increased under drought stress in wheat (Galle et al., 2009). Meanwhile, 35 of 56 SbGSTUs in Sorghum shown significant response to abiotic stresses including cold, PEG and high salinity (Chi et al., 2011). The expression of GmGSTL1 from soybean in transgenic Arabidopsis could also alleviate the symptoms under salt stress (Chan and Lam, 2014). Many other similar researches on GST family and their functions were reported recently (Urano et al., 2000; Thom et al., 2001; Ma et al., 2009; Ji et al., 2010). However, little is known about this gene family in cotton, especially their function under salt stress.
Cotton, which belongs to the genus of Gossypium, is considered the main source of natural fiber and cultivated worldwide. There are ~45 diploid (2n = 2x = 26) and 5 tetraploid (2n = 4x = 52) species. Cotton is an ideal model system for plant polyploid research (Kadir, 1976; Grover et al., 2007). With completion of the genome sequencing of the two diploid cotton species, G. raimondii (Paterson et al., 2012; Wang et al., 2012) and G. arboreum (Li et al., 2014), genome-wide analyses of all related genes have been realized. G. raimondii and G. arboreum were the putative donor species for the D and A chromosome groups of tetraploid cotton species, respectively (Kadir, 1976; Grover et al., 2007). Here, we conducted a systematic study of GST gene family in G. raimondii and G. arboreum to identify the characterization and phylogenetic relationships between the two species. Functional diversification and expression profiles of GST genes in response to salt stress were also investigated. It may elucidate the evolution mechanism of GST gene family in cotton, which will also promote us to perform a further investigation on the stress responsive genes that will provide valuable information for breeding stress-resistant cotton.
Materials and Methods
Sequence Retrial and Annotation of GST Genes
The G. raimondii genome database (release version 2.1; Paterson et al., 2012) was obtained from Phytozome (http://phytozome.jgi.doe.gov/pz/portal.html#!info?alias=Org_Graimondii). The published GST proteins of Arabidopsis (Sappl et al., 2009) and rice (Soranzo et al., 2004; Jain et al., 2010) were downloaded from the Arabidopsis Information Resource (TAIR release 10, http://www.arabidopsis.org) and the Rice Genome Annotation Project Database (RGAP release 7, http://rice.plantbiology.msu.edu/index.shtml), respectively. Afterwards, they were used as queries in BlastP and tBlastN searches with a stringent E-value cut-off (≤ e−20) against the G. raimondii genome database. Then, all significant hits were subjected to the InterProScan program (http://www.ebi.ac.uk/Tools/pfa/iprscan/; Quevillon et al., 2005) to confirm the presence of the conserved domains. Pfam (http://pfam.sanger.ac.uk/; Finn et al., 2008, 2014) and SMART (http://smart.embl-heidelberg.de/; Letunic et al., 2015) database were applied to further determine each candidate member of the GST family. The same approaches were executed to search against the G. arboreum genome database (release version2; Li et al., 2014) which was downloaded from CGP (http://cgp.genomics.org.cn/) to get the putative homologous GST genes. Finally, the physicochemical parameters of the full-length proteins were calculated by Compute pI/Mw tool (http://web.expasy.org/compute_pi/pi_tool; Bjellqvist et al., 1994), and the subcellular localization prediction was predicted by the CELLO v2.5 server (http://cello.life.nctu.edu.tw/; Yu et al., 2004).
Phylogenetic Analysis and Genomic Organizations Prediction
Multiple sequence alignments of all full-length GST proteins were performed using MUSCLE 3.52 program (Edgar, 2004) with default parameters, followed by manual comparisons and refinements. Phylogenetic trees were constructed by Neighbor Joining method in MEGA 5.2 (Tamura et al., 2011). Neighbor Joining analyses were carried out using pairwise deletion option and poisson correction model. To assess statistical reliability for each node, bootstrap tests were conducted with 1000 replicates. Furthermore, Minimum Evolution method of MEGA was also applied in the tree construction to validate the results from the NJ method.
The exon-intron structures were deduced using GSDS (http://gsds.cbi.pku.edu.cn/; Hu et al., 2015), through comparing the predicted coding sequences and their corresponding genomic DNA sequences.
Chromosomal Localization and Detection of Gene Duplication
All the cotton GST genes were mapped on the chromosomes according to their starting positions given in the genome annotation document. The chromosome location images were portrayed graphically by MapInspect software.
GST gene duplication events were defined according to the length coverage of the longer one between aligned gene sequences and the identity of the aligned regions, and only one duplication event was counted for tightly-linked genes (Maher et al., 2006; Ouyang et al., 2009; Liu et al., 2014). Referring to the different chromosomal location, these GST genes were designated as either tandem duplication or segmental duplication.
Estimating Ka/Ks Ratios for Duplicated Gene Pairs
Firstly, all the full-length gene sequences of the duplicated GST gene pairs of G. raimondii and G. arboreum were aligned by Clustal X 2.0 program (Larkin et al., 2007). Subsequently, the nonsynonymous substitutions rate (Ka) and synonymous substitution rate (Ks) were calculated using the software DnaSp V5.0 (Librado and Rozas, 2009). Eventually, the selection pressure of each gene pair was assessed based on the Ka/Ks ratio.
Promoter Regions Analysis
In order to analyze promoter, the 2500 bp genomic DNA sequences upstream of the initiation codon (ATG) were extracted from the genome database. Then, these sequences were subjected to the PLACE database (http://www.dna.affrc.go.jp/PLACE/signalscan.html; Higo et al., 1999) to search for the putative cis-elements in promoter regions.
Plant Materials and Salt Treatments
One-week-old cotton seedlings of G. raimondii and G. arboreum were transplanted into polypots (10 cm in diameter) with MS medium and put in a temperature-controlled chamber with temperature of 28°C, relative humidity of 60%, and photoperiod of 16 h light and 8 h dark. After acclimatization for 7 days, they were subjected to salt treatment. For G. raimondii, the MS solution were adjusted to desired salt concentrations, i.e., 0, 50, 100, and 200 mM, which represented the control condition, slight stress, moderate stress, and severe stress, respectively. Identically, final salt concentrations for G. arboreum were 0, 100, 200, and 300 mM. Three biological replicates were conducted for each sample. After treatments for 2 weeks, the root, stem, cotyledon and leaf were harvested from each individual for expression analysis. All collected samples were immediately frozen in liquid nitrogen and stored at −80°C.
RNA Isolation and Real-Time Quantitative PCR (qRT-PCR) Analysis
Total RNAs of all the collected samples were extracted using EASYspin Plus RNAprep Kit (Aidlab, Beijing, China). The quantity and quality were determined by a NanoDrop 2000 Spectrophotometer (NanoDrop Technologies, Wilmington, DE, USA). First-strand cDNA was synthesized with PrimerScript 1st Strand cDNA synthesis kit (TaKaRa, Dalian, China). All the protocols followed to the manufacturer's instructions. qRT-PCR was performed with Lightcycler 96 system (Roche, Mannheim, Germany) using SYBR the premix Ex taq (TakaRa, Dalian, China) in 20 μL volume according to the supplier's protocols. The specific primers used were listed in Supplementary Table 1, and cotton UBQ7 was used as an internal control. Three biological replicates were performed for each sample. The relative expression levels were calculated according to the 2−ΔΔCt method (Livak and Schmittgen, 2001). The heatmap for expression profiles were generated with the Mev 4.0 software (Saeed et al., 2003).
Results
Characterization of GST Gene Family in G. raimondii and G. arboreum
The genome-wide analyses of GST gene family have been performed on the basis of recently completed two diploid cotton genome sequences, G. raimondii (Paterson et al., 2012) and G. arboreum (Li et al., 2014). Through a systematic BLAST search against the G. raimondii and G. arboreum genome databases with the query sequences of Arabidopsis (55) and rice (77) GST proteins, the candidate GST genes were identified. Among the 79 GST genes in rice (Soranzo et al., 2004; Jain et al., 2010), the sequences for two genes (LOC_Os10g38501, OsGSTU3; LOC_Os10g38495, OsGSTU4) could not be retrieved as they have become obsolete entries in TIGR database. Therefore, the number of rice GST genes used as queries was 77. Then, all these retrieved sequences were verified by the Pfam and SMART analyses, and a total of 59 and 49 non-redundant genes containing both typical GST N- and C-terminal domains were confirmed in the G. raimondii and G. arboreum genome, respectively (Tables 1, 2).
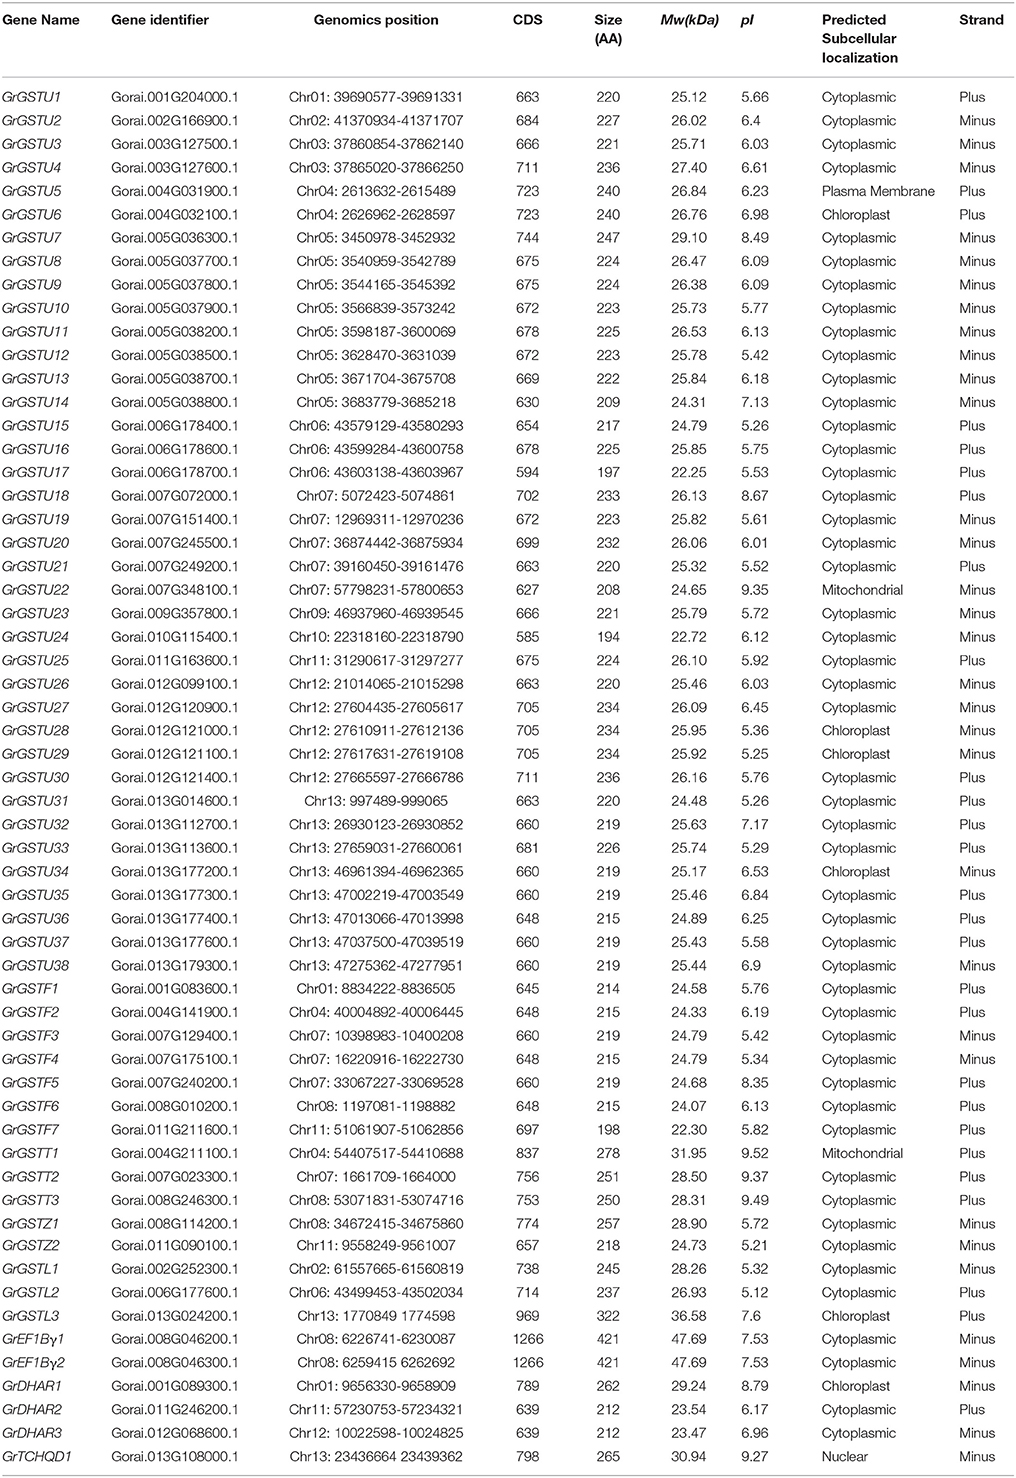
Table 1. The information of 59 GST genes from G. raimondii.
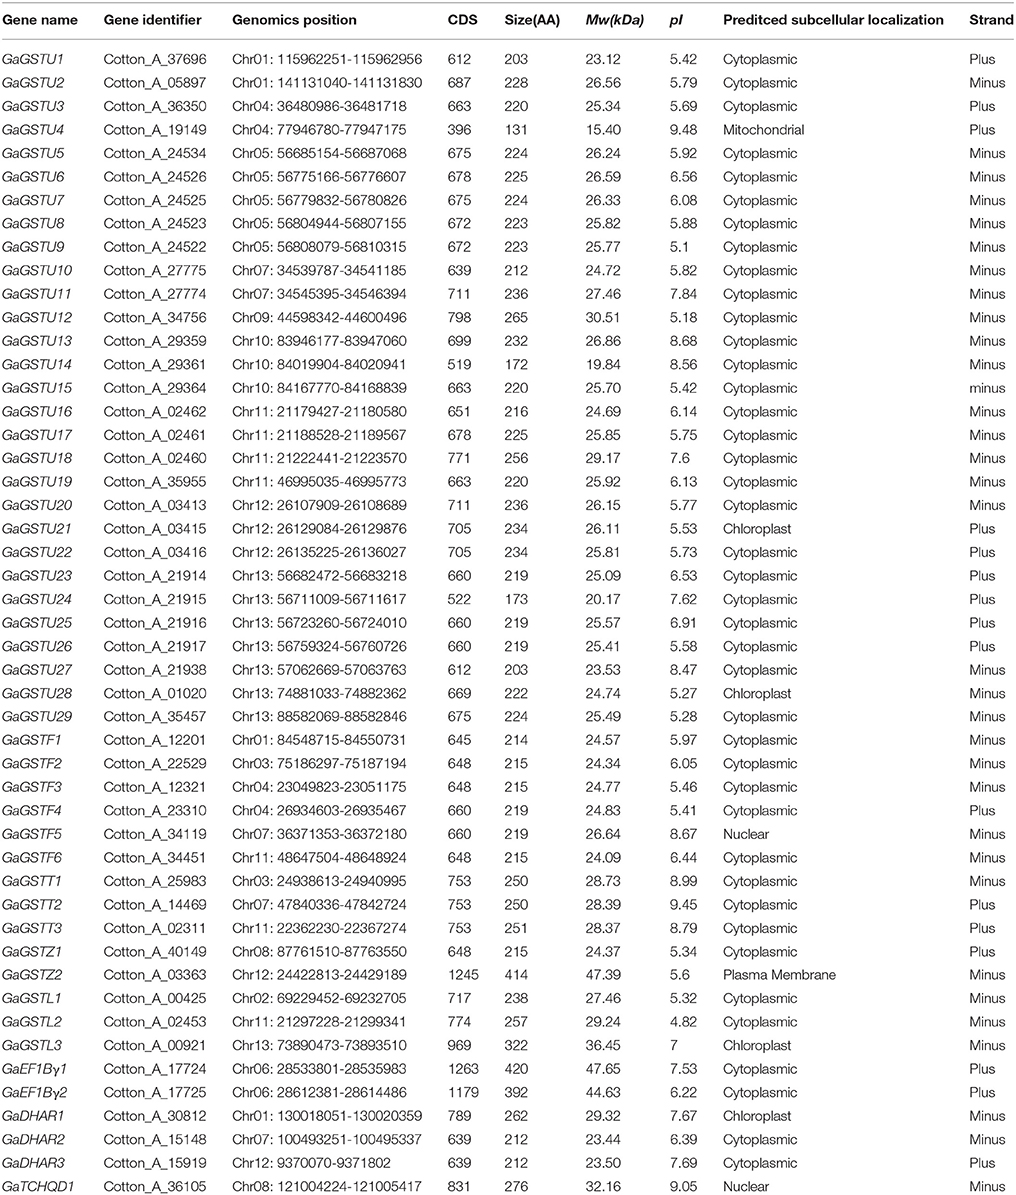
Table 2. The information of 49 GST genes from G. arboreum.
In addition to full-length GST genes, 16 partial GST genes and 4 other GST genes belong to two other subfamilies (2 of mPGES2 subfamily and 2 of C_omega_like subfamily) that distinct from the canonical GST were identified in G. raimondii genome (Supplementary Table 2). The G. arboreum genome also contains 12 partial GST fragments and one mPGES2 and two C_omega_like genes respectively (Supplementary Table 1). Domain structure analyses revealed that these partial GST genes contained only GST N- or C- domain or both of partial domains. Due to their small size, we were unable to analyze them in the subsequent research.
To reveal the classes of G. raimondii GSTs and G. arboreum GSTs, all these full-length GST protein sequences were initially subjected to National Center for Biotechnology Information's (NCBI) Conserved Domain Database (Marchler et al., 2014). Results shown that all the putative GSTs of the two cotton species can be divided into eight subgroups as Tau, Phi, Theta, Zeta, Lambda, EF1Bγ, DHAR, and TCHQD. According to the proposed nomenclature for GST genes (Dixon et al., 2002; Dixon and Edwards, 2010), all these GST genes were designated as GrGSTs for G. raimondii and GaGSTs for G. arboreum. The genes of subgroups belong to Tau, Phi, Theta, Zeta, Lambda, EF1Bγ, DHAR, and TCHQD were named as GSTU, GSTF, GSTT, GSTZ, GSTL, EF1Bγ, DHAR, and TCHQD, respectively, followed by a gene number. The numbering of each subgroup GST genes was based on their position from top to the bottom on each corresponding chromosome and different chromosomes from chromosome 1 to chromosome 13. Though the G. arboreum genome was almost two times larger than the G. raimondii (Paterson et al., 2012; Wang et al., 2012; Li et al., 2014), there were only 49 GST genes identified from G. arboreum, 10 genes less than that of the G. raimondii. The length, molecular weight (Mw), isoelectric points (pI), and the predicted subcellular localization of the 59 GrGSTs and 49 GaGSTs were deduced from their predicted protein sequences. For G. raimondii, the amino acid numbers encoded from the identified GST genes varied from 194 of GrGSTU24 to 421 of GrEF1Bγ1 and GrEF1Bγ2, and their molecular weight ranged between 22.25 kDa of GrGSTU17 to 47.69 kDa of GrEF1Bγ1 and GrEF1Bγ2. Similarly, the molecular weight of GaGST proteins ranged from 15.40 kDa of GaGSTU4 to 47.65 kDa of GaEF1Bγ1, and the amino acid numbers varied from 131 of GaGSTU4 to 420 of GaEF1Bγ1. Protein subcellular localization is important for understanding its function (Chou and Shen, 2007). Most GrGUSTs and GaGSTs were predicted to be located in the cytoplasm, only a small parts were predicted to be in the mitochondria, chloroplast, or nuclear.
Phylogenetic Analysis of the GST Gene Family
To detect the phylogenetic relationship between GST genes, all the putative GSTs from two cotton species, as well as the GST proteins from Arabidopsis and rice, were aligned to generate an unrooted phylogenetic tree separately with Neiboring-Joining method (Figures 1, 2). Meanwhile, the phylogenetic trees reconstructed with Minimum Evolution method were almost identical with only minor differences at some branches (Supplementary Figures 1, 2), suggesting that the two methods were largely consistent with each other. The phylogenetic trees shown that GST proteins from G. raimondii or G. arboreum, Arabidopsis, and rice belonging to the same class were clustered together. It suggested that both the GST gene family of the two cotton species can be grouped into eight classes. The phylogenetic classification completely matched the classification based on NCBI CDD. It could be shown in Figure 1 that Tau contained the largest number of GrGST genes (38) followed by Phi (7). This phenomenon was correspond to GST genes in other plant species (Sappl et al., 2009; Jain et al., 2010; Chi et al., 2011). The plant specific Tau and Phi GSTs were inducible in plants when they were exposure to biotic and abiotic stresses (Nutricati et al., 2006). Other two plant specific GSTs classes, Lambda and DHAR were the only GSTs shown to be active as monomers (Mohsenzadeh et al., 2011). Theta class has a putative role in detoxifying oxidized lipids (Wagner et al., 2002). G. raimondii had three members in each of them. Among the four representative plant species, only rice lack the Lambda GSTs. There were two GrGST genes each in Zeta and EF1Bγ class, which functions in tyrosine catabolism and the encoding of γ subunit of eukaryotic translation elongation factor. As with the unusual class of GST gene family, TCHQD, only one member existed in G. raimondii, Arabidopsis, and rice. All the GrGSTs clustered with their Arabidopsis and rice counterparts. It suggested that the GrGST genes duplicated after the divergence of G. raimondii, Arabidopsis, and rice.
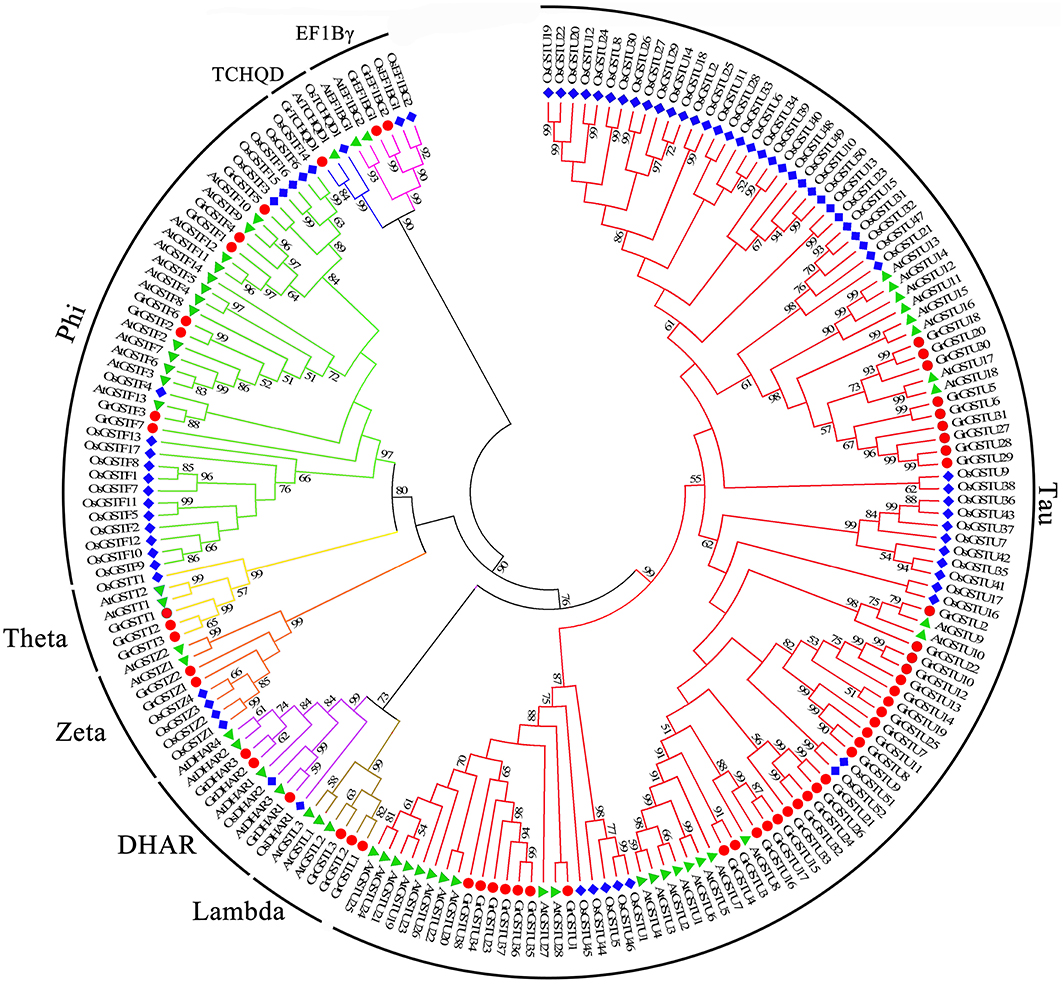
Figure 1. Phylogenetic relationships of GST genes from G. raimondii, Arabidopsis, and rice. The unrooted phylogentic tree was constructed using MEGA 5.2 by Neighbor-Joining method and the bootstrap test was performed with 1000 replicates. Percentage bootstrap scores of >50% were displayed. The GST genes from G. raimondii, Arabidopsis and rice were marked with the red dots, green triangles, and blue rhombuses respectively. And the branches of each subfamily were indicated in a specific color.
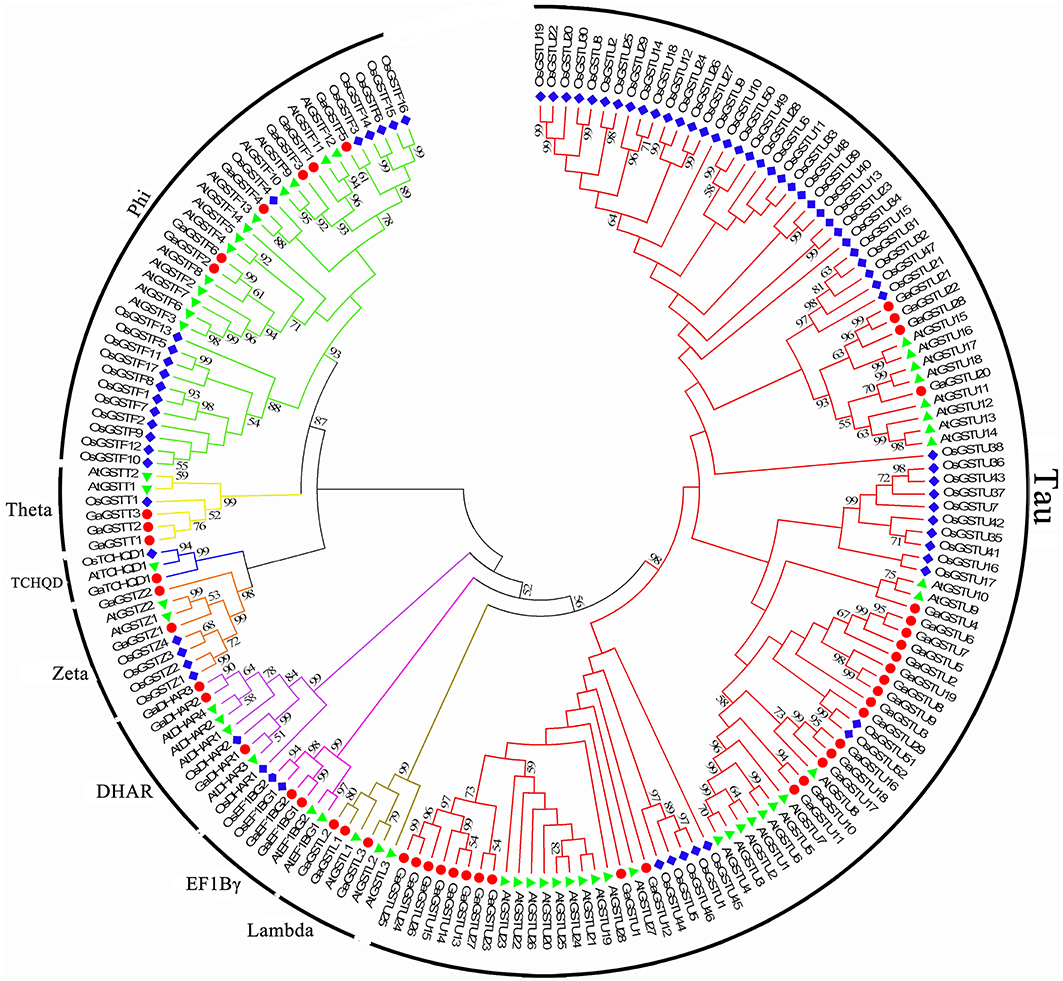
Figure 2. Phylogenetic relationships of GST genes from G. arboreum, Arabidopsis, and rice. The unrooted phylogentic tree was constructed using MEGA 5.2 by Neighbor-Joining method and the bootstrap test was performed with 1000 replicates. Percentage bootstrap scores of >50% were displayed. The GST genes from G. arboreum, Arabidopsis and rice were marked with the red dots, green triangles, and blue rhombuses, respectively. And the branches of each subfamily were indicated in a specific color.
Similarly, 49 GaGSTs can be grouped into the eight classes (Figure 2), Tau had the largest number of GST genes (29), followed by Phi (6). There were three GST genes each in Lambda, DHAR, and Theta, two each in Zeta and EF1Bγ, and one in TCHQD.
Orthologous Relationships between GrGSTs and GaGSTs
In order to reveal the orthologous relationships among the members of GST gene family between G. raimondii and G. arboreum, the protein sequences of 59 predicted full-length GrGST genes and 49 predicted full-length GaGST genes were further applied to construct a separate unrooted phylogenetic tree (Figure 3A). The topology of the tree indicated that there were 38 pairs of orthologous genes between G. raimondii and G. arboreum, since these GST genes from the two cotton species respectively were in the terminal branches with high bootstrap values. However, the others were divergent apparently, the orthologous relationships among them could not be confirmed. Among the most abundant Tau class in G. raimondii and G. arboreum, only 20 orthologous gene pairs were found. Whereas, Phi class harbored 6 pairs of orthologous genes apart from GrGSTF7. All the GST genes in DHAR (3 pairs), Lambda (3 pairs), Zeta (2 pairs), Theta (3 pairs), and TCHQD (1 pair) were in the adjacent clades separately, suggesting that all of them in each class were orthologous genes. The orthologous relationships between the two Gossypium species were displayed in Supplementary Figure 3. However, all the EF1Bγ genes were of paralogous. Moreover, there were several pairs of paralogous genes in the Tau subfamily both in G. raimondii and G. arboreum, since the genes from the same genome were in the terminal branches of the phylogenetic tree.
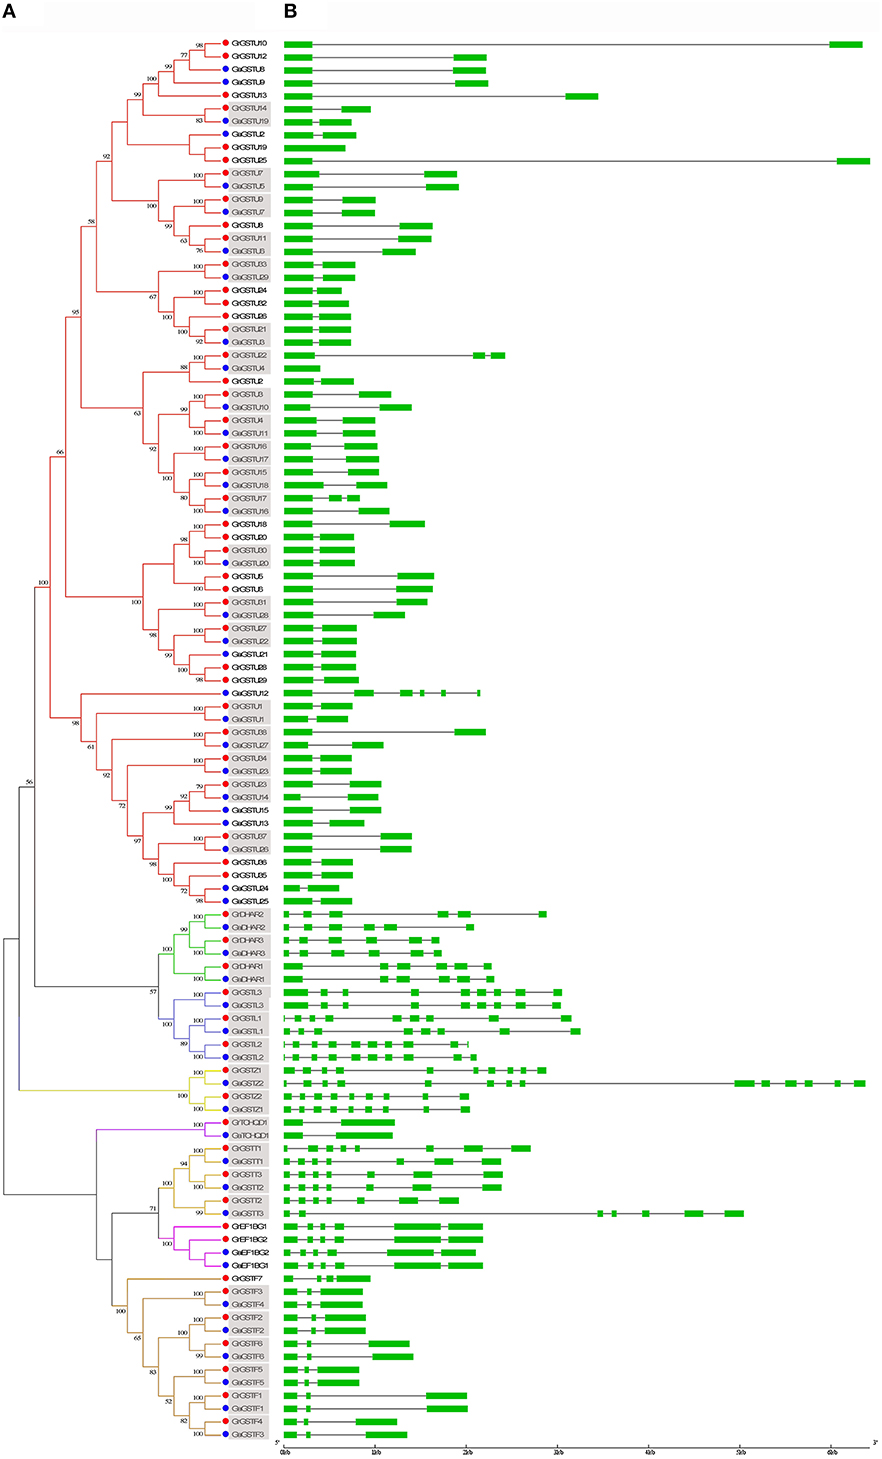
Figure 3. Phylogenetic relationships and gene structure of GST genes from G. raimondii and G. arboreum. (A) The phylogenetic tree of all GST genes in G. raimondii and G. arboreum was constructed using MEGA 5.2 by Neighbor-Joining method and the bootstrap test was performed with 1000 replicates. Percentage bootstrap scores of >50% were displayed. The GST genes from G. raimondii and G. arboreum were marked with red dots and blue dots, respectively. Gene names in gray background shown orthologous pairs. (B) The exon-inton structure of GST genes from G. raimondii and G. arboreum. Exons were represented by green boxes and introns by gray lines.
Gene Structure of GrGSTs and GaGSTs
To investigate the possible structural evolution of GST gene family in the two diploid cotton species, the gene structures of GrGSTs and GaGSTs were compared separately. The details of the comparison were illustrated in Figure 3B. In general, the exon/intron organizations of GSTs were consistent with the phylogenetic subfamilies showed in Figure 3A. And the gene structures were conserved within the same group. As an example, a host of GST genes in Tau possessed one intron, except for GaGSTU12, which contained five introns. Most members of Phi class had two introns, except for GrGSTF7 which had three introns. All the members in Theta class possessed six introns except GrGST1 that had seven. The structures of the genes in DHAR, TCHQD, and EF1Bγ classes were relatively highly conserved, and every gene in the same group had the same intron number. In contrast, the exon/intron distribution patterns in the genes of Lambda class were various. The intron numbers ranged from seven of GaGSTL1 to nine of GaGSTL2 and GrGSTL2. Zeta class also displayed great variability in gene structures. GaGSTZ2 had 13 introns, which is the maximum in all the GST genes, and GrGSTZ1 contained nine introns, while GrGSTZ2 and GaGSTZ1 each had eight introns. As expected, the gene structures of orthologous pairs were almost identical with only minor differences with the exception of GrGSTU22/GaGSTU4, GrGSTU17/GaGSTU16, GrGSTL1/GaGSTL1, GrGSTZ1/GaGSTZ1, and GrGSTT1/GaGSTT1. Additionally, the gene structures among the orthologous pairs were uniformly observed in Phi and EF1Bγ classes.
Chromosomal Localization and Gene Duplication
The 59 non-redundant GrGST genes were mapped on the 13 G. raimondii chromosomes (Figure 4). Normally, the number of GrGST genes on each chromosome varied widely. Chromosome 13 contained 10 GST genes, followed by chromosome 7 and chromosome 5 on which nine and eight members were found, respectively. Chromosome 12 had six genes, and chromosome eight had five. Chromosome 4, Chromosome 6, and Chromosome 11 contained four genes each. There were three GST genes on Chromosome 1. Both chromosome 2 and chromosome 3 harbored two genes, whereas each only single GST gene was localized on chromosome 9 and chromosome 10. Obviously, they were distributed unevenly among 13 chromosomes. In addition, most of the GrGST genes in Tau class were clustered on chromosomes. Referred to the criterion of tandem duplication (Zhao et al., 2014; Qiao et al., 2015), we defined gene cluster as that two adjacent GST genes were separated by a maximum of five intervening genes. A total of seven gene clusters were detected on seven different chromosomes, and six of them were from tau class (22 genes) and the other was produced by the genes that from EF1Bγ class (two genes). It had been revealed that tandem duplication and/or segmental duplication played a significant role in the generation of gene families. To elucidate the expanded mechanism of GST gene family in G. raimondii, the gene duplication events were investigated, and 12 tandem duplication events, GrGSTU5/GrGSTU6, GrGSTU7/GrGSTU11, GrGSTU8/GrGSTU7, GrGSTU9/GrGSTU8, GrGSTU10/ GrGSTU12, GrGSTU12/GrGSTU13, GrGSTU13/GrGSTU10, GrGSTU28/GrGSTU29, GrGSTU35/GrGSTU36, GrGSTU36/GrGSTU37, GrGSTU37/GrGSTU35, and GrEF1Bγ1/GrEF1Bγ2, were detected in the G. raimondii genome (Figure 4). Interestingly, all tandem duplicated gene pairs were concluded in their different gene clusters respectively. Furthermore, three segmental duplication events, GrGSTU21/GrGSTU26, GrGSTU24/GrGSTU32, and GrDHAR2/GrDHAR3, were detected. It suggested that both the two kinds of duplication events contributed to the GST gene family expansion in G. raimondii.
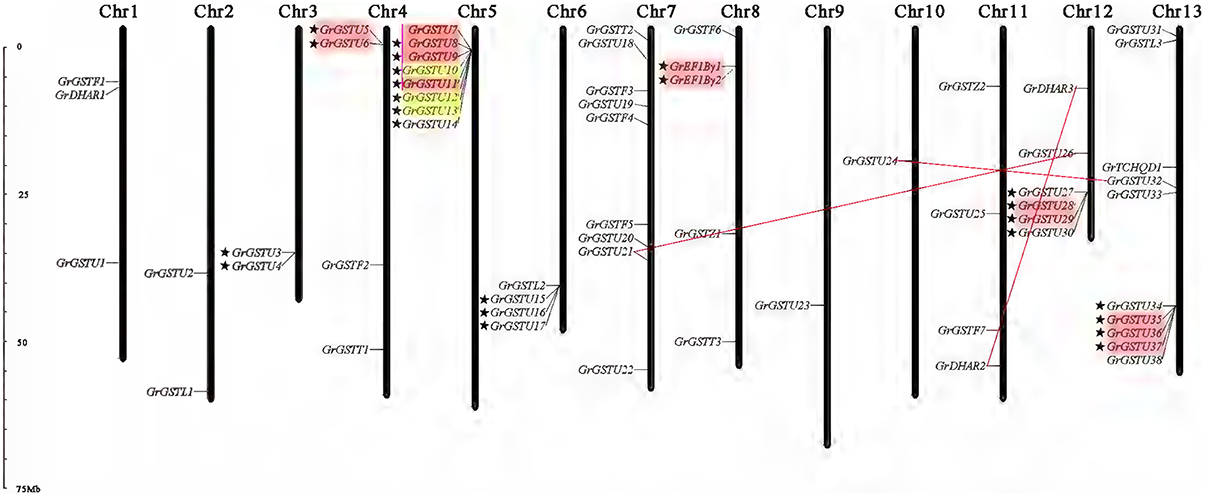
Figure 4. Chromosomal distribution and gene duplication of GST genes in G. raimondii. The chromosome number was indicated at the top of each chromosome representation. The scale on the left was in megabases (Mb). The genes with a pentagram left represent GST gene clusters. The tandem duplicated genes were highlighted with outlined boxes. And the segmental duplicated gene pairs are connected with red lines.
Like the case in G. raimondii, the 49 GaGST gene loci distributed unevenly across the 13 chromosomes in G. arboreum, ranging from 1 to 8 genes per chromosome (Figure 5). A maximum number of eight genes were located on chromosome 13 closely, followed by seven genes on chromosome 11. In contrast, only one gene was located on chromosome 2 and chromosome 9 each. There were also seven gene clusters distributed on seven different chromosomes. Analogously, six out of the seven gene clusters were composed of 19 GaGSTs in Tau class and the rest one was formed by GaEF1Bγ class. A total of 10 tandem duplication events and one segmental duplication event were found. We also concluded that the expansion of GST gene family in G. arboreum was mainly attributed to tandem duplication events rather than segmental duplication event.
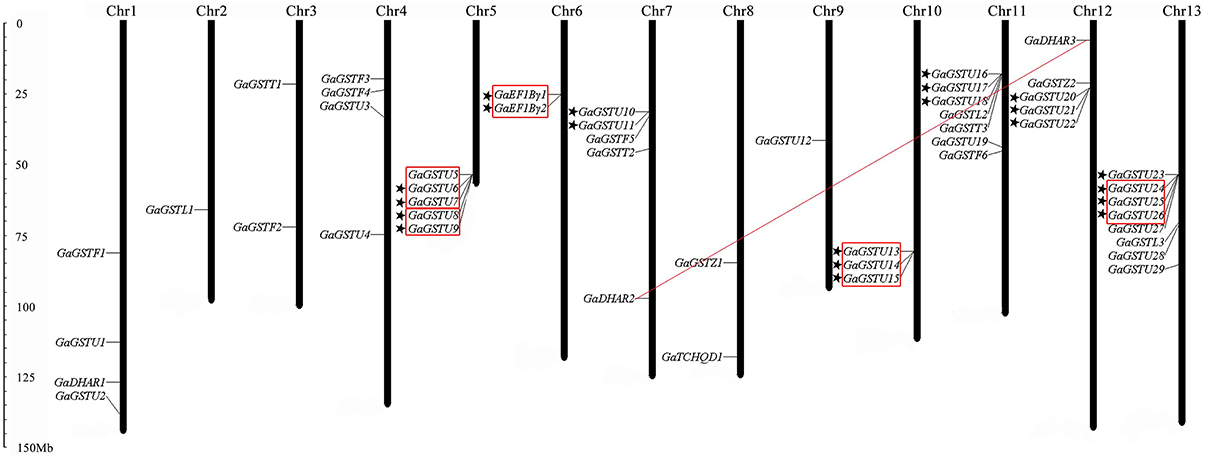
Figure 5. Chromosomal distribution and gene duplication of GST genes in G. arboreum. The chromosome number was indicated at the top of each chromosome representation. The scale on the left was in megabases (Mb). The genes with a pentagram left represent GST gene clusters. Red outlined boxes represent tandem duplicated genes. And the segmental duplicated gene pairs were connected with red lines.
Selective Pressure Analysis of the Duplicated GST Genes
To investigate the selective constrains on duplicated GST genes, the non-synonymous to synonymous substitution ratio (Ka/Ks) for each pair of duplicated GST genes were calculated. Generally, Ka/Ks ratio >1 indicates positive selection, Ka/Ks = 1 indicates neutral selection, while a ratio < 1 indicates negative or purifying selection. In this study, 15 duplicated pairs in the G. raimondii and 11 duplicated pairs in G. arboreum GST gene family were investigated respectively. In G. raimondii, the Ka/Ks ratio for 11 duplicated pairs were < 1 (Table 3), with most of them being even < 0.3, which suggested that they had experienced strong purifying selection pressure. However, the remaining four duplicated pairs with ratios >1 seemed to be under positive selection. While in the case of G. arboreum, 10 out of 11 duplicated pairs had undergone purifying selection pressure, and only one pair of duplicated GST genes with a ratio >1 were found in G. arboreum. Those observations reflected that the functions of the duplicated GST genes in the two cottons did not diverge much during subsequent evolution. And the purifying selection might contribute largely to the maintenance of function in G. arboreum GST family.
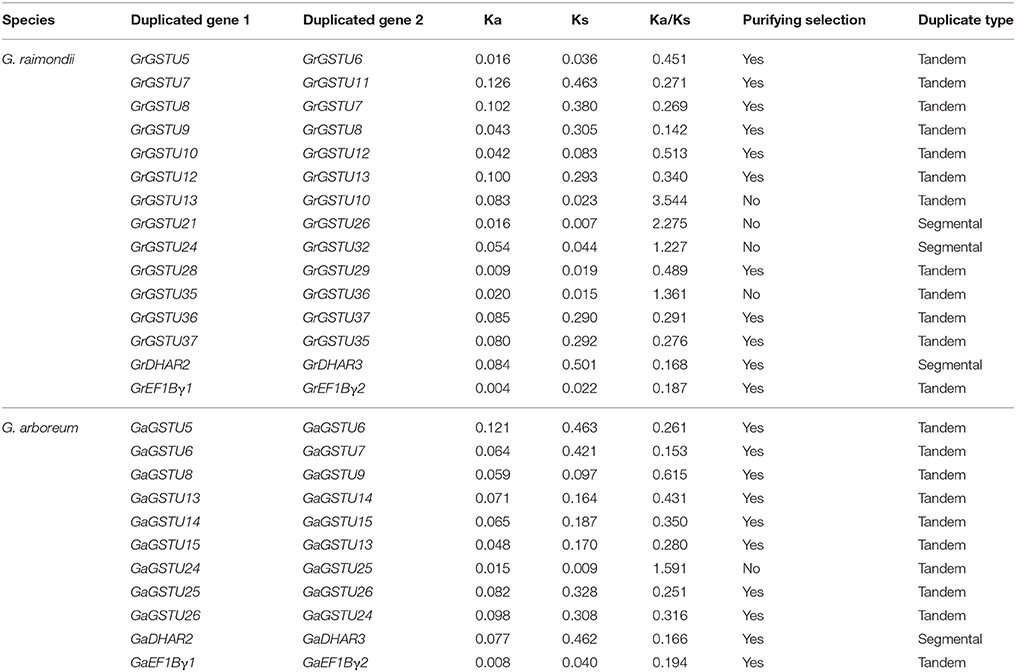
Table 3. Ka/Ks analysis for the duplicated GST gene pairs from G. raimondii and G. arboretum.
The Expression Profiles of Potential Salt Stress-Responsive GST Genes
Salt stress is one of the serious environmental stresses that most land plants might encounter during the process of their growth. Many GSTs have been implicated in various abiotic stress responses in plants (Droog, 1997; Scarponi et al., 2006; Sharma et al., 2014; Yang et al., 2014). However, little is known about the functions of GST genes in the cotton response to salt stress. The cis-elements in gene promoter regions might provide some indirect evidence for the functional dissection of GST genes in stress response (Zhou et al., 2013). Though the specific items of salt-responsive element were not existed in the PLACE database, some cis-elements might respond to multiple environment stimuli (Higo et al., 1999). All of putative environment stimulus responsive cis-elements in cotton GST genes were detected (Supplementary Table 3). The results revealed that the majority of GST genes, 19 GrGSTs, and 21 GaGSTs, contained relevant cis-elements in promoter sequences, which indicated that these cotton GST genes might the signal transduction of the plant response to salt stress.
To verify the expression patterns of these GST genes, a comprehensive qRT-PCR analysis of 40 selected GSTs were performed (Figure 6). As shown in Figure 6, cotyledons and leaves exhibited more concentrated expression levels compared with roots and stems. Most of these 40 cotton GST genes had specific spatial expression patterns. GrDHAR2, GaGSTU15, GaGSTF3, and GaGSTU14 preferentially expressed both in cotyledons and leaves, and GrGSTZ2 were highly expressed in all tissues detected. There were seven orthologs among the selected genes, but only one pair GrGSTU30/GaGSTU20 clustered together. It was inferred that the expression of GST orthologs between G. raimondii and G. arboreum have experienced divergence.
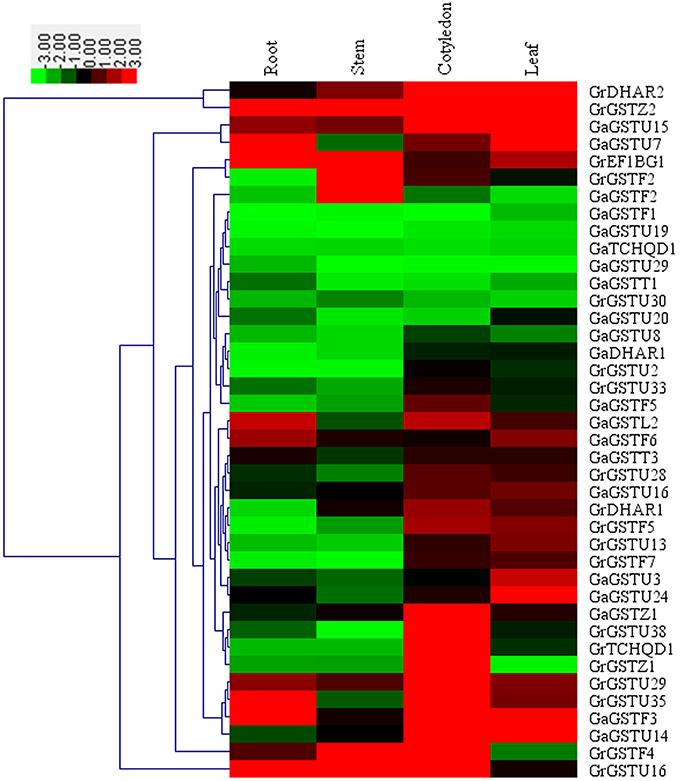
Figure 6. Expression patterns of 40 selected GST genes in four representative tissues of G. raimondii and G. arboreum. The color bar represents the relative signal intensity values.
The expression of all the selected GST genes has also been conducted in the roots, stems, cotyledons and leaves of two cotton species under salt treatments. Results showed altered expression patterns of either induction or suppression associated with at least one salt concentration (Figure 7). In roots, nearly all the selected GST genes showed up-regulated expression after salt treatment except for GaGSTF6 and GaGSTU20. In stems, GaGSTF1, GaDHAR1, GaGSTU24, GaGSTF2, and GrGSTU30 were down-regulated. Several GST genes displayed initial up-regulation and subsequent down-regulation. However, only a few up-regulated expressed GST genes were found in cotyledons compared with roots. GaGSTF1, GaGSTU29, GaGSTU7, and GrEF1Bγ1 showed insignificantly up-regulated expression by salt inducing in cotyledons. In leaves, the expressions of most selected GST genes were up-regulated just under slight salt stress. Nevertheless, GaGSTU29, GrGSTU16, GaGSTZ1, and GrGSTF4 showed continued up-regulation in different level of salt stress. In addition, only one orthologs, GaGSTF2/GrGSTF2, were clustered together with similar expression patterns.
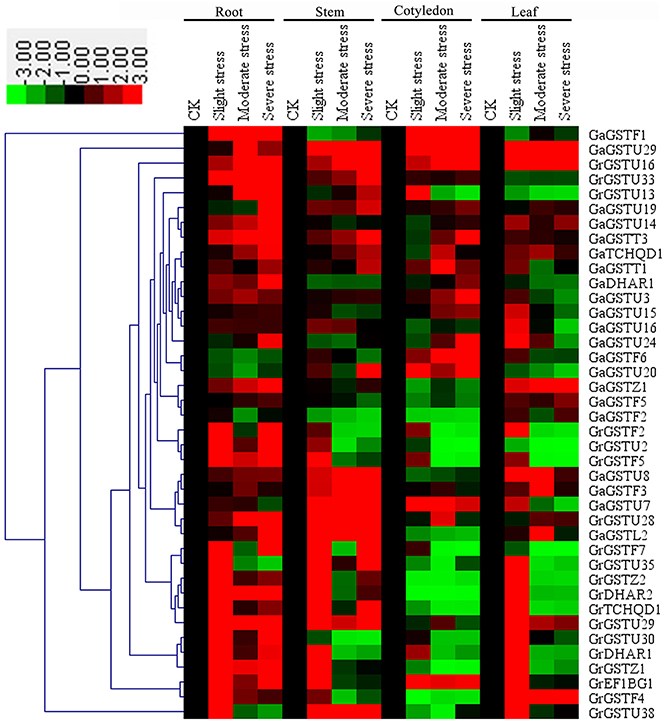
Figure 7. Expression patterns of 40 selected GST genes in four representative tissues of G. raimondii and G. arboreum under salt stress. The color bar represents the relative signal intensity values. The slight stress, moderate stress, and severe stress represent 50, 100, and 200 mM NaCl in G. raimondii and 100, 200, and 300 mM NaCl in G. arboreum, respectively.
Discussion
Salinity resulting mainly from NaCl is one of common environmental stresses that afflict the growth and yield of crops in many places of the world (Shabala, 2013). Salt stress may increase the reactive oxygen species (ROS) and damage the integrity of cell membranes, which triggering the disturbance of metabolism (Zhu, 2002). Plant adaptation to salt stress involved a series of biochemical pathways and lots of active compounds such as antioxidant enzymes (Guo et al., 2001).
Phylogenetic Analyses and Evolution of GST Gene Family in G. raimondii and G. arboreum
A growing numbers of research works were devoted to elucidating the roles of plant GSTs in growth and stress responses (Oakley, 2005; Dixon et al., 2010; Skopelitou et al., 2012). A total of 59 and 49 putative GST genes were identified in the genomes of G. raimondii and G. arboreum respectively in present work. Phylogenetic analyses revealed that both GrGSTs and GaGSTs were more closely allied to AtGSTs than to OsGSTs, which were consistent with the evolutionary relationships among G. raimondii, G. arboreum, Arabidopsis, and rice. Moreover, all the GST genes from the three representative dicot species sorted into eight distinct clades, except the Lambda class which was absent in rice. This implied that these seven subfamilies but Lambda arose before divergence the monocots-dicots. In turns, Lambda group was either acquired after the evolutionary split of monocots-dicots or lost in rice. Intriguingly, the member of GST gene family in G. raimondii was a little bit more than that in Arabidopsis (55) and much less than that in rice (77). It was more obvious in the case of G. arboreum which contained the minimum GST genes among the four representative species, albeit the genomes of the two diploid cottons were larger than that of Arabidopsis and rice. A proper explanation of the phenomenon was that the transposable elements represented a major component of Gossypium genome (Hawkins et al., 2006).
Tandem Duplication Plays a Major Role in the Expansion of GST Gene Family in G. raimondii and G. arboreum
Like the GST gene families in other known plants (Soranzo et al., 2004; Sappl et al., 2009), most GST gene loci in G. raimondii and G. arboreum were present in genomes in clusters of two to seven genes. There were seven gene clusters each in the genomes of G. raimondii and G. arboreum, presumably as a result of multiple tandem duplication events in the common ancestor of Gossypium. The classifications of full-length GST genes suggested that whether in G. raimondii or G. arboreum, the members of Tau GSTs and Phi GSTs were more than the others. In addition, Tau GSTs occupied 12 of the total 14 GST gene clusters in the two diploid cottons. The rest of them were composed of EF1Bγ GSTs. It has been demonstrated that the expansion of gene families is mainly caused by gene duplication events, including tandem duplication, segmental duplication, transposition events, and whole-genome duplication (Blanc and Wolfe, 2004; Flagel and Wendel, 2009). It also could be speculated that the amplification of the GST gene family were mainly caused by the tandem duplication for Tau and Phi classes both in G. raimondii and G. arboreum. An intriguing finding was that purifying selection has predominated across the duplicated genes. The reasons might be that (1) deleterious mutations might occur in different domains in copies of genes with multiple independent domain subfunctions (Force et al., 1999; Lan et al., 2009); (2) purifying selection could eliminate deleterious loss-of-function mutations, thus fixed a new duplicate gene and enhanced the preservation of functional alleles at both duplicate loci (Tanaka et al., 2009). In addition, the number of GaGST genes was less than that of GrGSTs, although the genome size of G. arboreum is almost twice larger than that of G. raimondii (Paterson et al., 2012; Wang et al., 2012; Li et al., 2014). A theoretical explanation was that G. arboreum had undergone large-scale retrotransposons insertion during evolution (Li et al., 2014).
Functional Divergence of Specific Cotton GST Genes under Salt Stress
It is worth to notice that orthologous GST gene pairs demonstrated very similar exon/intron distribution patterns in terms of exon length and intron number. However, the expression patterns of them were divergent. It might involve with the adaptation to different habitat of G. raimondii and G. arboreum after their species-specific evolution. Remarkably, the exons of the GST genes in the same classes were highly conserved whether of intraspecies or interspecies, but the introns were various with indel mutations (Xu et al., 2012). Further analyses are needed to elucidate the impacts of intron variation on gene function. The gene expression patterns can provide important clues for gene function. The tissue-specific expression patterns of 40 selected GST genes under normal condition reflected that they might play versatile functions in the growth and development of cotton. Additionally, they also shown divergent expression patterns under salt treatment. It is clear that the roots are the first tissues which salt stress directly affected in the soil or culture solution (Guo et al., 2001). In our study, what consistent with the fact proposed was that almost all the selected GST genes were up-regulated in response to salt stress in roots. By contrast, a majority of genes showed up-regulation in leaves only under slight salt stress. This was probably associated with the facts that these two tissues by themselves were distinct in structure and functions (Qing et al., 2009; Campo et al., 2014). Duplicate genes might have three different evolutionary fates, i.e., nonfunctionalization, subfunctionalization, and neofunctionalization (Liu et al., 2014). The expression pattern shifts of the duplicated genes GaGSTU14/GaGSTU15 indicated the functional divergence after duplicated events. Among the seven orthologs, only one pair, GrGSTF2/GaGSTF2, clustered together under salt treatment. These findings further supported the assertion that expression divergence is often the first step in the functional divergence between duplicate genes, thereby increases the chance of duplicate genes being retained in a genome (Zhang, 2003).
In short, the GST gene family both in G. raimondii and G. arboreum were identified and characterized using bioinformatics approaches, and the results have provided a basis for further assessment of physiological roles of different GST genes in response to salt stress in Gossypium species.
Author Contributions
YD, SZ, and JC conceived all the experiments and analyzed data. YD performed experiments, drafted the manuscript and prepared the figures. YD and SZ wrote and reviewed the manuscript. CL and YZ prepared figures. QH analyzed data. JC performed the experiments. MD contributed to the manuscript preparation. All authors reviewed the manuscript.
Conflict of Interest Statement
The authors declare that the research was conducted in the absence of any commercial or financial relationships that could be construed as a potential conflict of interest.
The reviewer SR and Handling Editor declared their shared affiliation, and the Handling Editor states that the process nevertheless met the standards of a fair and objective review.
Acknowledgments
We are grateful to Wei Li, Wei Liu, Li Chen, Lu Zhang, Jieqiong Huang, Jiyu Feng, and Tianlun Zhao (Zhejiang University, China) for their support in this study. The work was funded by National Basic Research Program (973 program, No: 2010CB126006), and National High Technology Research and Development Program of China (2011AA10A102, 2013AA102601).
Supplementary Material
The Supplementary Material for this article can be found online at: http://journal.frontiersin.org/article/10.3389/fpls.2016.00139
Supplementary Figure 1. Phylogenetic analysis of GST genes from G. raimondii, Arabidopsis, and rice. The unrooted phylogentic tree was constructed using MEGA 5.2 by Minimum Evolution method and the bootstrap test was performed with 1000 replicates. Percentage bootstrap scores of >50% were displayed. The GST genes from G. raimondii, Arabidopsis and rice were marked with the dots, triangles, and rhombuses, respectively.
Supplementary Figure 2. Phylogenetic analysis of GST genes from G. arboreum, Arabidopsis, and rice. The unrooted phylogentic tree was constructed using MEGA 5.2 by Minimum Evolution method and the bootstrap test was performed with 1000 replicates. Percentage bootstrap scores of >50% were displayed. The GST genes from G. arboreum, Arabidopsis and rice were marked with the dots, triangles, and rhombuses, respectively.
Supplementary Figure 3. Locations and orthologs of GST genes in G. raimondii and G. arboreum. The picture was generated by Circos software. The chromosomes of G. raimondii and G. arboreum were shown with different colors and labeled as Gr and Ga, respectively. The putative orthologous genes belonging to the Tau, Phi, Lambda, DHAR, Zeta, Theta, and TCHQD1 subfamilies were connected by yellow, green, blue, purple, orange, red, and gray lines, respectively.
Supplementary Table 1. PCR primers used in this study.
Supplementary Table 2. The information of partial GST genes and mPGES2 and C_pmega_lke subfamilies in G. raimondii and G. arboreum.
Supplementary Table 3. The cis-elements involved in salt stress response in the promoter regions of GrGSTs and GaGSTs.
References
Armstrong, R. N. (1997). Structure, catalytic mechanism, and evolution of the glutathione transferases. Chem. Res. Toxicol. 10, 2–18. doi: 10.1021/tx960072x
Bjellqvist, B., Basse, B., Olsen, E., and Celis, J. E. (1994). Reference points for comparisons of two-dimensional maps of proteins from different human cell types defined in a pH scale where isoelectric points correlate with polypeptide compositions. Electrophoresis 15, 529–539. doi: 10.1002/elps.1150150171
Blanc, G., and Wolfe, K. H. (2004). Widespread paleopolyploidy in model plant species inferred from age distributions of duplicate genes. Plant Cell 16, 1667–1678. doi: 10.1105/tpc.021345
Campo, S., Baldrich, P., Messeguer, J., Lalanne, E., Coca, M., and Segundo, B. S. (2014). Overexpression of a calcium-dependent protein kinase confers salt and drought tolerance in rice by preventing membrane lipid peroxidation. Plant Physiol. 165, 688–704. doi: 10.1104/pp.113.230268
Chan, C., and Lam, H. M. (2014). A putative lambda class glutathione S-transferase enhances plant survival under salinity stress. Plant Cell Physiol. 55, 570–579. doi: 10.1093/pcp/pct201
Chi, Y., Cheng, Y., Vanitha, J., Kumar, N., Ramamoorthy, R., Ramachandran, S., et al. (2011). Expansion mechanisms and functional divergence of the glutathione s-transferase family in sorghum and other higher plants. DNA Res. 18, 1–16. doi: 10.1093/dnares/dsq031
Cho, H.-Y., Yoo, S.-Y., and Kong, K.-H. (2006). Cloning of a rice tau class GST isozyme and characterization of its substrate specificity. Pestic. Biochem. Physiol. 86, 110–115. doi: 10.1016/j.pestbp.2006.02.003
Chou, K. C., and Shen, H. B. (2007). Recent progress in protein subcellular location prediction. Anal. Biochem. 370, 1–16. doi: 10.1016/j.ab.2007.07.006
Dixon, D. P., Cummins, I., Cole, D. J., and Edwards, R. (1998). Glutathione-mediated detoxification systems in plants. Curr. Opin. Plant Biol. 1, 258–266. doi: 10.1016/S1369-5266(98)80114-3
Dixon, D. P., and Edwards, R. (2010). Glutathione transferases. Am. Soc. Plant Biol. 2010, e0131. doi: 10.1199/tab.0131
Dixon, D. P., Lapthorn, A., and Edwards, R. (2002). Plant glutathione transferases. Genome Biol. 3, 3004.1–3004.10. doi: 10.1186/gb-2002-3-3-reviews3004
Dixon, D. P., Skipsey, M., and Edwards, R. (2010). Roles for glutathione transferases in plant secondary metabolism. Phytochemistry 71, 338–350. doi: 10.1016/j.phytochem.2009.12.012
Droog, F. (1997). Plant glutathione S-transferases, a tale of Theta and Tau. J. Plant Growth Regul. 16, 95–107. doi: 10.1007/PL00006984
Edgar, R. C. (2004). MUSCLE: a multiple sequence alignment method with reduced time and space complexity. BMC Bioinformatics 5:113. doi: 10.1186/1471-2105-5-113
Edwards, R., Dixon, D. P., and Walbot, V. (2000). Plant glutathione S-transferases: enzymes with multiple functions in sickness and in health. Trends Plant. Sci. 5, 1360–1385. doi: 10.1016/S1360-1385(00)01601-0
Finn, R. D., Bateman, A., Clements, J., Coggill, P., Eberhardt, R. Y., Eddy, S. R., et al. (2014). Pfam: the protein families database. Nucleic Acids Res. 42, D222–D230. doi: 10.1093/nar/gkt1223
Finn, R. D., Tate, J., Mistry, J., Coggill, P. C., Sammut, S. J., Hotz, H. R., et al. (2008). The Pfam protein families database. Nucleic Acids Res. 36, D281–D288. doi: 10.1093/nar/gkr1065
Flagel, L. E., and Wendel, J. F. (2009). Gene duplication and evolutionary novelty in plants. New Phytol. 183, 557–564. doi: 10.1111/j.1469-8137.2009.02923.x
Force, A., Lynch, M., Pickett, F. B., Amores, A., Yan, Y., and Postlethwait, J. (1999). Preservation of duplicate genes by complementary, degenerative mutations. Genetics 151, 1531–1545.
Frova, C. (2006). Glutathione transferases in the genomics era: new insights and perspectives. Biomol. Eng. 23, 149–169. doi: 10.1016/j.bioeng.2006.05.020
Galle, A., Csiszar, J., Secenji, M., Guoth, A., Cseuz, L., Tari, I., et al. (2009). Glutathione transferase activity and expression patterns during grain filling in flag leaves of wheat genotypes differing in drought tolerance: response to water deficit. J. Plant Physiol. 166, 1878–1891. doi: 10.1016/j.jplph.2009.05.016
Grover, C. E., Kim, H., Wing, R. A., Paterson, A. H., and Wendel, J. F. (2007). Microcolinearity and genome evolution in the AdhA region of diploid and polyploid cotton (Gossypium). Plant J. 50, 995–1006. doi: 10.1111/j.1365-313X.2007.03102.x
Guo, Y., Halfter, U., Ishitani, M., and Zhu, J. K. (2001). Molecular characterization of functional domains in the protein kinase SOS2 that is required for plant salt tolerance. Plant Cell 13, 1383–1399. doi: 10.1105/tpc.13.6.1383
Hawkins, J. S., Kim, H., Nason, J. D., Wing, R. A., and Wendel, J. F. (2006). Differential lineage-specific amplification of transposable elements is responsible for genome size variation in Gossypium. Genome Res. 16, 1252–1261. doi: 10.1101/gr.5282906
Higo, K., Ugawa, Y., Iwamoto, M., and Korenaga, T. (1999). Plant cis-acting regulatory DNA elements (PLACE) database: 1999. Nucleic Acids Res. 27, 297–300. doi: 10.1093/nar/27.1.297
Hu, B., Jin, J., Guo, A. Y., Zhang, H., Luo, J., and Gao, G. (2015). GSDS 2.0: an upgraded gene feature visualization server. Bioinformatics 31, 1296–1297. doi: 10.1093/bioinformatics/btu817
Jain, M., Ghanashyam, C., and Bhattacharjee, A. (2010). Comprehensive expression analysis suggests overlapping and specific roles of rice glutathione S-transferase genes during development and stress responses. BMC Genomics 11:73. doi: 10.1186/1471-2164-11-73
Ji, W., Zhu, Y., Li, Y., Yang, L., Zhao, X., Cai, H., et al. (2010). Over-expression of a glutathione S-transferase gene, GsGST, from wild soybean (Glycine soja) enhances drought and salt tolerance in transgenic tobacco. Biotechnol. Lett. 32, 1173–1179. doi: 10.1007/s10529-010-0269-x
Kadir, Z. B. (1976). DNA evolution in the genus gossypium. Chromosoma (Berl.) 56, 85–94. doi: 10.1007/BF00293732
Lan, T., Yang, Z. L., Yang, X., Liu, Y. J., Wang, X. R., and Zeng, Q. Y. (2009). Extensive functional diversification of the Populus glutathione S-transferase supergene family. Plant Cell 21, 3749–3766. doi: 10.1105/tpc.109.070219
Larkin, M. A., Blackshields, G., Brown, N. P., Chenna, R., McGettigan, P. A., McWilliam, H., et al. (2007). Clustal W and Clustal X version 2.0. Bioinformatics 23, 2947–2948. doi: 10.1093/bioinformatics/btm404
Letunic, I., Doerks, T., and Bork, P. (2015). SMART: recent updates, new developments and status in 2015. Nucleic Acids Res. 43, D257–D260. doi: 10.1093/nar/gku949
Li, F., Fan, G., Wang, K., Sun, F., Yuan, Y., Song, G., et al. (2014). Genome sequence of the cultivated cotton Gossypium arboreum. Nat. Genet. 46, 567–572. doi: 10.1038/ng.2987
Librado, P., and Rozas, J. (2009). DnaSP v5: a software for comprehensive analysis of DNA polymorphism data. Bioinformatics 25, 1451–1452. doi: 10.1093/bioinformatics/btp187
Licciardello, C., D'Agostino, N., Traini, A., Recupero, G. R., Frusciante, L., and Chiusano, M. L. (2014). Characterization of the glutathione S-transferase gene family through ESTs and expression analyses within common and pigmented cultivars of Citrus sinensis (L.) Osbeck. BMC Plant Biol. 14:39. doi: 10.1186/1471-2229-14-39
Liu, W., Li, W., He, Q., Daud, M. K., Chen, J., and Zhu, S. (2014). Genome-wide survey and expression analysis of calcium-dependent protein kinase in Gossypium raimondii. PLoS ONE 9:e98189. doi: 10.1371/journal.pone.0098189
Liu, Y. J., Han, X. M., Ren, L. L., Yang, H. L., and Zeng, Q. Y. (2013). Functional divergence of the glutathione S-transferase supergene family in Physcomitrella patens reveals complex patterns of large gene family evolution in land plants. Plant Physiol. 161, 773–786. doi: 10.1104/pp.112.205815
Livak, K. J., and Schmittgen, T. D. (2001). Analysis of relative gene expression data using real-time quantitative PCR and the 2(-Delta Delta C(T)) Method. Methods 25, 402–408. doi: 10.1006/meth.2001.1262
Ma, X. X., Jiang, Y. L., He, Y. X., Bao, R., Chen, Y., and Zhou, C. Z. (2009). Structures of yeast glutathione-S-transferase Gtt2 reveal a new catalytic type of GST family. EMBO Rep. 10, 1320–1326. doi: 10.1038/embor.2009.216
Maher, C., Stein, L., and Ware, D. (2006). Evolution of Arabidopsis microRNA families through duplication events. Genome Res. 16, 510–519. doi: 10.1101/gr.4680506
Marchler, B. A., Derbyshire, M. K., Gonzales, N. R., Lu, S., Chitsaz, F., Geer, L. Y., et al. (2014). CDD: NCBI's conserved domain database. Nucleic Acids. Res. 43, D222–D226. doi: 10.1093/nar/gku1221
Marrs, K. A. (1996). The functions and regulation of glutathione S-transferases in plants. Annu. Rev. Plant Physiol. Plant Mol. Biol. 47, 127–158. doi: 10.1146/annurev.arplant.47.1.127
Mohsenzadeh, S., Esmaeili, M., Moosavi, F., Shahrtash, M., Saffari, B., and Mohabatkar, H. (2011). Plant glutathione S-transferase classification, structure and evolution. Afr. J. Biotechnol. 10, 8160–8165. doi: 10.5897/AJB11.1024
Nutricati, E., Miceli, A., Blando, F., and De Bellis, L. (2006). Characterization of two Arabidopsis thaliana glutathione S-transferases. Plant Cell Rep. 25, 997–1005. doi: 10.1007/s00299-006-0146-1
Oakley, A. J. (2005). Glutathione transferases: new functions. Curr. Opin. Struct. Biol. 15, 716–723. doi: 10.1016/j.sbi.2005.10.005
Ouyang, Y., Chen, J., Xie, W., Wang, L., and Zhang, Q. (2009). Comprehensive sequence and expression profile analysis of Hsp20 gene family in rice. Plant Mol. Biol. 70, 341–357. doi: 10.1007/s11103-009-9477-y
Paterson, A. H., Wendel, J. F., Gundlach, H., Guo, H., Jenkins, J., Jin, D., et al. (2012). Repeated polyploidization of Gossypium genomes and the evolution of spinnable cotton fibres. Nature 492, 423–427. doi: 10.1038/nature11798
Qiao, L., Zhang, X., Han, X., Zhang, L., Li, X., Zhan, H., et al. (2015). A genome-wide analysis of the auxin/indole-3-acetic acid gene family in hexaploid bread wheat (Triticum aestivum L.). Front. Plant Sci. 6:770. doi: 10.3389/fpls.2015.00770
Qing, D. J., Lu, H. F., Li, N., Dong, H. T., Dong, D. F., and Li, Y. Z. (2009). Comparative profiles of gene expression in leaves and roots of maize seedlings under conditions of salt stress and the removal of salt stress. Plant Cell Physiol. 50, 889–903. doi: 10.1093/pcp/pcp038
Quevillon, E., Silventoinen, V., Pillai, S., Harte, N., Mulder, N., Apweiler, R., et al. (2005). InterProScan: protein domains identifier. Nucleic Acids Res. 33, W116–W120. doi: 10.1093/nar/gki442
Rezaei, M. K., Shobbar, Z. S., Shahbazi, M., Abedini, R., and Zare, S. (2013). Glutathione S-transferase (GST) family in barley: identification of members, enzyme activity, and gene expression pattern. J. Plant. Physiol. 170, 1277–1284. doi: 10.1016/j.jplph.2013.04.005
Saeed, A. I., Sharov, V., White, J., Li, J., Liang, W., Bhagabati, N., et al. (2003). TM4: A free, open-source system for microarray data management and analysis. Biotechniques 34, 374–378.
Sappl, P. G., Carroll, A. J., Clifton, R., Lister, R., Whelan, J., Harvey, M. A., et al. (2009). The Arabidopsis glutathione transferase gene family displays complex stress regulation and co-silencing multiple genes results in altered metabolic sensitivity to oxidative stress. Plant J. 58, 53–68. doi: 10.1111/j.1365-313X.2008.03761.x
Scarponi, L., Quagliarini, E., and Buono, D. D. (2006). Induction of wheat and maize glutathione S-transferase by some herbicide safeners and their effect on enzyme activity against butachlor and terbuthylazine. Pest Manag. Sci. 62, 927–932. doi: 10.1002/ps.1258
Shabala, S. (2013). Learning from halophytes: physiological basis and strategies to improve abiotic stress tolerance in crops. Ann. Bot. 112, 1209–1221. doi: 10.1093/aob/mct205
Sharma, R., Sahoo, A., Devendran, R., and Jain, M. (2014). Over-expression of a rice tau class glutathione s-transferase gene improves tolerance to salinity and oxidative stresses in Arabidopsis. PLoS ONE 9:e92900. doi: 10.1371/journal.pone.0092900
Sheehan, D., Meade, G., Foley, V. M., and Dowd, C. A. (2001). Structure, function and evolution of glutathione transferases: implications for classification of non-mammalian members of an ancient enzyme superfamily. Biochem. J. 360, 1–16. doi: 10.1042/bj3600001
Skopelitou, K., Muleta, A. W., Pavli, O., Skaracis, G. N., Flemetakis, G. N., Papageorgiou, A. C., et al. (2012). Overlapping protective roles for glutathione transferase gene family members in chemical and oxidative stress response in Agrobacterium tumefaciens. Funct. Integr. Genomics 12, 157–172. doi: 10.1007/s10142-011-0248-x
Soranzo, N., Gorla, M. S., Mizzi, L., Toma, G. D., and Frova, C. (2004). Organisation and structural evolution of the rice glutathione S-transferase gene family. Mol. Genet. Genomics 271, 511–521. doi: 10.1007/s00438-004-1006-8
Tamura, K., Peterson, D., Peterson, N., Stecher, G., Nei, M., and Kumar, S. (2011). MEGA5: molecular evolutionary genetics analysis using maximum likelihood, evolutionary distance, and maximum parsimony methods. Mol. Biol. Evol. 28, 2731–2739. doi: 10.1093/molbev/msr121
Tanaka, K. M., Takahasi, K. R., and Takano-Shimizu, T. (2009). Enhanced fixation and preservation of a newly arisen duplicate gene by masking deleterious loss-of-function mutations. Genet. Res. (Camb) 91, 267–280. doi: 10.1017/S0016672309000196
Thom, R., Dixon, D. P., Edwards, R., Cole, D. J., and Lapthorn, A. J. (2001). The structure of a zeta class glutathione S-transferase from arabidopsis thaliana: characterisation of a gst with novel active-site architecture and a putative role in tyrosine catabolism. J. Mol. Biol. 308, 949–962. doi: 10.1006/jmbi.2001.4638
Urano, J., Nakagawa, T., Maki, Y., Masumura, T., Tanaka, K., Murata, N., et al. (2000). Molecular cloning and characterization of a rice dehydroascorbate reductase. FEBS Lett. 466, 107–111. doi: 10.1016/S0014-5793(99)01768-8
Wagner, U., Edwards, R., Dixon, D. P., and Mauch, F. (2002). Probing the diversity of the arabidopsis glutathione S-transferase gene family. Plant Mol. Biol. 49, 515–532. doi: 10.1023/A:1015557300450
Wang, K., Wang, Z., Li, F., Ye, W., Wang, J., Song, G., et al. (2012). The draft genome of a diploid cotton Gossypium raimondii. Nat. Genet. 44, 1098–1103. doi: 10.1038/ng.2371
Xu, G., Guo, C., Shan, H., and Kong, H. (2012). Divergence of duplicate genes in exon-intron structure. Proc. Natl. Acad. Sci. U.S.A. 109, 1187–1192. doi: 10.1073/pnas.1109047109
Yang, Q., Liu, Y. J., and Zeng, Q. Y. (2014). Biochemical functions of the glutathione transferase supergene family of Larix kaempferi. Plant Physiol. Biochem. 77, 99–107. doi: 10.1016/j.plaphy.2014.02.003
Yu, C. S., Lin, C. J., and Hwang, J. K. (2004). Predicting subcellular localization of proteins for Gram-negative bacteria by support vector machines based on n-peptide compositions. Protein Sci. 13, 1402–1406. doi: 10.1110/ps.03479604
Zhang, J. (2003). Evolution by gene duplication: an update. Trends Ecol. Evol. (Amst). 18, 292–298. doi: 10.1016/S0169-5347(03)00033-8
Zhao, Y., Cai, M., Zhang, X., Li, Y., Zhang, J., Zhang, H., et al. (2014). Genome-wide identification, evolution and expression analysis of mTERF gene family in maize. PLoS ONE 9:e94126. doi: 10.1371/journal.pone.0094126
Zhou, M. L., Yang, X. B., Zhang, Q., Zhou, M., Zhao, E. Z., Tang, Y. X., et al. (2013). Induction of annexin by heavy metals and jasmonic acid in Zea mays. Funct. Integr. Genomics 13, 241–251. doi: 10.1007/s10142-013-0316-5
Keywords: salt stress, cotton, phylogenetic analysis, gene family, GST
Citation: Dong Y, Li C, Zhang Y, He Q, Daud MK, Chen J and Zhu S (2016) Glutathione S-Transferase Gene Family in Gossypium raimondii and G. arboreum: Comparative Genomic Study and their Expression under Salt Stress. Front. Plant Sci. 7:139. doi: 10.3389/fpls.2016.00139
Received: 11 December 2015; Accepted: 27 January 2016;
Published: 12 February 2016.
Edited by:
Paula Casati, Centro de Estudios Fotosintéticos y Bioquímicos-CONICET, ArgentinaReviewed by:
Sebastian Pablo Rius, Centro de Estudios Fotosintéticos y Bioquímicos-CONICET, ArgentinaCaiguo Zhang, University of Colorado, Denver, USA
Copyright © 2016 Dong, Li, Zhang, He, Daud, Chen and Zhu. This is an open-access article distributed under the terms of the Creative Commons Attribution License (CC BY). The use, distribution or reproduction in other forums is permitted, provided the original author(s) or licensor are credited and that the original publication in this journal is cited, in accordance with accepted academic practice. No use, distribution or reproduction is permitted which does not comply with these terms.
*Correspondence: Jinhong Chen, jinhongchen@zju.edu.cn;
Shuijin Zhu, shjzhu@zju.edu.cn