 Ziwei Li1†
 Qi Xu2*†Ge Sun1,2Runqing Jia1
 Lin Yang1,2*Guoli Liu3
 Dongmei Hao1,2Song Zhang1,2Yimin Yang1,2Xuwen Li1,2
 Xinyu Zhang1,2
 Cuiting Lian1,2
- 1Faculty of Environment and Life Sciences, Beijing University of Technology, Beijing, China
- 2Intelligent Physiological Measurement and Clinical Translation, Beijing International Base for Scientific and Technological Cooperation, Beijing, China
- 3Department of Obstetrics, Peking University People’s Hospital, Beijing, China
Pre-eclampsia (PE) is a type of hypertensive disorder during pregnancy, which is a serious threat to the life of mother and fetus. It is a placenta-derived disease that results in placental damage and necrosis due to systemic small vessel spasms that cause pathological changes such as ischemia and hypoxia and oxidative stress, which leads to fetal and maternal damage. In this study, four types of risk factors, namely, clinical epidemiology, hemodynamics, basic biochemistry, and biomarkers, were used for the initial selection of model parameters related to PE, and factors that were easily available and clinically recognized as being associated with a higher risk of PE were selected based on hospital medical record data. The model parameters were then further analyzed and screened in two subgroups: early-onset pre-eclampsia (EOPE) and late-onset pre-eclampsia (LOPE). Dynamic gestational week prediction model for PE using decision tree ID3 algorithm in machine learning. Performance of the model was: macro average (precision = 76%, recall = 73%, F1-score = 75%), weighted average (precision = 88%, recall = 89%, F1-score = 89%) and overall accuracy is 86%. In this study, the addition of the dynamic timeline parameter “gestational week” made the model more convenient for clinical application and achieved effective PE subgroup prediction.
1 Introduction
Hypertensive disorders in pregnancy (HDP) are conditions in which pregnancy and hypertension coexist, with a prevalence of approximately 5%–12% (Mahendra et al., 2021). The pathogenesis of HDP is complex and multifactorial, and although some research has been done, its etiology is still unclear and no effective predictive method has been established. HDP is a multi-causal disease whose pathogenesis is related to impaired placental angiogenesis, placental oxidative stress and abnormal maternal immune response. It is not only hypertension and proteinuria, but especially with the involvement of the heart, lungs, liver and kidneys, the blood, digestive and nervous systems, but also the placenta and the fetus. The disease includes five subtypes: hypertension in pregnancy, PE, eclampsia, chronic hypertension complicated by pre-eclampsia and chronic hypertension in pregnancy (Duhig et al., 2019). PE is one of the more severe of the above sub-types in its pathogenesis. Patients with suspected preeclampsia are diagnosed when any of the following points are met: new onset of hypertension or exacerbation of preexisting hypertension, positive urine test for urine protein, epigastric or right upper abdominal pain, headache with visual disturbance, fetal growth restriction or abnormal maternal blood tests (e.g., thrombocytopenia or liver and kidney dysfunction) (Li et al., 2021). The clinical management of preeclampsia is a complex task for the following reasons: (A) Complex pathogenic background: preeclampsia is a multifactorial-multi-mechanism-multi-pathway pathogenic syndrome. (B) Complex symptom presentation: The degree and presentation of hypertensive symptoms in preeclamptic patients are complex, and the first symptoms are diverse. In traditional medical diagnosis, physicians can only rely on the information of the target patient as well as their own experience and knowledge base to make judgments, which has some limitations. The machine learning approach, however, can better assist in diagnosis. Termination of pregnancy before 34 weeks of gestation due to pre-eclampsia is de-fined as EOPE, and termination at ≥34 weeks of gestation is defined as LOPE (Raymond and Peterson, 2011). Risk factors associated with PE can be divided into various aspects such as clinical epidemiology, hemodynamics, underlying biochemical factors, and biomarkers in pregnant women. If the high-risk risk factors in the development of PE are clarified and a com-prehensive multifactorial dynamic study is performed, the impact and significance of preeclampsia prediction and prevention are very important.
Tan et al. (2020) established a prediction model for severe maternal outcomes in pregnant women with PE by using a multivariable logistic regression model. The model has a good predictive ability by internal validation. Further external validation is required to clarify the clinical applicability of this model. Beth et al. (2014) developed the miniPIERS risk prediction model to provide a simple, evidence-based tool to identify pregnant women in LMICs at increased risk of death or major hypertensive-related complications. The miniPIERS model shows reasonable ability to identify women at increased risk of adverse maternal outcomes associated with the HDP. Saleh et al. (2021) propose a simple clinical prediction model with good discriminative performance to predict the risk of a composite outcome of PE-related maternal and fetal complications within 7, 14, and 30 days of testing in women with suspected or confirmed PE. The clinical pre-diction models with good identification performance can be used to predict PE-related complications. Ziad et al. (2020) using births from 2011 to 2012, multivariable logistic regression incorporated established maternal risk factors to develop and internally vali-date the WS (Western Sydney) model. The WS model was then externally validated using births from 2013 to 2014, assessing its discrimination and calibration. The model achieved modest performance for prediction of PE in nulliparous women but did not outperform the NICE approach.
Placental growth factor (PlGF), a member of the vascular endothelial growth fac-tor family, is a pro-angiogenic factor serum marker with important functions in regulating placental trophoblast and endothelial cell function (Duhig et al., 2020). PlGF levels are usually measured at the first antenatal visit, 11–13 weeks of gestation, 19–24 weeks of gestation, and 30–34 weeks of gestation as a way to assess the risk of developing preeclampsia. However, the pathogenesis of preeclampsia has not been elucidated, and there is a lack of effective clinical means to prevent it. Its multifactorial predisposition, multiple pathways of pathogenesis and individual differences all determine that a single index is not a good predictor of preeclampsia. Researchers have also combined maternal characteristics and the biomarker PlGF to make relevant predictions. Knudsen et al. (2012) demonstrated the potential of the biomarker PlGF as an aid in the diagnosis of PE: the highest clinical sensitivity was calculated using a threshold value based on the fifth percentile of PlGF concentrations in reference pregnancies within a defined gestational week, and the single biomarker PlGF had the same diagnostic performance compared to the ratio of the two biomarkers, simplifying the test results and reducing costs, with some economic benefits. Black et al. (2020) used the Fetal Medicine Foundation algorithm to combine Maternal own condition, mean arterial pressure, mean uterine artery pulsatility index, and median multiples of PlGF parameters for combined screening of mid-pregnancy PE. Stepan et al. (2020) combined information from ultrasound, mean arterial pressure, clinical features and PlGF to improve the prediction of PE in early pregnancy. Poon et al. (2009) used a logistic regression analysis algorithm combining mean arterial pressure, uterine artery pulsatility index, PAPP-A and PlGF for the prediction of preeclampsia and its subtypes. Mendoza et al. (2021) Combined screening for PE and its subtypes in early pregnancy with physical indicators and biomarkers. Sufriyana et al. (2020) predicted PE by maternal characteristics, uterine motility Doppler measurements, sFlt-1 and PlGF in mid and late pregnancy. sFlt-1 and PlGF in mid- and late-trimester, using machine learning-related algorithms to predict PE.
The aim of this study was to develop and validate a model for predicting the risk of PE for uncomplicated pregnancies. The model can be used at prenatal visits at different gestational weeks to predict whether a pregnant woman is likely to have PE and if so whether she has EOPE or LOPE.
2 Materials and methods
The study data were obtained from clinical epidemiological data, hemodynamic data, data on underlying biochemical data, and biomarker data. Radial artery and fingertip volumetric pulse waveform information collected from 2015 to 2016 at Beijing Haidian District Maternal and Child Health Hospital and from 2006 to 2008 at Beijing Maternity Hospital for detecting gestational weeks of 10–40 weeks. The clinical epidemiological data, hemodynamic data, data on underlying biochemical data, and biomarker data, and PlGF parameter information were collected from July 2015 to 2017 at Peking University People’s Hospital for the detection of gestational weeks 10–40 weeks. And PlGF testing was mainly focused on about 15–26 weeks. The study subjects were included in the following conditions: pregnant women were not on long-term oral medication; The fetus was free of malformations.
The study population was 80 pregnant women with EOPE (96 tests), 219 pregnant women with LOPE (371 tests) and 633 pregnant women without HDP (1,351 tests). Pregnant women with EOPE were included in the EOPE group, those with LOPE in the LOPE group, and those without HDP in the control group.
2.1 Model parameter filtering
Risk factors for PE mainly include clinical epidemiological factors, hemodynamic factors, basic biochemical factors and biomarker factors. In order to analyze the correlation dynamics of each model parameter before the construction of the dynamic gestation prediction model of PE, and according to whether the factors themselves change with the gestational age, the risk factors initially screened out are divided into static parameters that do not change with the gestational age and dynamic parameters that change with the gestational age. This is shown in Table 1.
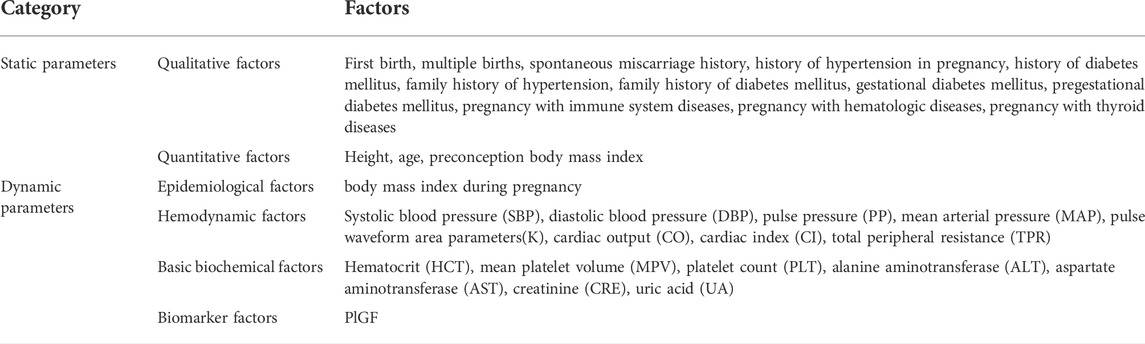
TABLE 1. Classification of PE risk factors.
The characteristic parameters of pulse wave were obtained by detecting the pulse wave of radial artery. Radial artery pulse wave detection at the Beijing Obstetrics and Gynecology Hospital was obtained by MP HDP detection instrument developed by Beijing Yes Medical Devices Co., Ltd. The eight-channel PowerLab data acquisition system, LabChart 8 software and strain gauge pressure sensor were used to collect radial artery pulse wave at the Beijing Haidian Maternal and Child Health Hospital. Biochemical parameters were obtained by blood routine examination and biochemical examination. SPSS 23.0 software was used for statistical basic analysis and decision tree was used to construct the predictive model of PE in Jupyter Notebook.
2.1.1 Static parameter filtering
For the screening of static parameters that do not change with the gestational age, the basic information statistics of qualitative and quantitative parameters are used. In order to describe the difference between the parameters in the EOPE group and the LOPE group and the same control group. A chi-square test was performed on 12 qualitative factors. Odds ratio (OR) > 1, indicating that the risk of this factor associated with PE was high, and p < 0.05 was statistically significant. While the independent sample t test for three quantitative factors was expressed as mean ± standard deviation, and p < 0.05 was statistically significant. The specific analysis of static parameters of pregnant women in the EOPE group, LOPE group and the same control group that do not change with gestational age is shown in Tables 2, 3.

TABLE 2. Analysis of factors that do not change with gestational age in EOPE subgroup and control.
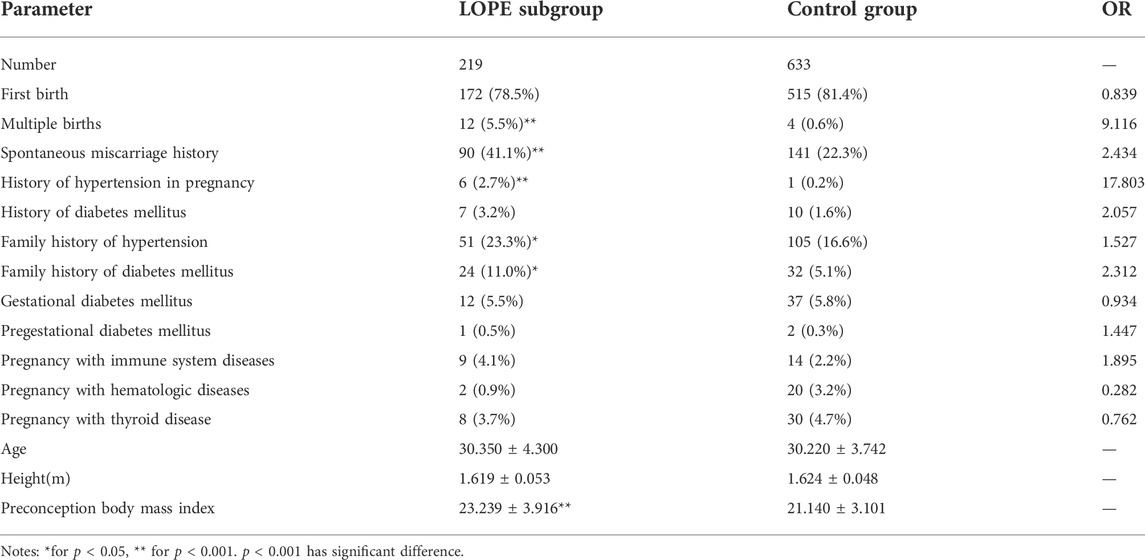
TABLE 3. Analysis of factors that do not change with gestational age in LOPE subgroup and control group.
The static parameters of 80 cases of EOPE group and 633 control groups that did not change with gestational age were as follows: multiple pregnancies, history of spontaneous abortion, and history of hypertensive disease during pregnancy were qualitative parameters, and the proportion of all in the EOPE subgroup was higher than that of the control group, OR>1 and p < 0.05, indicating that these factors were high-risk and statistically significant; preconception body mass index was a quantitative parameter, which was significantly higher than that of the control group in the EOPE subgroup, and p < 0.001 was statistically significant, as shown in Table 2. Multiple pregnancies, a history of spontaneous miscarriage, a history of hypertensive disorders during pregnancy, and a history of preconception body mass index as static parameters in the EOPE subgroup are consistent with clinical needs and previous studies.
Static parameter analysis of 219 patients in the LOPE group and 633 control groups that did not change with gestational age: multiple pregnancies, natural abortion history, gestational hypertension disease history, hypertension family history, and diabetes family history, the proportion of the LOPE group was higher than that of the control group. OR >1 and p < 0.05 indicated that the risk of factors was high and statistically significant; preconception BMI was a quantitative parameter, which was significantly higher than that of the control group in the LOPE group, and p < 0.001 was statistically significant, as shown in Table 3. The inclusion of multiple pregnancies, history of spontaneous abortion, history of hypertensive disease during pregnancy, family history of hypertension, family history of diabetes and preconception body mass index as static parameters of the LOPE subgroup has certain significance from the perspective of clinical and related research (Knudsen et al., 2012; Black et al., 2020; Duhig et al., 2020).
2.1.2 Dynamic parameter filtering
For the screening of dynamic parameters that change with gestational age, the control variable analysis is mainly carried out. This study mainly constructs a dynamic gestational age prediction model, and the selection of dynamic parameters that change with gestational age takes into account the improvement of the dynamic model effect, etc., and the clinical epidemiological factors that change with gestational age mentioned in Table 1 above: gestational body mass index and one of the effective biomarkers (PlGF) These two dynamic parameters, which are relatively small in this study, are directly included in the model, and are also consistent with clinical needs and previous studies (Rantakallio et al., 2021). The purpose of combining hemodynamic factors is that hemodynamic alterations are important factors in the development and progression of preeclampsia in patients with preeclampsia due to various pathophysiological alterations resulting in blood concentration, decreased blood volume, and increased peripheral resistance. Blood pressure is the combined result of the interaction of hemodynamic parameters. SBP and DBP are obtained from clinical history data, and PP indicates that pulse pressure difference is related to both SBP and DBP. MAP is the mean value of arterial blood pressure during a cardiac cycle, CI mainly reflects cardiac function-related conditions, CO is a very important blood flow parameter to assess cardiovascular function, and TPR can measure small vessel spasm.
For a total of 15 parameters of hemodynamic factor(H) and basal biochemical factor(B) in Table 1 that change with gestational age, the control variables were analyzed in two groups, that is, the probability of parameter combination was calculated by logistic regression to control the parameters of other classes within a fixed range, and the two types of parameters were then independently sampled t-tested and outliers analyzed at different gestational stages.
Finally, the parameters for inclusion in the prediction model of each dynamic subgroup were finally determined based on the actual needs of clinical and related studies. Finally, the parameters for inclusion in the prediction model of each dynamic subgroup were finally determined based on the actual needs of clinical and related studies. From the perspective of clinical and related research, further group analysis of gestational segments was carried out at 20 weeks and 34 weeks in the first and third trimesters of each group, namely the second-trimester-E group (ST-EG) and the second-trimester-L group (ST-LG), as well as the late-trimester-E group (LT-EG) and the late-trimester-L group (LT-LG) (Meah et al., 2016). If there are multiple tests in the group, the data of the later and earlier detection of the second and late trimesters of pregnancy are taken respectively to focus on the changes in the parameters of the second half of the late trimester and the first half of the late trimester affect whether the final pregnant woman is ill. The sensitivity analysis of the EOEP subgroup and the LOPE subgroup for the H and B parameters of each gestational segment is shown in Tables 4, 5, and the values of each parameter represent the mean of the t test of the independent samples.
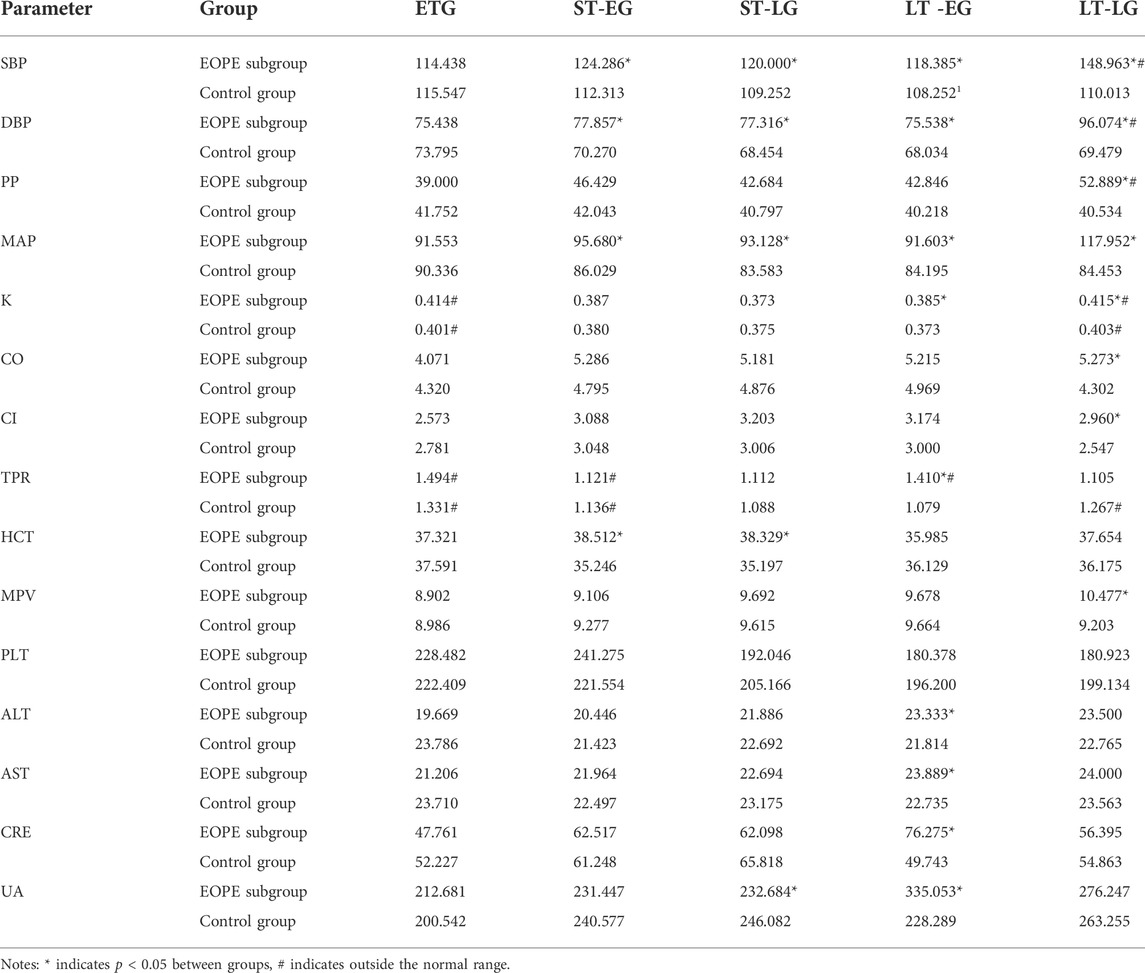
TABLE 4. Sensitivity analysis of H and B parameters in EOPE subgroup and control group.
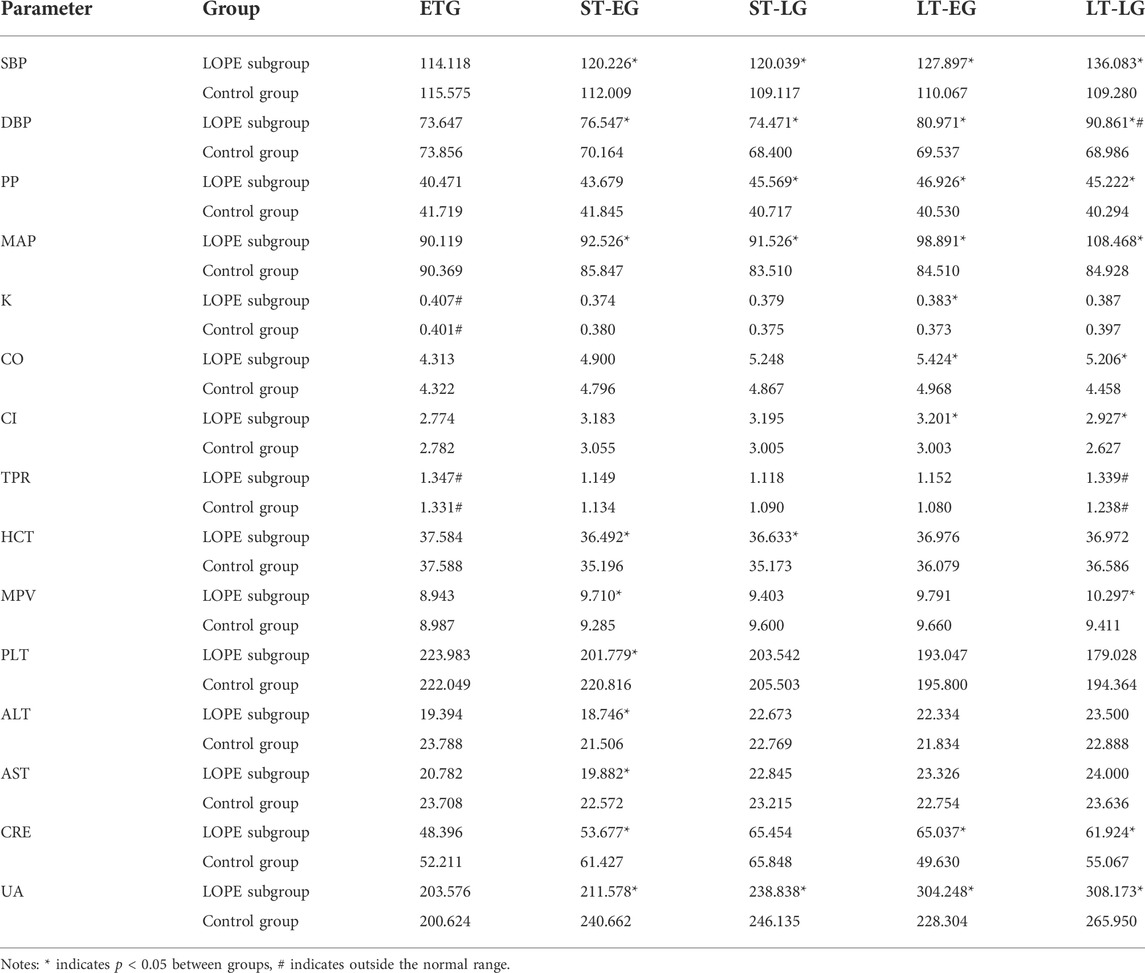
TABLE 5. Sensitivity analysis of H and B parameters in LOPE subgroup and control group.
The results in Tables 4, 5 showed that the H and B parameters of each gestational segment met the conditions of sensitive parameters in the LOPE subgroup, that is, the prediction of disease outcomes was more sensitive, and the platelet count of the EOPE subgroup did not meet the sensitive parameter conditions, possibly because the amount of data in the EOPE subgroup was relatively small and did not reflect significant differences or abnormalities. However, the two are themselves dynamic parameters.
In this study, the H and B parameters are put into the prediction model of each dynamic subgroup. In addition to the model parameters summarized above, the gestational age as a timeline parameter is also directly incorporated into the prediction model to form a dynamic model. Conditions met for sensitive parameters: independent samples t-test for parameters, that is, p < 0.05 between groups in the disease and control groups or parameters outside the range of normal values.
2.1.3 Final parameters
Through the filtering of dynamic and static parameters, the parameters identified for inclusion in this study are shown in Table 6.
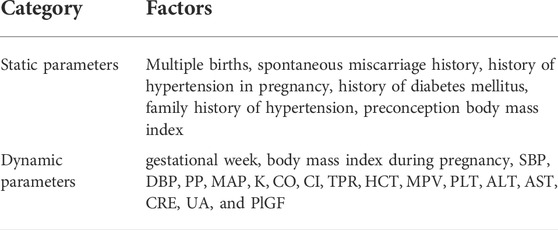
TABLE 6. Parameters eventually incorporated into the model.
2.2 Machine learning model
The study used an algorithm from decision trees called the Iterative Dichotomiser (ID3) algorithm (Quilan, 1986). The algorithm is a classification prediction algorithm proposed by J. Ross Quinlan at the University of Sydney in 1975. The ID3 algorithm calculates the information gain of each label by selecting the attribute with the highest information gain as the classification criterion for each division, and repeats the process until a perfect decision tree can be generated.
Information entropy is a metric to measure the purity of a sample set. Suppose that the proportion of the class
Assuming that the discrete attribute
The process of the algorithm is as follows:
1) Classification training starts from the root node, calculates the information gain of all possible features, and selects the feature with the largest information gain as the partition feature of the node;
2) Child nodes are established from different values for the feature;
3) Recursive step 1 to step 2 of the child nodes to construct the decision tree;
4) A final decision tree is obtained until no features can be selected or the categories are identical.
3 Results
The dataset is shown in Table 7. Using 70%/30% random training/test data splitting, repeat this process 20 times and achieve average performance. The model should classify and predict EOPE, LOPE and healthy people.
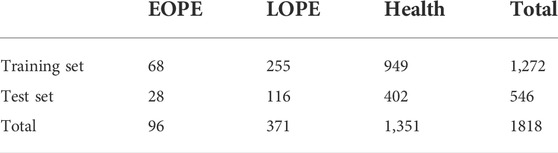
TABLE 7. The dataset of the model.
Precision, recall, and F1-score are used as evaluation indicators for this model. For evaluating performance average across categories, there are two conventional methods, namely macro average and weighted average. Macro averaged performance scores are computed by first computing the scores for the per-category contingency tables and then averaging these per-category scores to compute the global means (Yang et al., 1999). When there is a serious class imbalance in the dataset, the weighted average can be adopted. The performance of the model is shown in Table 8, Overall accuracy of the model is 86%.
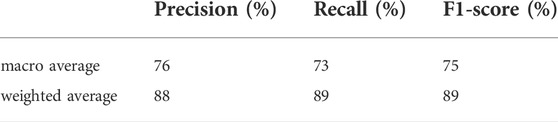
TABLE 8. The performance of the model.
4 Discussion
This study describes the importance of predicting PE, and analyzes the status of existing relevant studies comparing risk factors and prediction methods for PE and other deficiencies, thus illustrating the need and importance of this study. This study is mainly based on retrospective analysis and screening of factors that are effective for the risk of developing EOPE as well as LOPE by combining four categories of factors: clinical epidemiological factors, hemodynamic factors, basic biochemical factors and biomarkers. Based on the model parameters obtained from the screening of each subgroup, the decision tree (ID3) algorithm was used to develop dynamic gestational week prediction models for two types of subgroups, EOPE and LOPE, respectively. The core idea of the ID3 algorithm is to measure the selection of attributes in terms of information gain and select the attribute with the greatest information gain after splitting for splitting. The algorithm uses a top-down search to traverse the space of possible decisions. In other words, before dividing each non-leaf node of the decision tree, the information gain of each risk factor incorporated into the model is calculated, and then the risk factor with the greatest information gain is selected for division, because the greater the information gain, the more representative the risk factor is, and the stronger the algorithm’s ability to identify early-onset pre-eclampsia. The model structure was optimized and simplified to enhance the clinical applicability of the model in order to achieve detailed and effective prediction using a simpler dynamic periconceptional subgroup model.
There are still many ways to predict PE Carhillon et al. (2005). Showed that measuring umbilical artery flow parameters such as peak systolic velocity/end diastolic (S/D), beat index, and resistance index can predict the occurrence of PE. In urine, there are studies on the use of urine proteomics for the diagnosis and screening of PE (Carty et al., 2011). Proteomic analysis of the cerebrospinal fluid can accurately determine the severity of PE (Norwitz et al., 2011). sFlt-1 is an anti-angiogenic factor serum marker that downregulates and inhibits the bioactivity of PIGF in promoting placental vascular growth. sFlt-1/PlGF ratio is a good predictive value and diagnostic guide for PE when measured jointly by Bian et al. (2019). However, single prediction is one-sided and unstable, Cnossen et al. (2008) performed a separate study of uterine artery Doppler and the results were low for PE-related subtypes The predictive value of PE-related subtypes was low.
In this study, a multifactorial PE subgroup analysis was performed by combining four categories of clinical epidemiological factors, hemodynamic factors, basal biochemical factors and biomarkers, reclassified according to whether they varied with gestational week. Among them, the biomarker PlGF was tested and compared and had a more significant predictive role and value for the EOPE subgroup. The biomarker is an important dynamic parameter, and the current testing gestational weeks of PlGF in this subject are mainly distributed in 15–26 weeks, with less data on testing samples in the rest of the gestational weeks. In order to improve the quality and effectiveness of the full gestational week data model, the clinical data of full gestational week testing of the biomarker PlGF need to be supplemented in the future. The data in this study are based on retrospective analysis and have limitations such as the type of data. To achieve reliable prediction and enhance clinical application, prospective and multicenter studies are needed to demonstrate the clinical utility of predictive parameters.
5 Conclusion
In this study, a multifactorial approach was used for the prediction of dynamic PE-related subgroups, and the model was further refined and incorporated the dynamic timeline parameter “gestational week” for overall dynamic gestational week prediction. It is simpler and more convenient for clinical application, and the model parameters and structure are optimized to achieve effective PE subgroup prediction. This study’s model and method for the prediction of PE integrated dynamic gestational week subgroups is of great significance in giving targeted clinical predictions and recommendations for improving maternal and infant conditions.
Data availability statement
The original contributions presented in the study are included in the article/supplementary material, further inquiries can be directed to the corresponding author.
Ethics statement
The studies involving human participants were reviewed and approved by Ethics Committee of Beijing University of Technology. The patients/participants provided their written informed consent to participate in this study. Written informed consent was obtained from the individual(s) for the publication of any potentially identifiable images or data included in this article.
Author contributions
Conceptualization, LY, GS, and QX; methodology, ZL and GS; software, ZL; validation, RJ, YY, and XL; formal analysis, QX; investigation, XZ and CL; resources, GL; data cura-tion, GS and QX; writing—original draft preparation, ZL; writing—review and editing, LY; supervision, LY, RJ, and GL; project administration, DH and SZ; funding acquisition, DH and SZ. All authors have read and agreed to the published version of the manuscript.
Funding
This research was funded by the National Key R&D Program of China (2019YFC0119700), National Natural Science Foundation of China (U20A201163).
Conflict of interest
The authors declare that the research was conducted in the absence of any commercial or financial relationships that could be construed as a potential conflict of interest.
Publisher’s note
All claims expressed in this article are solely those of the authors and do not necessarily represent those of their affiliated organizations, or those of the publisher, the editors and the reviewers. Any product that may be evaluated in this article, or claim that may be made by its manufacturer, is not guaranteed or endorsed by the publisher.
References
Beth A., Jennifer A., Ansermino J. M., Hall D. R., Bhutta Z. A., Bhutta S. Z., et al. (2014). A risk prediction model for the assessment and triage of women with hypertensive disorders of pregnancy in low-resourced settings: The miniPIERS (Pre-eclampsia integrated estimate of RiSk) multi-country prospective cohort study. PLoS Med. 11, 10015899–e1001613. doi:10.1371/journal.pmed.1001589
Bian X., Biswas A., Huang X., Lee K. J., Li T. K. T., Masuyama H., et al. (2019). Short-term prediction of adverse outcomes using the sFlt-1 (soluble fms-like tyrosine kinase 1)/PlGF (placental growth factor) ratio in asian women with suspected preeclampsia. Hypertension 74, 164–172. doi:10.1161/HYPERTENSIONAHA.119.12760
Black C., Rolnik D., Al-Amin A., Kane S. C., Stolarek C., White A., et al. (2020). Prediction of preterm pre-eclampsia at midpregnancy using a multivariable screening algorithm. Aust. N. Z. J. Obstet. Gynaecol. 60, 675–682. doi:10.1111/ajo.13113
Carhillon L., Ziol M., Challier J. C., Perrot N., Uzan M., Prevot S., et al. (2005). Doppler and immunohistochemical evaluation of decidual spiral arteries in early pregnancy. Gynecol. Obstet. Invest. 59, 24–28. doi:10.1159/000080671
Carty D., Siwy J., Brennand J., Zurbig P., Mullen W., Franke J., et al. (2011). Urinary proteomics for prediction of preeclampsia. Hypertension 57, 561–569. doi:10.1161/HYPERTENSIONAHA.110.164285
Cnossen J., Morris R., Ter G., Mol B. W. J., van der Post J. A. M., Coomarasamy A., et al. (2008). Use of uterine artery Doppler ultrasonography to predict preeclampsia and intrauterine growth restriction: A systematic review and bivariable meta-analysis. Can. Med. Assoc. J. 178, 701–711. doi:10.1503/cmaj.070430
Duhig K., Webster L., Sharp A., Gill C., Seed P. T., Shennan A. H., et al. (2020). Diagnostic accuracy of repeat placental growth factor measurements in women with suspected preeclampsia: A case series study. Acta Obstet. Gynecol. Scand. 99, 994–1002. doi:10.1111/aogs.13818
Duhig K. E., Myers J., Seed P. T., Sparkes J., Lowe J., Hunter R. M., et al. (2019). Placental growth factor testing to assess women with suspected pre-eclampsia: A multicentre, pragmatic, stepped-wedge cluster-randomised controlledtrial. Lancet 393, 1807–1818. doi:10.1016/S0140-6736(18)33212-4
Knudsen U., Kronborg C., von Dadelszen P., Kupfer K., Lee S. W., Vittinghus E., et al. (2012). A single rapid point-of-care placental growth factor determination as an aid in the diagnosis of preeclampsia. Pregnancy Hypertens. 2, 8–15. doi:10.1016/j.preghy.2011.08.117
Li F., Qin J., Zhang S., Chen L. (2021). Prevalence of hypertensive disorders in pregnancy in China: A systematic review and meta-analysis. Pregnancy Hypertens. 24, 13–21. doi:10.1016/j.preghy.2021.02.001
Mahendra V., Clark S., Suresh M. S. (2021). Neuropathophysiology of preeclampsia and eclampsia: A review of cerebral hemodynamic principles in hypertensive disorders of pregnancy. Pregnancy Hypertens. 23, 104–111. doi:10.1016/j.preghy.2020.10.013
Meah L., Cockcroft J., Backx K., Shave R., Stohr E. J. (2016). Cardiac output and related haemodynamics during pregnancy: A series of meta-analyses. Heart 102, 518–526. doi:10.1136/heartjnl-2015-308476
Mendoza M., Garcia-Manau P., Arevalo S., Aviles M., Serrano B., Sanchez-Duran M. A., et al. (2021). Diagnostic accuracy of first-trimester combined screening for early-onset and preterm pre-eclampsia at 8-10 compared with 11-13 weeks' gestation. Ultrasound Obstet. Gynecol. 57, 84–90. doi:10.1002/uog.22071
Norwitz E., Tsen L., Park J., Fitzpatrick P. A., Dorfman D. M., Saade G. R., et al. (2011). Discriminatory proteomic biomarker analysis identifies free hemoglobin in the cerebrospinal fluid of women with severe preeclampsia. Am. J. Obstet. Gynecol. 193, 957–964. doi:10.1016/j.ajog.2005.06.055
Poon L., Kametas N., Maiz N., Akolekar R., Nicolaides K. H. (2009). First-trimester prediction of hypertensive disorders in pregnancy. Hypertension 53, 812–818. doi:10.1161/HYPERTENSIONAHA.108.127977
Rantakallio J., Nevalainen J., West S. I., Ollila M. M., Puukka K., Bloigu A. H., et al. (2021). Association of self-reported polycystic ovary syndrome, obesity, and weight gain from adolescence to adulthood with hypertensive disorders of pregnancy: A community-based approach. Hypertension 77, 1010–1019. doi:10.1161/HYPERTENSIONAHA.120.15702
Raymond D., Peterson E. (2011). A critical review of early-onset and late-onset preeclampsia. Obstet. Gynecol. Surv. 66, 497–506. doi:10.1097/OGX.0b013e3182331028
Saleh L., Alblas M. M., Nieboer D., Neuman R. I., Vergouwe Y., Brusse I. A., et al. (2021). Prediction of pre-eclampsia-related complications in women with suspected or confirmed pre-eclampsia: Development and internal validation of clinical prediction model. Ultrasound Obstet. Gynecol. 58, 698–704. doi:10.1002/uog.23142
Stepan H., Hund M., Andraczek T. (2020). Combining biomarkers to predict pregnancy complications and redefine preeclampsia the angiogenic-placental syndrome. Hypertension 75, 918–926. doi:10.1161/HYPERTENSIONAHA.119.13763
Sufriyana H., Wu Y., Su E. (2020). Prediction of preeclampsia and intrauterine growth restriction: Development of machine learning models on a prospective cohort. JMIR Med. Inf. 8, 15411. doi:10.2196/15411
Tan J., Yang M., Liao Y., Qi Y., Ren Y., Liu C., et al. (2020). Development and validation of a prediction model on severe maternal, outcomes among pregnant women with pre-eclampsia: A 10-year cohort study. Sci. Rep. 10, 15590. doi:10.1038/s41598-020-72527-0
Yang Y., Fischer P., Leu S. J., Zhu M., Woods V. L., Chen P. P. (1999). Possible presence of enhancing antibodies in idiopathic thrombocytopenic purpura. Br. J. Haematol. 1, 69–80. doi:10.1046/j.1365-2141.1999.01144.x
Keywords: hypertensive disorders of pregnancy, pre-eclampsia, decision tree, prediction model, dynamic
Citation: Li Z, Xu Q, Sun G, Jia R, Yang L, Liu G, Hao D, Zhang S, Yang Y, Li X, Zhang X and Lian C (2022) Dynamic gestational week prediction model for pre-eclampsia based on ID3 algorithm. Front. Physiol. 13:1035726. doi: 10.3389/fphys.2022.1035726
Received: 03 September 2022; Accepted: 10 October 2022;
Published: 26 October 2022.
Edited by:
Lisheng Xu, Northeastern University, ChinaReviewed by:
Shan Chang, Jiangsu University of Technology, ChinaLi Yang, Beijing Chaoyang District Maternal and Child Healthcare Hospital, China
Copyright © 2022 Li, Xu, Sun, Jia, Yang, Liu, Hao, Zhang, Yang, Li, Zhang and Lian. This is an open-access article distributed under the terms of the Creative Commons Attribution License (CC BY). The use, distribution or reproduction in other forums is permitted, provided the original author(s) and the copyright owner(s) are credited and that the original publication in this journal is cited, in accordance with accepted academic practice. No use, distribution or reproduction is permitted which does not comply with these terms.
*Correspondence: Qi Xu, xuqi_0612@163.com; Lin Yang, yanglin@bjut.edu.cn
†These authors have contributed equally to this work and share first authorship