 Ying Qi
 Peiying Liu2
 Xiaoming Wang
- 1Department of Radiology, Shengjing Hospital of China Medical University, Shenyang, China
- 2Department of Radiology, Johns Hopkins University School of Medicine, Baltimore, MD, United States
The brain's hemodynamic and metabolism of punctate white matter lesions (PWML) is poorly understood due to a scarcity of non-invasive imaging techniques. The aim of this study was to apply new MRI techniques to quantify cerebral metabolic rate of oxygen (CMRO2), global cerebral blood flow (CBF), oxygen saturation fractions in venous blood (Yv) and oxygen extraction fraction (OEF) in neonates with PWML, for better understanding of the pathophysiology of PWML. Fifty-one newborns were recruited continuously, including 23 neonatal patients with PWML and 28 normal control neonates. Phase-contrast (PC) MRI and T2-Relaxation-Under-Spin-Tagging (TRUST) MRI were performed for the measurement of CBF and Yv. OEF and CMRO2 were calculated from the CBF and Yv values. The total maturation score (TMS) was assessed for each neonate on standard T1, 2-weighted images to evaluate cerebral maturation. The CMRO2, CBF, Yv, and OEF values were compared between groups, and their associations with age and TMS were evaluated. Significant differences between PWML group and control group were found in CMRO2 (P = 0.020), CBF (P = 0.027), Yv (P = 0.012), OEF (P = 0.018). After age/maturation is accounted for, Yv and OEF showed significant dependence on the groups (P < 0.05). Newborns with PWML had lower OEF and higher Yv. CMRO2, CBF and brain volume were correlated with age (P < 0.001) and TMS (P < 0.05). It is feasible to use non-invasive MRI methods to measure cerebral oxygen supply and consumption in neonates with PWML. Newborns with PWML have lower oxygen consumption. Yv and OEF may be helpful for the diagnosis of PWML. The positive correlation between CBF and TMS, and between CMRO2 and TMS suggested that as myelination progresses, the blood supply and oxygen metabolism in the brain increase to meet the escalating energy demand.
Introduction
Punctate white matter lesions (PWML) are frequently recognized on magnetic resonance imaging (MRI) in unmyelinated white matter as hyperintensity on T1-weighted images with or without hypointensity on T2-weighted images (Niwa et al., 2011). The incidence of PWML in preterm newborns with low and extremely low birth weight is 50% (Volpe, 2003). Among survivors, 5–10% exhibit cerebral palsy and 50% have deficits in cognition, behaviors or attention (Wilson-Costello et al., 2007). Several studies have raised the hypothesis that PWML may be related to the milder forms of cognitive and behavioral problems found at school age (Miller et al., 2005; Sie et al., 2005), but little is known about the brain function in PWML neonates. Quantitative evaluation of brain hemodynamics and cerebral oxygen metabolism may provide important functional information for the understanding of neonatal PWML.
Cerebral blood flow (CBF) as a measure of brain perfusion, is an important indicator of brain function. Currently there are several techniques used to measure CBF, including computed tomography (CT) perfusion (Dani et al., 2012), positron emission computed tomography (PET) (Altman et al., 1993; Wright et al., 2016), vascular ultrasound (Burgess et al., 2018), 133xenon clearance (Colditz et al., 1988) and MRI (Wang and Licht, 2006; Dai et al., 2008). CT, PET, and 133xenon clearance need contrast agents or tracers, which usually are radioactive and therefore are not typically used in newborns. Vascular ultrasound can be used to measure blood flow in internal carotid arteries (ICA), but is difficult to assess vertebral arteries (VA), which are also feeding arteries to the brain, due to the blockage by bones. In MRI techniques, arterial spin labeling (ASL) (Massaro et al., 2013; Boudes et al., 2014; De Vis et al., 2014; Ouyang et al., 2017) and phase-contrast (PC) MRI (van Kooij et al., 2010; Benders et al., 2011; Varela et al., 2012; Jain et al., 2014; Liu et al., 2014) are two techniques that measure CBF without exogenous contrast agent and have been utilized in newborns. However, in neonates, ASL technique suffers from low signal-to-noise ratio and sensitivity to bolus arrival time (Massaro et al., 2013; Boudes et al., 2014), and requires further technical improvement. On the other hand, PC MRI is a promising technique that provides accurate measurement of global CBF and has been successfully used in health newborns recently to measure CBF (van Kooij et al., 2010; Benders et al., 2011; Varela et al., 2012; Jain et al., 2014; Liu et al., 2014).
Cerebral metabolic rate of oxygen (CMRO2), a measurement of cerebral energy consumption, is also an important physiological marker of brain function. It can be evaluated by several methods, including O-15 PET (Herscovitch et al., 1985; Altman et al., 1993; Ibaraki et al., 2008; Bremmer et al., 2011), near infrared spectroscopy (NIRS) (Skov et al., 1993; Elwell et al., 2005; Kusaka et al., 2014), calibrated functional MRI (fMRI) based techniques (Bulte et al., 2012; Gauthier and Hoge, 2012; Wise et al., 2013) and venous oxygenation-based techniques (Golay et al., 2001; Bolar et al., 2011; Qin et al., 2011; Guo and Wong, 2012; Xu et al., 2012; Liu et al., 2013). O-15 PET is rarely used in neonates due to radiation concern. NIRS requires the assumptions of the arteriovenous volume ratio and is difficult to determine the light penetration depth. Thus, although quick and bedside-accessible, NIRS measurements of CMRO2 are more limited to superficial brain tissues compared with deep brain tissues. For calibrated fMRI based methods, the long scanning time and the need to inhale special gas mixtures make it difficult for applications in newborns. In recent years, a few venous oxygenation-based MRI techniques have been proposed to measure CMRO2 in neonates (De Vis et al., 2014; Jain et al., 2014; Liu et al., 2014). T2-Relaxation-Under-Spin-Tagging (TRUST) MRI is one of the MRI techniques that measures venous oxygenation non-invasively (Lu and Ge, 2008; Xu et al., 2012) and has been validated in adults (Lu et al., 2012).
In this study, we will use the PC and TRUST MRI techniques to measure CBF, Yv, OEF and CMRO2 in neonatal patients with PWML, for the understanding of the perinatal pathophysiology of PWML. We will also assess the cerebral maturation of these neonates and evaluate its relationship with the hemodynamic parameters measured by MRI.
Materials and Methods
Subjects
The study was approved by the Medical Ethics Committee of Shengjing Hospital of China Medical University and was granted a waiver of informed consent. A total of 51 neonates underwent MRI in Shengjing Hospital were included in this study between December 2015 and April 2016. Neonates who met the following criteria were excluded: severe hypoxia (1/5-min Apgar score <3); prenatal infection; hypoglycemia (blood glucose <60 mg/dl); encephalitis; cerebral intraparenchymal hemorrhage or subarachnoid hemorrhage; congenital anatomic or chromosomal anomaly; critical congenital heart disease. The MRI session of each neonate included the standard clinical sequences [anatomic T1- and T2 weighted MRI, diffusion weighted imaging (DWI)], followed by the PC and TRUST MRI scans. Based on the reading of the clinical anatomic images by radiologists (blinded to the PC and TRUST results), the neonates were categorized into two groups, the PWML group and the normal control group. Twenty-three newborns were categorized into the PWML group, including 14 males and 9 females. The gestational age (GA) at birth, postmenstrual age (PMA) at MRI scan and the birth weight were 34.00 (2.43) [median (interquartile range)] weeks, 35.14 (3.29) weeks and 2200 (860) g, respectively. There were 14 newborns with dyspnea after birth, eight preterm newborns had low birth weight, eight newborns had normal birth weight and one newborn had meconium aspiration and seizure. Among those newborns, eight newborns had cystic lesions. PWML contained four grades from I to IV. Cystic lesions belonged to grade IV of PWML. Dyspnea after birth, low birth weight and meconium aspiration are the common reasons leading to PWML.
Twenty-eight newborns were categorized into the control group, including 23 males and 5 females. The GA at birth, PMA at MRI scan and birth weight were 34.43 (6.43) weeks, 35.71 (5.36) weeks and 1,880 (1,645) g, respectively. There were nine preterm newborns with low birth weight. Neonates in the control group had normal results from umbilical cord blood gas analysis, liver function test, routine blood examination, and serum and ion analyses at birth. Their purpose of MR scans were for exclusions of abnormality of nervous system.
The clinical characteristics of the two groups are shown in Table 1.
Table 1. Clinical characteristics of the 51 infants.
General MRI Protocol
All MRI scans were performed on a 3.0 T MR scanner (Intera Achieva, Philips Medical Systems, Best, the Netherlands) with an eight-channel, phased-array coil for reception. Newborns were well-fed, sedated immediately prior to imaging with nasogastric chloral hydrate (30–50 mg/kg), earplugs were inserted, and they were kept warm and monitored by a pediatrician throughout the scanning procedure.
The standard clinical protocols for radiological reading included T1-weighted spin echo imaging (repeat time (TR) = 200 ms, echo time (TE) = 2.3 ms, matrix = 224 × 162, field of view (FOV) = 180 × 150 × 89 mm3, section thickness = 5 mm), T2-weighted DRIVE CLEAR imaging (TR = 5,000 ms, TE = 80 ms, matrix = 240 × 135, FOV = 180 × 150 × 90 mm3, section thickness = 5 mm), echo-planar imaging (EPI) for DWI (TR = 3,500 ms, TE = 63 ms, section thickness = 5 m, matrix = 112 × 112, FOV = 180 × 180 × 89 mm3, b values 0 and 1,000 s/mm2). All images were acquired in the same axial plane.
CBF Measurement
For the CBF measurement by PC MRI, a time-of-flight (TOF) angiography was first performed to visualize the left internal carotid arteries (LICA), right internal carotid arteries (RICA), left vertebral artery (LVA) and right vertebral artery (RVA), which were the feeding arteries of the brain. The imaging slab was positioned to be centered at epistropheus (C2 vertebrate), with a 60-mm saturation slab above the imaging slab to suppress the venous signal (Figure 1A). Imaging parameters of the TOF angiography were: TR = 20 ms, TE = 3.45 ms, flip angle = 18°, FOV = 90 × 90 × 20 mm3, voxel size = 0.8 × 0.8 × 2 mm3, scan duration = 23.7 ms. Next, based on the maximal-intensity-projection (MIP) images of the TOF angiogram, four PC MRI scans were performed to measure blood flow, each targeting one of the four feeding arteries. The imaging slices were positioned to be centered on and perpendicular to the target arteries. The LICA and RICA slices were placed at the level of foramen magnum, and the LVA and RVA slices right below the level of C2 vertebrae to avoid the turning points (Figure 1B). PC MRI parameters were: single slice, voxel size = 0.5 × 0.5 × 3 mm3, FOV = 180 × 180 × 3 mm3, maximum velocity encoding = 20 cm/s, non-gated,2 averages, scan duration of each artery = 14.7 s. Using the above protocol, the total duration to obtain CBF in each newborn was approximately 1.5 min.
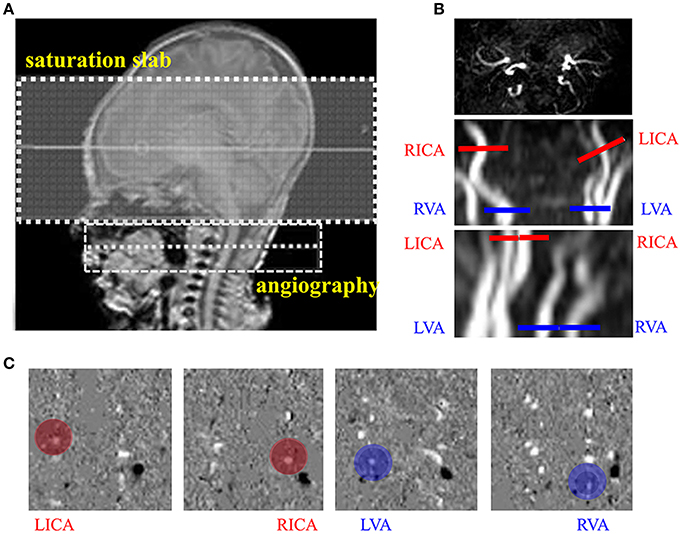
Figure 1. Measurement of cerebral blood flow (CBF) using phase contrast (PC) MRI. (A) Positioning of magnetic resonance angiography (MRA). (B) Positioning of PC MRI for the left internal carotid arteries (LICA), right internal carotid arteries (RICA), leftvertebral arteries (LVA) and right vertebral arteries (RVA) using the maximal-intensity-projection (MIP) images of the TOF angiogram. (C) Example velocity maps of the LICA, RICA, LVA, and RVA. Blood flow velocity was measured in the velocity map (red and blue circle).
Three images were generated by PCMRI scans: an anatomic image, a magnitude image and a velocity map (Figure 1C). Data processing of PC MRI followed methods reported previously (Liu et al., 2014). A region of interest (ROI) was manually drawn by an experience researcher (P.L., >10-year experience) on the magnitude image by tracing the boundary of the targeted artery, and then applied to the velocity map to measure the flow velocity of the target artery. The velocity values from individual voxels within the ROI were integrated over the area of the ROI to yield the blood flux of each artery. To account for brain size differences, the unit volume CBF (in mL/100 g/min) was obtained by normalizing the total blood flux (in mL/min) of all four arteries to the brain parenchyma weight. The brain's parenchyma weight was converted from the total volume of gray matter and white matter (obtained from segmentation of the T2-weighted images) by assuming a parenchyma density of 1.06 g/ml (Herscovitch et al., 1985).
Blood Oxygen Saturation Measurement
Ya was assessed using a pulse oximetry, which had an optical sensor attached to the toe of the newborn, while Yv was measured by TRUST MRI (Liu et al., 2014). The TRUST sequence utilizes the spin labeling scheme to isolate pure venous blood signal, and modulates T2-weighting of the venous signal to obtain venous T2, which can then be converted to venous oxygenation via the T2-Yv calibration (Liu et al., 2014, 2016). Due to the age-related variation in blood flow velocity and vessel size in newborns, two imaging locations were used to obtain >20% labeling efficiency of the TRUST scan. If PMA ≥36 weeks, imaging slices were positioned parallel to the intercommissural line with a 10 mm distance from the top of the sinus confluence to measure Yv in the superior sagittal sinus (Figure 2A). If PMA < 36 weeks, imaging slices were positioned parallel to the intercommissural line and below the sinus confluence and to measure Yv in the transverse or sigmoid sinuses (Figure 2B). The difference between control and label images yielded blood signal from the target vein, which was modulated with different T2-weighting using four different TEs: 0, 40, 80, and 160 ms, which were called effective TE (eTE) (Figure 2C). Monoexponential fitting of the signal intensity in target venous sinus as a function of eTE yielded the Carr–Purcell–Meiboom–Gill (CPMG) T2 of the venous blood (Figure 2D). T2 was then further converted into Yv via a calibration plot (Liu et al., 2016). The thickness of the labeling slab was 80 mm. The following parameters were used for TRUST scan: TR = 3,000 ms, inversion time (TI) = 1,022 ms, FOV = 160 × 160 × 5 mm3, matrix size = 64 × 61, SENSE factor = 3, voxel size = 2.5 × 2.5 × 5 mm3 and τCPMG = 10 ms. Three pairs of control and labeled images were scanned for each eTE and the total scan duration was 72 s.
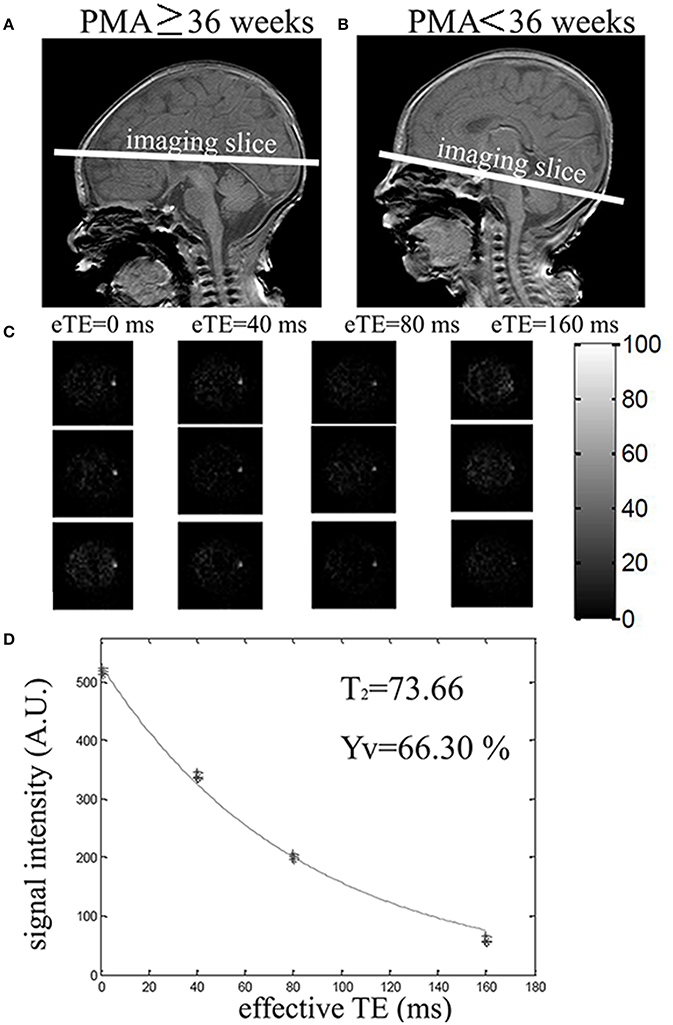
Figure 2. Positioning and measurement of Yv using T2-Relaxation-Under-Spin-Tagging (TRUST) MRI. (A) Positioning of TRUST MRI with PMA ≥ 36 weeks. (B) Positioning of TRUST MRI with PMA < 36 weeks. (C) Difference images between control and label for different effective TEs (eTEs): 0, 40, 80, and 160 ms. (D) Monoexponential fitting of the signal intensity in target venous sinus as a function of eTE yielded the venous blood. T2 was then converted into Yv via a calibration plot.
Following the analysis described previously (Liu et al., 2014), the TRUST data were motion corrected using the software Statistical Parametric Mapping (SPM2, University College, London, UK). Pairwise subtraction between control and labeled images yielded the difference images for each eTE. A coarse ROI was manually drawn to include the targeted vein in the area. Six voxels with the largest signal intensity within the ROI were chosen to calculate venous blood signal. The averaged venous signal intensity for each eTE was then fitted to a monoexponential curve to obtain a T2 value (Figure 2D). T2 was converted to Yv via a calibration plot using the hematocrit (HCT) values from routine blood examination of the neonates.
Calculation of CMRO2 and OEF
CMRO2 and OEF values were calculated using the following equations (Liu et al., 2013, 2016):
where the unit of CMRO2 is μmol O2/100 g/min. Ca is the capacity of blood to carry O2 in a HCT unit. Based on the data from physiology literature, Ca = 897 μmol O2/100 ml when HCT is 0.44 (Guyton and Hall, 2005).
Evaluation of Cerebral Maturation
Neonatal cerebral maturation was assessed using the total maturation score (TMS) validated by different groups (Childs et al., 2001; Ramenghi et al., 2007). TMS utilizes four parameters in the scoring system on T1, 2-weighted images: two phenomena undergoing progressive maturation (myelination [M], and cortical folding [C]), and two structures undergoing progressive involution (glial cell migration bands [G], and bands of migrating glial cells [B]). M ranges from 1 to 7 (M1–M7), C ranges from 1 to 6 (C1–C6), G ranges from 1 to 4 (G1–G4) and B ranges from 1 to 4 (B1–B4). The sums of the four parameters yield the TMS. C and G were observed at the plane of the interventricular foramen. Detailed scoring criteria are shown in Table 2. To minimize the inter-rater dependence of TMS, MR images were reviewed independently by two experienced pediatric radiologists (YQ and XW, both with >10-year experience). The mean values of the assessments by YQ and XW were calculated and used in the statistical analysis.
Table 2. Scoring system of total maturation score to assess four parameters of cerebral maturation in newborns.
Statistical Analysis
Continuous outcomes were summarized using medians and interquartile ranges and categorical outcomes using frequencies and percentages. Given the relatively small number of PWML group (N = 23) and controls (N = 28) in this study, summary measures were compared between groups using Wilcoxon two-sample exact tests (for continuous variables) and Chi-Square tests (for categorical variables). The inter-rater variation in the TMS determined by YQ and XW was estimated using the Intraclass Correlation Coefficient (ICC). For values ranging from 1.0 to 0.81, the reliability was considered excellent; from 0.80 to 0.61, very good; from 0.60 to 0.41, good; from 0.40 to 0.21, reasonable and, finally, from 0.20 to 0.00, poor.
To evaluate the group difference with the consideration of age effect, multi-linear regression analyses were performed with the measured physiological parameter (Yv, OEF, CMRO2, CBF, and brain volume, respectively) as dependent variable, and group (PWML or control) and PMA at MRI scan as independent variables. Similar analyses were also performed with group category and TMS as independent variables. In addition, stepwise regression analysis was performed to evaluate the effect of HCT on CMRO2, where CMRO2 was the dependent variable, PMA (and TMS), HCT and group were independent variables.
ROC used to determine whether Yv, OEF, CMRO2, CBF and brain volume faciliated the diagnosis of PWML. Classing the accuracy of a diagnostic test in the traditional academic point system: excellent = 0.9–1.0, good = 0.8–0.9, fair = 0.7–0.8, poor = 0.6–0.7, fail = 0.5–0.6 (significance was assessed at P < 0.05, SPSS 22).
Results
Comparison Between the Two Groups
The demographic information of the two groups is shown in Table 1. There were no significant differences in birth age, scan age and Ya between the two groups, but sex, HCT values and number of low birth weight showed group difference. Representative images of the PC and TRUST MRI scans were shown in Figures 1, 2, respectively.
Table 3 showed the median, interquartile ranges and ranges of CMRO2, CBF, Yv, OEF, brain volume and TMS of the two groups, as well as their outcomes of comparison. Significant differences between PWML and control groups were found in CMRO2 (P = 0.020), CBF (P = 0.027), Yv (P = 0.012), OEF (P = 0.018), TMS (P = 0.011), M scores (P < 0.001), C scores (P = 0.016), and B scores (P = 0.018). Yv and B scores were higher and other measurement values were lower in PWML group. The median, interquartile range, minimum and maximum values for CMRO2, CBF, Yv, and OEF from both groups, were shown by means of boxplots in Figure 3.
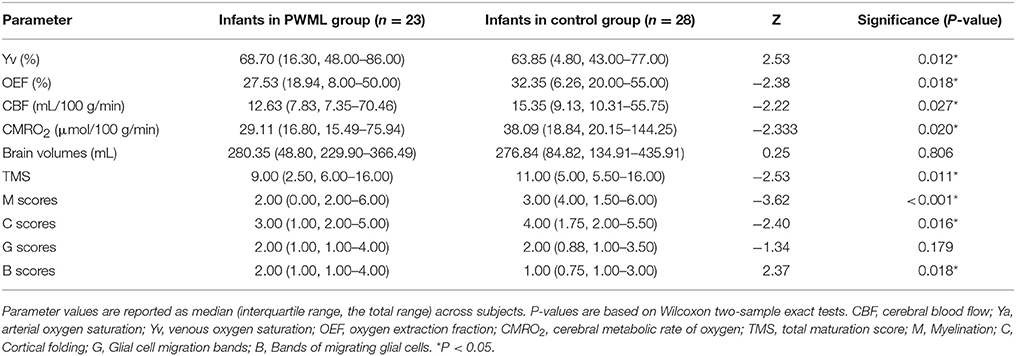
Table 3. Yv, OEF, CBF, CMRO2, brain volume and TMS in PWML group and control group.
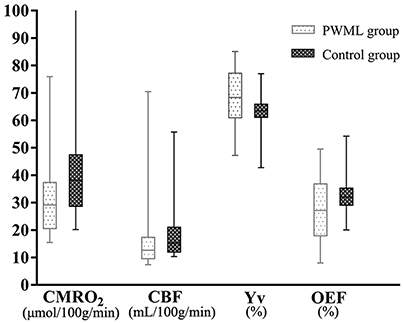
Figure 3. CMRO2-, CBF-, Yv-, and OEF-data for 28 control and 23 PWML infants. The median, interquartile range, minimum and maximum values for the CMRO2, CBF, Yv, and OEF of the two groups were shown; The CMRO2, CBF, Yv, and OEF in PWML group differed significantly from the parameters in control group (Z = −2.33, P = 0.020; Z = −2.22, P = 0.027; Z = 2.53, P = 0.012; Z = −2.38, P = 0.018). One newborn in the control group with an outlier of CMRO2 value was 144.25 μmol/100 g/min.
The inter-rater ICC value of TMS was 0.987. The reliability was considered excellent.
Effects of Group and PMA on Measured Physiological Parameters
Figure 4 showed the scatter plots of the measured physiological parameters as a function of PMA at MRI scan. Considering all neonates together, the multi-linear regression analysis showed that both Yv and OEF had significant correlation with group (P = 0.022 and P = 0.028, respectively), while had no dependence on PMA at MRI scan (P = 0.993 and P = 0.862, respectively). CMRO2 demonstrated a significant increase with PMA at MRI scan (P < 0.001), but had no significant relationship with group (P = 0.093). Similarly, a significant increase in CBF and brain volume were found with PMA (P < 0.001), but not with category (P = 0.748). Stepwise regression analysis confirmed that CMRO2 was significantly correlated with PMA (P < 0.001), but not with HCT (P = 0.999) and group (P = 0.979).
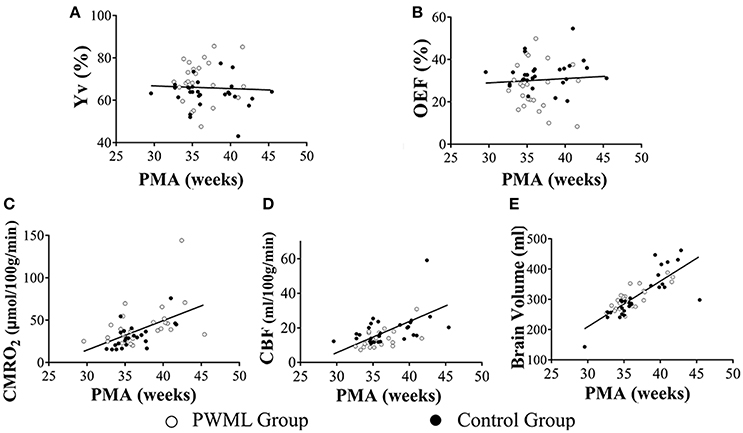
Figure 4. Scatter plots of the physiological parameters as a function of PMA. Yv (A) and OEF (B) had no dependence on PMA (P = 0.993, P = 0.862, respectively). CMRO2 (C), CBF (D) and brain volume (E) demonstrated a significant increase with PMA (P < 0.001). Filled symbols indicate control neonates, and unfilled symbols indicate PWML patients.
Effects of Group and TMS on Measured Physiological Parameters
Figure 5 showed the scatter plots of the measured physiological parameters as a function of TMS. The multi-linear regression analysis showed that both Yv and OEF had significant correlation with group (P = 0.019 and P = 0.028, respectively), while had no dependence on TMS (P = 0.582 and P = 0.747, respectively). CMRO2 (P = 0.005), CBF (P = 0.001) and brain volume (P < 0.001) increased significantly with TMS, but all had non-significant relationship with group (P = 0.353, P = 0.521, P = 0.089). Stepwise regression analysis also showed that CMRO2 was significantly correlated with TMS (P = 0.001), but not with HCT (P = 0.999) and group (P = 0.866).
Figure 5. Scatter plots of the physiological parameters as a function of TMS. Yv (A) and OEF (B) had no dependence on TMS (P = 0.582, P = 0.747, respectively).CMRO2 (C) (P = 0.005), CBF (D) (P = 0.001) and brain volume (E) (P < 0.001) increased significantly with TMS. Filled symbols indicate control neonates, and unfilled symbols indicate PWML patients.
ROCs of the Physiological Parameters for the Diagnosis of PWML
The ROCs of Yv, OEF, CMRO2, CBF and brain volume were shown in Figure 6. Their areas-under-curve (AUC) were 0.71 (confidence interval (C.I.): 0.55–0.86), 0.70 (0.54–0.86), 0.69 (0.54–0.84), 0.68 (0.53–0.83), and 0.52 (0.36–0.68), respectively, suggesting a fair diagnostic value of Yv and OEF.
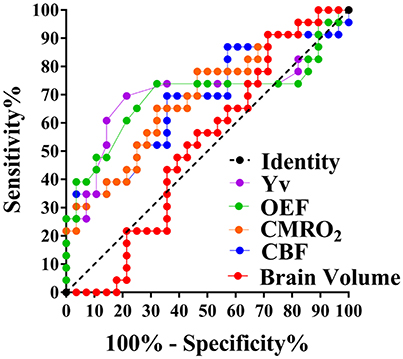
Figure 6. ROCs of Yv, OEF, CMRO2, CBF, and brain volume. AUC (Yv) = 0.71, AUC (OEF, CMRO2, CBF, and brain volume,) = 0.70, 0.69, 0.68, and 0.52, respectively.
Discussion
In this study we used the PC and TRUST MRI techniques to measure CBF, Yv, OEF, and CMRO2 in neonates with PWML and compared their values with those measured in healthy neonates. Our results demonstrated that newborns with PWML had lower values of CMRO2, CBF, OEF, and TMS, but higher value of Yv than the healthy controls. Taken into account the effect of age and brain maturation, Yv and OEF still showed a significant difference between the two groups. CMRO2, CBF and brain volume were correlated with age and cerebral maturation score.
Comparison of the Physiological Parameters With Previous Literature
Using various techniques including PET (Altman et al., 1993), MRI (Liu et al., 2013, 2014), and NIRS (Skov et al., 1993; Elwell et al., 2005), the measurements of CMRO2, CBF, OEF, and Yv in infants with asphyxia, ventilation dependence, and respiratory distress syndrome were reported (detailed results in Table 4). Results from all previous studies found that unhealthy infants had lower CMRO2, CBF and OEF, and higher Yv values compared with healthy infants. For healthy neonates, our OEF and CMRO2 values were consistent with the previous MRI report by Liu et al. (2014), but slightly higher than the values reported from De Vis et al. (OEF = 49%, CMRO2 = 30 μmol/100 g/min) (De Vis et al., 2014). Our results from the PWML group showed some difference with the PET study by Altman et al. (1993), (OEF = 16.6 %, CBF = 21.6 mL/100 g/min, CMRO2 = 21.4 μmol/100 g/min), but were within the range of values in diseased neonates measured with MRI (De Vis et al., 2014; Jain et al., 2014) and NIRS (Skov et al., 1993; Elwell et al., 2005) methods. The study from Altman group was primarily focused on newborns with severe brain injuries or those that needed extracorporeal membrane oxygenation (ECMO). The degree of severity of the brain injuries might be the reason of this difference. It is also possible that the sedation drug used in this study, chloral hydrate, may contribute to the difference with other studies. Although there is no direct evidence in human, animal studies have suggested that chloral hydrate might lead to higher CBF and lower glucose metabolism (Grome and McCulloch, 1981; Uematsu et al., 2009). Other factors that may lead to the variations across studies include subject age, sample size, whether there was oxygen support during study, as well as the techniques used for measurement. The TRUST MRI technique used in this study has been validated in adults previously (Lu et al., 2012). Yv measured with this technique is relatively robust to variations in brain size and blood flow velocity due to use of spin labeling scheme and flow-insensitive T2 preparation. In addition, a neonatal-specific T2-oxygenation calibration plot was applied to improve the accuracy of Yv measurement using TRUST MRI (Liu et al., 2016). Overall, the results in the present study are generally in good agreement with previous literature. We believe that PC MRI and TRUST MRI are reliable and efficient techniques for observing the changes of cerebral oxygen supply, and oxygen consumption and metabolic rates in newborns with PWML.
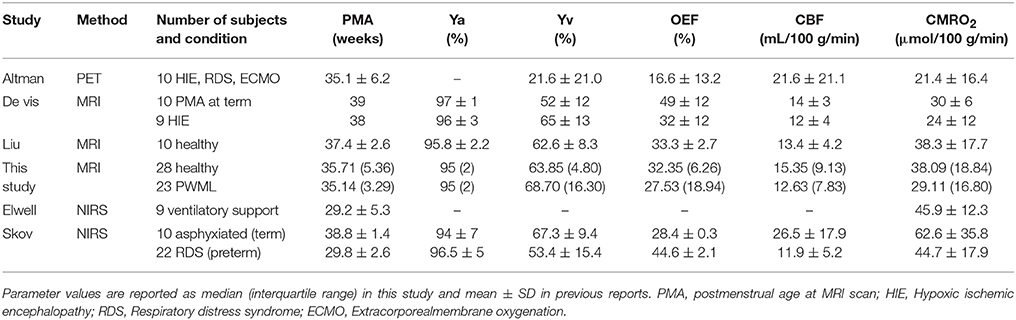
Table 4. Comparison of the arterial oxygenation (Ya), venous oxygenation (Yv), oxygen extraction fraction (OEF), cerebral blood flow (CBF), and cerebral metabolic rate of oxygen (CMRO2) obtained from this study with that of previous reports.
Physiologic Changes in PWML
Our results demonstrated that both OEF and Yv had significant dependence on groups. Specifically, Yv was higher and OEF was lower in the PWML group. These differences are likely to be due to the effect of hypoxia. Hypoxia is one of the primary causes of both PWML and HIE. In this study, 14 newborns in the PWML group had reported perinatal hypoxia or breathing difficulties (60.87%). Hypoxia is known to induce neuronal degeneration and necrosis and severehypoxia can lead to cystic lesions (Counsell et al., 2003; Volpe, 2003; Back et al., 2006; Robinson et al., 2010). Consequently, oxygen consumption in the brain would be reduced, leading to increased Yv and decreased OEF. Results of De Vis et al. (2014) and Shi et al. (2012) demonstrated similar effect of hypoxia in newborns with HIE.
Most PWML cases can be clearly recognized on MRI during the first 2 weeks. However, due to absorption, PWML become difficult to identify as lesions become smaller, less, and their T1-hyperintensity disappears. Moreover, brain volume as a quantitative anatomic marker failed to differentiate between the PWML and normal controls in our study, even though preterm newborns with low birth weight or extremely low birth weight have higher incidence of PWML. On the other hand, we observed a fair diagnostic value of Yv and OEF in PWML, despite the variety of severity in our PWML group. Therefore, Yv and OEF could be valuable physiological biomarkers that may assist with the diagnosis of pathophysiological abnormality.
We found that CMRO2 in the PWML group were lower than the control group (27%; Figure 3), although didn't reach a significant level after accounted for the group differences (P = 0.093). The lack of significance could be due to the relatively small sample size, as well as confounding factors such as respiratory and circulatory.
Relationships With Age and Cerebral Maturation
Results from the present study, as well as from studies by De Vis et al. (2014) and Liu et al. (2014), all found that both CMRO2 and CBF had significant correlation with age. Since PMA is an indirective parameter of brain development, CMRO2 and CBF are therefore associated with brain development. In this study, we further assessed brain maturation by TMS considering four indices: myelination, cortical folding, glial cell migration and germinal matrix tissue. Myelination begins approximately 20 weeks in the fetus, 24–25 weeks in the dorsal thalamus and globus pallidus, and 35–36 weeks in striatum. The positive correlation between CBF and TMS, and between CMRO2 and TMS suggested that as myelination progresses, the blood supply and oxygen metabolism in the brain increase to meet the escalating energy demand.
Previously De Vis et al. (2014) reported that OEF and Yv were positively correlated with PMA. However, we did not observe any age-dependence between OEF and Yv. These differences may be due to the relatively small sample size in the present study, and therefore larger sample sizes will be needed in the future.
HCT Differences Between the Two Groups
The HCT values were higher in the PWML group compared to the control group (P = 0.049), similar to a previous study in newborns with HIE (De Vis et al., 2014). HCT indicates the number of red blood cells which predicts the distribution of oxygen (Gould and Linninger, 2015), and is the primary factor used to determine blood viscosity. Asphyxia induces hypoxia in cells, and decreases adenosine triphosphate (ATP) production as well as pH values and blood flow velocity, all of which lead to decreased erythrocyte deformability and increased blood viscosity. Thus, the increased HCT values in PWML and HIE newborns were consistent with the pathophysiology of asphyxia. Additionally, gender may also affect the HCT values. In our control group there were 5 females and 23 males, likely to be due to gender discrimination happened occasionally in China. Although group difference was found in HCT, our results suggested that HCT has no effect in CMRO2 measurements.
Conclusions
In the present study, we demonstrated the feasibility of quantifying CMRO2, CBF, Yv and OEF in neonates with PWML using non-invasive MRI methods. Lower cerebral oxygen consumption was found in the PWML neonates. Our results suggested that physiological parameters such as Yv and OEF may be helpful for the diagnosis of PWML. The positive correlation between CBF and TMS, and between CMRO2 and TMS suggested that as myelination progresses, the blood supply and oxygen metabolism in the brain increase to meet the escalating energy demand.
Author Contributions
XW, HL, PL, and YQ participated in conceiving and designing of the idea. PL and ZL contributed to providing the post-processing assistant. HL, PL, and YQ contributed to analyzing the experiment results. YQ also contributed to drafting and editing of the manuscript. HL, PL, XW, and YQ also participated in critically revising the paper. All authors have read and approved the final manuscript for publication.
Funding
This study was supported by National Natural Science Foundation of China (grant agreement nos. 30570541, 30770632, 81271631) and Outstanding Scientific Fund of Shengjing Hospital (No.201402). The authors would like to thank the families who graciously consented to participate in this research.
Conflict of Interest Statement
The authors declare that the research was conducted in the absence of any commercial or financial relationships that could be construed as a potential conflict of interest.
References
Altman, D. I., Perlman, J. M., Volpe, J. J., and Powers, W. J. (1993). Cerebral oxygen metabolism in newborns. Pediatrics 92, 99–104.
Back, S. A., Riddle, A., and Hohimer, A. R. (2006). Role of instrumented fetal sheep preparations in defining the pathogenesis of human periventricular white-matter injury. J. Child Neurol. 21, 582–589. doi: 10.1177/08830738060210070101
Benders, M. J., Hendrikse, J., De Vries, L. S., Van Bel, F., and Groenendaal, F. (2011). Phase-contrast magnetic resonance angiography measurements of global cerebral blood flow in the neonate. Pediatr. Res. 69, 544–547. doi: 10.1203/PDR.0b013e3182176aab
Bolar, D. S., Rosen, B. R., Sorensen, A. G., and Adalsteinsson, E. (2011). Quantitative Imaging of eXtraction of oxygen and TIssue consumption (QUIXOTIC) using venular-targeted velocity-selective spin labeling. Magn. Reson. Med. 66, 1550–1562. doi: 10.1002/mrm.22946
Boudes, E., Gilbert, G., Leppert, I. R., Tan, X., Pike, G. B., Saint-Martin, C., et al. (2014). Measurement of brain perfusion in newborns: pulsed arterial spin labeling (PASL) versus pseudo-continuous arterial spin labeling (pCASL). Neuroimage Clin. 6, 126–133. doi: 10.1016/j.nicl.2014.08.010
Bremmer, J. P., van Berckel, B. N., Persoon, S., Kappelle, L. J., Lammertsma, A. A., Kloet, R., et al. (2011). Day-to-day test-retest variability of CBF, CMRO2, and OEF measurements using dynamic 15O PET studies. Mol. Imaging Biol. 13, 759–768. doi: 10.1007/s11307-010-0382-1
Bulte, D. P., Kelly, M., Germuska, M., Xie, J., Chappell, M. A., Okell, T. W., et al. (2012). Quantitative measurement of cerebral physiology using respiratory-calibrated MRI. Neuroimage 60, 582–591. doi: 10.1016/j.neuroimage.2011.12.017
Burgess, K. R., Lucas, S. J. E., Burgess, K. M., Sprecher, K. E., Donnelly, J., Basnet, A. S., et al. (2018). Increasing cerebral blood flow reduces the severity of central sleep apnea at high altitude. J. Appl. Physiol. doi: 10.1152/japplphysiol.00799.2017. [Epub ahead of print].
Childs, A. M., Ramenghi, L. A., Cornette, L., Tanner, S. F., Arthur, R. J., Martinez, D., et al. (2001). Cerebral maturation in premature infants: quantitative assessment using MR imaging. Am. J. Neuroradiol. 22, 1577–1582.
Colditz, P., Greisen, G., and Pryds, O. (1988). Comparison of electrical impedance and 133xenon clearance for the assessment of cerebral blood flow in the newborn infant. Pediatr. Res. 24, 461–464. doi: 10.1203/00006450-198810000-00008
Counsell, S. J., Rutherford, M. A., Cowan, F. M., and Edwards, A. D. (2003). Magnetic resonance imaging of preterm brain injury. Arch. Dis. Child. Fetal. Neonatal. 88, F269–F274. doi: 10.1136/fn.88.4.F269
Dai, W., Garcia, D., de Bazelaire, C., and Alsop, D. C. (2008). Continuous flow-driven inversion for arterial spin labeling using pulsed radio frequency and gradient fields. Magn. Reson. Med. 60, 1488–1497. doi: 10.1002/mrm.21790
Dani, K. A., Thomas, R. G., Chappell, F. M., Shuler, K., Muir, K. W., and Wardlaw, J. M. (2012). Systematic review of perfusion imaging with computed tomography and magnetic resonance in acute ischemic stroke: heterogeneity of acquisition and postprocessing parameters: a translational medicine research collaboration multicentre acute stroke imaging study. Stroke 43, 563–566. doi: 10.1161/STROKEAHA.111.629923
De Vis, J. B., Petersen, E. T., Alderliesten, T., Groenendaal, F., de Vries, L. S., van Bel, F., et al. (2014). Non-invasive MRI measurements of venous oxygenation, oxygen extraction fraction and oxygen consumption in neonates. Neuroimage 95, 185–192. doi: 10.1016/j.neuroimage.2014.03.060
Elwell, C. E., Henty, J. R., Leung, T. S., Austin, T., Meek, J. H., Delpy, D. T., et al. (2005). Measurement of CMRO2 in neonates undergoing intensive care using near infrared spectroscopy. Adv. Exp. Med. Biol. 566, 263–268. doi: 10.1007/0-387-26206-7_35
Gauthier, C. J., and Hoge, R. D. (2012). Magnetic resonance imaging of resting OEF and CMRO2 using a generalized calibration model for hypercapnia and hyperoxia. Neuroimage 60, 1212–1225. doi: 10.1016/j.neuroimage.2011.12.056
Golay, X., Silvennoinen, M. J., Zhou, J., Clingman, C. S., Kauppinen, R. A., Pekar, J. J., et al. (2001). Measurement of tissue oxygen extraction ratios from venous blood T(2): increased precision and validation of principle. Magn. Reson. Med. 46, 282–291. doi: 10.1002/mrm.1189
Gould, I. G., and Linninger, A. A. (2015). Hematocrit distribution and tissue oxygenation in large microcirculatory networks. Microcirculation 22, 1–18. doi: 10.1111/micc.12156
Grome, J. J., and McCulloch, J. (1981). Effect of chloral hydrate anaesthesia on the cerebral metabolic response to apomorphine administration. Eur. Neurol. 20, 176–179. doi: 10.1159/000115229
Guo, J., and Wong, E. C. (2012). Venous oxygenation mapping using velocity-selective excitation and arterial nulling. Magn. Reson. Med. 68, 1458–1471. doi: 10.1002/mrm.24145
Guyton, A. C., and Hall, J. E. (2005). “Respiration,” in Textbook of Medical Physiology, eds A. C. Guyton and J. E. Hall (Philadelphia, PA: Saunders/Elsevie), 502–513.
Herscovitch, P., Mintun, M. A., and Raichle, M. E. (1985). Brain oxygen utilization measured with oxygen-15 radiotracers and positron emission tomography: generation of metabolic images. J. Nucl. Med. 26, 416–417.
Ibaraki, M., Miura, S., Shimosegawa, E., Sugawara, S., Mizuta, T., Ishikawa, A., et al. (2008). Quantification of cerebral blood flow and oxygen metabolism with 3-dimensional PET and 15O: validation by comparison with 2-dimensional PET. J. Nucl. Med. 49, 50–59. doi: 10.2967/jnumed.107.044008
Jain, V., Buckley, E. M., Licht, D. J., Lynch, J. M., Schwab, P. J., Naim, M. Y., et al. (2014). Cerebral oxygen metabolism in neonates with congenital heart disease quantified by MRI and optics. J. Cereb. Blood Flow Metab. 34, 380–388. doi: 10.1038/jcbfm.2013.214
Kusaka, T., Isobe, K., Yasuda, S., Koyano, K., Nakamura, S., Nakamura, M., et al. (2014). Evaluation of cerebral circulation and oxygen metabolism in infants using near-infrared light. Brain Dev. 36, 277–283. doi: 10.1016/j.braindev.2013.05.011
Liu, P., Chalak, L. F., Krishnamurthy, L. C., Mir, I., Peng, S. L., Huang, H., et al. (2016). T1 and T2 values of human neonatal blood at 3 Tesla: dependence on hematocrit, oxygenation, and temperature. Magn. Reson. Med. 75, 1730–1735. doi: 10.1002/mrm.25775
Liu, P., Huang, H., Rollins, N., Chalak, L. F., Jeon, T., Halovanic, C., et al. (2014). Quantitative assessment of global cerebral metabolic rate of oxygen (CMRO2) in neonates using MRI. NMR Biomed. 27, 332–340. doi: 10.1002/nbm.3067
Liu, P., Xu, F., and Lu, H. (2013). Test-retest reproducibility of a rapid method to measure brain oxygen metabolism. Magn. Reson. Med. 69, 675–681. doi: 10.1002/mrm.24295
Lu, H., and Ge, Y. (2008). Quantitative evaluation of oxygenation in venous vessels using T2-relaxation-under-spin-tagging MRI. Magn. Reson. Med. 60, 357–363. doi: 10.1002/mrm.21627
Lu, H., Xu, F., Grgac, K., Liu, P., Qin, Q., and van Zijl, P. (2012). Calibration and validation of TRUST MRI for the estimation of cerebral blood oxygenation. Magn. Reson. Med. 67, 42–49. doi: 10.1002/mrm.22970
Massaro, A. N., Bouyssi-Kobar, M., Chang, T., Vezina, L. G., du Plessis, A. J., and Limperopoulos, C. (2013). Brain perfusion in encephalopathic newborns after therapeutic hypothermia. Am. J. Neuroradiol. 34, 1649–1655. doi: 10.3174/ajnr.A3422
Miller, S. P., Ferriero, D. M., Leonard, C., Piecuch, R., Glidden, D. V., Partridge, J. C., et al. (2005). Early brain injury in premature newborns detected with magnetic resonance imaging is associated with adverse early neurodevelopmental outcome. J. Pediatr. 147, 609–616. doi: 10.1016/j.jpeds.2005.06.033
Niwa, T., de Vries, L. S., Benders, M. J., Takahara, T., Nikkels, P. G., and Groenendaal, F. (2011). Punctate white matter lesions in infants: new insights using susceptibility-weighted imaging. Neuroradiology 53, 669–679. doi: 10.1007/s00234-011-0872-0
Ouyang, M., Liu, P., Jeon, T., Chalak, L., Heyne, R., Rollins, N. K., et al. (2017). Heterogeneous increases of regional cerebral blood flow during preterm brain development: preliminary assessment with pseudo-continuous arterial spin labeled perfusion MRI. Neuroimage 147, 233–242. doi: 10.1016/j.neuroimage.2016.12.034
Qin, Q., Grgac, K., and van Zijl, P. C. (2011). Determination of whole-brain oxygen extraction fractions by fast measurement of blood T(2) in the jugular vein. Magn. Reson. Med. 65, 471–479. doi: 10.1002/mrm.22556
Ramenghi, L. A., Fumagalli, M., Righini, A., Bassi, L., Groppo, M., Parazzini, C., et al. (2007). Magnetic resonance imaging assessment of brain maturation in preterm neonates with punctate white matter lesions. Neuroradiology 49, 161–167. doi: 10.1007/s00234-006-0176-y
Robinson, S., Mikolaenko, I., Thompson, I., Cohen, M. L., and Goyal, M. (2010). Loss of cation-chloride cotransporter expression in preterm infants with white matter lesions: implications for the pathogenesis of epilepsy. J. Neuropathol. Exp. Neurol. 69, 565–572. doi: 10.1097/NEN.0b013e3181dd25bc
Shi, Y., Zhao, J. N., Liu, L., Hu, Z. X., Tang, S. F., Chen, L., et al. (2012). Changes of positron emission tomography in newborn infants at different gestational ages, and neonatal hypoxic-ischemic encephalopathy. Pediatr. Neurol. 46, 116–123. doi: 10.1016/j.pediatrneurol.2011.11.005
Sie, L. T., Hart, A. A., van Hof, J., de Groot, L., Lems, W., Lafeber, H. N., et al. (2005). Predictive value of neonatal MRI with respect to late MRI findings and clinical outcome. A study in infants with periventricular densities on neonatal ultrasound. Neuropediatrics 36, 78–89. doi: 10.1055/s-2005-837574
Skov, L., Pryds, O., Greisen, G., and Lou, H. (1993). Estimation of cerebral venous saturation in newborn infants by near infrared spectroscopy. Pediatr. Res. 33, 52–55. doi: 10.1203/00006450-199301000-00011
Uematsu, M., Takasawa, M., Hosoi, R., and Inoue, O. (2009). Uncoupling of flow and metabolism by chloral hydrate: a rat in vivo autoradiographic study. Neuroreport 20, 219–222. doi: 10.1097/WNR.0b013e328302ee46
van Kooij, B. J., Hendrikse, J., Benders, M. J., de Vries, L. S., and Groenendaal, F. (2010). Anatomy of the circle of Willis and blood flow in the brain-feeding vasculature in prematurely born infants. Neonatology 97, 235–241. doi: 10.1159/000253754
Varela, M., Groves, A. M., Arichi, T., and Hajnal, J. V. (2012). Mean cerebral blood flow measurements using phase contrast MRI in the first year of life. NMR Biomed. 25, 1063–1072. doi: 10.1002/nbm.2771
Volpe, J. J. (2003). Cerebral white matter injury of the premature infant-more common than you think. Pediatrics 112, 176–180. doi: 10.1542/peds.112.1.176
Wang, J., and Licht, D. J. (2006). Pediatric perfusion MR imaging using arterial spin labeling. Neuroimaging Clin. N. Am. 16, 149–167, ix. doi: 10.1016/j.nic.2005.10.002
Wilson-Costello, D., Friedman, H., Minich, N., Siner, B., Taylor, G., Schluchter, M., et al. (2007). Improved neurodevelopmental outcomes for extremely low birth weight infants in 2000–2002. Pediatrics 119, 37–45. doi: 10.1542/peds.2006-1416
Wise, R. G., Harris, A. D., Stone, A. J., and Murphy, K. (2013). Measurement of OEF and absolute CMRO2: MRI-based methods using interleaved and combined hypercapnia and hyperoxia. Neuroimage 83, 135–147. doi: 10.1016/j.neuroimage.2013.06.008
Wright, E. A., d'Esterre, C. D., Morrison, L. B., Cockburn, N., Kovacs, M., and Lee, T. Y. (2016). Absolute cerebral blood flow infarction threshold for 3-hour ischemia time determined with CT perfusion and 18F-FFMZ-PET imaging in a porcine model of cerebral ischemia. PLoS ONE 11:e0158157. doi: 10.1371/journal.pone.0158157
Keywords: punctate white matter lesions, PC MRI, TRUST MRI, CMRO2, CBF, Yv, OEF
Citation: Qi Y, Liu P, Lin Z, Lu H and Wang X (2018) Hemodynamic and Metabolic Assessment of Neonates With Punctate White Matter Lesions Using Phase-Contrast MRI and T2-Relaxation-Under-Spin-Tagging (TRUST) MRI. Front. Physiol. 9:233. doi: 10.3389/fphys.2018.00233
Received: 20 November 2017; Accepted: 01 March 2018;
Published: 19 March 2018.
Edited by:
Erwin Lemche, Institute of Psychiatry, Psychology Neuroscience (IoPPN), King's College London, United KingdomReviewed by:
Can Ozan Tan, Harvard Medical School, United StatesMadhan Subramanian, Oklahoma State University, United States
Copyright © 2018 Qi, Liu, Lin, Lu and Wang. This is an open-access article distributed under the terms of the Creative Commons Attribution License (CC BY). The use, distribution or reproduction in other forums is permitted, provided the original author(s) and the copyright owner are credited and that the original publication in this journal is cited, in accordance with accepted academic practice. No use, distribution or reproduction is permitted which does not comply with these terms.
*Correspondence: Xiaoming Wang, wangxm024@163.com