Second Harmonic Generation Properties in Chiral Sarcomeres of Drosophila Larval Muscles
 Abiramy Karunendiran
 Kamdin Mirsanaye
 Bryan A. Stewart1,2
  Virginijus Barzda
- 1University of Toronto, Department of Cell and Systems Biology, Toronto, ON, Canada
- 2University of Toronto Mississauga, Department of Biology, Mississauga, ON, Canada
- 3University of Toronto, Department of Physics, Toronto, ON, Canada
- 4University of Toronto Mississauga, Department of Chemical and Physical Sciences, Mississauga, ON, Canada
- 5Vilnius University, Laser Research Centre, Faculty of Physics, Vilnius, Lithuania
Polarimetric second harmonic generation (SHG) microscopy is a label-free ultrastructural imaging technique that is applied to study molecular organization in striated muscle structure. Wild type OreR and UNC45 knockdown Drosophila melanogaster somatic larva body wall muscles are used to elucidate the influence of myosin organization on SHG imaging response. Structural changes due to varying myosin content are studied with linear polarization-in polarization-out (PIPO) SHG microscopy. PIPO SHG microscopy revealed changes in the striated pattern of somatic muscles and a reduced signal intensity correlated with reduced order of myosin filaments. The achiral and chiral susceptibility component ratios R- and C-ratios, respectively, were deduced. R-ratio values were higher in the UNC45 knockdown larva mutant compared to control, suggesting that in addition to myosin, another protein structure provide basis for a second harmonic response. The SHG active protein structure is located in the region of isotropic bands of the striated muscles. The measured C-ratio from the muscle fibers appeared to be small. Nonetheless, the wide distribution of C-ratio values of myosin filaments could be observed in the wild-type OreR muscles. Overall, this technique provides insight on how second harmonic properties change with myosin filament structure.
Introduction
SHG is a label-free image contrast mechanism for visualizing non-centrosymmetric biological structures with nonlinear optical microscopy [1]. It has been used extensively to image collagen [1], myosin [2], microtubules [3] and starch granules [4]. SHG microscopy enables non-invasive in vivo visualization of striated muscles due to myosin’s helical non-centrosymmetric structure and its crystalline arrangement [5-8]. While second harmonic generation from the striated muscle structure is well studied, the high resolution SHG intensity and polarization profile indicates varying polarization response along the striated muscle fibers [9], which is not well understood in terms of constituting molecular content and organization, and it is the subject of the current investigation.
The contraction in striated muscles is accomplished by a synchronized action of ordered myosin nanomotor arrays stepping along the actin filaments. The main contractile unit in striated muscle is the sarcomere, which has a crystalline arrangement of protein filaments that are indispensable for contraction. A sarcomere can also be spatially described as alternating isotropic (I) and anisotropic (A) bands, aptly named for their properties observed under a polarizing microscope [10]. The I bands are defined as the region of thin filaments that are not superimposed by thick filaments, and contain Z-discs and titan protein complexes. The thin filaments, also called actin filaments, are made from g-actin molecules that polymerize to form a right-handed double helix and anchored to the Z-disc on either side. The actin filaments contain troponin and tropomyosin, two regulatory molecules that participate in the regulation of muscle contraction. Tropomyosin is a helical protein that assembles in coiled-coil homo- or hetero-dimers and lays along the helical groove of actin filaments. On the other hand, the A bands are defined as the regions spanning the entire length of the thick filaments, or myosin filaments. These bipolar filaments are formed from the bundling of myosin II molecules, which are characterized by two distinct globular heads that interact with actin during contraction [11]. Incorporating myosin molecules and preventing aggregation of misfolded proteins in the thick filament is crucial for proper muscle function, and it is done with the help of the myosin chaperone. The myosin chaperone named UNC45 (it is a USC chaperone since this region is shared by three proteins UNC45/CRO1/She4P) that is necessary for myosin incorporation into the thick filaments. UNC45 is expressed throughout the entire Drosophila life cycle and expression levels have been shown to increase drastically during late embryogenesis when initial muscle development occurs. Changes in UNC45 levels or expression pattern have been shown to negatively affect muscle function, resulting in defects in muscle structure, physiology and locomotor behaviour [12, 13].
The SHG signal generation efficiency is characterized by the second order susceptibility tensor. The susceptibility tensor elements reflect the underlying molecular structure in the sample. For chiral filaments, a C6 symmetry is assumed, which is characterized by the four molecular susceptibility tensor components: χzzz, χzxx, χxxz and χxyz, with z-axis along the fiber length. The chiral fibrils can be characterized by susceptibility component ratios. The achiral
For measuring the susceptibility tensor component ratios, the polarimetric SHG microscopy can be employed. If the incident and outgoing linear polarizations are applied at various orientations, the linear polarization-in polarization-out (PIPO) measurement can be performed [15], which in turn enables extraction of achiral R and chiral C susceptibility component ratios [14]. The R-ratio can also be extracted using incident and outgoing circular polarizations [14]. For quick assessment of the R-ratio, which is beneficial for dynamic measurements during contraction, only outgoing orthogonal circular polarizations can be employed in so called single-shot measurement, using one incident circular polarization [16]. The precision of R-ratio measurement in the single-shot experiment depends on the magnitude of C-ratio. If the C-ratio in the sample is small, the R-ratio can be precisely determined with the single-shot experiment [17]. Therefore, it is important to determine the magnitude of C-ratio in the muscle samples.
Although the SHG origin in muscle fibers is attributed predominantly to ordered myosin filaments in the A-bands of sarcomeres, the origin of detailed SHG signal profile along the sarcomeres is not fully understood, and it is difficult to interpret due to coherent addition of the signals from different parts of sarcomere [18]. There is also a weak SHG signal in I-bands of sarcomeres, which has not been elucidated. The R-ratio of I-band is larger compared to the A-band ratio [9].
This study aims to characterize the achiral R- and chiral C- ratio along the A- and I-bands of sarcomeres in Drosophila melanogaster body wall muscles. The previously developed PIPO analysis allows for the measurement of the susceptibility ratio values in each pixel of the image, which has been utilized to study the horizontally oriented somatic muscle in Drosophila melanogaster [9, 19]. The Drosophila larva body wall muscles have typical sarcomere length around 7 μm. Muscle fibers with large sarcomeres and A-band width helps to elucidate the chiral SHG contribution in the tilted structures. In addition, readiness of genetic manipulations makes the Drosophila larva body wall muscles a very convenient model system for studies of SHG origin in muscle fibers. The molecular origin of SHG in A- and I-bands is demonstrated using UNC45 mutant that has decreased myosin accumulation in the myofibrils. We show that R-ratio in the I-bands is higher and significantly different from the R-ratio in A-bands. We also show that C-ratio in the myofibrils is small compared to the collagen fibers [16], and, therefore, the R-ratio can be measured with high precision in a single-shot experiment using only one incoming circular polarization state. Therefore, dynamic processes of contraction in the sarcomeres and interaction between sarcomeres in a muscle fiber can be studied with a single-shot polarimetric SHG microscopy at high imaging rate.
Materials and Methods
Polarimetric Nonlinear Microscope
Polarimetric imaging of larva muscle is performed with a home-built single-photon counting nonlinear microscope [20]. The laser source consisted of a femtosecond Yb:KGW crystal based oscillator with output power of 1 W. The laser provided 450 fs duration pulses at 1028 nm wavelength and a pulse repetition rate of 14.3 MHz [21]. The laser scanning microscope setup is described elsewhere [20]. The raster scanning was accomplished with galvanometric mirrors (GSI Lumonic Inc.) at up to 10 frames per second rate over 110 μm × 110 μm image area. A 20 × 0.75 NA air objective (Zeiss) was used for the experiments. The SHG signal was collected using a custom 0.85 NA collection objective and filtered using a band pass interference filter at 510 nm central wavelength with ±10 nm bandwidth and BG39 Shott glass filter. The signal was detected by a photon-counting photomultiplier tube (Hamamatsu). The counts were acquired with the photon counting card (NI).
Polarization measurements were performed using PIPO, which was previously described [20]. Briefly, a polarization state generator (PSG) consisting of a linear polarizer and a half-wave plate was inserted in the microscope before the excitation objective for rotation of incoming linear polarization. A polarization state analyzer (PSA) consisting of a linear polarizer (analyzer) was incorporated after the collection objective in order to measure the polarization state of second harmonic response. The half-wave plate and the analyzer angles were varied by 11.25o and 22.5o steps, respectively. Control measurements were taken at reference polarizer and analyzer angles (0o) after every 8th measurement. Hence, PIPO scan contained a total of 90 measurements, each having a characteristic combination of polarizer and analyzer orientation angles.
PIPO Analysis
The Cartesian laboratory coordinate system, XYZ, is defined in the microscope setting such that the image plane is along the XZ plane and the laser propagates along the Y-direction. The average orientation of muscle fibres in a voxel is defined by the spherical angle α and δ, where α is the angle of the fiber out of the XZ image plane and δ is the fiber angle in the XZ plane, measured with respect to the Z axis. The fibres have their own associated Cartesian coordinates, xyz, where the z-axis is oriented along the fibre axis.
The measured second harmonic generation intensity depends on the incoming and outgoing linear polarization orientation defined by angles θ and φ with respect to the Z-axis, respectively. For C6 symmetry the PIPO equation for measured second harmonic intensity,
where
These expressions are valid for cylindrical C6 symmetry. The
Drosophila Genetics and Dissections
Dissected OregonR (OreR) Drosophila melanogaster third instar larva was used for imaging a wild-type somatic muscle. Decrease in myosin accumulation was done by inhibiting the expression of the myosin chaperone UNC45. For simplicity, samples with decreased myosin content were called mutant muscles of UNC45 knockdown muscle. To visualize the body wall muscles, wandering third instar larvae were dissected along the dorsal midline in zero calcium HL3 solution [23]. Upon removal of internal organs and fat bodies, the body was unfolded to expose the wall muscles and was fixed in 4% formaldehyde in phosphate buffered saline (PBS). The tissue underwent several washes in fresh PBS before preparing for microscopic imaging. The fixed muscles (∼50 µm in thickness) were sandwiched between a 1 mm-thick microscope slide and a 0.17 mm-thick coverslip (No. 1.5) and sealed with nail polish.
Results
Polarimetric SHG Imaging of Larva Body Wall Muscle
The polarimetric experiments were carried out for the wild type and UNC45 knockdown muscles using the PIPO SHG technique, and the achiral R and chiral C susceptibility ratios were determined. Representative SHG images for each muscle group along with their corresponding R-ratio image, fibril orientation map and R-ratio histogram are shown and compared in Figure 1. The R-ratios were determined for each pixel and are represented in the R-ratio images (Figures 1B,E,H) with R-ratios from 0 to 1.5. UNC45 knockdown muscles were observed to have more variation in R-ratio values as shown by the increase in orange and red pixels (corresponding with R-ratio values between 0.7 and 0.9) when compared to the predominantly yellow/green pixels in OreR muscles (corresponding to R-ratio values between 0.4 and 0.5). These variations were reflected in the R-ratio histograms, where the width of the distribution was larger for UNC45 mutants (Figure 1F) compared to OreR (Figure 1C). It was also observed that there was a shift of R-ratio to the higher values in the distribution of UNC45 knockdown muscles. Some UNC45 knockdown larval muscles that still exhibited striations were imaged using polarimetric SHG microscopy and analyzed (Figures 1G,H). These muscles were observed to have slightly more variation in R-ratio values when compared to OreR. However, the distribution peak was found to be shifted back to approximately 0.5, similar to OreR muscles.
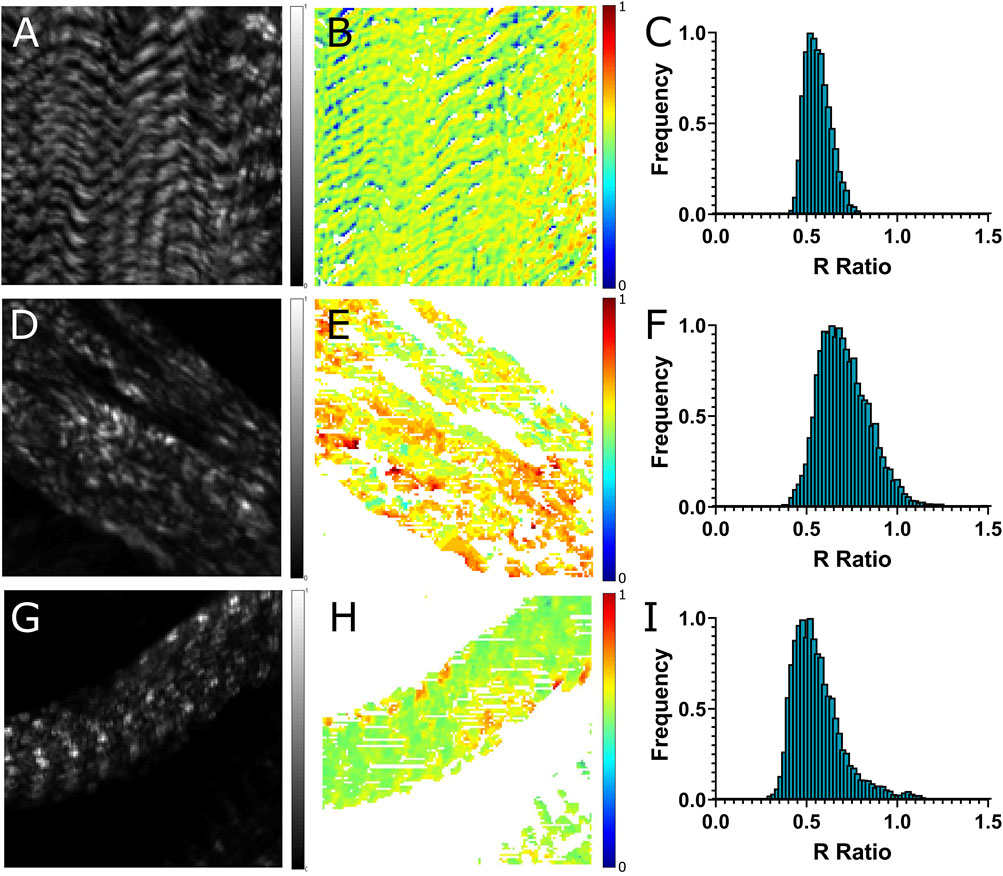
FIGURE 1. Polarization-based analysis for OreR (A–C), and UNC45 knockdown (D–I) body wall muscles in third instar larvae. These are representative images of second harmonic intensity (A,D,G), R-ratio (B,E,H), and ratio histogram (C,F,I). Colour bars beside each image represent range of normalized SHG intensities (0–1 A.U.) and R-ratio values (0–1). Scale bars represent 10 μm.
To obtain the average R-ratio, 9 measurements were taken for OreR control, 6 measurements were taken for the more severe UNC45 knockdown phenotype and 5 measurements were taken for the normal phenotype found in UNC45 knockdown larvae (Figure 2). UNC45 knockdown muscle that exhibited severe changes in morphology were found to have a significantly higher R-ratio (0.75 ± 0.10) compared to OreR control (0.50 ± 0.02, p < 0.01), whereas UNC45 mutant muscles that had a normal phenotype had about the same R-ratio (0.53 ± 0.03, p > 0.05) (Figure 2). The distribution of R-ratio values was also observed to vary significantly more in UNC45 knockdown muscles as indicated by the width of the distribution of R-ratio histograms. The distribution width was determined for each phenotype by measuring the full width at half maximum (FWHM) of the histogram. It was observed that compared to the distribution of OreR muscles (0.19 ± 0.06), UNC45 knockdown muscles with severe disruption in the banding pattern were observed to have broader R-ratio distributions (0.48 ± 0.08, p < 0.05) (Figure 2B). UNC45 knockdown muscles that still exhibited some banding patterns were observed to have intermediate variation in the distribution of R-ratio (0.24 ± 0.06), however compared to OreR it was not observed to be statistically significant (p > 0.05).
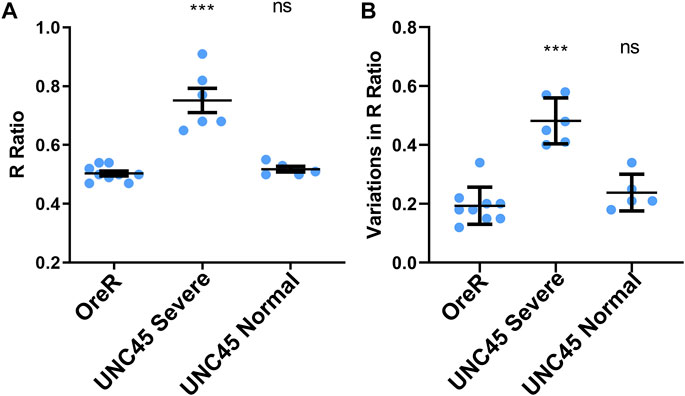
FIGURE 2. R-Ratio measurements across multiple samples in OreR and UNC45 knockdown larvae. (A) Average R-ratio for OreR control (n = 9) and UNC45 knockdown with severe disruption (n = 6) and normal banding pattern (n = 5) of larval body wall muscles. (B) FWHM variation in R-ratio distribution values for OreR control and UNC45 knockdown larval muscles. Statistical comparisons were done using ANOVA and Tukey-Kramer post-hoc test.
Chiral analysis was done on OreR and UNC45 knockdown muscles to observe changes in the C-ratio distribution (Figure 3). Chiral molecules lack inversion symmetry and when tilted out of the image plane by angle α can exhibit positive and negative values depending on the myosin filament polarity and orientation in the A-bands according to eq. 2. The thick filaments have a bimodal distribution of myosin. Since myosin is a helical molecule and oppositely arranged molecules would have opposite polarities, it was expected that there would be positive chiral ratios on one side of the A-bands and negative ratios on the other, yielding a bimodal distribution in the C-ratio histograms.
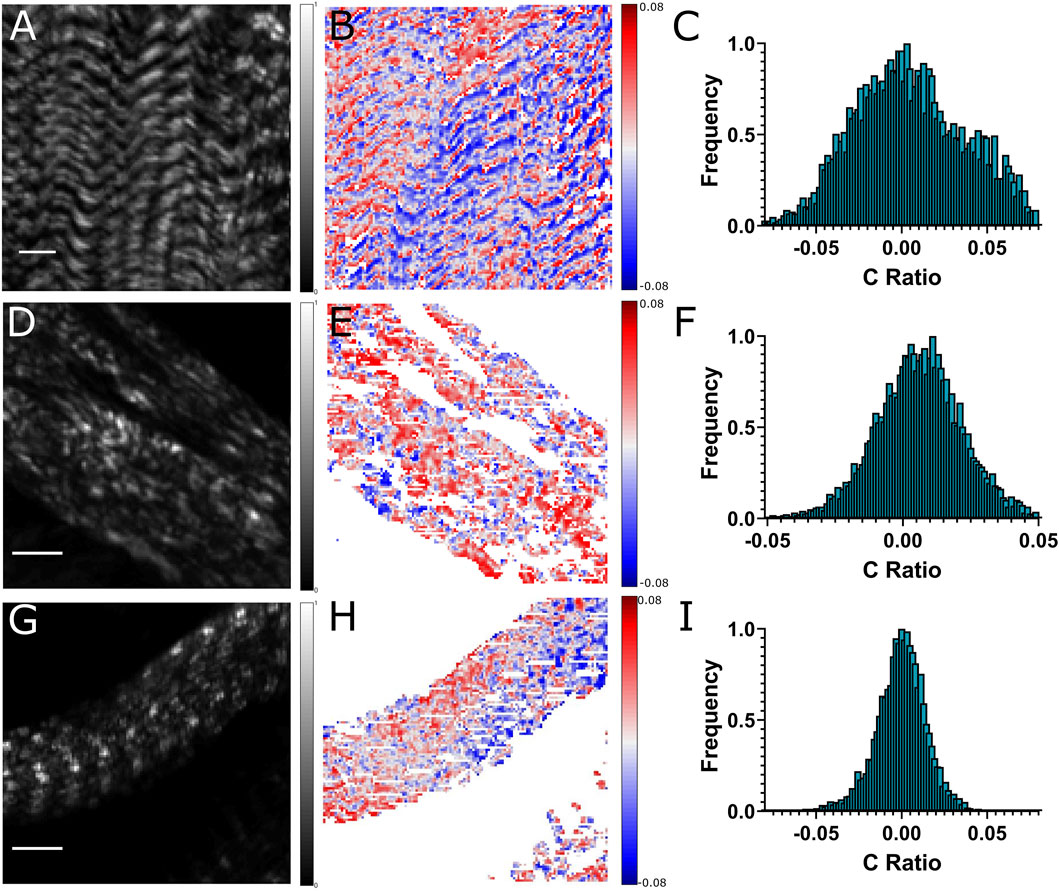
FIGURE 3. Chiral analysis of OreR (A–C), and UNC45 knockdown (D–I) muscles in third instar larvae. These are representative images of A),D),G) Second Harmonic, B),E),H) C-ratio and C),F),I) C-ratio histogram. Colour bars beside each image represent range of normalized SHG intensities (0–1 A.U.), and C-ratio values (-0.05 to 0.05). Scale bar represents 10 µm.
Both polarities of myosin was observed in the OreR chiral images as indicated by the alternating red and blue bands (Figure 3B). The bimodal distribution was observed for a narrow tilting angle range. Larger tilting leads to the overlap of striations. The UNC45 knockdown muscles exhibiting no striations showed both red and blue regions, however no clear banding was observed (Figure 3E). UNC45 knockdown muscles that still had a striated appearance showed either variations in red and grey pixels or variations in blue and grey pixels, but alternating red and blue regions across the A-band was not clearly distinguished (Figure 3H). The C-ratio histograms showed larger value distributions in OreR control (Figure 3C), while a narrower C-ratio distribution was observed in UNC45 knockdown muscles (Figures 3F,I). Larger distribution of C-ratio in the OreR control indicates higher molecular chiral ratio in wild-type muscles. The FWHM of the C-ratio distributions is relatively narrow compared, for example, to collagen fibers [14] indicating that myosin filaments exhibit low chirality, although the tilt of the fibrils was also small.
Polarimetric Parameter Profiles Along Myofibrils
In order to visualize the variation of these parameters along the sarcomere, profiles of SHG intensity, R- and C- ratios were taken along three consecutive sarcomeres in OreR and UNC45 knockdown larval body wall muscles (Figure 4). A rectangular region, as shown in Figure 3A, was used for the profile by averaging the short axis of the region of interest. The SHG intensity profile shows distinct peaks localized in each bright band of the region of interest. These peaks were used to highlight the A-bands with light grey background vertical bands in order to easily compare the variations in R- and C-ratio across the profile. The M-lines were highlighted in dark grey, which are localized at the maximum intensity of each peak [24]. As expected, the SHG signal intensity of OreR larva muscle was found to be the highest in the A-bands and the lowest in the I-bands. The R-ratio profiles show variations in the A-band profile (Figure 4A), where there is a slight decrease in the R-ratio at each M-line. The ratio along the A-band was found to be around 0.55 as previously seen in other R-ratio images [19]. However, it was observed that the R-ratio increases to about 0.7 in the I-band region. The C-ratio along the A-bands was observed to transition from negative values on the left side of the grey region to positive values on the right side, which is consistent with the variations of red and blue pixels seen in C-ratio images (Figure 3B).
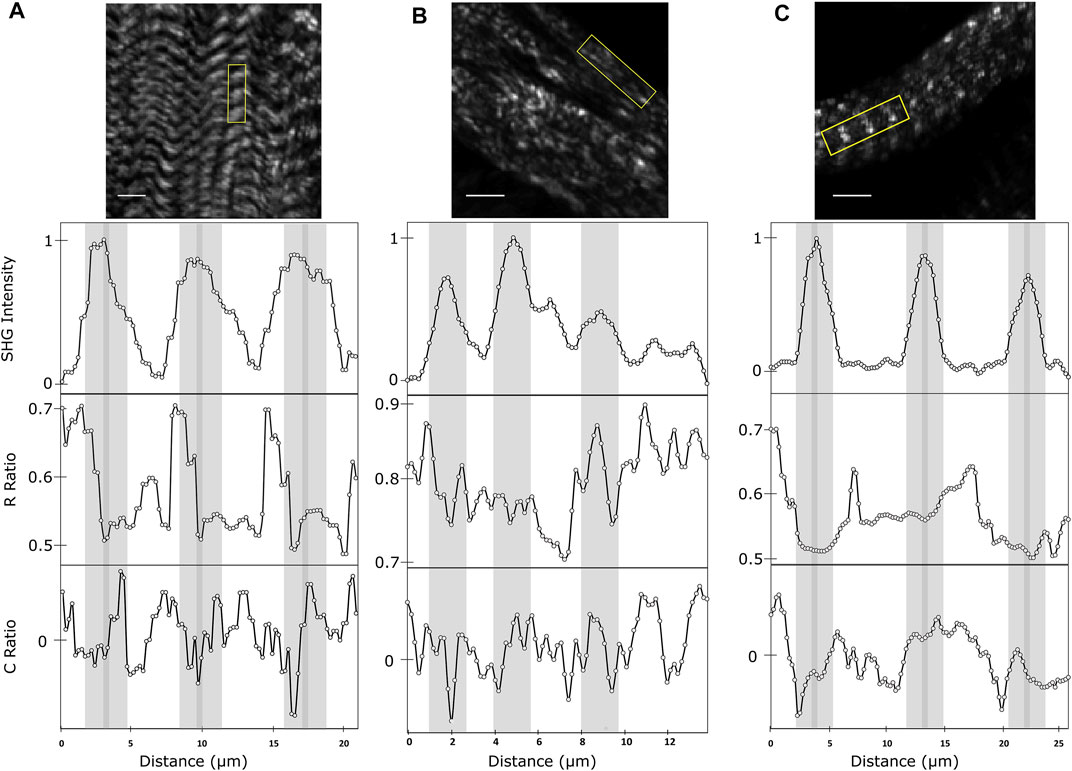
FIGURE 4. SHG intensity R-ratio and C-ratio variations along muscle fibrils in OreR muscle (A), UNC45 knockdown muscles with severe disruption in the striated pattern (B), and UNC45 knockdown muscles with defined striated pattern (C). The profiles along three consecutive sarcomeres are drawn using the rectangular area indicated in the corresponding images. For panels (A) and (C), the light grey vertical bars show the positions of the A-bands and the dark grey bars show the M-lines. In panel (B), the light grey bars are used to highlight the distinct peaks in SHG intensity since the images has no visible banding pattern. Scale bar represents 10 µm.
For comparison, profiles of SHG intensity, R- and C- ratios were taken along consecutive sarcomeres in UNC45 knockdown muscles. Muscles that lacked the striated pattern was first analyzed (Figure 3B). It was found throughout the profile that in regions that showed increases in SHG intensity, a lower R-ratio was observed. However, the distinct pattern seen in OreR muscles were absent. The R-ratio was found to vary between 0.7 and 0.9, which is significantly higher compared to OreR A-bands. The C-ratio was found to have no distinctive pattern in the muscle profile. UNC45 knockdown muscles that still exhibited striations were also analyzed (Figure 4C). Similar to OreR muscles, distinct peak in SHG intensity at the A-bands were observed in these muscles. The R-ratio profiles show a similar pattern to OreR, where the R-ratio was around 0.5 in the A-bands with an increase of the R values in the I-bands. Although the R-ratio was found to vary between 0.5 and 0.7, variation across the alternating bands were not as pronounced in these muscles compared to OreR. The C-ratio profiles followed similar pattern to the normal muscles, but the pattern was not as distinct. This suggest that although these muscles exhibit near normal banding pattern, there is still some disorder in the myosin filaments that causes changes in the muscle polarimetric properties.
Discussion
In this study, we used SHG microscopy to investigate ultrastructure of the muscle and found a significant decrease of SHG intensity in UNC45 knockdown muscle and severe changes in the banding pattern [13]. Quantitative polarization-based SHG microscopy was used to characterize the changes in UNC45 knockdown muscles. R-ratio was higher in UNC45 knockdown muscles that were severely affected, whereas muscles that still exhibited a striated pattern R-ratio was found to be lower in A-bands and not significantly different from OreR muscles. The variations of R-ratio FWHM distributions were much higher in the UNC45 muscle. The R-ratio profile of the UNC45 knockdown muscles exhibited no banding pattern in the severely disrupted muscles. The investigations of the profile of R-ratio along consecutive sarcomeres in wild-type muscle showed higher R values in the I-band. The R values in the I band corresponded to the R values in the mutant, where the myosin molecules were diminished. A significant difference in R values in the I-bands compared to A-bands in wild-type muscle suggests that there may be another protein that provides generation of second harmonic within the I band. It produces a significantly lower SHG signal when compared to myosin, however it has a higher R-ratio. There are two proteins in the I-bands that may potentially be picked up by SHG microscopy: actin and tropomyosin. Actin filaments remain in the UNC45 knockdown muscles where there is an increase in the R-ratio. Tropomyosin on the other hand has a helical structure and winds around actin filament, which fits the requirements for non-centrosymmetric arrangement with cylindrical symmetry resulting in a non-zero second harmonic response. Further investigation would be required to unambiguously determine which protein contributes to this increased R-ratio.
Chiral ratio measurements revealed that the A-band have positive and negative values on either side, usually canceling out toward the center as indicated by the light gray pixels. This demonstrates the opposite polarity arrangement in myosin molecules within the A band that can be detected, although the variation in the chiral ratio was much smaller when compared to collagen measurements. It was also observed that chiral ratio changes with tilt angle, which is consistent with the α angle dependency seen in Equation 2. The C-ratio was found to be affected by the changes in myosin accumulation. The bimodal arrangement of thick filaments observed in wild-type muscle was not detected in UNC45 muscles. UNC45 knockdown muscles that still exhibited striation had only small changes in the C-ratio profile, most probably due to increased filament disorder.
Polarimetric SHG microscopy was successfully used to characterize the changes in myosin accumulation in the Drosophila melanogaster larva body wall muscles, and corresponding ordering of myosin in the A bands. Furthermore, this study reveals a potential second molecular structure that contributes to the second order susceptibility of muscle. The SHG chiral ratio C of sarcomeres was relatively small, which enables to obtain R-ratios in a single-shot polarimetric experiment [16], that can be applied for dynamic studies of ultrastructure during muscle contractions.
Data Availability Statement
The imaging data are available upon reasonable request.
Author Contributions
The work was conceived, designed and planned by AK, VB, and BS. The manuscript was written, assembled, and prepared by AK, VB, and BS. AK performed the imaging. KM instigated the chiral ratio analysis method. AK performed all PIPO and chiral analyses. All authors read and approved final manuscript.
Funding
The investigation was supported by Natural Sciences and Engineering Research Council of Canada (NSERC) (RGPIN-2017-06923, DGDND-2017-00099, CHRPJ 462842-14, RGPIN-2020-05852), the Canadian Institutes of Health Research (CIHR) (CPG-134752), and European Regional Development Fund with the Research Council of Lithuania (01.2.2.-LMT-K-718-02-0016).
Conflict of Interest
The authors declare that the research was conducted in the absence of any commercial or financial relationships that could be construed as a potential conflict of interest.
Publisher’s Note
All claims expressed in this article are solely those of the authors and do not necessarily represent those of their affiliated organizations, or those of the publisher, the editors and the reviewers. Any product that may be evaluated in this article, or claim that may be made by its manufacturer, is not guaranteed or endorsed by the publisher.
Acknowledgments
Transgenic fly stocks were obtained from either Bloomington Drosophila Stock Center (https://bdsc.indiana.edu/) and the Vienna Drosophila Resource Center (VDRC, www.vdrc.at). Authors acknowledge help of Leonardo Uribe Castano, University of Toronto, with the laser setup.
References
1. Campagnola PJ, Millard AC, Terasaki M, Hoppe PE, Malone CJ, Mohler WA. Three-dimensional High-Resolution Second-Harmonic Generation Imaging of Endogenous Structural Proteins in Biological Tissues. Biophysical J (2002) 82(1):493–508. doi:10.1016/s0006-3495(02)75414-3
2. Chu S-W, Chen S-Y, Tsai T-H, Liu T-M, Lin C-Y, Tsai H-J, et al. In Vivo developmental Biology Study Using Noninvasive Multi-Harmonic Generation Microscopy. Opt Express (2003) 11:3093. doi:10.1364/oe.11.003093
3. Didier MEP, Macias-Romero C, Teulon C, Jourdain P, Roke S. Mapping of Real-Time Morphological Changes in the Neuronal Cytoskeleton with Label-free Wide-Field Second-Harmonic Imaging: a Case Study of Nocodazole. Neurophotonics (2019) 6:1. doi:10.1117/1.nph.6.4.045006
4. Mizutani G, Sonoda Y, Sano H, Sakamoto M, Takahashi T, Ushioda S. Detection of Starch Granules in a Living Plant by Optical Second Harmonic Microscopy. J Lumin (2000) 87-89:824–6. doi:10.1016/s0022-2313(99)00428-7
5. Boulesteix T, Beaurepaire E, Sauviat M-P, Schanne-Klein M-C. Second-harmonic Microscopy of Unstained Living Cardiac Myocytes: Measurements of Sarcomere Length with 20-nm Accuracy. Opt Lett (2004) 29(17):2031. doi:10.1364/ol.29.002031
6. Both M, Vogel M, Friedrich O, Wegner Fvon, Künsting T, Fink RHA, et al. Second Harmonic Imaging of Intrinsic Signals in Muscle Fibers In Situ. J Biomed Opt (2004) 9(5):882. doi:10.1117/1.1783354
7. Nadiarnykh O, Campagnola PJ. Retention of Polarization Signatures in SHG Microscopy of Scattering Tissues through Optical Clearing. Opt Express (2009) 17(7):5794–806. doi:10.1364/oe.17.005794
8. Greenhalgh C, Cisek R, Barzda V, Stewart B. Dynamic and Structural Visualization of Muscle Structure in drosophila with Multimodal Harmonic Generation Microscopy. In: Optics InfoBase Conference Papers; 19–22 March 2006; Fort Lauderdale, Florida United States (2006). doi:10.1364/bio.2006.wf6
9. Kontenis L, Samim M, Karunendiran A, Krouglov S, Stewart B, Barzda V. Second Harmonic Generation Double Stokes Mueller Polarimetric Microscopy of Myofilaments. Biomed Opt Express (2016) 7(2):559. doi:10.1364/boe.7.000559
10. Lodish H, Berk A, Zipursky S. Collagen: The Fibrous Proteins of the Matrix. Mol Cel Biol (2000).
11. Tzolovsky G, Millo H, Pathirana S, Wood T, Bownes M. Identification and Phylogenetic Analysis of Drosophila melanogaster Myosins. Mol Biol Evol (2002) 19(7):1041–52. doi:10.1093/oxfordjournals.molbev.a004163
12. Yu Q, Bernstein SI. UCS Proteins: Managing the Myosin Motor. Curr Biol (2003) Vol. 13:R525–R527. doi:10.1016/s0960-9822(03)00447-0
13. Karunendiran A, Nguyen CT, Barzda V, Stewart BA. Disruption of Drosophila Larval Muscle Structure and Function by UNC45 Knockdown. BMC Mol Cel Biol (2021) 22. doi:10.1186/s12860-021-00373-7
14. Golaraei A, Mirsanaye K, Ro Y, Krouglov S, Akens MK, Wilson BC, et al. Collagen Chirality and Three-Dimensional Orientation Studied with Polarimetric Second-Harmonic Generation Microscopy. J Biophotonics (2019) 12:e201800241. doi:10.1002/jbio.201800241
15. Tuer AE, Akens MK, Krouglov S, Sandkuijl D, Wilson BC, Whyne CM, et al. Hierarchical Model of Fibrillar Collagen Organization for Interpreting the Second-Order Susceptibility Tensors in Biological Tissue. Biophysical J (2012) 103(10):2093–105. doi:10.1016/j.bpj.2012.10.019
16. Golaraei A, Kontenis L, Karunendiran A, Stewart BA, Barzda V. Dual- and Single-Shot Susceptibility Ratio Measurements with Circular Polarizations in Second-Harmonic Generation Microscopy. J Biophotonics (2020) 3:e201960167. doi:10.1002/jbio.201960167
17. Golaraei A, Kontenis L, Mirsanaye K, Krouglov S, Akens MK, Wilson BC, et al. Complex Susceptibilities and Chiroptical Effects of Collagen Measured with Polarimetric Second-Harmonic Generation Microscopy. Sci Rep (2019) 9:12488. doi:10.1038/s41598-019-48636-w
18. Prent N, Cisek R, Greenhalgh C, Sparrow R, Rohitlall N, Milkereit M-S, et al. Applications of Nonlinear Microscopy for Studying the Structure and Dynamics in Biological Systems. In: Proceedings of SPIE - The International Society for Optical Engineering; 30 September 2005; Toronto, Canada (2005).
19. Prent N, Green C, Greenhalgh C, Cisek R, Major A, Stewart B, et al. Intermyofilament Dynamics of Myocytes Revealed by Second Harmonic Generation Microscopy. J Biomed Opt (2012) 13(4):041318. doi:10.1117/1.2950316
20. Tuer AE, Krouglov S, Prent N, Cisek R, Sandkuijl D, Yasufuku K, et al. Nonlinear Optical Properties of Type I Collagen Fibers Studied by Polarization Dependent Second Harmonic Generation Microscopy. J Phys Chem B (2011) 115(44):12759–69. doi:10.1021/jp206308k
21. Major A, Cisek R, Barzda V. Femtosecond Yb:KGd(WO4)2laser Oscillator Pumped by a High Power Fiber-Coupled Diode Laser Module. Opt Express (2006) 14(25):12163–8. doi:10.1364/oe.14.012163
22. Tuer A, Krouglov S, Cisek R, Tokarz D, Barzda V. Three-dimensional Visualization of the First Hyperpolarizability Tensor. J Comput Chem (2011) 32(6):1128–34. doi:10.1002/jcc.21694
23. Stewart BA, McLean JR. Population Density Regulates Drosophila Synaptic Morphology in a Fasciclin-II-dependent Manner. J Neurobiol (2004) 61:392–9. doi:10.1002/neu.20096
Keywords: nonlinear optical microscopy, second harmonic generation, nonlinear optical polarimetry, ultrastructural imaging, striated muscle, myofilaments
Citation: Karunendiran A, Mirsanaye K, Stewart BA and Barzda V (2022) Second Harmonic Generation Properties in Chiral Sarcomeres of Drosophila Larval Muscles. Front. Phys. 10:758709. doi: 10.3389/fphy.2022.758709
Received: 14 August 2021; Accepted: 03 January 2022;
Published: 04 February 2022.
Edited by:
Nirmal Mazumder, Manipal Academy of Higher Education, IndiaReviewed by:
Chiara Peres, Institute of Cell Biology and Neurobiology (CNR), ItalyRajesh Kumar, Indian Institute of Technology Ropar, India
Copyright © 2022 Karunendiran, Mirsanaye, Stewart and Barzda. This is an open-access article distributed under the terms of the Creative Commons Attribution License (CC BY). The use, distribution or reproduction in other forums is permitted, provided the original author(s) and the copyright owner(s) are credited and that the original publication in this journal is cited, in accordance with accepted academic practice. No use, distribution or reproduction is permitted which does not comply with these terms.
*Correspondence: Virginijus Barzda, virgis.barzda@utoronto.ca