Irreversible Thermodynamics and Bioeconomy: Toward a Human-Oriented Sustainability
 Umberto Lucia
 Giulia Grisolia
- Dipartimento Energia “Galileo Ferraris”, Politecnico di Torino, Torino, Italy
The present age is characterized by a very complex economic relationship among finance, technology, social needs, etc., which can be summarized in the word “sustainability.” The sustainable consumption and production policies represent the keys to realize sustainable development. But, the analysis of the carbon footprint data points out that the present economies are still carbon-consumption production. The reduction of greenhouse gasses emissions is based on a shift from fossil to renewable and bio-based industrial raw materials, with a related reorganization of the chains of the energy and manufacturing sectors. But, this requirement implies technological choices based on a sustainable measurement of their impacts on the ecological and economical contexts. So, social and economic requirements must also be taken into account by the decision-makers. Bioeconomy can represent a possible approach to deal with the requirements of the present time. But, new needs emerge in relation to sustainability. So, sustainable policies require new indicators, in order to consider the link among economics, technologies, and social well-being. In this paper, an irreversible thermodynamic approach is developed, in order to introduce a thermoeconomic indicator, based on thermodynamic optimization methods, but also on socioeconomic and ecological evaluations. The entropy production rate is introduced in relation to the CO2 emission flows from human activities, and it is related to the income index, in order to consider the economic and social equity. This approach is of interest of the researchers in the field of econophysics, thermoeconomy, economics, and bioeconomy.
1. Introduction
Classical economics has been developed from 1776, when Adam Smith published his famous treatment on the Wealth of Nations [1], to 1830–1875, with the aim to understand the economic and social changes, due to industrial revolution. Then, from 1850 to 1936, marginal economics [2] has been founded on the basis of exchange of goods or services. During the second decade of the twentieth century, the quantitative theory of money has highlighted the role played by the money on inflation [3].
The natural synthesis of these approaches became the neoclassical economics, which is an economic theory that excludes any crisis, because of the spontaneous corrections of prices in economy [4]. On the contrary, Keynesian economic school highlighted the fundamental role of production. In this approach, the crisis is a “natural” component of the economic system due to inconsistency between supply and demand: in this context, social and economic policies have become fundamental in order to reduce the related unemployment [5]. But, the Chicago school of economics rejects the usefulness of any state intervention [6].
As a consequence of all these economic schools, developed in order to understand a system in continuous evolution, other approaches have emerged [7]:
• The Harrod–Domar model [8–10]: It is a Keynesian model used in development economics in order to explain an economy growth rate, in terms of the level of saving and of capital. According to the Harrod–Domar model there are three kinds of growth:
• The warranted growth rate, which is the rate of growth at which the economy does not expand indefinitely, or goes into recession;
• The actual growth, which is the real rate increase in a country GDP per year;
• The natural growth, which is the growth, required by an economy to maintain full employment;
• The Solow–Swan model [11–13]: It is a neoclassical model of long-run economic growth, based on capital accumulation, labor or population growth, and increase in productivity. It introduces the requirement of technological progress [14].
Then, from 1930s, Georgescu-Roegen has developed a critical analysis of the difficulties of neoclassical economics, achieving, in the 1970s, to his analysis of the conflict among individual, social, and environmental values [15]. Georgescu-Roegen has introduced the Second Law of Thermodynamics, pointing out the dependence of humans on energy availability, with particular regard to the physical quantity of available energy [16], usually named exergy in thermodynamics.
Moreover, the Nobel laureate Joseph Stiglitz has recently pointed out both that growth is not sustainable, because we are destroying the environment, and that we must change our way to assess economic and social performances [17]. Consequently, a new economic paradigm is required; indeed, from one hand, the present economic indicators are not able to take into account the sustainable requirements, while, on the other hand, some new social and economic issues are coming relevant also in energy and industrial engineering.
In this context, with particular regard to sustainability and to global economy, a new thermodynamic approach to designing has been introduced, by taking into account the fundamental role of fluxes, configurations, patterns, and geometry [18–20]. Moreover, some analogies, between economic systems and thermodynamics, have been developed during the twentieth century, showing how economic quantities can be used to characterize the “thermodynamics” state of an economic system, by introducing physical concepts as entropy S, energy E, and exergy Ex, but also analogous analytical relationships as the Maxwell “thermoeconomic” equations and the Gibbs–Duhem equations [21–25].
Last, during the first two decades of the twenty-first century, new improvements, to the integration of economics and thermodynamics, have been developed, by introducing the non-equilibrium thermodynamics, and pointing out the cross-disciplinary foundations of sustainability, with the consequence to consider the economic growth as a natural process [26–28].
During the last decade, research on sustainability has improved its methodology, from theoretical approaches to application in diversified topics, such as understanding transitions, power generation, policies, society, culture, businesses, industries, ethical aspects, etc. [29].
In this context, bioeconomy can be considered in relation to its definition as the production, utilization, and conservation of biological resources, considering also the knowledge, science, technology, and innovation, as bases for information, products, processes and services, related to all economic sectors [30, 31]. Bioeconomy can be considered as a powerful approach to climate actions, income problems, etc. [32]. However, bioeconomic approach requires a measurement of its action [33–35], in order to evaluate the results, both in environmental sustainability and in socioeconomics [30, 36]. Of course, it is not possible to use the usual economic indicators, because the bioeconomic impacts require a new method of evaluation, related to social, economic, ecological but also technological indexes.
In recent years, the analysis and the measurement of the performance of sustainable transitions, at a regional level, have been improved [34, 37].
Decision makers have considered bioeconomy as a possible way to provide solutions to major economical, social, and ecological requirements [38]. Since 2012, European Commission and the EU Member States have designed their bioeconomic aims and strategies, but up today, the transition to bioeconomy has not yet been achieved [38, 39]. Consequently, the challenges, related to sustainability, remain still unsolved [29], as, for example, plastics, fuels, bio-based products [38]. So, biobased innovation was pointed out to be strictly related to any other topic of sustainability.
But, an open problem persists on which are the fundamental constituents of real-world economic phenomena [26, 39].
In this paper, in order to suggest a response to this problem, we develop an approach based on irreversible thermodynamics, considering the economic well-being and the pollution control as fundamental aims for human wellness (Figure 1). The approach introduced is developed in relation to the optimization of technological and industrial processes, by taking into account the use of the entropy production quantity, too.
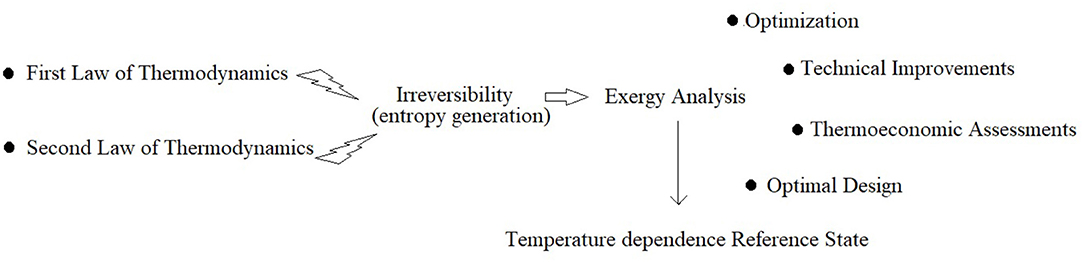
Figure 1. The methodological diagram is represented. It highlights that the basis of any technological analysis are the first and second law of thermodynamics. Irreversibility is a natural character of any process. It is evaluated by the entropy generation, which is also the fundamental quantity of the exergy analysis for optimization. This approach is improved by introducing also the income index for a more human-oriented analysis on sustainability. The limit of the approach is represented by the temperature dependence of the definition of exergy, which must be taken into account for any country and time.
2. Materials and Methods
In economics, indicators and indexes represent the main tools to assess performances by policy-makers, in order to analyze and compare trends of the different countries, for driving the attention to some specific topics. Indeed, an indicator is an instrument used to measure social and economic performances, both in quantitative and in qualitative ways, starting from the observation of reality, focused on the aspects that can disclose and enable comparisons [35, 40, 41].
In this section, we link our thermodynamic indicator [42] to the well-being and purchasing power. To do so, we consider that the interaction between technical and economical topics can be taken into account by introducing the following indicator [42]:
where the Second Law Inefficiency ηλ results are given as:
where Ẇλ is the power lost due to irreversibility and dissipation, and is the input exergy rate [19], and
is the energy intensity related to the power used, is the exergy rate used to obtained the level of GDP, which is the gross domestic product, and represents the well-being of a country or a productive system, and the labor productivity, LP, is defined as [43]:
where nwh = nw·nh is the total number of worked hours, needed to obtain the GDP, with nh number of worked hours and nw number of workers.
Here, we have introduced the exergy. Now, we develop some considerations on this thermodynamic quantity. Energy efficiency and its design are topics of interest of engineers, scientists, but also of economists and policy-makers [44]. Improving the efficiency of energy consuming systems represents a way to take into consideration the environmental impact, by reducing both pollution and resources consumption [45]. Indeed, interest in exergy analysis is continuously growing [44] due to its strictly link to the concept of availability. Exergy, Ex, is the thermodynamic quantity, which allows us to take into account the amount of energy really used in a process [46]. Indeed, the energy, available in a resource, cannot entirely be used in a process due to irreversibility [47]. The exergy approach allows us to improve the designing and the efficiency of any plant and process, when this quantity is used in optimization and control [47]. Exergy is a non-conservative quantity, which allows us to express the degradability of energy. In this way, it is related to irreversibility, which, in thermodynamics, is quantified by the entropy generation [48]. The difficulty, in the use of the exergy, consists of the care required for its calculation, because its value depends on the working temperature [49].
So, the relation (1) becomes:
Now, considering both that any process, interaction, etc., occurs in a definite time τ, the lifetime of the process, and that, for the Gouy–Stodola theorem [48], the work lost due to irreversibility and friction, Wλ, is proportional to the entropy variation due to irreversibility, the entropy generation Sg, the relation (5) becomes:
where ṁCO2 is the CO2 flux emitted to obtain the required effect Ẇ, and T0 is the environmental temperature. The relation (6) can be generalized as:
where f is the required sustainable effect.
Sustainability is also related to social equity. The latter is related to the purchase power of people. Consequently, now we are interested in linking the indicator of Equation (7) to the economic well-being of people. To do so, we consider that the total number of workers is strictly related to the gross national income. But, in order to consider the single person purchasing power, we can consider the gross national income per capita, GNIpc. So, we introduce our indicator of Equation (7), by taking also into account Equation (5), as follows:
where Ẇ is the useful power obtained by the process considered. Now, it is possible to relate the indicator with the normalized income index (II), used in the United Nations Development Program, which is defined as follows [50]:
where GNIpc is the gross national income per capita, with minimum and maximum value set as 100.00 $ and 75, 000.00 $, respectively. So, the indicator useful to link the environmental and the economic purchase power gives:
These last physical quantities can be obtained by a classical thermodynamic approach. Indeed, according to the first law of thermodynamics for the open systems, any energy variation, within the thermodynamic control volume, can be related to:
1. Flows of matter across the system control surface that cause variations in internal, chemical, potential, kinetic, and other forms of energy;
2. Heat through the system boundaries;
3. Work performed by or on the system.
3. Results
In this paper, we have introduced a bioeconomic indicator related to the irreversibility and to the economic well-being. In particular, as obtained in Equation (10), we have considered the irreversibility due to the anthropic carbon dioxide emissions and the income index.
Thus, in this section, we develop a first analysis based on the indicator introduced by considering some European countries, in order to show the trends of CO2 emissions, GNIpc, and IT, during the last three decades. Whereupon, we improve our analysis by including other countries in all continents, which are characterized by different levels of income, population, and carbon dioxide emissions.
In Figure 2, two graphs related to the time period 1990−2019, are presented, for the following European countries: Denmark, France, Germany, Italy, Norway, Spain, and Sweden:
• On the left side (Figure 2A), the amount of carbon dioxide emitted by each country is represented (the data have been obtained from [51]);
• On the right side (Figure 2B), it is shown the gross national income per capita, based on purchasing power parity (PPP), which allows us to compare different countries, at the same living standards (the data have been obtained from [52]).
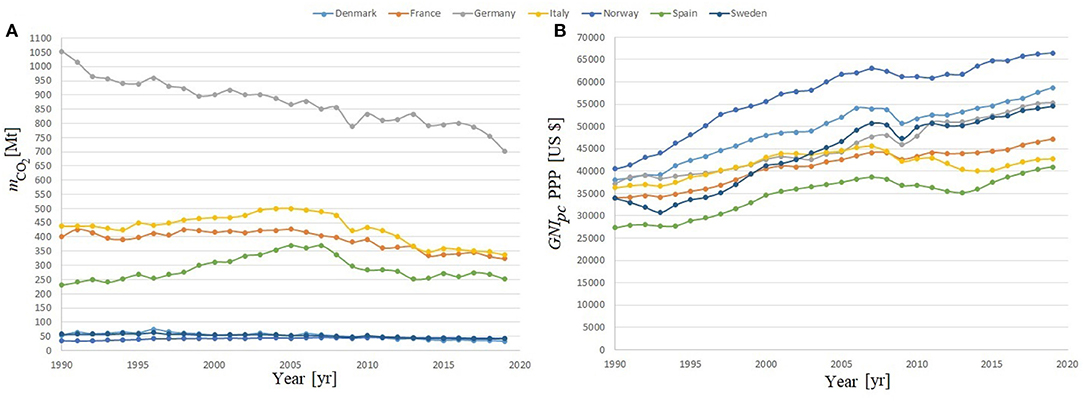
Figure 2. Some European Countries (Denmark, France, Germany, Italy, Norway, Spain, and Sweden) are analyzed during the time period 1990−2019: on the left graph (A), the carbon dioxide emissions [51], in Mt, is represented, while on the right graph (B), the GNIpc PPP at constant 2017 US $ is represented [52].
The reference year of our analysis is 1990, because in the Paris Agreement [53] (as well as in all the European legislation framework), the year 1990 is considered the reference date, for all considerations on the carbon dioxide emission targets. The total amount of anthropic carbon dioxide emissions by each country has been considered, in order to take into account their national footprint on the environment, at a global scale. From the related graph (Figure 2A), it is possible to highlight that an overall decreasing amount of carbon dioxide emissions trend has occurred during the time.
However, if we compare the greater and the least impacting countries, the range of their values is of two orders of magnitude. An overall percentage reduction, between 1990 and 2019, has been shown, and it results of 40% for Denmark, 23% for Italy, 33% for Germany, 19% for France, 25% for Sweden, respectively, while an increase percentage has been shown for Spain (9%) and Norway (20%).
The GNI per capita, based on PPP, is an economic indicator, converted to international dollars, by using the PPP rates. The use of international dollars allows us to consider the same purchasing power over the GNI as an USD in the United States, in a reference year (2017 for the analyzed case). The GNI considers the sum of value, added by all resident producers plus any product taxes (decreased by the value of subsides), not encompassed in the valuation of output, plus net receipts of primary income from abroad [52]. From the related graph (Figure 2B), we can point out that all the previous European countries, in the time interval 1990−2019, present an increasing trend: 54% for Denmark, 39% for France, 49% for Germany, 18% for Italy, 64% for Norway, 50% for Spain, and 61% for Sweden.
Thus, the trend of the proposed indicator, Equation (10), in relation to the same useful effect Ẇ (constant for all countries), can be evaluated. As concerns the annual average temperature, it has been calculated by using the World Bank temperature data [54] for each country. First, we have calculated the mean temperature value for each country (the World Bank data are organized by months), then we have obtained the specific entropy, for carbon dioxide, at the calculated temperature by means of the thermodynamic properties tables, related to carbon dioxide. The trend of the indicator is represented in Figure 3. It can be noticed that, for all countries, the indicator has decreased during the time period 1990−2019 of 54% for Denmark, 30% for Italy, 53% for Germany, 40% for France, 54% for Sweden, 22% for Spain, and 38% for Norway, respectively. This represents a positive result because the indicator must be as lower as possible in order to move toward sustainability. The overall variation, of the proposed indicator, results in accordance both with the efforts, of the European Countries, in reducing their carbon dioxide emissions, and with the trend of their GNI per capita.
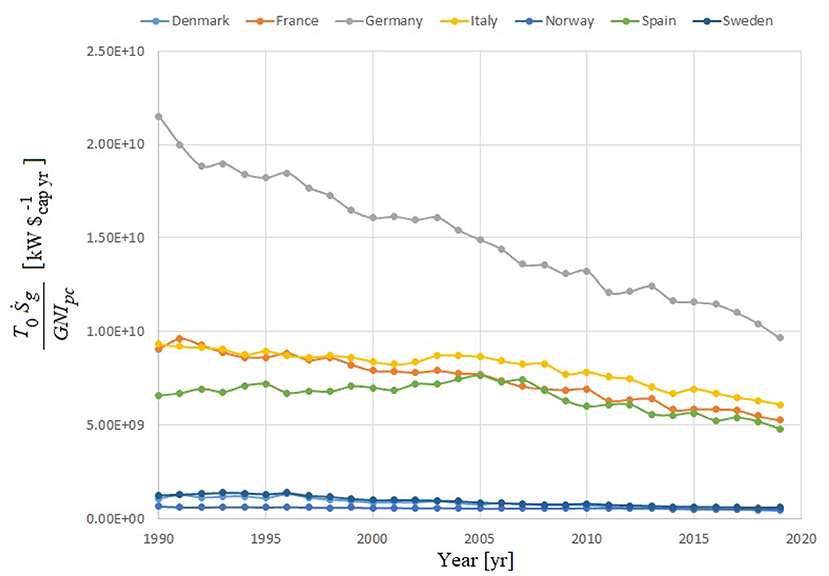
Figure 3. In this figure, the trend of the proposed indicator is shown, as presented in Equation (10), considering the same useful effect Ẇ. The mean temperature, for the reference period for each country, has been calculated by using the World Bank data [54], and the related specific entropy for the carbon dioxide has been calculated by means of its thermodynamic properties tables.
The lower is the value of the indicator, more sustainable is the process considered. Indeed, the indicator results directly proportional to the losses due to irreversibility.
Figure 4 represents the evaluation of the indicator in four different years (1990, 2000, 2010, and 2019), in order to show the evolution of the emissions, and the socioeconomic conditions of the countries considered. In order to show the use of the indicator, we have considered some representative countries from different geographical regions, with different income levels, according to the United Nations list [55]:
• High-income group: Australia, Belgium, Canada, Denmark, Finland, France, Germany, Greece, Italy, Japan, Norway, Spain, Sweden, and USA;
• Upper-middle-income group: Argentina, Brazil, China, Malaysia, Mexico, and South Africa;
• Lower-middle-income group Algeria, Ghana, India, and Senegal;
• Low-income group: Ethiopia.
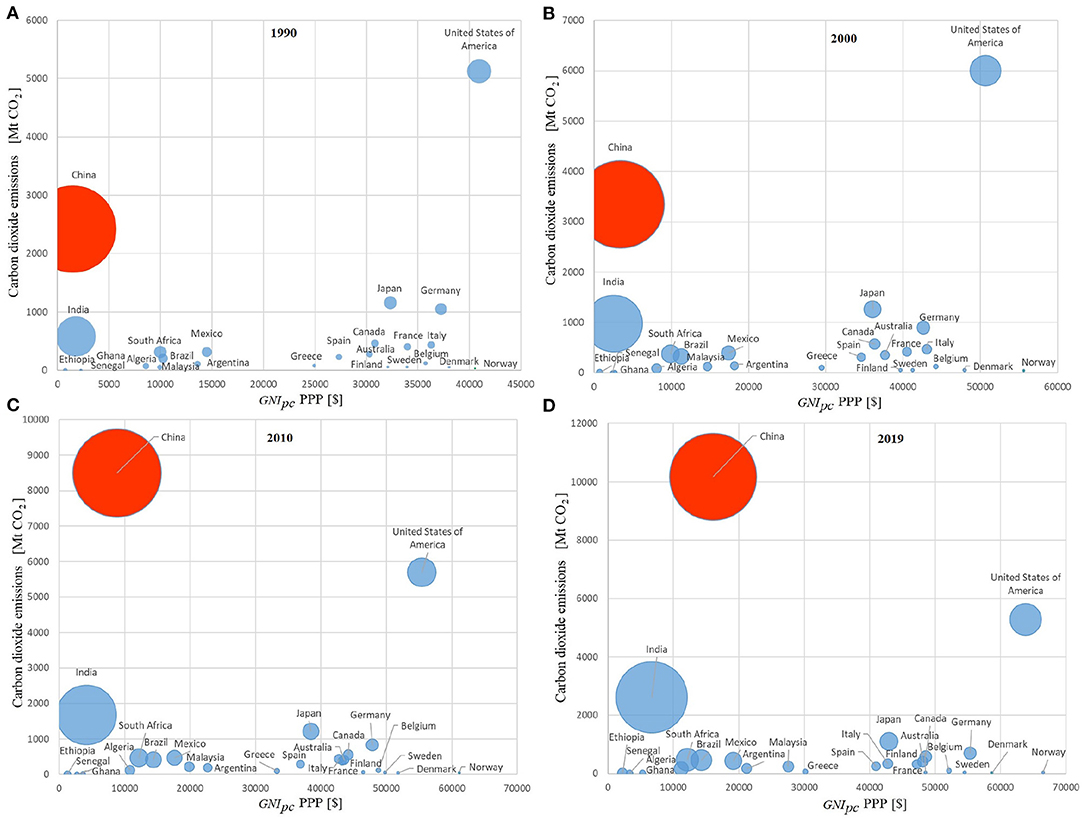
Figure 4. Four graphs related to four different years are represented, respectively: (A) 1990, (B) 2000, (C) 2010, and (D) 2019 — for the following countries: Algeria, Argentina, Australia, Belgium, Brazil, Canada, China, Denmark, Ethiopia, Finland, France, Germany, Ghana, Greece, India, Italy, Japan, Malaysia, Mexico, Norway, Senegal, South Africa, Spain, Sweden, and the United States. The horizontal axis shows the gross national income per capita, based on PPP in $ (at constant 2017 international $), the vertical axis represents the carbon dioxide emissions [MtCO2], while the size of each bubble is representative of the value of the indicator (calculated with Equation (10), considering the same useful effect Ẇ) for each country. Smaller is the bubble, more sustainable is the related country. A red bubble is used to show the efforts of the country (China) to move toward its industrial economic transition in order to improve the socioeconomic conditions. But, this implies an increase in the carbon dioxide emissions. So, new efforts must be made by this country to decrease its emissions, which means that its bubble must decrease its size and move to the bottom right position.
On the vertical axis, the carbon dioxide emissions are shown, while, on the horizontal axis, the gross national income per capita is represented. Each bubble corresponds to a country, while the country condition is represented by the bubble position on the graph: higher the bubble position is, higher the country emissions are, while more on the right the bubble is, better is the socioeconomic condition. The size of the bubble indicates the value of the indicator. So, for example, it is possible to point out that:
• China (highlighted with the red color to show better the analysis) has first considerably increased its emissions (about 990%), due to its industrial transition from 1990 up today, while, since 2010, it is improving its socioeconomic conditions; indeed, the indicator, represented by the bubble, is moving from the bottom left side to the high right position. In order to improve its environmental footprint, China should make efforts to move its indicator to the bottom right position, decreasing the bubble size;
• The United States has changed its carbon dioxide emissions, during the time period considered, and in 2019, the values are comparable with those of 1990 (vertical axis). However, the bubble has moved to the right side of the graph, which means having improved the socioeconomic conditions. Moreover, the size of the bubble (the value of the indicator) has been reduced of about 35%, in comparison to the 1990 reference;
• India presents a different condition; indeed, its carbon dioxide emissions have increased, in the time period considered, of more than 350% as well as their gross national income per capita (about 274%), but the indicator has increased of about 20%. This means that, despite the efforts in the development of the India, the improvement in the socioeconomic conditions and the reduction in its environmental impact require more relevant actions toward sustainability;
• Ghana has increased its gross national income per capita of around 128%, but this has happened with a high environmental impact (increase of carbon dioxide emissions of about 300%). Consequently, the indicator results 70% higher in comparison to the 1990 value.
So, our indicator is related to a natural evolution of the processes, due to its strictly link with entropy generation, which is a thermodynamic quantity used to describe also the spontaneous evolution of the natural processes [20, 56]. Moreover, entropy and entropy generation represent the bases of the modern engineering thermodynamics and optimization methods [48]. So, this quantity results at the same time fundamental from a technical standpoint.
Our result allows us to analyze the technological processes, by using a holistic approach, just based on the entropy generation method: it considers all the interactions internal to the process [42], with the result of a quantitative evaluation of the flows, of matter and energy, through the border of the system considered. It takes also into account the related consumption rate of the available resources, as required in order to develop an indicator for sustainability [57].
Up to now, the social and the environmental systems have always been considered separately, even if it is clear that they are in continuous interaction. Our result is an indicator that introduces the entropy approach into economic analysis of sustainability, but it also allows us to consider the needs of people, in relation to their well-being.
As a consequence of the indicator definition, a process is consider sustainable if the value of the indicator is as low as possible.
4. Discussion
The degree of sustainability, the socioeconomic parameters, and the natural capital are not easily quantified. Consequently, the quantification of sustainability remains a relevant open problem [57]. Moreover, resources consumption can be quantified solely by using the exergy flows [57].
Ecological economics has pointed out some aspects of human activities, which classical and neoclassical economics often ignore; indeed, ecological economics is based on the requirements of social and biophysical systems. Moreover, up to now, ecological economics has focused on the biophysical interactions in economics. But, sustainable development requires a deeper analysis of the system in order to make difficult decisions in relation to both natural and social environment [58].
The new related requirement is to understand how to evaluate resources, industrial activities, and services for the human well-being in order to allow social and economic institutions to make the best use of these and other forms of capital [14].
In particular, in all the human history, the use of energy has represented a key factor for the development. Moreover, the development has always addressed to human well-being, which is related to socioeconomic conditions [59].
Since the First Industrial Revolution, power has always been related to the use of the fossil fuels. But, nowadays, considerations, on environment and sustainability, have generated some concerns in relation to the use of fossil fuels. Indeed, the increase in greenhouse gasses and pollutant emissions, in addition to the depletion of fossil fuel resources, are driving the scientific research toward alternative energy resources, but also new technological solutions, in order to reduce pollutant emissions.
Of course, these new requirements lead to new ways of evaluation of the technologies used. But, on the other hand, sustainability drives to consider also human equity and well-being. So, any indicator for policy-makers must consider together ecological and social constraints.
Recently, a link, between bioeconomy and the 2030 Sustainable Development Agenda, has been highlighted by exploring the potentials of using Sustainable Development Goals indicators in order to evaluate the bioeconomic impacts [30, 34, 35]. This link varies in relation to the strategic objectives that a country selects for its bioeconomy, highlighting the complex relation between the different issues of sustainability [38, 41]. Policies play a key role in relation to bioeconomic improvement for sustainability [38]. But, policy-makers need some quantitative way to support their decisions. In this context, our indicator results interesting because it allows the economists and the decision-makers to evaluate the socioeconomic effect, in relation to the technical processes optimization, and ecological needs, or vice versa.
The environmental aspects are fundamental for sustainable development of bioeconomy [60]. These aspects are related to the natural constraints [61], also in relation to the technologies involved. In particular, irreversibility plays a fundamental role in all these issues. In thermodynamics, entropy generation is the physical quantity used to take into account irreversibility in any process.
Sustainability requires innovation in all the production chains, but this implies large-scale and long-term investments [62, 63]. Indeed, some sectors require policy and investment decision in order to expand their capacities. For example:
• Agriculture and forestry sectors require infrastructure for logistics and storage;
• Biorefinery industries are rapidly growing for chemical, pharmaceutical, fuel, and building materials sectors;
• Waste management sectors grow for recycling of products after use.
Here, we have suggested an indicator that links together the entropy generation rate, related to optimization, and the income index, related to people well-being. In this way, we suggest an approach that responds to the previous requirements of an indicator for sustainability.
Now, in conclusion, we can submit some considerations on the present time. SARS-CoV-2 pandemic represents an economic slow-down, for the whole 2020 up today. In the future, all the countries must have an economic restart. This could be the right time to reconsider the pre-pandemic production processes and systems in view of realizing a bioeconomic development. Indeed, the present expected financial investments, in support to the economic restart, could represent a resource for a new “Renaissance,” based on research, ecology, sustainability, but more than anything else, focused on a human oriented development.
Data Availability Statement
Publicly available datasets were analyzed in this study. This data can be found here: https://databank.worldbank.org/reports.aspx?source=2&type=metadata&series=EN.ATM.CO2E.KT#advancedDownloadOptions, https://climateknowledgeportal.worldbank.org/download-databan, https://data.worldbank.org/indicator/NY.GNP.PCAP.PP.KD, https://doi.org/10.5194/essd-12-3269-2020.
Author Contributions
UL: conceptualization, methodology, formal analysis, investigation, writing—original draft, writing—review and editing, supervision, project administration, and funding acquisition. GG: methodology, investigation, resources, writing—review and editing, visualization, data curation, and validation. All authors contributed to the article and approved the submitted version.
Conflict of Interest
The authors declare that the research was conducted in the absence of any commercial or financial relationships that could be construed as a potential conflict of interest.
References
2. Veblen T. Why is economics not an evolutionary science. Q J Econ. (1898) 12:373–97. doi: 10.2307/1882952
5. Keynes JM. The General Theory of Employment, Interest and Money. Basingstoke: Palgrave Macmillan (1936).
7. Ferguson BS, Lim GC. Introduction to Dynamic Economic Models. Manchester: Manchester University Press (1998).
10. Domar E. Capital expansion, rate of growth, and employment. Econometrica. (1946) 14:137–47. doi: 10.2307/1905364
12. Solow RM. A contribution to the theory of economic growth. Q J Econ. (1956) 70:65–94. doi: 10.2307/1884513
13. Solow RM. Georgescu-Roegen versus Solow/Stiglitz. Ecol Econ. (1997) 22:267–8. doi: 10.1016/S0921-8009(97)00081-5
15. Gowdy J, Mesner S. The evolution of Georgescu-Roegen's bioeconomics. Rev Soc Econ. (1998) 56:136–56. doi: 10.1080/00346769800000016
16. Georgescu-Roegen N. The Entropy Law and the Economic Process. Cambridge: Harvard University Press (1971). doi: 10.4159/harvard.9780674281653
17. Stiglitz JE, Fitoussi JP, Durand M. Measuring What Counts: The Global Movement for Well-Being. New York, NY: The New Press (2019).
18. Bejan A. Why we want power: economics is physics. Int J Heat Mass Transfer. (2012) 55:4929–35. doi: 10.1016/j.ijheatmasstransfer.2012.05.046
19. Bejan A, Lorente S. The constructal law and the evolution of design in nature. Phys Life Rev. (2011) 8:209–40. doi: 10.1016/j.plrev.2011.05.010
20. Bejan A, Zane JP. Design in Nature: How the Constructal Law Governs Evolution in Biology, Physics, Technology and Social Organization. New York, NY: Doubleday (2012).
21. Saslow WM. An economic analogy to thermodynamics. Am J Phys. (1999) 67:1239–47. doi: 10.1119/1.19110
22. Herniter J. An Entropy Model of Brand Purchase Behavior. Cambridge: Marketing Science Institute (1972). doi: 10.2307/3149383
23. Batten DF. Spatial Analysis of Interacting Economies: The Role of Entropy and Information Theory in Spatial-Input Modelling. Boston, MA: Kluwer-Nijhoff (1983). doi: 10.1007/978-94-017-3040-2_2
24. Foley DK. A statistical equilibrium theory of markets. J Econ Theory. (1994) 62:321–45. doi: 10.1006/jeth.1994.1018
25. Mandelbrot BB. Fractals and Scaling in Finance: Discontinuity, Concentration, Risk. New York, NY: Springer-Verlag (1997). doi: 10.1007/978-1-4757-2763-0
26. Herrmann-Pillath C. Energy, growth, and evolution: towards a naturalistic ontology of economics. Ecol Econ. (2015) 119:432–42. doi: 10.1016/j.ecolecon.2014.11.014
27. Herrmann-Pillath C. The evolutionary approach to entropy: reconciling Georgescu-Roegen's natural philosophy with the Maximum Entropy framework. Ecol Econ. (2011) 70:606–11. doi: 10.1016/j.ecolecon.2010.11.021
28. Herrmann-Pillath C. Foundations of Economic Evolution. A Treatise on the Natural Philosophy of Economics. Cheltenham; Northampton: Edward Elgar (2013).
29. Köhler J, Geels FW, Kern F, Markard J, Onsongo E, Wieczorek A, et al. An agenda for sustainability transitions research: state of the art and future directions. Environ Innovat Soc Trans. (2019) 11:1–32. doi: 10.1016/j.eist.2019.01.004
30. Calicioglu O, Bogdanski A. Linking the bioeconomy to the 2030 sustainable development agenda: can SDG indicators be used to monitor progress towards a sustainable bioeconomy? N Biotechnol. (2021) 61:40–9. doi: 10.1016/j.nbt.2020.10.010
31. Wydra S. Value chains for industrial biotechnology in the bioeconomy-innovation system analysis. Sustainability. (2019) 11:2435. doi: 10.3390/su11082435
32. Bracco S, Calicioglu O, San Juan MG, Flammini A. Assessing the contribution of bioeconomy to the total economy: a review of national frameworks. Sustainability. (2018) 10:1698. doi: 10.3390/su10061698
33. Calicioglu O, Bogdanski A, San Juan MG. Indicators to Monitor and Evaluate the Sustainability of Bioeconomy Development. Rome: Food and Agriculture Organization of the United Nations (2019).
34. D'Adamo I, Falcone PM, Imbert E, Morone P. Exploring regional transitions to the bioeconomy usinga socio-economic indicator: the case of Italy. Econ Politica. (2020) 1–33. doi: 10.1007/s40888-020-00206-4
35. Cucchiella F, D'Adamo I, Gastaldi M, Koh SL, Rosa P. A comparison of environmental and energetic performance of European countries: a sustainability index. Renew Sustain Energy Rev. (2017) 78:401–13. doi: 10.1016/j.rser.2017.04.077
36. Bracco S, Calicioglu O, Flammini A, San Juan MG, Bogdanski A. Analysis of standards, certifications and labels for bio-based products in the context of sustainable bioeconomy. Int J Standard Res. (2019) 17:1–22. doi: 10.4018/IJSR.2019010101
37. D'Adamo I, Falcone PM, Morone P. A new socio-economic indicator to measure the performance of bioeconomy sectors in Europe. Ecol Econ. (2020) 176:106724. doi: 10.1016/j.ecolecon.2020.106724
38. Wydra S, Hüsing B, Köhler J, Schwarz A, Schirrmeister E, Voglhuber-Slavinsky A. Transition to the bioeconomy-analysis and scenarios for selected niches. J Clean Product. (2021) 294:126092. doi: 10.1016/j.jclepro.2021.126092
39. Falcone PM, Imbert E. Tackling uncertainty in the bio-based economy. Int J Standard Res. (2019) 17:74–84. doi: 10.4018/IJSR.2019010105
40. OECD JRC. Handbook on Constructing Composite Indicators- Methodology and User Guide. Paris: OECD Publishing (2008).
41. Morone P. Sustainability transition towards a biobased economy: defining, measuring and assessing. Sustainability. (2018) 10:2631. doi: 10.3390/su10082631
42. Lucia U, Grisolia G. Exergy inefficiency: an indicator for sustainable development analysis. Energy Rep. (2019) 5:62–9. doi: 10.1016/j.egyr.2018.12.001
43. Zhang TW, Dornfeld DA. Energy use per worker-hour: evaluating the contribution of labor to manufacturing energy use. In: Takata S, Umeda Y, editors. Advances in Life Cycle Engineering for Sustainable Manufacturing Businesses. London: Springer-Verlag (2007). p. 189–93. doi: 10.1007/978-1-84628-935-4_33
44. James C, Kim TY, Jane R. A review of exergy based optimization and control. Processes. (2020) 8:364. doi: 10.3390/pr8030364
45. BoroumandJazi G, Saidur R, Rismanchi B, Mekhilef S. A review on the relation between the energy and exergy efficiency analysis and the technical characteristic of the renewable energy systems. Renew Sustain Energy Rev. (2012) 16:3131–5. doi: 10.1016/j.rser.2012.02.057
46. Dincer I, Cengel Y. Energy, entropy and exergy concepts and their roles in thermal engineering. Entropy. (2001) 3:116–49. doi: 10.3390/e3030116
49. Morris DR, Szargut J. Standard chemical exergy of some elements and compounds on the planet earth. Energy. (2086) 11:733–55. doi: 10.1016/0360-5442(86)90013-7
50. Pinar M, Stengos T, Topaloglou N. Testing for the implicit weights of the dimensions of the Human Development Index using stochastic dominance. Econ Lett. (2017) 161:38–42. doi: 10.1016/j.econlet.2017.09.023
51. Friedlingstein F. The Global Carbon Budget 2020. Earth System Science Data (2020). doi: 10.5194/essd-12-3269-2020
52. World Bank Group. GNI per capita, PPP (Constant 2017 International). (2021). Available online at: https://data.worldbank.org/indicator/NY.GNP.PCAP.PP.KD (accessed January 25, 2021).
54. World Bank Group. Climate Change Knowledge Portal- Temperature Data. (2021). Available online at: https://climateknowledgeportal.worldbank.org/download-data (accessed January 25, 2021).
56. Bejan A. Entropy generation minimization: the new thermodynamics of finite-size devices and finite-time processes. J Appl Phys. (1996) 79:1191. doi: 10.1063/1.362674
57. Sciubba E, Zullo F. Is sustainability a thermodynamic concept? Int J Exergy. (2011) 8:68–85. doi: 10.1504/IJEX.2011.037215
58. Dodds S. Towards a ‘science of sustainability': improving the way ecological economics understands human well-being. Ecol Econ. (1997) 23:95–111. doi: 10.1016/S0921-8009(97)00047-5
59. Cleveland CJ, Costanza R, Hall CAS, Kaufmann RK. Energy and the U.S. economy: a biophysical perspective. Science. (1984) 225:890–7. doi: 10.1126/science.225.4665.890
60. e GL, Chenc X, Streimikiene D, Balezentis T. The trends in bioeconomy development in the European Union: exploiting capacity and productivity measures based on the land footprint approach. Land Use Policy. (2020) 91:104375. doi: 10.1016/j.landusepol.2019.104375
61. Liobikiene G, Dagiliute R. The relationship between economic and carbon footprint changes in EU: the achievements of the EU sustainable consumption and production policy implementation. Environ Sci Policy. (2016). 61:204–11. doi: 10.1016/j.envsci.2016.04.017
62. Kircher M. Bioeconomy - present status and future needs of industrial value chains. N Biotechnol. (2021) 60:96–104. doi: 10.1016/j.nbt.2020.09.005
63. Kircher M. Implementing the bioeconomy in a densely populated and industrialized country. Adv Indus Biotechnol. (2018) 1:3–11. doi: 10.24966/AIB-5665/100003
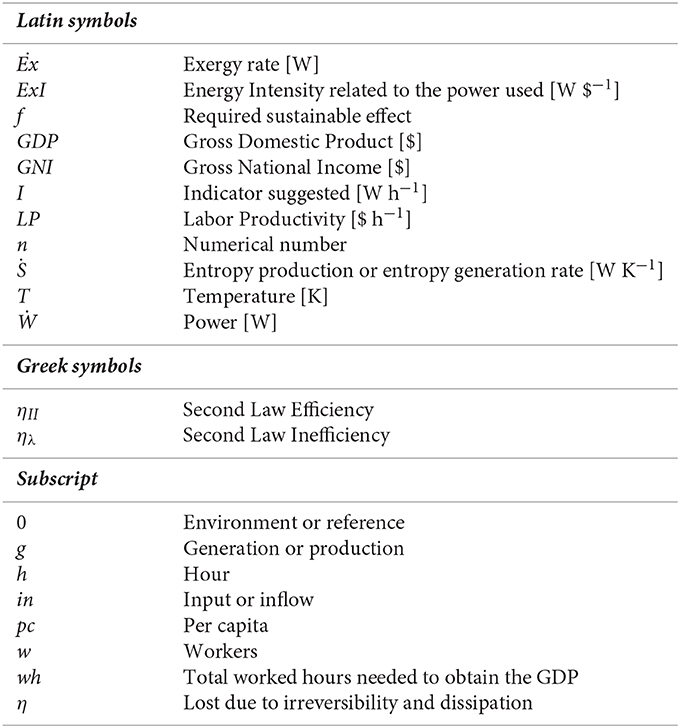
Nomenclature
Keywords: bioeconomy, income index, irreversible thermodynamics, optimization, sustainability
Citation: Lucia U and Grisolia G (2021) Irreversible Thermodynamics and Bioeconomy: Toward a Human-Oriented Sustainability. Front. Phys. 9:659342. doi: 10.3389/fphy.2021.659342
Received: 28 January 2021; Accepted: 09 March 2021;
Published: 04 May 2021.
Edited by:
Valerio Capraro, Middlesex University, United KingdomReviewed by:
Tomasz Twardowski, Institute of Bioorganic Chemistry (PAS), PolandIdiano D'Adamo, Sapienza University of Rome, Italy
Copyright © 2021 Lucia and Grisolia. This is an open-access article distributed under the terms of the Creative Commons Attribution License (CC BY). The use, distribution or reproduction in other forums is permitted, provided the original author(s) and the copyright owner(s) are credited and that the original publication in this journal is cited, in accordance with accepted academic practice. No use, distribution or reproduction is permitted which does not comply with these terms.
*Correspondence: Umberto Lucia, umberto.lucia@polito.it