 Jinha Park1,2†
 Se Hee Kim3†
 Jongsung Hahn4
 Hoon-Chul Kang3
 Sang-Guk Lee5
 Heung Dong Kim3,6*‡
 Min Jung Chang1,2,7*‡
- 1Department of Pharmaceutical Medicine and Regulatory Science, Colleges of Medicine and Pharmacy, Yonsei University, Seoul, Republic of Korea
- 2Department of Pharmacy, College of Pharmacy, Yonsei Institute of Pharmaceutical Sciences, Yonsei University, Seoul, Republic of Korea
- 3Pediatric Neurology, Department of Pediatrics, Yonsei University College of Medicine, Severance Children’s Hospital, Epilepsy Research Institute, Seoul, Republic of Korea
- 4Department of Pharmacy, Jeonbuk National University, Jeonju, Republic of Korea
- 5Department of Laboratory Medicine, Severance Hospital, Yonsei University College of Medicine, Seoul, Republic of Korea
- 6Department of Pediatrics, Kangbuk Samsung Hospital, Sungkyunkwan University, Seoul, Republic of Korea
- 7Graduate Program of Industrial Pharmaceutical Science, Yonsei University, Incheon, Republic of Korea
Background: Everolimus is an inhibitor of mammalian target of rapamycin complex 1. As mutations in TSC1 and TSC2, which cause partial-onset seizures associated with TSC, were found in focal cortical dysplasia type Ⅱ (FCD Ⅱ) patients, a clinical trial has been performed to explore the efficacy and safety of everolimus in FCD patients. However, no dosage regimen was determined to treat FCD II. To recommend an optimal dose regimen for FCD patients, a population pharmacokinetic model of everolimus in FCD patients was developed.
Methods: The data of everolimus were collected from September 2017 to May 2020 in a tertiary-level hospital in Korea. The model was developed using NONMEM® software version 7.4.1 (Icon Development Solutions, Ellicott City, MD, United States).
Results: The population pharmacokinetics of everolimus was described as the one-compartment model with first-order absorption, with the effect of BSA on clearance. The final model was built as follows: TVCL = 12.5 + 9.71 × (BSA/1.5), TVV = 293, and TVKA = 0.585. As a result of simulation, a dose higher than 7 mg/m2 is needed in patients with BSA 0.5 m2, and a dose higher than 6 mg/m2 is needed in patients with BSA 0.7 m2. A dose of 4.5 mg/m2 is enough in the population with BSA higher than 1.5 m2 to meet the target trough range of 5–15 ng/mL.
Conclusion: Based on the developed pharmacokinetics model, the optimal dose of everolimus in practice was recommended by considering the available strengths of Afinitor disperz®, 2 mg, 3 mg, and 5 mg.
1 Introduction
Everolimus is an inhibitor of mammalian target of rapamycin complex 1 (mTORC1), which play a role as an immunosuppressive and antineoplastic drug indicated for various organ transplantations and tumors. It inhibits the interaction between mTORC1 and FK506-binding protein-12 (FKBP-12) by binding to FKBP-12 with high affinity (Gabriele et al., 2004; Sánchez-Fructuoso, 2008). The downstream signaling related to cell cycle and glycolysis is altered, and the growth of tumor is inhibited consequently.
Based on the etiology of the tuberous sclerosis complex (TSC), which is related to mutations in oncogene suppressor TSC1 and TSC2 genes causing overactivation of mTOR, a randomized clinical trial examining Everolimus in a Study of Tuberous Sclerosis Complex (EXIST-3) was performed to evaluate the efficacy and safety of everolimus as an adjuvant treatment for seizures in TSC patients (French et al., 2016). As a result, in 2018, Afinitor disperz® (Novartis Pharmaceuticals Corporation) was approved for adjunctive treatment of adults and pediatrics older than 2 years with partial-onset seizure associated with TSC. The initial dose regimen was decided by age and the presence of the concomitant CYP3A4/P-glycoprotein inducer, which ranged from 3 mg/m2 to 6 mg/m2 once daily. The efficacy of reducing the frequency of seizures was shown in both low and high target trough concentration ranges, 3–7 ng/mL and 9–15 ng/mL, respectively.
Focal cortical dysplasia (FCD), which is characterized by abnormal development of the cerebral cortex, is one of the most important causes of refractory epilepsy which does not respond to conventional antiepileptic drugs in pediatrics (Sanjay et al., 2009). FCD is classified into three types by neuropathological features: FCD Ⅰ presenting radial- and/or tangential-shaped dyslamination of the cortex, FCD Ⅱ presenting cortical dyslamination and dysmorphic neurons, and FCD Ⅲ related to other brain lesions (Blümcke et al., 2011).
There are many studies showing that FCD Ⅱ is related to the hyperactivation of the mTOR pathway (Baybis et al., 2004; Miyata et al., 2004; Ljungberg et al., 2006). Furthermore, in 2017, mutations in TSC1 and TSC2 that cause partial-onset seizures associated with TSC were found in FCD Ⅱ patients (Lim et al., 2015; Lim et al., 2017). Recently, a pilot study to determine the safety and mechanism of the action of everolimus in patients with TSC and FCD was reported (Fouladi et al., 2007; Dirk Jan et al., 2012; de Wit et al., 2016; Leitner et al., 2022). This allows us to hypothesize that everolimus, an mTOR inhibitor, can be used as a treatment of refractory seizures associated with FCD. The pharmacokinetics (PK) of everolimus was reported using both one- and two-compartment models (Atsuko Tanaka et al., 2016; Combes et al., 2018; Dirk Jan et al., 2012)). A population PK study based on EXIST-1, -2, and -3 reported that a two-compartment model with first-order absorption and body surface area showed that CYP3A or P-gp inducers increased the clearance of everolimus (Combes et al., 2018). However, no PK was reported in patients with FCD II, and no dosage regimen has been determined yet.
The purpose of this study is to develop a population pharmacokinetic model of everolimus in patients with seizures associated with focal cortical dysplasia (FCD) type Ⅱ, analyzing clinical covariates to suggest an optimal dose regimen for this population.
2 Materials and methods
2.1 Study design and population
This analysis was performed with data available from a double-blinded crossover randomized clinical trial conducted at Severance Hospital in Seoul, Republic of Korea, from 2017 to 2020. The study protocol was approved by the Institutional Review Board (IRB NO. 4-2017-0299) of Severance Hospital. To obtain everolimus concentrations drawn at the time after dose from January 2020 to May 2020, an additional study protocol was approved by the Institutional Review Board (IRB NO. 4-2019-1232) of Severance Hospital. All participants and the legal surrogates provided written informed consent which explained the purpose and details of the study.
The inclusion and exclusion criteria for participants are described in the Supplementary Material. The clinical trial consists of the following four phases: baseline for 4 weeks, core Ⅰ for 12 weeks, core Ⅱ for 12 weeks, and extension phase for 29 weeks. After screening in the baseline phase for 4 weeks, patients were assigned randomly to one of two groups: everolimus (Afinitor disperz®, tablet for oral suspension) or placebo. After being administered with everolimus or placebo for core phase Ⅰ, patients received the other treatment, by crossover, for core phase Ⅱ. Only patients who agreed to participate in the extension phase were administered with everolimus until the completion of the trial.
2.2 Drug dosage and data collection
The initial dose of everolimus was 4.5 mg/m2/day, which was used as an effective and safe dose in the EXIST-1 study (Franz et al., 2013). The target range of trough concentration was 5–15 ng/mL, and dose adjustment was performed through TDM for patients with a trough concentration lower or higher than the target range. The increase or decrease in the adjusted dose was 2 mg. Patients were administered with everolimus (Afinitor disperz®, tablet for oral suspension) once daily at the set time. Patients were also administered with more than one antiepileptic drug concomitantly. The specific products and doses of the concomitant antiepileptic drugs were not changed during the baseline and core phases.
The following data were collected from September 2017 to May 2020: the amount of everolimus administered, the actual time of administration, the actual time of sampling, the concentrations of everolimus, age, sex, weight (kg), body surface area (BSA, m2), serum creatinine (mg/dL), ALT (IU/L), AST (IU/L), hemoglobin (g/dL), hematocrit (%), RBC (106/μL), albumin (g/dL), and the presence of concomitant CYP3A4 inducer and inhibitor (strong, moderate, and weak) (Supplementary Table S1).
2.3 Sampling strategy and bioanalysis
Blood samples for therapeutic drug monitoring were collected before administration and at weeks 2, 3, 4, and 8 in core phase Ⅰ, at weeks 14, 15, 16, and 20 in core phase Ⅱ, and at weeks 25, 28, and 40 in the extension phase. Additional blood samples were collected at any time from 1 to 4 h after dose at weeks 24, 28, or 40 in the extension phase. Each drawn sample was 1 mL or 2 mL in volume for patients under or over the age of 6 years, respectively. Immediately after collection, the samples were placed in EDTA tubes.
The concentrations of everolimus were measured by validated high-performance liquid chromatography/tandem mass spectrometry (HPLC/MS/MS) using an Agilent 1260 (Agilent Technologies, CA, United States) coupled with an API 4000 (Sciex, Concord, Ontario, Canada). Then, 50 μL of deionized water and 50 μL of 0.1 M ZnSO4 were added to 50 μL of sample, and the mixture was vortexed for 15 s. 5 μL each of ascomycin, sirolimus-d3, cyclosporin D, and everolimus-d4 as an internal standard and 130 μL of methanol were added to the mixture. After vortexing for 60 s, the mixture was centrifuged at 14,000 rpm for 10 min. Chromatographic separation was performed on a Guard column and a C8 column (4
2.4 Population pharmacokinetic analysis
Population pharmacokinetic modeling was conducted using the first-order conditional estimation method with the eta–epsilon interaction (FOCE + I) algorithm in NONMEM® software version 7.4.1 (Icon Development Solutions, Ellicott City, MD, United States) assisted by Perl-speaks-NONMEM (PsN, version 4.7.0), Pirana (version 2.9.7, Certara, NJ, United States), and Xpose4 (version 4.6.1) embedded in R (version 3.5.1; http://www.r-project.org/).
One- and two-compartmental PK models with first-order absorption were evaluated for a potential structural model using subroutines ADVAN2 TRANS2 and ADVAN4 TRANS4 in the NONMEM library, respectively. Inter-individual variability (η) was estimated with an exponential error model as follows:
where θi is the individual PK parameter for the ith individual, θPOP is the population PK parameter, and ηi is a random variable of PK parameter which is assumed to follow a log-normal distribution with a mean of zero and a variance of ω2.
Intra-individual variability (ε) was estimated with an additive, proportional, and a combined model as follows:
where Cij is the jth observed concentration for the ith individual, Cpredij is the corresponding predicted concentration, and εij,additive and εij,proportional are random variables which are assumed to follow a normal distribution with a mean of zero and a variance of σ2. The best fitted base model was selected based on the minimum of the objective function value (OFV), which is statistically equivalent to the −2log likelihood, visual inspection on the basic goodness of fit plots, and the plausibility of relative standard errors. The criterion of a statistically significant decrease in OFV was 3.84 (χ2 distribution, degrees of freedom = 1, p-value<0.05). The basic goodness-of-fit plots comprised four types of plots: observed concentration versus individual predicted concentration, observed concentration versus population predicted concentration, conditional weighted residuals (CWRES) versus population predicted concentration, and conditional weighted residuals (CWRES) versus time. Individual concentration–time plots and the eigenvalue of the models were also explored.
To explain the inter-individual variability of PK parameters, the following 14 potential covariates were evaluated: age (years), sex (0 for male; 1 for female), weight (kg), BSA (m2), serum creatinine (mg/dL), ALT (IU/L), AST (IU/L), hemoglobin (g/dL), hematocrit (%), RBC (106/μL), albumin (g/dL), and the presence of at least one concomitant CYP3A4 strong inducer, weak inducer, and weak inhibitor (0 for absence; 1 for presence).
Continuous covariates (age, weight, BSA, serum creatinine, ALT, AST, hemoglobin, hematocrit, RBC, and albumin) centered on their median values were tested using linear, exponential, power, and proportional models. Moreover, for categorical covariates (sex and the presence of at least one concomitant CYP3A4 inducer or inhibitor), linear, exponential, power, and proportional models were used.
Covariates were analyzed using a stepwise method which consists of a forward selection step and a backward elimination step. In the forward selection step, a covariate was selected if the OFV of the model with added covariate decreased under 3.84 (χ2-test, p-value<0.05) compared to the prior model. The procedure was performed until no more covariate reduced the OFV of the model significantly, and the full model was constructed with all influential covariates. In the backward elimination step, the covariate was retained in the final model if the OFV increased over 6.63 (χ2-test, p-value<0.01) when each of the included covariates was deleted one by one. A decision on covariate selection was made at each step based on biological and clinical plausibility.
2.5 Final model validation
Validation of the final model was performed to evaluate its accuracy and robustness through bootstrap, goodness-of-fit plot, and prediction-corrected visual predictive check (pc-VPC). For bootstrap, 5,000 sets of data were resampled to validate the final model internally by comparing to estimates from the final model. Median values of estimates were calculated, and 95% confidence intervals were constructed by 2.5th and 97.5th percentiles from bootstrap results. Goodness-of-fit plots were examined to evaluate the fitting of predictions to observations. PC-VPC was performed with 1,000 simulations to diagnose the predictive performance of the final model graphically. Median, 2.5th, and 97.5th percentiles were visually assessed with 95% confidence interval.
2.6 Simulation
To predict the concentrations of everolimus at steady state using influential covariates, Monte Carlo simulation was performed based on the constructed final model. Dosages of 3 mg/m2, 4.5 mg/m2, 5 mg/m2, 6 mg/m2, 7 mg/m2, and 9 mg/m2 once daily were simulated for each BSA of 0.5 m2, 1 m2, 1.5 m2, 1.7 m2, and 2 m2, which were the extracted values from the baseline range of patients in this study. Additionally, 3 mg/m2, 4.5 mg/m2, 5 mg/m2, 6 mg/m2, and 7 mg/m2 were simulated for the groups with BSA 0.7 m2 to explore the optimized dose regimen for FCD patients. A total of 35 scenarios are shown in Supplementary Table S2. Concentrations were generated for 1,000 subjects in each scenario assuming that concentrations of everolimus reach a steady state after 14 days.
3 Results
3.1 Patient characteristics
The demographics of the 22 total patients are described in Table 1. Continuous variables are shown in median with ranges as minimum, interquantile, and maximum. Categorical variables are shown in the numbers of patients, with portions in percentage. The median age was 13.5 years (range 4–32 years), and nine male patients (40.9%) were included. The median BSA was 1.5 m2 (range 0.6–2 m2), and the median albumin was 4.6 g/dL (range 4.1–5.2 g/dL). Only one patient was administered with CYP3A4 strong inducers concomitantly during this study, and another patient who was administered with a CYP3A4 moderate inducer concomitantly dropped out without valid everolimus concentrations.
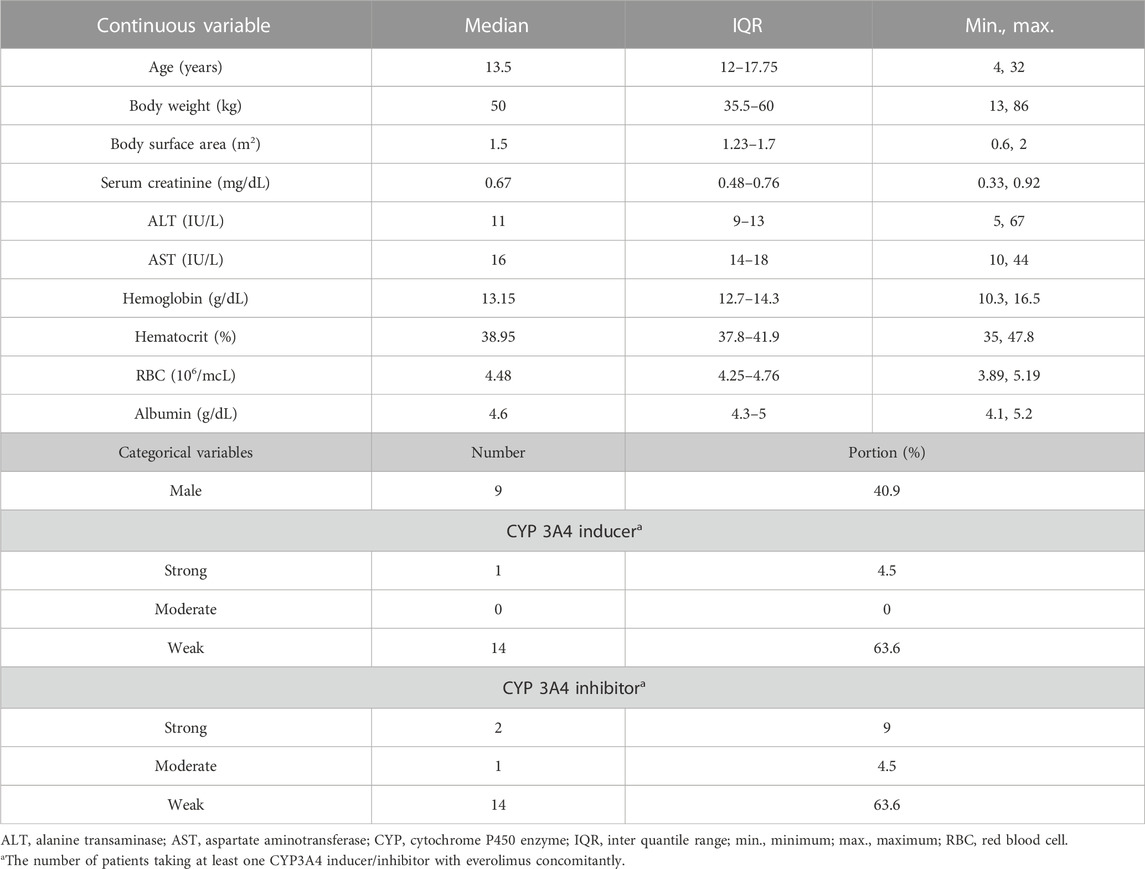
TABLE 1. Baseline characteristics of study patients (n = 22).
3.2 Population pharmacokinetic model
A total of 152 observed everolimus concentrations of time after dose from 22 patients were included in the population PK modeling. The observed everolimus data were best described by the one-compartment model with the first-order absorption model. The clearance, volume of distribution, and absorption rate of the population were estimated as 21.9 L/h, 302 L, and 0.573 h−1, respectively. The inter-individual variability of clearance (ωCL2) and volume of distribution (ωV2) were estimated as 0.0409 and 0.0602, which are correlated to 20.2% and 24.5% of the coefficient of variation, respectively. The inter-individual variability of the absorption rate (ωKA2) was fixed as zero. The residual variability (σ2) was best explained by the proportional error model. The objective function value of the base model was 397.372.
All collected covariates were tested in a stepwise manner. For the first forward selection step, the linear model of BSA on clearance was selected, with the largest reduction of OFV (ΔOFV = −6.356). According to the clinical pharmacology review of the FDA (CDER, 2009), the clearance of everolimus increased linearly with BSA, which aligns well with this study. In the second step, the proportional model of albumin on clearance was selected, with a reduction of OFV (ΔOFV = −4.941). This can be explained by the protein-binding portion (75%) of everolimus. The proportional model of RBC on clearance and the power model of RBC on volume of distribution also reduced the OFV (ΔOFV = −5.6 and −4.095, respectively); however, RBC was excluded as a covariate because the bioassay of everolimus was performed with whole blood, meaning that RBC does not influence everolimus concentrations in this study. As a result, the full model had BSA and albumin on clearance.
When BSA was eliminated from the full model, OFV increased significantly (ΔOFV = 6.92), while the removal of albumin from the full model increased OFV to 4.941. The final PK model was constructed with BSA on clearance.
The estimated values of the parameters from the final population PK model are summarized in Table 2 with the medians derived from 5,000 bootstrapped samples in 95% confidence intervals. The estimated values were similar to the median values from the bootstrap result, within 95% confidence interval. The relative standard errors (RSEs) of the random effects were acceptable. All eta shrinkage values were under 40, except IIV of the absorption rate, which was fixed at zero.
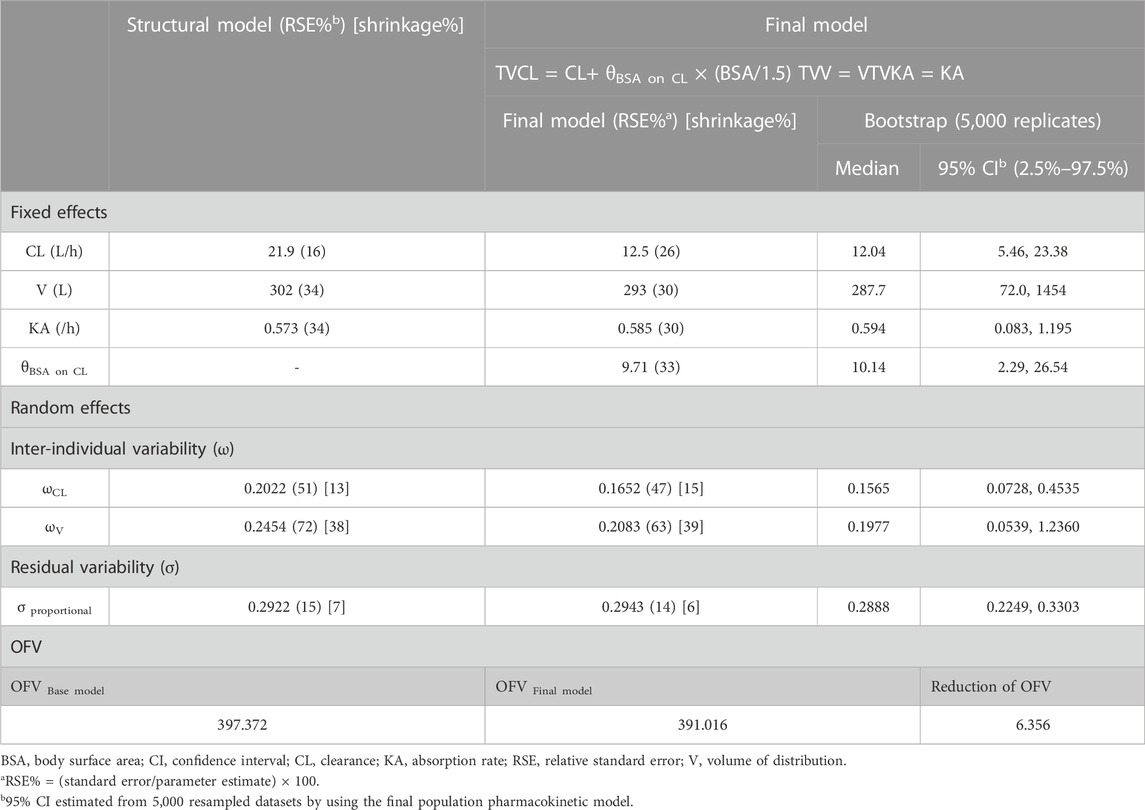
TABLE 2. Parameter estimates and bootstrap confidence interval.
Goodness-of-fit plots for the final PK model are shown in Figure 1. Individual predicted concentration (IPRED, (a)) and population predicted concentration (PRED, (b)) were uniformly distributed near the line, showing that observations equal predictions. Conditional weighted residuals (CWRES) by PRED (c) and time (d) were randomly distributed around zero, without specific trends.
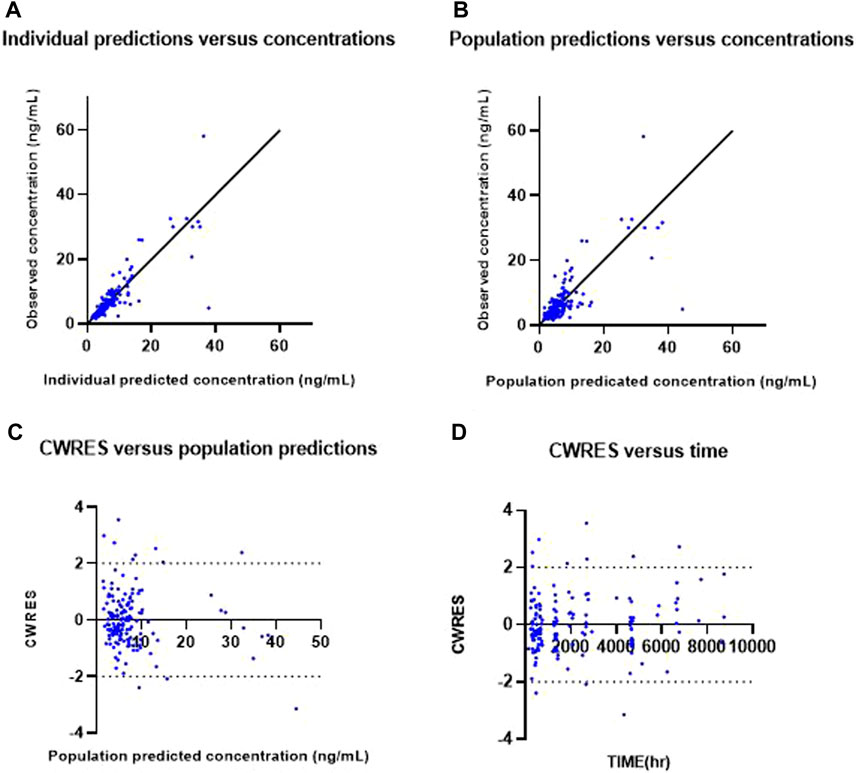
FIGURE 1. Goodness-of-fit plots of the final model. Observed everolimus concentration versus individual predicted (IPRED) concentration (A) and versus population predicted concentration (PRED) (B). Conditional weighted residuals (CWRES) versus population predicted concentration (C) and versus time (D).
The pc-VPC plot for the final PK model, which describes the 2.5th, median and 97.5th observed concentrations by lines, and each corresponding 95% confidence interval for the predicted estimates as given by the shaded areas are shown in Figure 2. Each line is well included in the shaded area, which was constructed from 1,000 simulated datasets from the final population PK model.

FIGURE 2. Prediction-corrected visual predictive check of the final model. Open circles, observed everolimus concentrations; solid line, median; lower and upper dashed lines, the 2.5th and 97.5th percentiles of the simulated data, respectively; and shaded areas, 95% confidence intervals for simulated predicted median, 2.5th percentile, and 97.5th percentile constructed from 1,000 simulated datasets of individuals from the original dataset.
3.3 Simulations
Monte Carlo simulation based on the final PK model was performed to explore the optimal dose regimen in the population of FCD patients according to BSA, which influences everolimus concentration. Dosages were simulated based on BSA as follows: 3 mg/m2, 4.5 mg/m2, 5 mg/m2, 6 mg/m2, 7 mg/m2, and 9 mg/m2. The simulated concentration–time courses at steady state when BSA is 0.5 m2, 0.7 m2, 1 m2, 1.5 m2, 1.7 m2, and 2 m2 are presented in Supplementary Figures S1–S4. The target range of everolimus trough concentration in FCD was assumed to be from 5 to 15 ng/mL, according to a previous clinical trial on TSC (Franz et al., 2013). Figure 3 describes the simulated trough concentrations based on the BSA level and various BSA-based dosage regimens after administering everolimus once a day for 2 weeks, which is enough time to reach the steady state. The target range 5–15 ng/mL is presented as a red dashed line, and the efficacious dose regimens that allow the trough concentrations to achieve the target range were explored according to each baseline of BSA. Furthermore, we decided the optimal initial doses by both mean trough concentrations and % of target concentrations as 60%. Based on the simulation results, Table 3 suggests an optimal initial dose of everolimus by the BSA range, and this can guide the efficacious dose for FCD individual patients according to their BSA value.
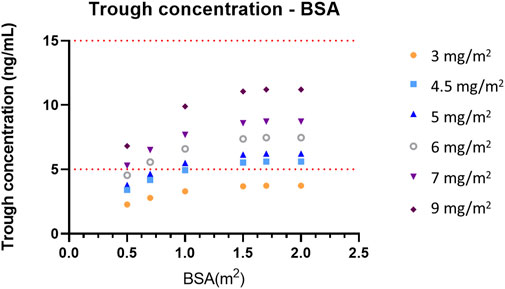
FIGURE 3. Simulated trough concentrations—BSA profiles according to the BSA-based dose regimen. The target range of trough concentrations, 5–15 ng/mL, is presented as a red dashed line.
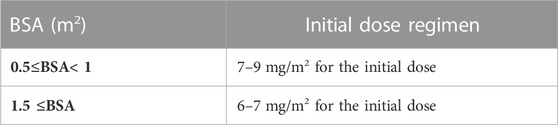
TABLE 3. Optimal initial dose of everolimus by the BSA range.
4 Discussion
The dosing regimen of everolimus and the target range of trough concentrations for treating seizures associated with FCD have not been decided yet, and a population pharmacokinetic model of everolimus in FCD patients was explored to optimize the dosage regimen. As a result, the model was described as a one-compartmental model with first-order absorption, and the final model revealed that the clearance of everolimus increased linearly as BSA increased. Target concentrations and clinical endpoints of everolimus in FCD were not determined, and we used those of TSC. This is the first study to develop a population pharmacokinetic model and suggest the optimal dosage of everolimus in patients with FCD.
The population pharmacokinetic model of everolimus for FCD patients is developed as a one-compartment model, different from other population PK models of everolimus, which are two-compartment models (Fouladi et al., 2007; Dirk Jan et al., 2012; Atsuko Tanaka et al., 2016; de Wit et al., 2016; Combes et al., 2018; Ter Heine et al., 2018). Only one study reported PK in FCD patients, reporting a two-compartment model with a similar CL (20.0 L/h) and a larger Vd (V2 219 L and V3 335.7 L) (Combes et al., 2018), where the CL was similar to that in our study, and the Vd was larger than that in our study. The difference in Vd may be due to differences in the study population, with the age of the subjects in Combes et al.’s study ranging from 19 to 74 years. Some studies reported on cancer and transplant patients. One study conducted on liver transplant patients reported that everolimus follows a one-compartment model, with a smaller CL and a similar Vd to this study, with covariates of body weight, total daily dose, fluconazole concomitant administration, eGFR, and sex (Itohara et al., 2022). Heine et al. developed a mechanistic two-compartment model for both transplant and cancer patients. As a result, a much higher CL (364 L/h) and a larger Vc (176 L) and Vp (577 L) were reported, and the dosage regimen was recommended according to the therapeutic ranges of each disease (Ter Heine et al., 2018). As described previously, different studies have shown different PK results, and more studies are needed to confirm trends, especially in patients with FCD.
Because the time points of sampling were sparse in this study, many assumptions regarding parameters were required to fit the data to the two-compartmental model. Therefore, a one-compartmental model was preferred for simplicity. The inter-individual variability of the rate constant of absorption (ka) was fixed at zero because there was not much information about the absorption phase from our data. The estimate of ka in this population was 0.585 h−1 in the final model, with the assumption that absorption rates are the same among the patients. This estimate is lower than that of other populations, which ranged from 0.647 h−1 to 11.087 h−1. Combes et al. reported the rate constant of absorption as 10.8 h−1 from the population pharmacokinetic model of everolimus in patients with seizures associated with TSC (Combes et al., 2018). The difference of rate constants between this study and the study of Combes might have resulted from differences in the range of age and the control of food effect (Kovarik et al., 2002).
From the simulation in this study, the initial dose of everolimus for FCD patients with refractory seizures was suggested by individual BSA. The optimal doses were found from the result of simulations by the BSA of 0.5 m2, 0.7 m2, 1 m2, 1.5 m2, 1.7 m2, and 2 m2. For FCD patients whose BSAs are less than 1 m2, 7–9 mg/m2 of everolimus is recommended. For patients with BSA between 1 and 2 m2, 6–7 mg/m2 of everolimus is recommended. The initial recommended doses are higher than those of our study, and this means that different dosage regimens should be considered in FCD patients. To suggest a practical dose regimen for FCD patients by BSA, the available strengths of everolimus should be considered; therefore, the actual dose which is obtained by the multiplication of BSA should be rounded to be useful in practice.
The recommended dosing regimens for FCD patients are similar to those for TSC patients, considering the correlation between age and BSA (Andre et al., 2016). The effect of concomitant use of CYP3A4/P-gp inducers was not analyzed in this study because of insufficient numbers of patients who have been administered strong CYP3A4/P-gp inducers. However, BSA is expected to enable more precise dosing for individuals such as obese children when compared to an only age-based dosing regimen.
There are some limitations in this study. First, it was not possible to estimate the inter-individual variability of the absorption rate and the effect of concomitant use of CYP3A4/P-gp inducers/inhibitors on the pharmacokinetics of everolimus because the number of samples was not enough. To suggest a more optimal dose regimen of everolimus for FCD patients, the reference range of target therapeutic concentration needs to be set first. The assumption that the therapeutic range of everolimus in FCD patients is similar to that of TSC patients was required to recommend the optimal dose in this study. Moreover, it is expected that the limit of maximum concentrations should be decided, and more precise dose regimens can be suggested for the FCD patient population using safety information from clinical studies.
5 Conclusion
The population pharmacokinetic model of everolimus for patients with refractory seizures associated with FCD was built as a one compartment model with first-order absorption and elimination. The linear effect of BSA on clearance was included in the final model. Based on the developed population pharmacokinetic model, the optimal dose regimen of everolimus for individuals with FCD was recommended by considering the BSA and strength of formulations in practice.
Data availability statement
Raw data with personal information removed can be provided upon request.
Ethics statement
The studies involving humans were approved by the Institutional Review Board (IRB NO. 4-2017-0299) of Severance Hospital. The studies were conducted in accordance with the local legislation and institutional requirements. Written informed consent for participation in this study was provided by the participants’ legal guardians/next of kin.
Author contributions
Conception of the study: SK, H-CK, HK, and MC. Acquisition, analysis, and interpretation of data: JP, SK, JH, S-GL, and MC. Drafting the work: JP and SK. Revising the work: HK and MC. Providing approval for publication of the content: H-CK and HK. All authors contributed to the article and approved the submitted version.
Funding
This study analyzed data that were obtained during “A Study Investigating the Anti-epileptic Efficacy of Afinitor (Everolimus) in Patients with Refractory Seizures Who Have Focal Cortical Dysplasia Type II (FCD II) (NCT03198949)” funded by Novartis. This work was supported by a grant (No. 2023R1A2C1004568) from the National Research Foundation (NRF) of Korea, funded by the Korean government (Ministry of Science, ICT & Future Planning).
Conflict of interest
The authors declare that the research was conducted in the absence of any commercial or financial relationships that could be construed as a potential conflict of interest.
Publisher’s note
All claims expressed in this article are solely those of the authors and do not necessarily represent those of their affiliated organizations, or those of the publisher, the editors, and the reviewers. Any product that may be evaluated in this article, or claim that may be made by its manufacturer, is not guaranteed or endorsed by the publisher.
Supplementary material
The Supplementary Material for this article can be found online at: https://www.frontiersin.org/articles/10.3389/fphar.2023.1197549/full#supplementary-material
References
Andre, F., Robbers-Visser, D., Helling-Bakki, A., Foll, A., Voss, A., Katus, H. A., et al. (2016). Quantification of myocardial deformation in children by cardiovascular magnetic resonance feature tracking: determination of reference values for left ventricular strain and strain rate. J. Cardiovasc Magn. Reson 19, 8. doi:10.1186/s12968-016-0310-x
Atsuko Tanaka, I. Y., Shinsako, K., Sato, E., Fukudo, M., Fukudo, M., Masuda, S., et al. (2016). Population pharmacokinetics of everolimus in relation to clinical outcomes in patients with advanced renal cell carcinoma. Ther. Drug Monit. 38, 663–669. doi:10.1097/FTD.0000000000000344
Baybis, M., Yu, J., Lee, A., Golden, J. A., Weiner, H., McKhann, G., et al. (2004). mTOR cascade activation distinguishes tubers from focal cortical dysplasia. Ann. neurology 56, 478–487. doi:10.1002/ana.20211
Blümcke, I., Thom, M., Aronica, E., Armstrong, D. D., Vinters, H. V., Palmini, A., et al. (2011). The clinicopathologic spectrum of focal cortical dysplasias: a consensus classification proposed by an ad hoc Task Force of the ILAE Diagnostic Methods Commission. Epilepsia 52, 158–174. doi:10.1111/j.1528-1167.2010.02777.x
Combes, F. P., Baneyx, G., Coello, N., Zhu, P., Sallas, W., Yin, H., et al. (2018). Population pharmacokinetics-pharmacodynamics of oral everolimus in patients with seizures associated with tuberous sclerosis complex. J. Pharmacokinet. Pharmacodyn. 45, 707–719. doi:10.1007/s10928-018-9600-2
de Wit, D., Schneider, T. C., Moes, D. J., Roozen, C. F., den Hartigh, J., Gelderblom, H., et al. (2016). Everolimus pharmacokinetics and its exposure-toxicity relationship in patients with thyroid cancer. Cancer Chemother. Pharmacol. 78, 63–71. doi:10.1007/s00280-016-3050-6
Dirk Jan, A. R., Moes, R. R. P., Hartigh, J. den, de Fijter, J. W., de Fijter, J. W., and Guchelaar, H. J. (2012). Population pharmacokinetics and pharmacogenetics of everolimus in renal transplant patients. Clin. Pharmacokinet. 51, 467–480. doi:10.2165/11599710-000000000-00000
Fouladi, M., Laningham, F., Wu, J., O'Shaughnessy, M. A., Molina, K., Broniscer, A., et al. (2007). Phase I study of everolimus in pediatric patients with refractory solid tumors. J. Clin. Oncol. 25, 4806–4812. doi:10.1200/JCO.2007.11.4017
Franz, D. N., Belousova, E., Sparagana, S., Bebin, E. M., Frost, M., Kuperman, R., et al. (2013). Efficacy and safety of everolimus for subependymal giant cell astrocytomas associated with tuberous sclerosis complex (EXIST-1): a multicentre, randomised, placebo-controlled phase 3 trial. Lancet 381, 125–132. doi:10.1016/s0140-6736(12)61134-9
French, J. A., Lawson, J. A., Yapici, Z., Ikeda, H., Polster, T., Nabbout, R., et al. (2016). Adjunctive everolimus therapy for treatment-resistant focal-onset seizures associated with tuberous sclerosis (EXIST-3): a phase 3, randomised, double-blind, placebo-controlled study. Lancet 388, 2153–2163. doi:10.1016/s0140-6736(16)31419-2
GabrieleKirchner, I. I. M.-W., Manns, M. P., and Manns, M. P. (2004). Clinical pharmacokinetics of everolimus. Clin. Pharmacokinet. 43, 83–95. doi:10.2165/00003088-200443020-00002
Itohara, K., Yano, I., Nakagawa, S., Sugimoto, M., Hirai, M., Yonezawa, A., et al. (2022). Population pharmacokinetics of everolimus in adult liver transplant patients: comparison to tacrolimus disposition and extrapolation to pediatrics. Clin. Transl. Sci. 15, 2652–2662. doi:10.1111/cts.13389
Kovarik, J. M., Hartmann, S., Figueiredo, J., Rordorf, C., Golor, G., Lison, A., et al. (2002). Effect of food on everolimus absorption: quantification in healthy subjects and a confirmatory screening in patients with renal transplants. Pharmacotherapy 22, 154–159. doi:10.1592/phco.22.3.154.33542
Leitner, D. F., Kanshin, E., Askenazi, M., Siu, Y., Friedman, D., Devore, S., et al. (2022). Pilot study evaluating everolimus molecular mechanisms in tuberous sclerosis complex and focal cortical dysplasia. PLoS One 17, e0268597. doi:10.1371/journal.pone.0268597
Lim, J. S., Gopalappa, R., Kim, S. H., Ramakrishna, S., Lee, M., Kim, W. I., et al. (2017). Somatic mutations in TSC1 and TSC2 cause focal cortical dysplasia. Am. J. Hum. Genet. 100, 454–472. doi:10.1016/j.ajhg.2017.01.030
Lim, J. S., Kim, W. I., Kang, H. C., Kim, S. H., Park, A. H., Park, E. K., et al. (2015). Brain somatic mutations in MTOR cause focal cortical dysplasia type II leading to intractable epilepsy. Nat. Med. 21, 395–400. doi:10.1038/nm.3824
Ljungberg, M. C., Bhattacharjee, M. B., Lu, Y., Armstrong, D. L., Yoshor, D., Swann, J. W., et al. (2006). Activation of mammalian target of rapamycin in cytomegalic neurons of human cortical dysplasia. Ann. neurology 60, 420–429. doi:10.1002/ana.20949
Miyata, H., Chiang, A. C., and Vinters, H. V. (2004). Insulin signaling pathways in cortical dysplasia and TSC-tubers: tissue microarray analysis. Ann. neurology 56, 510–519. doi:10.1002/ana.20234
Sánchez-Fructuoso, A. I. (2008). Everolimus: an update on the mechanism of action, pharmacokinetics and recent clinical trials. Expert Opin. drug metabolism Toxicol. 4, 807–819. doi:10.1517/17425255.4.6.807
Sanjay, M., Sisodiya, S. F., Cross, J. H., and Thom, M. (2009). Focal cortical dysplasia type II: biological features and clinical perspectives. Lancet Neurol. 8, 830–843. doi:10.1016/S1474-4422(09)70201-7
Keywords: everolimus, focal cortical dysplasia, epilepsy, population pharmacokinetics, non-linear mixed-effect modeling
Citation: Park J, Kim SH, Hahn J, Kang H-C, Lee S-G, Kim HD and Chang MJ (2023) Population pharmacokinetics of everolimus in patients with seizures associated with focal cortical dysplasia. Front. Pharmacol. 14:1197549. doi: 10.3389/fphar.2023.1197549
Received: 12 April 2023; Accepted: 01 November 2023;
Published: 24 November 2023.
Edited by:
Mahmoud Rafieian-Kopaei, Shahrekord University of Medical Sciences, IranCopyright © 2023 Park, Kim, Hahn, Kang, Lee, Kim and Chang. This is an open-access article distributed under the terms of the Creative Commons Attribution License (CC BY). The use, distribution or reproduction in other forums is permitted, provided the original author(s) and the copyright owner(s) are credited and that the original publication in this journal is cited, in accordance with accepted academic practice. No use, distribution or reproduction is permitted which does not comply with these terms.
*Correspondence: Heung Dong Kim, hdkimmd@yuhs.ac; Min Jung Chang, mjchang@yonsei.ac.kr
†These authors have contributed equally to this work and share first authorship
‡These authors have contributed equally to this work