 Pan Xie1,2†
 Xi Li
Xi Li Zhao-Qian Liu
- 1Department of Clinical Pharmacology, Hunan Key Laboratory of Pharmacogenetics, and National Clinical Research Center for Geriatric Disorders, Xiangya Hospital, Central South University, Changsha, China
- 2Institute of Clinical Pharmacology, Central South University, Changsha, China
- 3Department of Orthopaedics, Xiangya Hospital, Central South University, Changsha, China
- 4Department of Pharmacy, The Second Xiangya Hospital, Central South University, Changsha, China
Discoidin, CUB, and LCCL domain-containing protein 2 (DCBLD2) is a two-domain transmembrane protein-coding gene located on chromosome 3, the protein expressed by which acts as the membrane receptor of semaphorin and vascular endothelial growth factor during the development of axons and blood vessels. Although several research evidences at the cellular and clinical levels have associated DCBLD2 with tumorigenesis, nothing is known regarding this gene from a pan-cancer standpoint. In this study, we systematically analyzed the influence of DCBLD2 on prognosis, cancer staging, immune characteristics, and drug sensitivity in a variety of cancers based on a unified and standardized pan-cancer dataset. In addition, we performed GO enrichment analyses and KEGG analyses of DCBLD2-related genes and DCBLD2-binding proteins. Our results showed that DCBLD2 is a potential oncogenic, immunological as well as a prognostic biomarker in terms of pan-cancer, and is expected to contribute to the improvement of tumor prognosis and the development of targeted therapy.
Background
The pan-cancer analysis contributes to examining similarities and differences between genotypic and phenotypic characteristics across different kinds of cancer. Since tumorigenesis and progression are affected by many factors, there is a need to study and elaborate on the pan-cancer influence of candidate genes and discuss the correlation between gene expression and patient outcome, tumor malignancy, immune regulation, and drug sensitivity as well as the potential underlying molecular mechanisms. Datasets held at the TCGA database contain invaluable functional genomic information for different tumors, which lays a foundation for gene pan-cancer analysis (Weinstein et al., 2013; Blum et al., 2018; Campbell et al., 2020).
Discoidin, CUB and LCCL Domain Containing 2 (DCBLD2) was first cloned from lung cancer cells with strong metastatic ability by Koshikawa et al. (Koshikawa et al., 2002) and found to be significantly up-regulated in high, relative to low, metastatic lung cancer cell lines. The DCBLD2 protein contains a binding peptide that is partially homologous to the domain of the SEMA4B signal element. Previous co-immunoprecipitation results confirmed that DCBLD2 interacts with SEMA4B-Fc and full-length SEMA4B, evidence that laid a foundation for subsequent explorations into the function and underlying mechanism of DCBLD2 action (Nagai et al., 2007). Furthermore, it was demonstrated that the over-expression of DCBLD2 is related to the increased invasive capacity of cancer cells and poor prognosis of patients with lung cancer (Koshikawa et al., 2002; Nagai et al., 2007), gastric cancer (Kim et al., 2008), colorectal cancer (He et al., 2020), and pancreatic cancer (Raman et al., 2018; Feng et al., 2020).
The tumor microenvironment (TME) is composed of cancer cells, stromal cells, immune cells, secretory products (such as cytokines and chemokines) of corresponding cells, and extracellular matrix (ECM). Cancer cells and their survival microenvironment are interdependent but antagonistic. TME can affect and regulate the occurrence and development of tumor through changes in metabolism, secretion, immunity, structure and function. As a consequence, researching the function of TME plays an important role in tumor diagnosis, prevention and treatment (Whiteside, 2008; Wu and DAI, 2017). Notably, the TME contains a variety of cells, of which infiltrating immune cells, such as T cells, B cells, macrophages, natural killer cells, and dendritic cells, account for the largest proportion. Different tumors can develop immune tolerance by escaping the effective recognition and killing of cancer cells by the immune regulation, while immunotherapy restores the normal anti-tumor immune response by restarting immune regulation in the tumor microenvironment, to inhibit tumor growth and metastasis. This treatment has shown strong antitumor ability in a variety of cancers such as melanoma, lung cancer, kidney cancer, and prostate cancer (Gajewski et al., 2013; Topalian et al., 2015). Apart from immune cells, infiltration of other kinds of cells such as cancer-associated fibroblasts (CAFs) and vascular endothelial cells inside the tumor has also been documented, a phenomenon that constitutes a non-immune microenvironment of the tumor. For example, CAFs have been proved to release stromal cell-derived factors and proangiogenic growth factors which in turn promote the progression and metastasis of cancer (Monteran and EREZ, 2019).
At present, nothing is known regarding systematic regulation of DCBLD2 on tumorigenesis, prognosis, and drug susceptibility in pan-cancer, while knowledge on the relationship between DCBLD2 and TME, including immune infiltration, is still lacking. Here, we provide the first report of the effects of DCBLD2 on tumorigenesis, prognosis, immune infiltration, and drug sensitivity in pan-cancer based on a dataset from TCGA. Our findings indicate that DCBLD2 is an oncogenic, immunological, and prognostic factor and has the potential to be a biomarker for cancer diagnosis, drug development, and prognostic analyses.
Materials and methods
Online analysis tools used in this study
The databases used in this study and their web addresses are listed in the table below (Table 1).
Differential gene expression analysis
We downloaded a unified and standardized pan-cancer data set, namely the TCGA Pan-Cancer (PANCAN, N=10535, G=60499) from UCSC (https://xenabrowser.net/), and extracted expression data for the DCBLD2 gene. Next, we screened the samples from Solid Tissue Normal, Primary Blood-Derived Cancer-Peripheral Blood, and Primary Tumor, and carried out log2 (x + 1) transformation on each expression value. All cancer species with less than 3 samples per single cancer species were excluded from the analysis to finally obtain an expression matrix comprising 26 cancer species. Differential expression between normal and tumor samples for each tumor was calculated using packages implemented in R software (version 3.6.4), with differences between groups determined using unpaired Student’s t-Test.
Prognostic value analysis of DCBLD2
The TCGA dataset was downloaded as described above, while metastatic samples were screened from TCGA-LAML, Primary Tumor, and TCGA-SKCM. Next, we screened data from a previous study (Liu et al., 2018b) and retrieved high-quality TCGA prognostic datasets and samples with a follow-up period of fewer than 30 days. Each expression value was transformed by log2 (x + 1) transformation, and any cancer species with less than 10 samples were excluded from the analysis. Finally, we obtained expression data for 39 cancer species and the overall survival or disease-specific survival data of the corresponding samples were obtained. The Coxph function implemented in the survival package of R software (version 3.2-7) was utilized to establish a Cox proportional hazards regression model for the determination of the association between gene expression and prognosis in each tumor. Prognostic significance was obtained by Log-rank test statistical test.
Immunophenoscore analysis
Data retrieval and screening of metastatic samples were as described above. Gene expression profiles in each tumor were extracted and mapped to Gene Symbol using the IOBR package (version 0.99.9) in R software (Method: Deconvo-IPS) (Charoentong et al., 2017). Next, MHC, EC, SC, CP, AZ, and IPS infiltration scores for each patient in each tumor were reevaluated according to the patterns of gene expression. This revealed a total of 6 types of immune cell infiltration scores across 9,555 and 39 tumor samples and tumor types, respectively. Next, we used the corr. test function in psych package (version2.1.6) in R software to calculate the Spearman’s correlation coefficient of gene and immune cell infiltration scores in each tumor and determine significantly related immune infiltration scores.
Microenvironment cell populations-counter analysis
Data retrieval and initial manipulation were as earlier described above. Next, we employed the IOBR package (version 0.99.9) in R (Method: Deconvo-MCPcounter) (Becht et al., 2016). to evaluate infiltration of T cells, CD8 T cells, Cytotoxic lymphocytes, B lineage, NK cells, Monocytic lineage, Myeloid dendritic cells, Neutrophils, Endothelial cells and Fibroblasts for each patient across each tumor based on gene expression profiles. This revealed a total of 10 kinds of immune cell infiltration scores, across 9,555 tumor samples from 39 tumor types. Thereafter, we employed the corr. test function implemented in psych package (version 2.1.6) in R to calculate the Spearman’s correlation coefficient between DCBLD2 expression level and immune cell infiltration scores in each tumor. Finally, we determined immune infiltration scores significantly related to DCBLD2 expression.
Estimation of stromal and immune cells in malignant tumor tissues using expression data analysis
Data retrieval and initial manipulation were as earlier described above. Next, we employed the ESTIMATE package in R (Yoshihara et al., 2013) to calculate stromal, immune, and ESTIMATE scores of each patient in each tumor and obtained immune infiltration scores for 9,555 and 39 tumor samples and tumor types, respectively. Next, we used the corr. test function implemented in psych package (version 2.1.6) in R to calculate the Pearson’s correlation coefficient between DCBLD2 expression level and immune invasion scores in each tumor, then determined the significantly related immune invasion score.
DCBLD2-related gene enrichment analysis
First of all, we used the STRING database to find the target proteins that may bind to DCBLD2. We set specific parameters on the “Basic Settings” page: “evidence” in the “Meaning of network edges” option, “Experiments” in the “Active interaction sources” option, and “low confidence (0.150)” in the “Minimum required interaction score” option, and “no more than 50 interactors” in the “Max number of interactors” option. When the condition is set, click “update” to get the protein interaction network. Next, we used GEPIA 2.0 to screen out the first 100 genes related to DCBLD2 expression, and use the “correlation analysis” module to analyze the correlation between the top 10 genes and DCBLD2 expression. The genes obtained from the above two databases were collected and merged, and the DAVID database was used for GO enrichment analysis and KEGG pathway analysis.
Results
Profiles of DCBLD2 expression, cellular localization, topology, and its correlation with diseases
To characterize DCBLD2’s intracellular localization, we evaluated its distribution in the endoplasmic reticulum and microtubules of A-431, U-2 OS, and U-251 MG cells using data from the Human Protein Atlas database. Immunofluorescence assay results revealed an overlap between DCBLD2 and ER and microtubule across these cell types. The DCBLD2 protein was mainly expressed in the plasma membrane, and partly in the Golgi apparatus and the cytosol (Figure 1A). Results from analysis of the topological structure showed that the protein is a transmembrane protein, with a mutation site both inside and outside the membrane (Figure 1B). Furthermore, expression profiles showed that DCBLD2 mRNA was expressed in normal human tissues and organs except the bone marrow (Figure 1C). Protein-protein interaction networks showed that DCBLD2 interacted with multiple targets, including EGFR, FYN, ELAVL1, and HLA-DRA (Figure 1D). Moreover, the disease interaction network revealed that this gene was associated with many diseases, including cancer, genetic diseases, nervous system disease, and metabolic disease among others, of which the association with cancer was the most significant (Figure 1E).
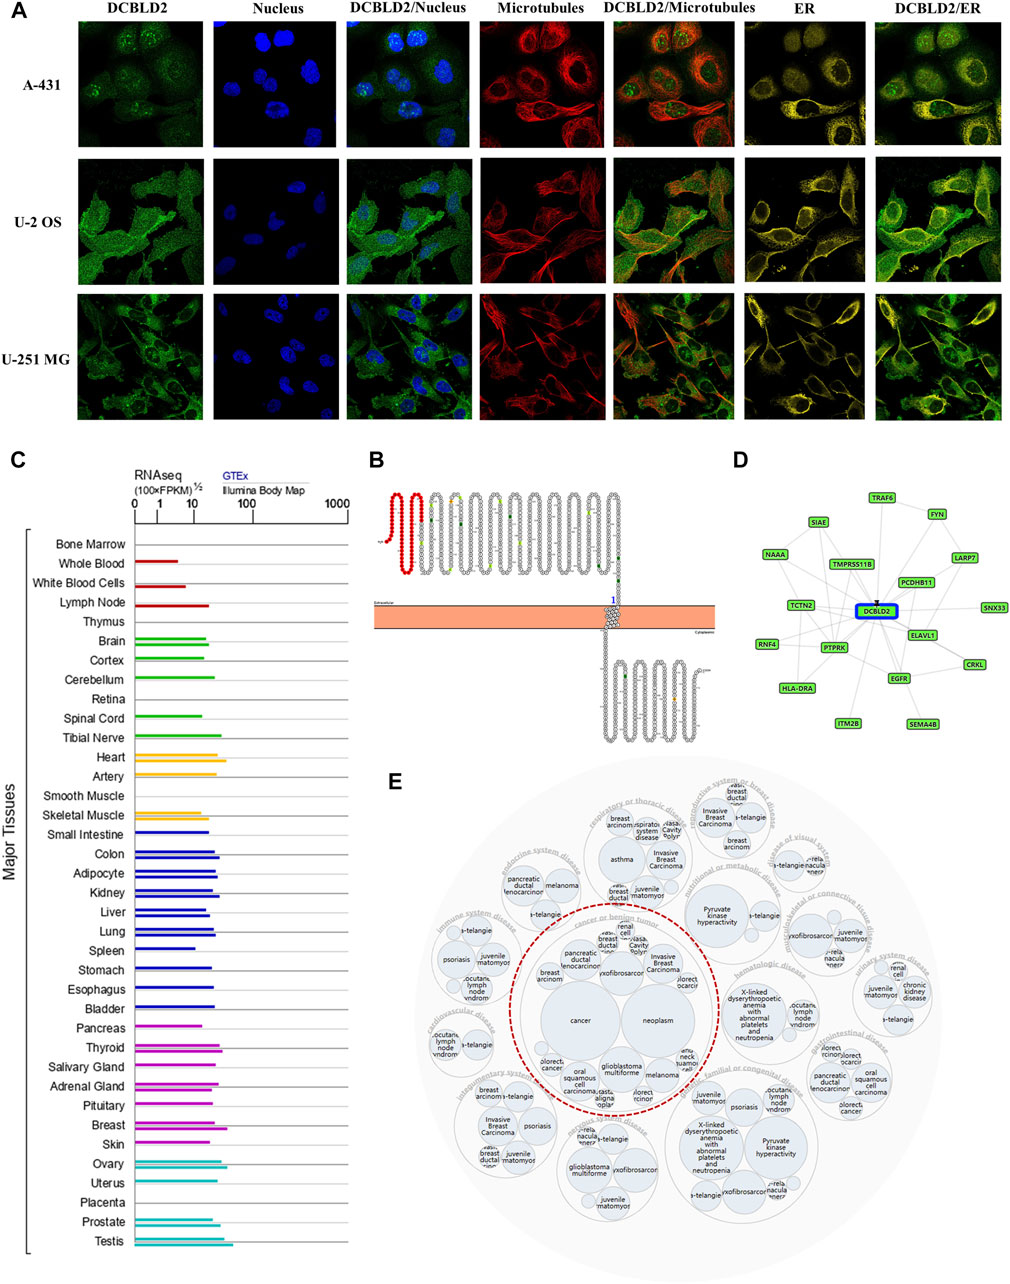
FIGURE 1. Cellular localization, topology, tissue expression of DCBLD2 and its correlation with diseases. (A) Immunofluorescence assay showed intracellular localization of DCBLD2 protein in A-431, U-2 OS, and U-251 MG cells as adopted from the HPA database. (B) DCBLD2 protein topology showing transmembrane localization. (C) The mRNA expression level of DCBLD2 in all normal human tissues as adopted from the TCGA data. (D–E) Network of potential binding proteins of DCBLD2 (D) and the DCBLD2-related disease (E).
DCBLD2 is not only aberrantly overexpressed but is associated with tumor stages
DCBLD2 was significantly over-expressed in most tumors, relative to normal adjacent tissues, including GBM (p = 1.8e-5), GBMLGG (p = 0.01), LUAD (p = 1.2e-8), COAD (p = 2.3e-4), COADREAD (p = 3.6e-3), STES (p = 0.03), KIRP (p = 1.4e-16), HNSC (p = 3.2e-20), LIHC (p = 0.02), THCA (p = 2.5e-8) and CHOL (p = 5.0e-5). Conversely, this gene was significantly downregulated in four kinds of tumors, relative to normal adjacent tissues, namely BRCA (p = 2.2e-40), PRAD (p = 9.1e-14), KIRC (p = 6.4e-6), and KICH (p = 4.6e-10) (Figure 2A). Validation of these results using the UALCAN database showed that the DCBLD2 mRNA was significantly up-regulated in CHOL, COAD, GBM, HNSC, KIRP, LUSC, and THCA (p < 0.05) (Figure 2B). Results from differential expression of DCBLD2 across different tumor stages showed that this gene was significantly upregulated in highly malignant pathological tumors including CHOL, HNSC, KIRP, LUSC, and THCA (p < 0.05) (Figure 2C). The above results showed that the expression levels of DCBLD2 gene showed significant differences between tumor tissues and normal tissues in most cancers, suggesting that this gene has the potential to become a biomarker for evaluating the development of malignant tumors.
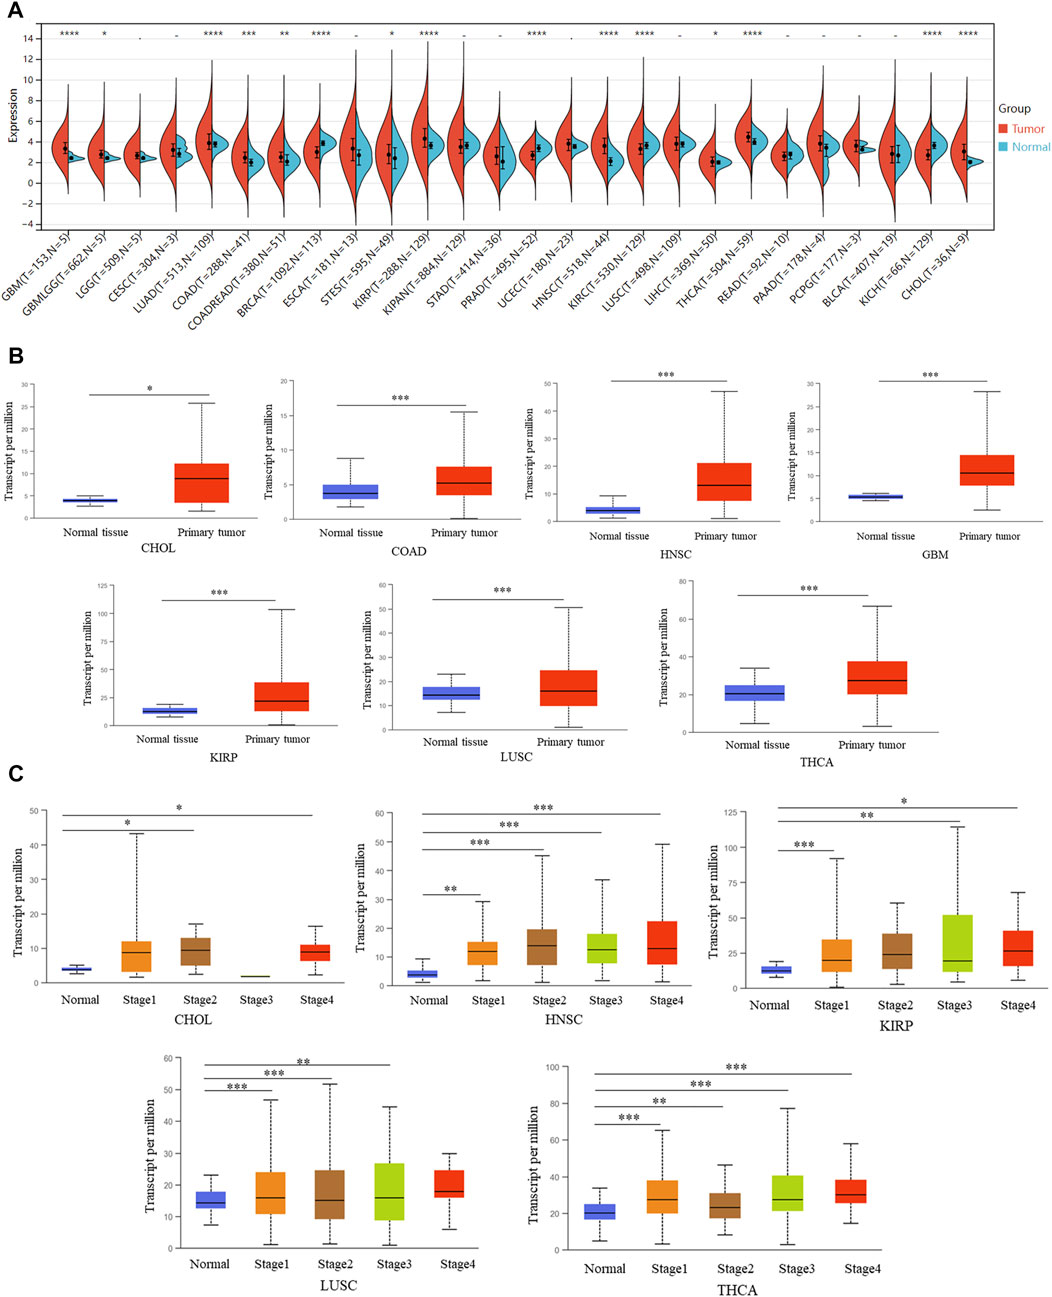
FIGURE 2. The association of the aberrant overexpression of DCBLD2 with tumor stages. (A) Differential DCBLD2 expression levels (log2 x + 1) between tumor and adjacent normal tissues as adopted from TCGA data. (B) Differential DCBLD2 expression for the type of CHOL, COAD, GBM, HNSC, KIRP, LUSC, and THCA as adopted from TCGA data. *p < 0.05, **p < 0.01, **p < 0.001. (C) For the type of CHOL, HNSC, KIRP, LUSC and THCA in the TCGA project, the box plot data of differential DCBLD2 expression levels (log2 x + 1) between pathological stages (stages I, II, III, and IV) were supplied. *p < 0.05, **p < 0.01, **p < 0.001.
DCBLD2 expression is associated with poor prognosis of cancer patients
We analyzed the influence of DCBLD2 expression on overall survival (OS) of patients with different tumor types via TCGA dataset. Results showed that upregulation of this gene was related to shorter OS of patients across 16 tumor types, namely GBMLGG (p = 3.7e-33, HR = 2.19), LGG (p = 2.2e-13, HR = 2.19), LUAD (p = 0.04, HR = 1.13), KIPAN (p = 9.8e-4, HR = 1.18), STAD (p = 8.0e-4, HR = 1.27), HNSC (p = 0.03, HR = 1.16), GBM (p = 0.01, HR = 1.30), KIRC (p = 7.9e-5, HR = 1.34), COAD (p = 0.02, HR = 1.32), COADREAD (p = 0.04, HR = 1.27), LIHC (p = 7.7e-3, HR = 1.42), MESO (p = 1.1e-3, HR = 1.39), PAAD (p = 2.1e-4, HR = 1.36), BLCA (p = 2.8e-4, HR = 1.23), ACC (p = 4.8e-4, HR = 1.69) and KICH (p = 1.4e-3, HR = 7.50). The only exception was recorded in LAML (p = 0.02, HR = 0.76) where high gene expression was significantly associated with increased OS (Figure 3A).
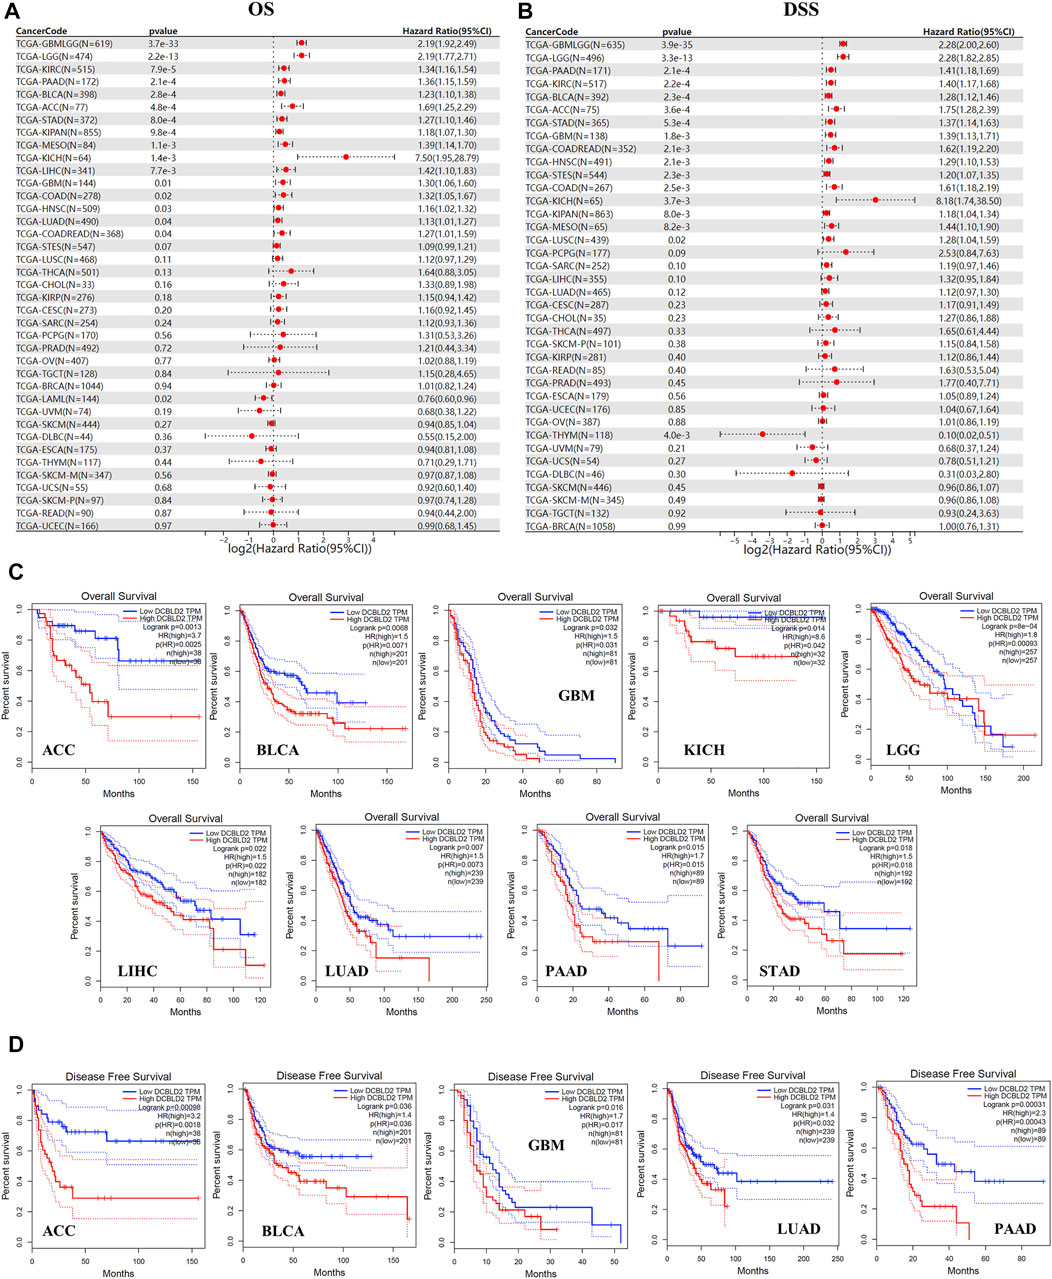
FIGURE 3. Association of DCBLD2 with tumor-poor cancer prognoses. (A) Forest plot showing the correlation between DCBLD2 expression and Overall Survival (OS) in 39 types of tumors as adopted from TCGA data. (B) Forest plot showing the correlation between DCBLD2 expression and Disease-Specific Survival (DSS) in 39 types of tumors as adopted from TCGA data. (C–D) Analysis of the Overall Survival (C) and Disease-Free Survival (D) of multiple tumors based on DCBLD2 expression as adopted from GEPIA 2.0 database (All p < 0.05).
Similarly, analysis of the relevance between DCBLD2 expression with disease specific survival (DSS) of patients revealed that high gene expression was significantly related to shorter DSS of patients in 16 tumor types, including GBMLGG (p = 3.9e-35, HR = 2.28), LGG (p = 3.3e-13, HR = 2.28), COAD (p = 2.5e-3, HR = 1.61), COADREAD (p = 2.1e-3, HR = 1.62), STES (p = 2.3e-3, HR = 1.20), KIPAN (p = 8.0e-3, HR = 1.18), STAD (p = 5.3e-4, HR = 1.37), HNSC (p = 2.1e-3, HR = 1.29), GBM (p = 1.8e-3, HR = 1.39), KIRC (p = 2.2e-4, HR = 1.40), LUSC (p = 0.02, HR = 1.28), MESO (p = 8.2e-3, HR = 1.44), PAAD (p = 2.1e-4, HR = 1.41), BLCA (p = 2.3e-4, HR = 1.28), ACC (p = 3.6e-4, HR = 1.75) and KICH (p = 3.7e-3, HR = 8.18). The only exception was in THYM (p = 4.0e-3, HR = 0.10) where high gene expression was associated with higher DSS (Figure 3B). Validation of the above results using the UALCAN database revealed that upregulation of DCBLD2 was associated with significantly shorter OS of patients with ACC, BLCA, GBM, KICH, LGG, LIHC, LUAD, PAAD and STAD (p < 0.05) (Figure 3C), and significantly shorter DFS in patients with ACC, BLCA, GBM, LUAD and PAAD (p < 0.05) (Figure 3D). Furthermore, validation of these results using multiple GSE datasets revealed that high DCBLD2expression was significantly associated with shorter OS, DFS, DSS and RFS in multiple cancers, including colorectal, lung, breast, bladder and ovarian cancers (Supplymentary Figure S1). Based on these results, it is evident that the DCBLD2 gene is a potential biomarker for patient outcomes.
DCBLD2 is associated with activation of the EMT signal
Next, we employed the GSCA database to elucidate the correlation between DCBLD2 expression with tumor-related pathway activity. Results revealed that DCBLD2 expression contributed to the activation of epithelial-mesenchymal transition (EMT) signal in 31 kinds of tumors (Figure 4A). Previous studies have demonstrated that abnormal up-regulation of EMT in cancer patients is the main factor leading to poor prognosis, metastasis, and recurrence of many types of cancer (Fan et al., 2020; Zhang et al., 2020). Correlation analysis between expression of DCBLD2 and key regulators of the EMT signal, utilizing the TIMER 2.0 database, revealed a significant positive correlation between DCBLD2 with CDH1, TJP1, CDH2, VIM, SNAI1, SNAI2, TWIST1, MMP2, MMP3, MMP9, ZEB1, ZEB2, ILK, and RHO, across all tumors based on the TCGA dataset (Figure 4B). Validation of these results, using the GEPIA 2.0 database, revealed that DCBLD2 expression was positively correlated with the expression of CDH2, ILK, MMP2, MMP9, SNAI1, SNAI2, TJP1, TWIST1, VIM, and ZEB2 (p < 0.05, r > 0.2) (Figure 4C). EMT is one of the key regulatory factors of cancer metastasis. Therefore, we further explored the relationship between DCBLD2 expression with tumor M stage and N stage and found no significant effect on the tumor M stage. However, DCBLD2 was significantly upregulated in patients with severe lymph node metastasis in CHOL, COAD, HNSC, KIRP, and THCA (Figure 4D). Collectively, these results suggested that DCBLD2 expression is associated with activation of the EMT signal in pan-cancer and thus may promote tumor metastasis.
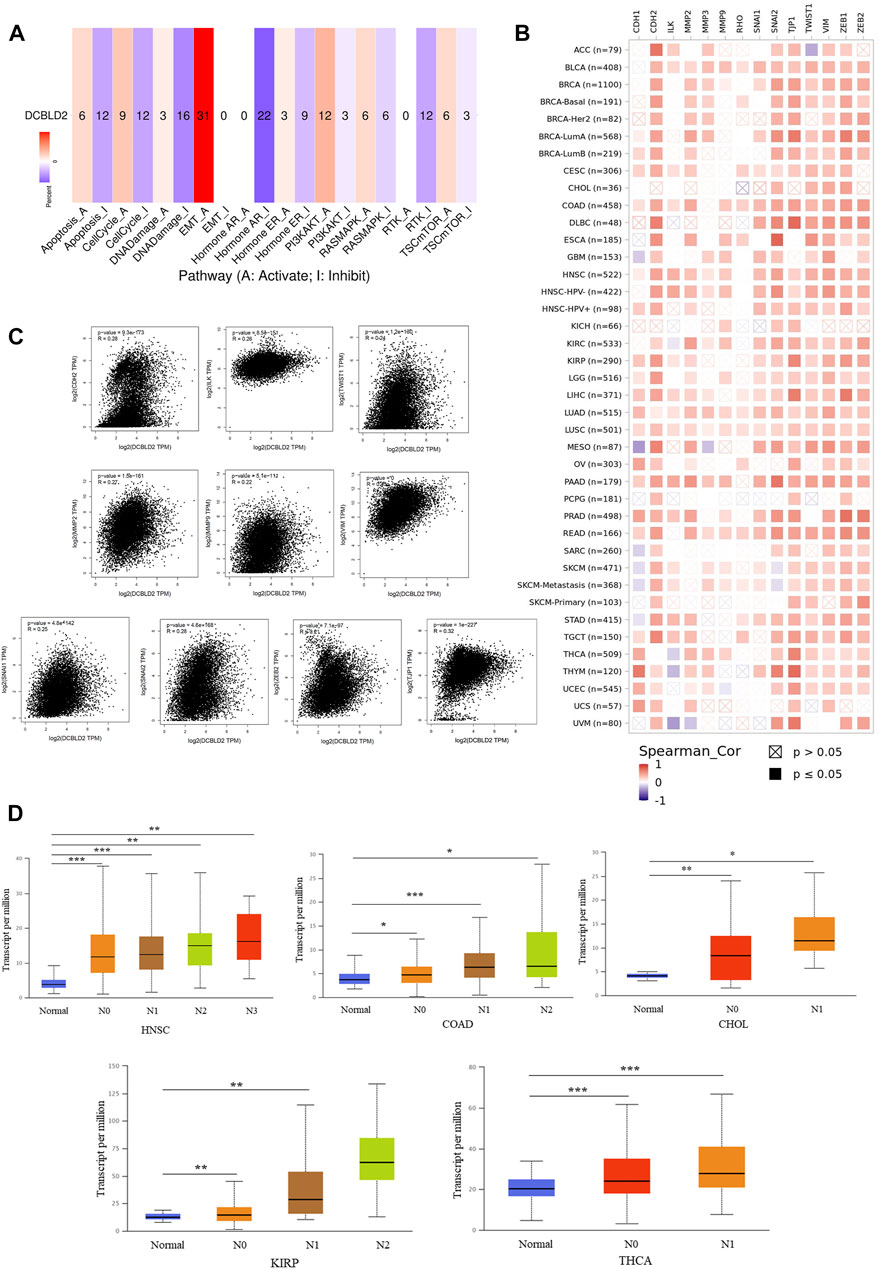
FIGURE 4. The association of DCBLD2 with EMT signal activation. (A) The percentage of cancers in which mRNA expression of DCBLD2 has a potential effect on pathway activity (A: Activate; I Inhibit). (B) The correlation heatmap of DCBLD2 and the key regulators of EMT signal in the detailed cancer types. (C) Analysis of the association between the expression of DCBLD2 and EMT signal regulators, including CDH2, ILK, MMP2, MMP9, SNAI1, SNAI2, TJP1, TWIST1, VIM, and ZEB2 using the GEPIA2 approach. Only targeting genes with statistically significant correlation are presented. (D) For the type of HNSC, COAD, CHOL, KIRP and THCA in the TCGA project, the box plot data of differential DCBLD2 expression levels (log2 x + 1) between N stages (Normal, N1, N2, and N3) were supplied. *p < 0.05, **p < 0.01, **p < 0.001.
DCBLD2 participates in immune regulation
Next, we characterized the immune microenvironment of the samples according to gene expression data using multiple algorithms. Firstly, we employed IPS, which uses biomarkers of an immune response or immune tolerance for the visualization and subsequent quantification of multiple immune phenotypes (MHC, EC, SC, CP, and AZ) in tumor samples, to evaluate the immune status. This method also generates a z score that summarizes all the categories, with higher z scores in IPS indicating stronger immunogenicity in a sample. Results revealed that DCBLD2 expression was not only inversely associated with all indexes across all tumors, except EC, but also with the final IPS score, suggesting that its upregulation may cause tumor immunosuppression (Figure 5A). Next, we used MCPcounter to quantify the relative enrichment of immune cells in heterogeneous tumor samples, and then evaluated the level of immune infiltration across 10 kinds of immune-related cells, namely T cells, CD8 T cells, natural killer cells, cytotoxic-lymphocytes, B cells, monocytic lineage, myeloid dendritic cells, neutrophils, and endothelial cells and fibroblasts. Published literature has shown that myeloid-derived suppressor cells, dendritic cells, neutrophils, and endothelial cells are key immunosuppressive cells that promote tumor progression (Liu and CAO, 2016). The correlation heat map showed a positive association between DCBLD2 expression with infiltration of the four kinds of cells mentioned above in almost all tumors (Figure 5B). Following that, we validated the positive correlation between DCBLD2 expression with infiltration of CAFs and MDSCs using the TIMER2.0 database (Figure 5C), then employed the ESTIMATE package in R to quantify and visualize the impact of DCBLD2 on immune cell infiltration in specific tumor types. Scatter plots showed that levels of DCBLD2 expression were negatively correlated with ESTIMATE scores in CESC, THYM, TGCT, UVM, and ACC (p < 0.05, r < -0.2) (Figure 5D).
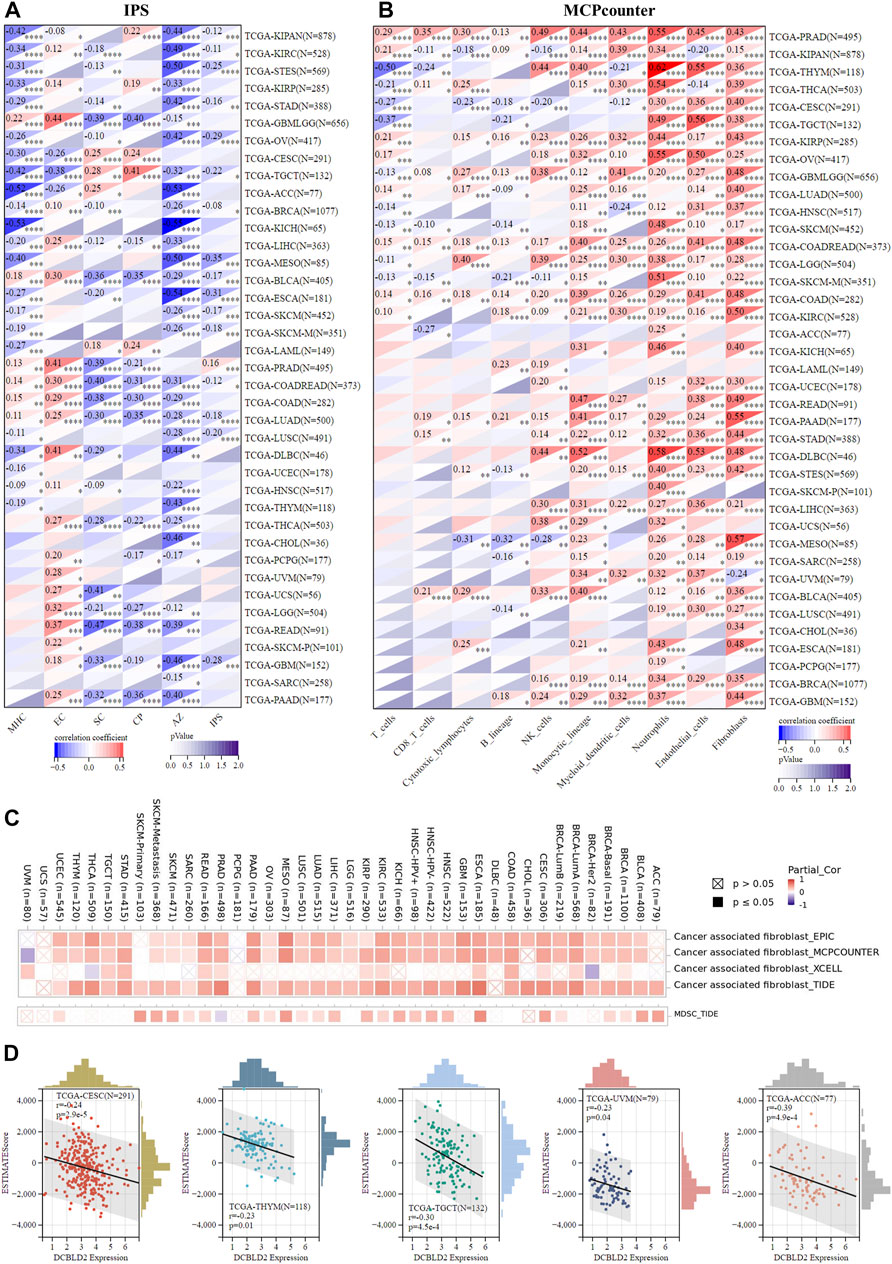
FIGURE 5. Association of DCBLD2 with immune regulation. (A) Heatmap showing correlations between DCBLD2 expression and IPS score of standardized pan-cancer data set. The MHC, EC, SC, CP, AZ, and IPS infiltration scores in each tumor were evaluated according to gene expression. (B) Heatmap showing correlations between DCBLD2 expression and MCPcounter score of standardized pan-cancer data set. The T cells, CD8 T cells, Cytotoxic lymphocytes, B lineage, NK cells, Monocytic lineage, Myeloid dendritic cells, Neutrophils, Endothelial cells and Fibroblasts infiltration scores in each tumor were evaluated according to gene expression. (C) Heatmap showing correlations between DCBLD2 expression and immune infiltration of cancer-associated fibroblasts (CAFs) and myeloid-derived suppressor cells (MDSCs) via TIMER 2.0 database. (D) Correlation analysis between DCBLD2 expression and ESTIMATE score of standardized pan-cancer data set.
DCBLD2 expression is associated with therapeutic responses
Next, we analyzed the relationship between DCBLD2 expression and therapeutic efficacy using a variety of solid tumors cell lines in GDSC (Figure 6A) and CTRP (Figure 6B) databases. The two databases, GDSC and CTRP, were integrated to obtain a total of about 500,000 drug effect data between 684 drugs and 1,235 cells, from which we were able to obtain the IC50 values of different types of tumor cells for various drugs. Results revealed that DCBLD2 expression in cancer cells was positively correlated with IC50 values of many chemotherapeutic drugs, targeted drugs, and small molecular probes, including 5-Fluorouracil. Notably, high DCBLD2 expression was associated with a weaker therapeutic effect. Next, we analyzed the potential therapeutic effects of DCBLD2 by comparing it with standardized biomarkers based upon the predicted therapeutic efficacy and patient outcome of ICB sub-cohorts. In the first, DCBLD2 alone had an AUC of the ROC > 0.5 in 7 of the 21 ICB sub-cohorts, this was accompanied by a better predictive efficacy compared with the T. Clonality and B. Clonality. Although DCBLD2 expression was comparable to the TMB score, it was lower than MSI. Score, CD27A, TIDE, IFNG, Merck18, and CD8 (Figure 6C). Moreover, DCBLD2 upregulation was associated with worse PD1 outcomes in glioblastoma (ICB_Zhao2019_PD1) and melanoma (ICB_Riaz2017_PD1 and ICB_Liu2019_PD1), worse CTLA4 outcomes in melanoma (ICB_Nathanson2017_CTLA4), and worse PDL1 outcomes in the bladder (ICB_Mariathasan2018_PDL1). In addition, phenotypic analysis of gene knockout mice, based on genetic screening, showed that knocking out DCBLD2 significantly affected lymphocyte-mediated tumor killing in tumor models (Freeman 2019 NK, Vredevoogd 2019 MART1, Kearney 2018 IgG, Manguso 2017 GVAX, Kearney 2018 T_PD1 and Patel 2017 2) (Figure 6D). In addition, DCBLD2 upregulation was related to shorter OS of melanoma and bladder cancer patients who were treated with PD1 (Figure 6E). Furthermore, we analyzed the relationship between DCBLD2 expression level and chemotherapy sensitivity of tumor patients and found that patients with high DCBLD2 expression in Ovarian cancer and Breast cancer were less sensitive to drug therapy (Figure 6F).
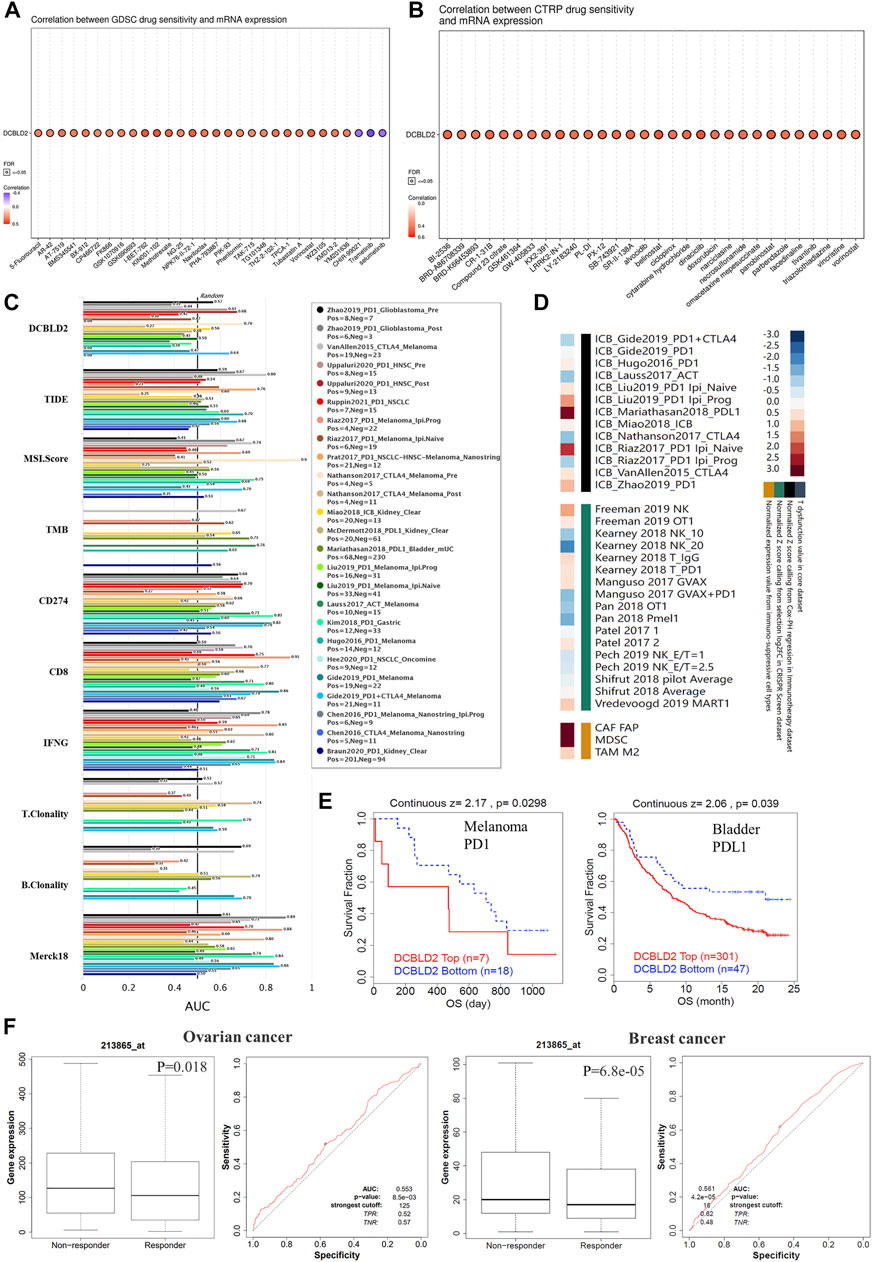
FIGURE 6. Association of DCBLD2 expression with therapeutic responses. (A,B) A bubble chart showing the association between DCBLD2 expression and IC50 value of multiple drugs in solid tumor cells, acquired from the GDSC database (A) and CTRP database (B). The color of bubbles showing the correlation coefficient between DCBLD2 expression level and IC50 value. The points coiled by black contours indicate that FDR < 0.05. (C) The bar chart showing the difference in the efficacy of DCBLD2 and standardized cancer immune evasion biomarkers in various data sets of tumor patients receiving immunotherapy. The efficacy was evaluated by the area under the receiver operating characteristic curve (AUC). (D) Heat maps showing the correlation between DCBLD2 expression levels and outcome in knockout models and tumor patients receiving immunotherapy (E) Effect of DCBLD2 expression on overall survival in melanoma patients treated with PD1 and bladder cancer patients treated with PDL1 (All p < 0.05). (F) Effect of DCBLD2 expression level on chemotherapy sensitivity in breast and ovarian cancer patients and ROC curves (All p < 0.05).
Enrichment analysis of DCBLD2-related factors
To deeper explore the molecular mechanism underlying the effects of DCBLD2 expression level on tumor development, immune regulation and drug sensitivity, we found the potential DCBLD2 binding proteins and genes related to DCBLD2 expression and carried out enrichment analysis. We first used the STRING tool to screen 38 possible dcBLD2-binding proteins, and the above results were supported by experimental evidence (Figure 7A). Next, we utilized the GEPIA 2.0 tool to include gene expression data of all cancer samples and selected the top 100 genes that were related to DCBLD2 expression. The top 10 genes that were positively related to DCBLD2 expression included LINC O 0973, ITGA3, SLC20A1, FAM3C2, NT5E, SMURF2, MDFIC, CALU, MET and PLAUR (r > 0.2, p < 0.05) (Figure 7B). We combined both datasets, and then subjected them to KEGG pathway and GO enrichment analyses. The regulation of DCBLD2-related genes was evaluated by biological processes, Cellular Components and molecular function. With regards to biological processes, these genes were mainly involved in peptidyl-tyrosine phosphorylation, positive regulation of cell migration, transmembrane receptor protein tyrosine kinase signalling pathway, and protein autophosphorylation, among others (Figure 7C). For cellular components, DCBLD2-related proteins were mainly located in the cell surface and plasma membrane and affected focal adhesion (Figure 7D). For molecular function, most of these genes mainly regulated the activity of various kinases and receptors, such as transmembrane receptor protein tyrosine kinase, protein tyrosine kinase, Ras guanyl-nucleotide exchange factor, vascular endothelial growth factor-activated receptor, and fibroblast growth factor-activated receptor, among others (Figure 7E). KEGG pathway data suggested that DCBLD2 regulates the Rap1, PI3K-Akt, and Ras signalling pathways during tumor pathogenesis (Figure 7F).
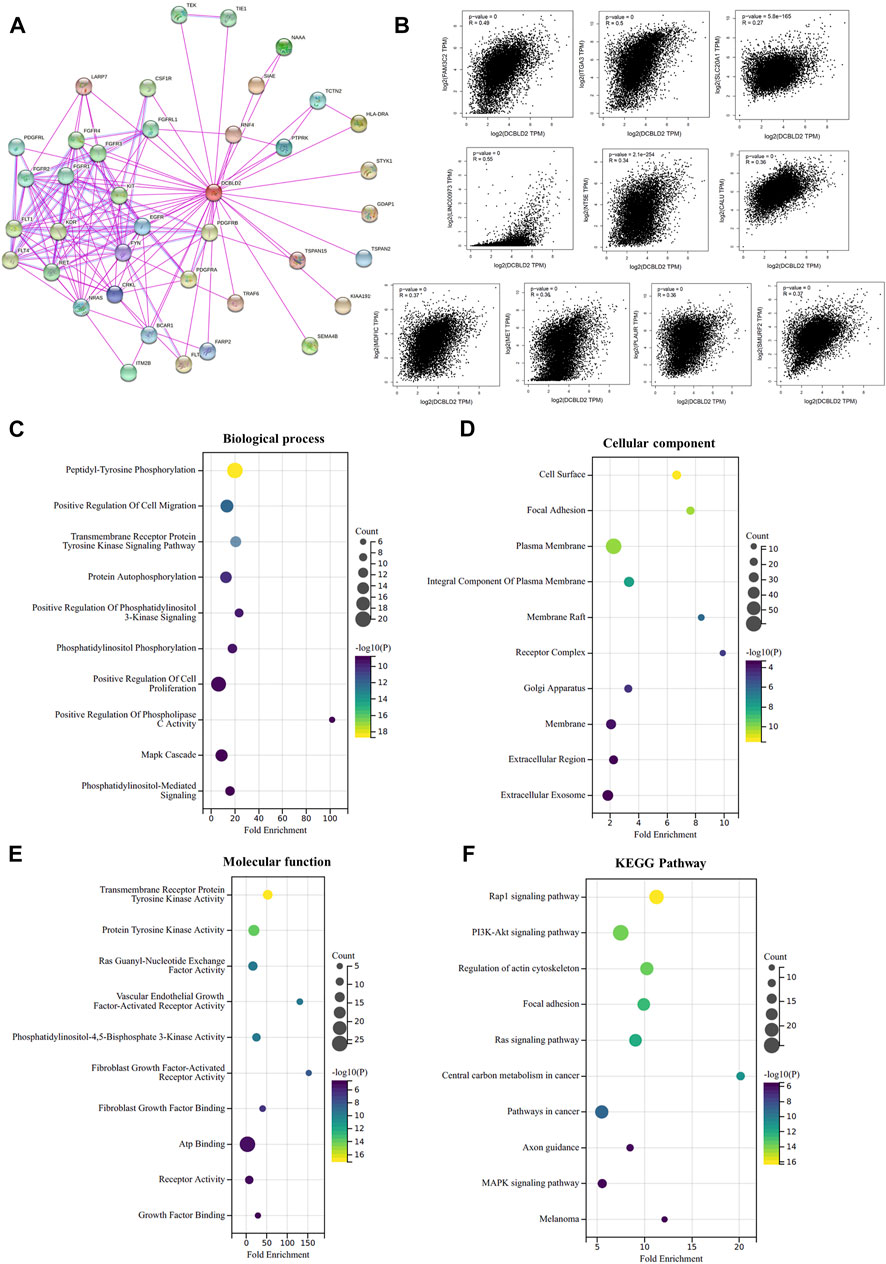
FIGURE 7. Enrichment analysis of DCBLD2-related factors. (A) DCBLD2-binding proteins supported by experimental results were screened using STRING database. (B) Scatter plot of expression correlation analysis of the top 10 DCBLD2-related genes, including LINC O 0973, ITGA3, SLC20A1, FAM3C2, NT5E, SMURF2, MDFIC, CALU, MET, and PLAUR. (C–F) GO enrichment and KEGG pathway analyses were performed based on the combine of DCBLD2-binding proteins and DCBLD2 expression-related genes. Supplymentary Figure S1: The effect of DCBLD2 expression levels on OS, DSS or RFS in patients with colorectal, lung, breast, blood, bladder and ovarian cancers in multiple GSE datasets.
Discussion
Reported literature has revealed that DCBLD2 influences the emergence and progression of multiple diseases, including cancer (Kikuta et al., 2017; He et al., 2020; Alhamoudi et al., 2021; Coppo et al., 2021; Feng et al., 2021). Moreover, DCBLD2 has been found to interact with the receptor tyrosine kinases EGFR, VEGFR, PDGFR, and INSR (Nie et al., 2013; Feng et al., 2014; Schmoker et al., 2019; Schmoker et al., 2020). Currently, no study has investigated whether DCBLD2 regulates the immune microenvironment and pathogenesis of tumors from the pan-cancer landscape. In our study, 39 types of tumors were obtained from the TCGA data. The association between DCBLD2 and tumor stage, prognosis, pathway activity, immune escape, and drug sensitivity was confirmed.
First, we investigated the oncogenic action of DCBLD2 in total tumor types from TCGA data. Gene differential expression analysis revealed that DCBLD2 mRNA levels were high in nearly all TCGA cancer types, including GBM, GBMLGG, LUAD, COAD, COADREAD, STES, KIRP, HNSC, LIHC, THCA, and CHOL. Furthermore, DCBLD2 mRNA levels were linked to tumor stage in CHOL, HNSC, KIRP, LUSC, and THCA. Prognostic analysis of gene expression in 16 tumor types, including GBMLGG, LGG, LUAD, KIPAN, STAD, HNSC, GBM, KIRC, COAD, COADREAD, LIHC, MESO, PAAD, BLCA, ACC, and KICH, revealed that high DCBLD2 expression was related to a shorter OS. We also looked at the effect of DCBLD2 expression on DSS and DFS, and the findings showed that high expression of DCBLD2 causes poor prognosis in a variety of tumors. The findings demonstrated that DCBLD2 can promote the occurrence and deterioration of multiple tumors, and it has the potential to be a biomarker to predict the prognosis of patients from the perspective of pan-cancer. Moreover, there are some contradictions in this result. For example, this gene was expressed at lower levels in tumor tissues of KIRC relative to normal tissues. However, when DCBLD2 expression was upregulated in KIRC, OS was shortened in these patients. These differences presented in individual tumors also deserve further studies to explore them in-depth.
Following the confirmation of the broad-spectrum effect of DCBLD2 on tumor prognosis, we sought to investigate the mechanism underlying this effect. In this view, we analyzed the relationship between DCBLD2 expression and cancer-related pathway activity at the pan-cancer level, revealing that DCBLD2 activated EMT signalling in 31 different types of tumors. This result is consistent with reported clinical and preclinical studies that DCBLD2 mediates tumor metastasis in colorectal cancer and lung adenocarcinoma by stimulating EMT (He et al., 2020; Chen et al., 2021). The evaluation of the association between DCBLD2 expression and the key regulators of EMT signalling in all tumors using TCGA data revealed significant positive correlations between DCBLD2 expression and these genes in the majority of tumors. Moreover, mRNA levels of DCBLD2 were correlated with the N stage. DCBLD2 expression was higher in patients with more severe lymph node metastasis in CHOL, COAD, HNSC, KIRP, and THCA.
Previous research has shown that EMT can not only increase tumor cell migration and invasive but also initiate carcinogenic changes in the tumor microenvironment. For example, studies have reported that over-expression of EMT signal regulators (such as TWIST1 and MMPs) can promote immune infiltration in TME, which promotes tumor cell immune escape (Terry et al., 2017; Singh and CHAKRABARTI, 2019) Tumor immune escape is a major contributor to tumor malignancy, poor prognosis, and treatment failure (Whiteside, 2008; Tang et al., 2016; Wu and DAI, 2017). Tumor infiltration into immune cells, on the one hand, causes T cell dysfunction, promotes tumors to evade the killing effect of the immune system, and ultimately results in tumor progression, metastasis, and chemotherapy resistance (Yu et al., 2009; Man et al., 2013). Besides, tumors can avoid immune killing via the T cell exclusion mechanism, which means that tumors prevent immune cell infiltration. T cell exclusion relies on immunosuppressive cells to play a role, including CAFs, Tregs, M2-TAMs, MDSCs, and so on (Joyce and FEARON, 2015; Komohara et al., 2016). The present investigation found that DCBLD2 expression was inversely related to the IPS score, implying that high DCBLD2 expression may cause tumor immunosuppression. Besides, we found a significant positive correlation between DCBLD2 expression level and CAFs and MDSCs infiltration in almost all tumors using different algorithms. This led us to the speculation that DCBLD2 may escape immune killing via T cell exclusion, resulting in tumor malignancy and metastasis. In addition, by evaluating the effect of DCBLD2 expression on ESTIMATE score in all tumors, we demonstrated a negative correlation between DCBLD2 expression level with ESTIMATE score in CESC, THYM, TGCT, UVM, and ACC.
Following the validation of the influence of DCBLD2 on EMT and immune escape, its efficacy on the traditional chemotherapeutic drugs and targeted drugs was further investigated. The analysis of the relationship between DCBLD2 expression and sensitivity to chemotherapy of all solid tumor cells showed a positive correlation of DCBLD2 expression level in tumor cell lines with the IC50 values of many chemotherapeutic drugs, targeted drugs, and small molecular probes. Subsequently, we analyzed the role of DCBLD2 expression levels on chemotherapy sensitivity in multiple cancer datasets. It turns out that in ovarian and breast cancer patients, high expression of the gene leads to a reduced response to drug therapy. In recent years, PD-1/PDL-1 inhibitor is the biggest breakthrough in the field of tumor therapy. This immunotherapy, which aims to reactivate the weakened immune cells of cancer patients, has achieved obvious results (Makuku et al., 2021). Our findings also revealed that high DCBLD2 expression levels were related to poorer PD1 outcomes in glioblastoma and melanoma, poorer CTLA4 outcomes in melanoma, and poorer PDL1 outcome in the bladder. Based on the findings, we hypothesize that high DCBLD2 expression may reduce the efficacy of chemotherapy or targeted therapy in tumor patients and that the gene may be a potential biomarker for drug efficacy evaluation or new drug development. Of course, only the correlation results of gene expression and drug sensitivity were obtained by prediction and analysis of each database, and it is essential to conduct further clinical trials or mechanistic experiments to verify the above results.
For the first time, this study: 1) Examined the effect of DCBLD2 on tumor pathological stage and prognosis from a pan-cancer perspective and discovered that DCBLD2 has a broad-spectrum activating effect on EMT signalling in all tumors. 2) Analyzed the effect of DCBLD2 on tumor immune regulation and confirmed that DCBLD2 may escape immune killing via T cell exclusion. 3) High DCBLD2 expression interferes with the efficacy of traditional chemotherapeutic drugs and emerging targeted drugs. Despite these strengths, there are some shortcomings in this study. To begin with, there is no information in these databases about DCBLD2 gene mutation or post-translational modification. Methylation, phosphorylation, and ubiquitin, for example, may all interfere with the molecular function of DCBLD2. Secondly, we only performed bioinformatics analysis of DCBLD2 expression, tumor stage, and prognosis in different databases, rather than in vivo/in vitro experiments. The study of the DCBLD2 mechanism at the cellular and molecular levels can clarify the role of the gene. Furthermore, this study used TCGA (RNA-seq) data, and there is a gap with protein level studies. The innovation and accuracy of this study would benefit more from the integration of proteomic level analysis in the future. Finally, while we discovered that DCBLD2 expression was related to immune regulation in tumors, we were unable to demonstrate that DCBLD2 impacted patient prognosis and drug efficacy via immune regulation. In-depth clinical studies and molecular mechanism studies focusing on DCBLD2 expression and immune regulation in a wide variety of tumors may help to draw a more precise conclusion.
Conclusion
For the first time, we performed a pan-cancer analysis of DCBLD2, and the results revealed a was a statistically significant association of DCBLD2 expression with pathological stage, prognosis, immune regulation, and chemotherapeutic and targeted drug sensitivity. Therefore, our findings indicate that DCBLD2 is an oncogenic, immunological, and prognostic factor and has the potential to be a biomarker for cancer diagnosis, drug development, and prognostic analyses.
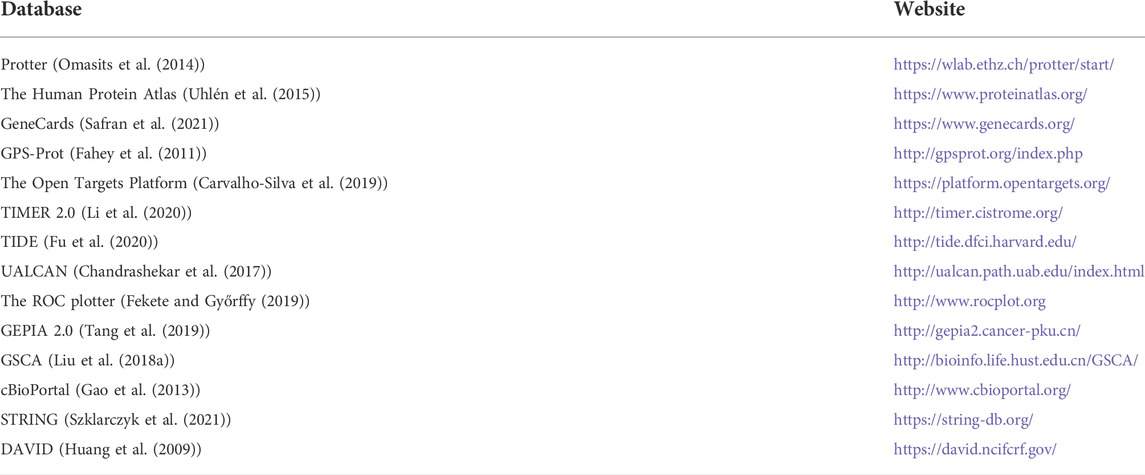
TABLE 1. Online analysis tools used in this study.
Data availability statement
The datasets presented in this study can be found in online repositories. The names of the repository/repositories and accession number(s) can be found in the article/Supplementary Material.
Author contributions
PX and J-YL designed the study and wrote the manuscript. HY contributed to the conception and design of the study. Z-BW and S-LJ revised the manuscript. XL and Z-QL supervised the project. The author(s) read and approved the final manuscript.
Funding
This work was supported by the National Natural Science Foundation of China (81874327), the National Natural Science Foundation of China (81803583), Key Research and Development Program of Hunan Province of China (2019SK2251), Innovation and Research Project of Development and Reform Committee of Hunan Province of China (2019-875), Project Program of National Clinical Research Center for Geriatric Disorders of China (Xiangya Hospital, 2020LNJJ02), Hunan Provincial Natural Science Foundation of China (2019JJ50854), and Open Fund Project of Hunan Universities Innovation Platform (18K006).
Acknowledgments
We used the Sangerbox 3.0 tool (vip.sangerbox.com) for statistical analysis and mapping of part of the data. We sincerely thank the website developers for providing convenience for the study.
Conflict of interest
The authors declare that the research was conducted in the absence of any commercial or financial relationships that could be construed as a potential conflict of interest.
Publisher’s note
All claims expressed in this article are solely those of the authors and do not necessarily represent those of their affiliated organizations, or those of the publisher, the editors and the reviewers. Any product that may be evaluated in this article, or claim that may be made by its manufacturer, is not guaranteed or endorsed by the publisher.
Supplementary material
The Supplementary Material for this article can be found online at: https://www.frontiersin.org/articles/10.3389/fphar.2022.950831/full#supplementary-material
Abbreviations
TME, Tumor microenvironment; MDSCs, Myeloid-derived suppressor cells; DCs, Dendritic cells; CAFs, Cancer-associated fibroblasts; DCBLD2, Discoidin, CUB And LCCL Domain Containing 2; OS, Overall survival; DSS, Disease Specific Survival; EMT, Epithelial-Mesenchymal Transition; TCGA, The Cancer Genome Atlas; GEO, Gene Expression Omnibus; CRC, Colorectal cancer; ECM, Extracellular matrix; CAFs, Cancer-associated fibroblasts.
References
Alhamoudi, K. M., Barhoumi, T., Al-Eidi, H., Asiri, A., Nashabat, M., Alaamery, M., et al. (2021). A homozygous nonsense mutation in DCBLD2 is a candidate cause of developmental delay, dysmorphic features and restrictive cardiomyopathy. Sci. Rep. 11 (1), 12861. doi:10.1038/s41598-021-92026-0
Becht, E., Giraldo, N. A., Lacroix, L., Buttard, B., Elarouci, N., Petitprez, F., et al. (2016). Estimating the population abundance of tissue-infiltrating immune and stromal cell populations using gene expression. Genome Biol. 17 (1), 218. doi:10.1186/s13059-016-1070-5
Blum, A., Wang, P., and Zenklusen, J. C. (2018). SnapShot: TCGA-analyzed tumors. Cell 173 (2), 530. doi:10.1016/j.cell.2018.03.059
Campbell, P. J., Getz, G., Korbel, J. O., Stuart, J. M., Jennings, J. L., Stein, L. D., et al. (2020). Pan-cancer analysis of whole genomes [J]. Nature 578 (7793), 82–93. doi:10.1038/s41586-020-1969-6
Carvalho-Silva, D., Pierleoni, A., Pignatelli, M., Ong, C., Fumis, L., Karamanis, N., et al. (2019). Open targets platform: New developments and updates two years on. Nucleic Acids Res. 47 (D1), D1056–D1065. doi:10.1093/nar/gky1133
Chandrashekar, D. S., Bashel, B., Balasubramanya, S. A. H., Creighton, C. J., Ponce-Rodriguez, I., Chakravarthi, B. V. S. K., et al. (2017). Ualcan: A portal for facilitating tumor subgroup gene expression and survival analyses. Neoplasia (New York, NY) 19 (8), 649–658. doi:10.1016/j.neo.2017.05.002
Charoentong, P., Finotello, F., Angelova, M., Mayer, C., Efremova, M., Rieder, D., et al. (2017). Pan-cancer immunogenomic analyses reveal genotype-immunophenotype relationships and predictors of response to checkpoint blockade. Cell Rep. 18 (1), 248–262. doi:10.1016/j.celrep.2016.12.019
Chen, X., Lv, Y., Xu, K., Wang, X., Zhao, Y., Li, J., et al. (2021). DCBLD2 mediates epithelial-mesenchymal transition-induced metastasis by cisplatin in lung adenocarcinoma. Cancers 13 (6), 1403. doi:10.3390/cancers13061403
Coppo, R., Orso, F., Virga, F., Dalmasso, A., Baruffaldi, D., Nie, L., et al. (2021). ESDN inhibits melanoma progression by blocking E-selectin expression in endothelial cells via STAT3. Cancer Lett. 510, 13–23. doi:10.1016/j.canlet.2021.04.005
Fahey, M. E., Bennett, M. J., Mahon, C., Jager, S., Pache, L., Kumar, D., et al. (2011). GPS-prot: A web-based visualization platform for integrating host-pathogen interaction data. BMC Bioinforma. 12, 298. doi:10.1186/1471-2105-12-298
Fan, H., Liu, X., Zheng, W. W., Zhuang, Z. H., and Wang, C. D. (2020). MiR-150 alleviates EMT and cell invasion of colorectal cancer through targeting Gli1. Eur. Rev. Med. Pharmacol. Sci. 24 (14), 7544. doi:10.26355/eurrev_202007_22181
Fekete, J. T., and Győrffy, B. (2019). ROCplot.org: Validating predictive biomarkers of chemotherapy/hormonal therapy/anti-HER2 therapy using transcriptomic data of 3, 104 breast cancer patients. Int. J. Cancer 145 (11), 3140–3151. doi:10.1002/ijc.32369
Feng, H., Lopez, G. Y., Kim, C. K., Alvarez, A., Duncan, C. G., Nishikawa, R., et al. (2014). EGFR phosphorylation of DCBLD2 recruits TRAF6 and stimulates AKT-promoted tumorigenesis. J. Clin. Invest. 124 (9), 3741–3756. doi:10.1172/JCI73093
Feng, Z., Li, K., Wu, Y., and Peng, C. (2021). Transcriptomic profiling identifies DCBLD2 as a diagnostic and prognostic biomarker in pancreatic ductal adenocarcinoma. Front. Mol. Biosci. 8, 659168. doi:10.3389/fmolb.2021.659168
Feng, Z., Shi, M., Li, K., Ma, Y., Jiang, L., Chen, H., et al. (2020). Development and validation of a cancer stem cell-related signature for prognostic prediction in pancreatic ductal adenocarcinoma. J. Transl. Med. 18 (1), 360. doi:10.1186/s12967-020-02527-1
Fu, J., Li, K., Zhang, W., Wan, C., Zhang, J., Jiang, P., et al. (2020). Large-scale public data reuse to model immunotherapy response and resistance. Genome Med. 12 (1), 21. doi:10.1186/s13073-020-0721-z
Gajewski, T. F., Schreiber, H., and Fu, Y. X. (2013). Innate and adaptive immune cells in the tumor microenvironment. Nat. Immunol. 14 (10), 1014–1022. doi:10.1038/ni.2703
Gao, J., Aksoy, B. A., Dogrusoz, U., Dresdner, G., Gross, B., Sumer, S. O., et al. (2013). Integrative analysis of complex cancer genomics and clinical profiles using the cBioPortal. Sci. Signal. 6 (269), pl1. doi:10.1126/scisignal.2004088
He, J., Huang, H., Du, Y., Peng, D., Zhou, Y., Li, Y., et al. (2020). Association of DCBLD2 upregulation with tumor progression and poor survival in colorectal cancer. Cell. Oncol. 43 (3), 409–420. doi:10.1007/s13402-020-00495-8
Huang, D. W., Sherman, B. T., and Lempicki, R. A. (2009). Systematic and integrative analysis of large gene lists using DAVID bioinformatics resources. Nat. Protoc. 4 (1), 44–57. doi:10.1038/nprot.2008.211
Joyce, J. A., and Fearon, D. T. (2015). T cell exclusion, immune privilege, and the tumor microenvironment. Sci. (New York, NY) 348 (6230), 74–80. doi:10.1126/science.aaa6204
Kikuta, K., Kubota, D., Yoshida, A., Qiao, Z., Morioka, H., Nakamura, M., et al. (2017). Discoidin, CUB and LCCL domain-containing protein 2 (DCBLD2) is a novel biomarker of myxofibrosarcoma invasion identified by global protein expression profiling. Biochim. Biophys. Acta. Proteins Proteom. 1865 (9), 1160–1166. doi:10.1016/j.bbapap.2017.06.023
Kim, M., Lee, K-T., Jang, H-R., Kim, J. H., Noh, S. M., Song, K. S., et al. (2008). Epigenetic down-regulation and suppressive role of DCBLD2 in gastric cancer cell proliferation and invasion. Mol. Cancer Res. 6 (2), 222–230. doi:10.1158/1541-7786.MCR-07-0142
Komohara, Y., Fujiwara, Y., Ohnishi, K., and Takeya, M. (2016). Tumor-associated macrophages: Potential therapeutic targets for anti-cancer therapy. Adv. Drug Deliv. Rev. 99, 180–185. doi:10.1016/j.addr.2015.11.009
Koshikawa, K., Osada, H., Kozaki, K-I., Konishi, H., Masuda, A., Tatematsu, Y., et al. (2002). Significant up-regulation of a novel gene, CLCP1, in a highly metastatic lung cancer subline as well as in lung cancers in vivo. Oncogene 21 (18), 2822–2828. doi:10.1038/sj.onc.1205405
Li, T., Fu, J., Zeng, Z., Cohen, D., Li, J., Chen, Q., et al. (2020). TIMER2.0 for analysis of tumor-infiltrating immune cells. Nucleic Acids Res. 48 (W1), W509–W514. doi:10.1093/nar/gkaa407
Liu, C. J., Hu, F. F., Xia, M. X., Han, L., Zhang, Q., and Guo, A. Y. (2018). GSCALite: A web server for gene set cancer analysis. Bioinforma. Oxf. Engl. 34 (21), 3771–3772. doi:10.1093/bioinformatics/bty411
Liu, J., Lichtenberg, T., Hoadley, K. A., Poisson, L. M., Lazar, A. J., Cherniack, A. D., et al. (2018). An integrated TCGA pan-cancer clinical data resource to drive high-quality survival outcome analytics. Cell 173 (2), 400–416. doi:10.1016/j.cell.2018.02.052
Liu, Y., and Cao, X. (2016). Immunosuppressive cells in tumor immune escape and metastasis. J. Mol. Med. 94 (5), 509–522. doi:10.1007/s00109-015-1376-x
Makuku, R., Khalili, N., Razi, S., Keshavarz-Fathi, M., and Rezaei, N. (2021). Current and future perspectives of PD-1/PDL-1 blockade in cancer immunotherapy. J. Immunol. Res., 1–15. doi:10.1155/2021/6661406
Man, Y. G., Stojadinovic, A., Mason, J., Avital, I., Bilchik, A., Bruecher, B., et al. (2013). Tumor-infiltrating immune cells promoting tumor invasion and metastasis: Existing theories. J. Cancer 4 (1), 84–95. doi:10.7150/jca.5482
Monteran, L., and Erez, N. (2019). The dark side of fibroblasts: Cancer-associated fibroblasts as mediators of immunosuppression in the tumor microenvironment. Front. Immunol. 10 1835. doi:10.3389/fimmu.2019.01835
Nagai, H., Sugito, N., Matsubara, H., Tatematsu, Y., Hida, T., Sekido, Y., et al. (2007). CLCP1 interacts with semaphorin 4B and regulates motility of lung cancer cells. Oncogene 26 (27), 4025–4031. doi:10.1038/sj.onc.1210183
Nie, L., Guo, X., Esmailzadeh, L., Zhang, J., Asadi, A., Collinge, M., et al. (2013). Transmembrane protein ESDN promotes endothelial VEGF signaling and regulates angiogenesis. J. Clin. Invest. 123 (12), 5082–5097. doi:10.1172/JCI67752
Omasits, U., Ahrens, C. H., MüLLER, S., and Wollscheid, B. (2014). Protter: Interactive protein feature visualization and integration with experimental proteomic data. Bioinforma. Oxf. Engl. 30 (6), 884–886. doi:10.1093/bioinformatics/btt607
Raman, P., Maddipati, R., Lim, K. H., and Tozeren, A. (2018). Pancreatic cancer survival analysis defines a signature that predicts outcome. PloS one 13 (8), e0201751. doi:10.1371/journal.pone.0201751
Safran, M., Rosen, N., Twik, M., BarShir, R., Stein, T. I., Dahary, D., et al. (2021). The GeneCards suite [M]//ABUGESSAISA I, KASUKAWA T. Practical guide to Life science databases. Singapore: Springer Nature Singapore, 27–56. doi:10.1007/978-981-16-5812-9_2
Schmoker, A. M., Ebert, A. M., and Ballif, B. A. (2019). The DCBLD receptor family: Emerging signaling roles in development, homeostasis and disease. Biochem. J. 476 (6), 931–950. doi:10.1042/BCJ20190022
Schmoker, A. M., Weinert, J. L., Markwood, J. M., Albretsen, K. S., Lunde, M. L., Weir, M. E., et al. (2020). FYN and ABL regulate the interaction networks of the DCBLD receptor family. Mol. Cell. Proteomics 19 (10), 1586–1601. doi:10.1074/mcp.RA120.002163
Singh, S., and Chakrabarti, R. (2019). Consequences of EMT-driven changes in the immune microenvironment of breast cancer and therapeutic response of cancer cells. J. Clin. Med. 8 (5), E642. doi:10.3390/jcm8050642
Szklarczyk, D., Gable, A. L., Nastou, K. C., Lyon, D., Kirsch, R., Pyysalo, S., et al. (2021). The STRING database in 2021: Customizable protein-protein networks, and functional characterization of user-uploaded gene/measurement sets. Nucleic Acids Res. 49 (D1), D605–D612. doi:10.1093/nar/gkaa1074
Tang, H., Qiao, J., and Fu, Y-X. (2016). Immunotherapy and tumor microenvironment. Cancer Lett. 370 (1), 85–90. doi:10.1016/j.canlet.2015.10.009
Tang, Z., Kang, B., Li, C., Chen, T., and Zhang, Z. (2019). GEPIA2: An enhanced web server for large-scale expression profiling and interactive analysis. Nucleic Acids Res. 47 (W1), W556–W560. doi:10.1093/nar/gkz430
Terry, S., Savagner, P., Ortiz-Cuaran, S., Mahjoubi, L., Saintigny, P., Thiery, J. P., et al. (2017). New insights into the role of EMT in tumor immune escape. Mol. Oncol. 11 (7), 824–846. doi:10.1002/1878-0261.12093
Topalian, S. L., Drake, C. G., and Pardoll, D. M. (2015). Immune checkpoint blockade: A common denominator approach to cancer therapy. Cancer Cell 27 (4), 450–461. doi:10.1016/j.ccell.2015.03.001
Uhlén, M., Fagerberg, L., HALLSTRöM, B. M., Lindskog, C., Oksvold, P., Mardinoglu, A., et al. (2015)., 347. New York, NY), 1260419. doi:10.1126/science.1260419Proteomics. Tissue-based map of the human proteome.Science6220
Weinstein, J. N., Collisson, E. A., Mills, G. B., Shaw, K. R. M., Ozenberger, B. A., Ellrott, K., et al. (2013). The cancer Genome Atlas pan-cancer analysis project. Nat. Genet. 45 (10), 1113–1120. doi:10.1038/ng.2764
Whiteside, T. L. (2008). The tumor microenvironment and its role in promoting tumor growth. Oncogene 27 (45), 5904–5912. doi:10.1038/onc.2008.271
Wu, T., and Dai, Y. (2017). Tumor microenvironment and therapeutic response. Cancer Lett. 387, 61–68. doi:10.1016/j.canlet.2016.01.043
Yoshihara, K., Shahmoradgoli, M., MARTíNEZ, E., Vegesna, R., Kim, H., Torres-Garcia, W., et al. (2013). Inferring tumour purity and stromal and immune cell admixture from expression data. Nat. Commun. 4, 2612. doi:10.1038/ncomms3612
Yu, G. P., Chiang, D., Song, S. J., Hoyte, E. G., Huang, J., Vanishsarn, C., et al. (2009). Regulatory T cell dysfunction in subjects with common variable immunodeficiency complicated by autoimmune disease. Clin. Immunol. 131 (2), 240–253. doi:10.1016/j.clim.2008.12.006
Keywords: chemotherapy, DCBLD2, immunotherapy, prognosis, pan-cancer
Citation: Xie P, Liu J-Y, Yan H, Wang Z-B, Jiang S-L, Li X and Liu Z-Q (2022) Pan-cancer analyses identify DCBLD2 as an oncogenic, immunological, and prognostic biomarker. Front. Pharmacol. 13:950831. doi: 10.3389/fphar.2022.950831
Received: 23 May 2022; Accepted: 05 July 2022;
Published: 11 August 2022.
Edited by:
Yuanting Zheng, Fudan University, ChinaReviewed by:
Jian-Ting Zhang, University of Toledo, United StatesHuichang Bi, Southern Medical University, China
Copyright © 2022 Xie, Liu, Yan, Wang, Jiang, Li and Liu. This is an open-access article distributed under the terms of the Creative Commons Attribution License (CC BY). The use, distribution or reproduction in other forums is permitted, provided the original author(s) and the copyright owner(s) are credited and that the original publication in this journal is cited, in accordance with accepted academic practice. No use, distribution or reproduction is permitted which does not comply with these terms.
*Correspondence: Zhao-Qian Liu, zqliu@csu.edu.cn; Xi Li, bayern@csu.edu.cn
†These authors have contributed equally to this work and share first authorship