 Johannes Matthaei1
 Jürgen Brockmöller1
 Werner Steimer2Konstanze Pischa2Stefan Leucht3Maria Kullmann1
 Ole Jensen1Typhaine Ouethy1
 Mladen Vassilev Tzvetkov1,4
 Muhammad Rafehi1*
- 1Institute of Clinical Pharmacology, University Medical Center Göttingen, Georg-August University, Göttingen, Germany
- 2Institute for Clinical Chemistry and Pathobiochemistry, Klinikum rechts der Isar, Technical University of Munich, Munich, Germany
- 3Section Evidence Based Medicine in Psychiatry and Psychotherapy, Department of Psychiatry and Psychotherapy, Klinikum rechts der Isar, Technical University of Munich, Munich, Germany
- 4Institute of Pharmacology, Center of Drug Absorption and Transport (C_DAT), University Medicine Greifswald, Greifswald, Germany
The tricyclic antidepressant amitriptyline is frequently prescribed but its use is limited by its narrow therapeutic range and large variation in pharmacokinetics. Apart from interindividual differences in the activity of the metabolising enzymes cytochrome P450 (CYP) 2D6 and 2C19, genetic polymorphism of the hepatic influx transporter organic cation transporter 1 (OCT1) could be contributing to interindividual variation in pharmacokinetics. Here, the impact of OCT1 genetic variation on the pharmacokinetics of amitriptyline and its active metabolite nortriptyline was studied in vitro as well as in healthy volunteers and in depressive disorder patients. Amitriptyline and nortriptyline were found to inhibit OCT1 in recombinant cells with IC50 values of 28.6 and 40.4 µM. Thirty other antidepressant and neuroleptic drugs were also found to be moderate to strong OCT1 inhibitors with IC50 values in the micromolar range. However, in 35 healthy volunteers, preselected for their OCT1 genotypes, who received a single dose of 25 mg amitriptyline, no significant effects on amitriptyline and nortriptyline pharmacokinetics could be attributed to OCT1 genetic polymorphism. In contrast, the strong impact of the CYP2D6 genotype on amitriptyline and nortriptyline pharmacokinetics and of the CYP2C19 genotype on nortriptyline was confirmed. In addition, acylcarnitine derivatives were measured as endogenous biomarkers for OCT1 activity. The mean plasma concentrations of isobutyrylcarnitine and 2-methylbutyrylcarnitine were higher in participants with two active OCT1 alleles compared to those with zero OCT1 activity, further supporting their role as endogenous in vivo biomarkers for OCT1 activity. A moderate reduction in plasma isobutyrylcarnitine concentrations occurred at the time points at which amitriptyline plasma concentrations were the highest. In a second, independent study sample of 50 patients who underwent amitriptyline therapy of 75 mg twice daily, a significant trend of increasing amitriptyline plasma concentrations with decreasing OCT1 activity was observed (p = 0.018), while nortriptyline plasma concentrations were unaffected by the OCT1 genotype. Altogether, this comprehensive study showed that OCT1 activity does not appear to be a major factor determining amitriptyline and nortriptyline pharmacokinetics and that hepatic uptake occurs mainly through other mechanisms.
Introduction
Amitriptyline (AT) is a tricyclic antidepressant that has been in use for the therapy of major depression and other psychiatric disorders since the 1960ies. It is still frequently used today but usually as second-line therapy, due to its risk for severe adverse reactions. In addition, AT and its active metabolite nortriptyline (NT) show large interindividual variation in pharmacokinetics and, accordingly, there is substantial interest in therapy individualisation by drug monitoring and using molecular genetic biomarkers for polymorphic drug membrane transport and biotransformation (Hiemke et al., 2018). The mechanism of action involves reuptake inhibition of serotonin and noradrenaline in the synaptic cleft (Gillman, 2007). Adverse reactions are concentration-dependent and can result from antagonism of H1 histamine, alpha-1-adrenergic, and muscarinic receptors (Richelson, 1979; Kachur et al., 1988; Goldman et al., 1989; Ramakrishna and Subhash, 2012). Apart from being an antidepressant, AT is also used at lower doses for migraine prophylaxis, the management of neuropathic pain, in irritable bowel syndrome, and for the treatment of fibromyalgia (Moore et al., 2015; Rico-Villademoros et al., 2015; Silberstein, 2015; Schneider et al., 2019).
Upon systemic absorption, AT is subject to extensive hepatic metabolism, with less than 5% excreted unchanged in urine (Rudorfer and Potter, 1999). AT is metabolised mainly by cytochrome P450 (CYP) 2D6 into hydroxylated metabolites and by CYP2C19 to NT (Figure 1), which itself is also a tricyclic antidepressant (Breyer-Pfaff, 2004; Hicks et al., 2017). In fact, both, the more serotoninergic AT and its more noradrenergic metabolite NT, contribute to the therapeutic effects after AT administration (Hiemke et al., 2018). Both CYP2D6 and CYP2C19 are genetically highly polymorphic (Dalén et al., 1998; Zhou, 2009; Bahar et al., 2017; Sienkiewicz-Oleszkiewicz and Wiela-Hojeńska, 2018), and the substantial impact this has on AT and NT pharmacokinetics has been known for several decades (Mellström et al., 1983; Baumann et al., 1986; Steimer et al., 2004; Steimer et al., 2005; Milosavljevic et al., 2021). It has since been strongly recommended to implement regular CYP2D6 and CYP2C19 genotyping in AT therapy and consider personalised dose adjustments (Kirchheiner et al., 2001; Hicks et al., 2017).
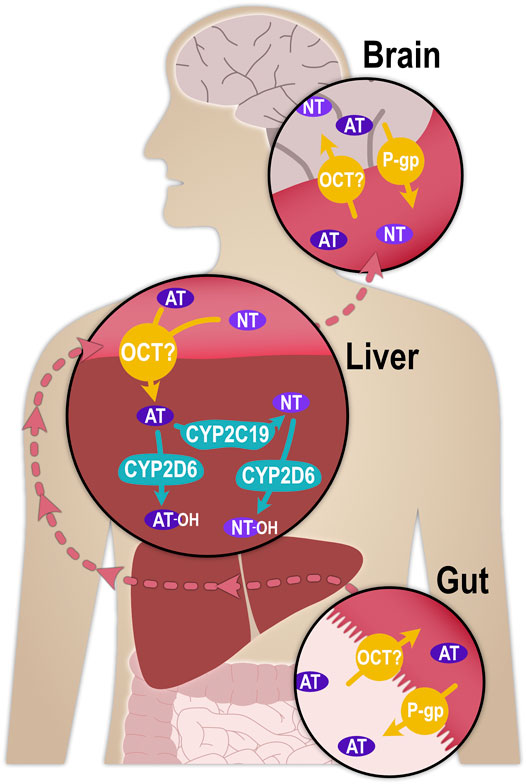
FIGURE 1. Schematic illustration of the processes that determine the pharmacokinetics of AT and NT. P-glycoprotein (P-gp, MDR1, ABCB1), as part of the blood-brain-barrier, was shown in mice to transport AT and NT from the central nervous system into brain capillaries, thereby determining their concentrations at the synapse (Uhr, 2000; Grauer and Uhr, 2004; Uhr et al., 2007).
For hepatic metabolism to occur, AT must first enter the hepatocytes. With a pKa of 9.4, approximately 99% of AT is positively charged at physiological pH and, despite its lipophilicity (logD7.4 of 3), it may traverse cell membranes more efficiently by carrier-mediated transport than by non-ionic diffusion. One possible influx transporter with particular relevance for hepatic uptake could be the organic cation transporter 1 (OCT1; SLC22A1), a member of the Solute Carrier (SLC) family with a very broad substrate profile (Koepsell, 2020). OCT1 is abundantly expressed at the sinusoidal membrane of hepatocytes (Nishimura and Naito, 2005), where it mediates the hepatic uptake of organic, mostly cationic endogenous and exogenous small molecule compounds. A large number of inherited variants in the gene coding for OCT1 with comparatively high population frequencies have been described, and carriers of some of these variants showed greatly reduced or completely deficient transport activity (Seitz et al., 2015). OCT1 polymorphism may thus partially account for interindividual differences in the pharmacokinetics of numerous drugs (Tzvetkov et al., 2011; Tzvetkov et al., 2013; Tzvetkov et al., 2018; Matthaei et al., 2019; Koepsell, 2020; Jensen et al., 2021). The increased plasma concentrations of these drugs in some patients as a result of OCT1 (partial or complete) deficiency may lead to more severe adverse reactions. This could potentially be the case for AT and NT as well, and the aim of this study was to explore this possibility.
Genome-wide association studies have found a strong association between the SLC22A1 locus and plasma concentrations of acylcarnitines, which are intermediate metabolites of mitochondrial oxidation reactions (Suhre et al., 2011). This provides further insights into the potential physiological functions of OCT1. It is also of medical relevance, as plasma acylcarnitine concentrations have been associated with metabolic disorders, including obesity and diabetes (Adams et al., 2009; Mihalik et al., 2010; Mai et al., 2013). Isobutyrylcarnitine (IBC) has been proposed to function as an endogenous biomarker for studying OCT1 in vivo (Luo et al., 2020). Thus, the effects of AT on plasma IBC concentrations were studied here as well.
The purpose of this study was to investigate whether OCT1 polymorphism may determine the pharmacokinetics of AT and its clinically relevant metabolite NT. This was studied here in vitro, in healthy volunteers, and in depressive disorder patients. In addition, the impact of CYP2D6 and CYP2C19 genetic polymorphism on AT and NT pharmacokinetics was characterized further and possible effects of AT on plasma IBC concentrations were explored.
Materials and Methods
In vitro OCT1 Inhibition Experiments
The inhibition of OCT1 by different psychotropic drugs was studied in transport experiments using HEK293 cells stably transfected with wild-type OCT1. The cells were generated by targeted chromosomal integration using the Flp-In system (Thermo Fisher Scientific, Darmstadt, Germany), as has been described in detail before (Saadatmand et al., 2012). The cells were cultured in Dulbecco’s Modified Eagle’s Medium supplemented with 10% foetal bovine serum, 100 U/ml penicillin, and 100 μg/ml streptomycin at 37°C, 5% CO2, and 95% relative humidity. Cells were kept in culture for no more than 30 passages. All buffers and reagents were purchased from Thermo Fisher Scientific (Darmstadt, Germany).
Approximately 48 h before the transport experiments, recombinant OCT1-expressing cells and empty vector-transfected control cells were seeded at a density of 4 × 10⁵ cells/well in 12-well plates coated with poly-D-lysine and incubated as described above. On the day of the experiment, the cells were washed twice with prewarmed (37°C) Hank’s Balanced Salt Solution (HBSS). They were subsequently incubated for 3 min at 37°C with 1 µM of the fluorescent OCT1 substrate ASP+ (4-(4-(dimethylamino)styryl)-N-methylpyridinium iodide) and increasing concentrations of the antidepressants in 500 µl HBSS. The reaction was stopped by adding 2 ml ice-cold HBSS. This was subsequently removed and the cells were lyzed in 500 µl radioimmunoprecipitation assay (RIPA) buffer for 10 min under shaking. The cell uptake of ASP+ was quantified using a Tecan Ultra microplate reader (Tecan Group AG, Männedorf, Switzerland) at excitation wavelength 485 nm and emission wavelength 612 nm. The intracellular ASP+ concentrations were normalised to the total amount of protein in the sample that was determined using the bicinchoninic acid assay (Smith et al., 1985). IC50 values were calculated using SigmaPlot 11 (Systat Software GmbH, Erkrath, Germany) and Prism 5 (GraphPad Software, San Diego, CA, United States).
Subjects and Study Designs
Study in Healthy Volunteers
In this open-label study, the pharmacokinetics of 25 mg AT were analysed in relation to OCT1, CYP2D6, and CYP2C19 genotypes. In total, 35 unrelated healthy volunteers participated in this study. When considering the frequent OCT1 alleles *2, *3, *4, *5, and *6 to be functionally deficient, approximately 25% of Europeans are carriers of at least one deficient OCT1 variant and about 7% are homozygously deficient with respect to OCT1 (Seitz et al., 2015). In order to enrich the study sample with the less frequent functionally deficient OCT1 variants, participants were selected based on OCT1 genotype from an internal database at the Institute of Clinical Pharmacology of the University Medical Center Göttingen. All volunteers who are listed in the internal database had agreed to it and the database was approved by the ethics committee of the University of Göttingen. The number of participants for each group (carriers of 2, 1, and 0 active OCT1 alleles; Tables 1, 2) was calculated to achieve 80% power to identify a 50% difference in the area under the plasma concentration-time curve (AUC; the primary parameter in this study) in the carriers of 2 compared to the carriers of 0 active OCT1 alleles with a type-I (alpha) error of 5% and assuming a 35% standard deviation of the AUC in both groups. A 50% decrease in clearance is a reasonable effect size in comparison with known effects of CYP2D6 polymorphism on the AUCs of AT and NT (Kirchheiner et al., 2004) and considering that clinical drug dose adjustments are typically by about 50% or more. Additional subjects with heterozygous genotypes were included to provide a better understanding of the effects of specific variants and the mode of inheritance. All volunteers gave their written informed consent before participation in the study. The study was approved by the ethics committee of the University of Göttingen and the German Federal Institute for Drugs and Medical Devices (BfArM). It was registered at the clinical trials databases Clinicaltrials.gov (NCT02054299) and EudraCT (number 2012-003546-33).
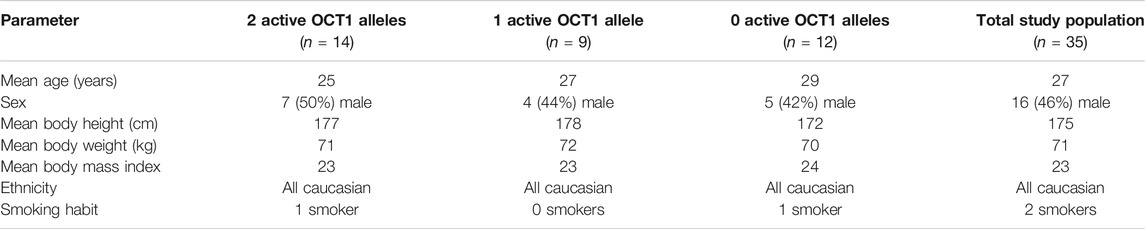
TABLE 1. Demographic data of the healthy volunteer study population stratified by OCT1 genotype.
Healthy male and female volunteers aged between 18 and 50 y with a body mass of at least 48 kg and a body mass index of 17–32 were eligible for inclusion. Volunteers who underwent regular drug treatments other than oral contraceptives or who suffered from any relevant chronic illness, as well as pregnant or lactating women, were not included. All subjects were healthy according to a detailed medical history, medical examination, electrocardiogram, urine status and clinical chemistry, and haematology parameters (sodium, potassium, total bilirubin, aspartate aminotransferase, alanine-aminotransferase, creatinine, C-reactive protein, thyroid-stimulating hormone, haemoglobin, erythrocyte, thrombocyte, and leucocyte counts).
After overnight fasting, a single dose of 25 mg AT (Amitriptylin-dura®, Mylan dura GmbH, Darmstadt, Germany) was orally administered to each subject. Blood samples were taken before AT administration and at 1, 2, 4, 6, 8, 12, 24, and 48 h after administration. The blood samples were centrifuged at room temperature for 10 min and the plasma was stored at −20°C before the concentration analyses. Blood pressure and heart rate were measured, a resting electrocardiogram was taken, pupillometry measurement was taken, and the participants were asked to report on any adverse events and possible symptoms (specifically, we asked for possible headache, fatigue, sleepiness, visual or hearing impairments, restlessness, nausea, dizziness, dry mouth, tremor, and a sensation of cold) using visual analogue scales 1 h before AT administration and at the following time points after administration: 65 min, 3, 5, 7, 11.5, 23.5, and 47.5 h.
Study in Depressive Disorder Patients
In addition to the study in healthy volunteers described above, possible effects of the OCT1 genotype on AT pharmacokinetics were also investigated in 50 patients suffering from at least medium-grade depressive disorder. These patients had been recruited within a previous study, in which the effects of different CYP2D6 and CYP2C19 genotypes on AT and NT pharmacokinetics as well as on adverse effects and therapy response were investigated. A detailed description of the study sample, the study design, and the results pertaining to CYP2D6 and CYP2C19 polymorphism are found in the respective publications (Steimer et al., 2004, 2005). Briefly, 75 mg AT was administered twice daily at 12 h dosing intervals. Any drugs or dietary ingredients that might interfere with CYP2D6 or CYP2C19 metabolism were avoided whenever possible. Blood samples (12-hour-trough levels) were taken on days 0, 7, 14, 18, and 21, centrifuged, and stored at 4°C for genotyping (CYP2D6 and CYP2C19) and concentration analyses. The blood samples were subsequently stored at −20°C and later genotyped for OCT1. The study has been approved by the ethics committee of the Technical University of Munich, Germany.
Bioanalytics
Study in Healthy Volunteers
The peripheral venous blood samples of the healthy volunteers were treated with ethylenediaminetetraacetic acid (EDTA) for anticoagulation, centrifuged within 30 min after withdrawal (3,100 × g, 10 min, room temperature), and the plasma was stored at −20°C. For determining the plasma concentrations of AT, NT, IBC, 2-methylbutyrylcarnitine, and propionylcarnitine, plasma samples were mixed with twice the volume precipitation reagent of 10% (v/v) methanol and 90% (v/v) acetonitrile that included the corresponding deuterated internal standards AT-d6 (Biozol Diagnostica GmbH, Eching, Germany), NT-d3, IBC-d6, 2-methylbutyrylcarnitine-d9, and propionylcarnitine-d3 and d9 (all Santa Cruz Biotechnology, Heidelberg, Germany) and shaken for 15 min. After centrifugation (13,000 rpm, 15 min, room temperature), two-thirds of the supernatant were transferred to a new reaction tube and evaporated at 40°C under nitrogen flow. The residue was reconstituted under shaking in 0.1% methanoic acid and briefly centrifuged before quantification using a Nexera UHPLC system (Shimadzu, Kyoto, Japan) coupled to an API 4000 tandem mass spectrometer (AB Sciex, Darmstadt, Germany). Separation was done using a Brownlee SPP RP-Amide column (4.6 × 100 mm inner dimensions, 2.7 µm particle size; PerkinElmer, Rodgau, Germany) with a Phenomenex C18 pre-column (4 × 2 mm, Phenomenex, Aschaffenburg, Germany). For AT and NT, the mobile phase consisted of 0.1% (v/v) methanoic acid, 5.3% (v/v) methanol, and 31.7% (v/v) acetonitrile in water. For the carnitine derivatives, it consisted of 0.1% (v/v) methanoic acid, 0.43% (v/v) methanol, and 2.57% (v/v) acetonitrile in water. The lower limit of quantification was 0.5 ng/ml for AT and 0.1 ng/ml for NT. Precision and accuracy were controlled by additional control samples spiked with 2 and 20 ng/ml of AT and NT, resulting in coefficients of variation of 6.0 and 3.8% (means of 2.02 and 19.5 ng/ml) for AT and of 3.8 and 2.7% (means of 1.91 and 18.8 ng/ml) for NT. The mass spectrometry detection parameters are listed in Supplementary Table S1.
Study in Depressive Disorder Patients
The serum concentrations in depressive disorder patients were determined either by the Emit® immunoassay specific for AT and NT or a commercial high-performance liquid chromatography assay (Bio-Rad Laboratories GmbH, Feldkirchen, Germany), as described before (Steimer et al., 2004; Steimer et al., 2005).
Genotyping
For both studies, genomic DNA was isolated from venous blood samples via automated solid phase extraction (EZ1 DNA Blood kit; Qiagen, Hilden, Germany). The following genetic variants were analysed using single-base primer extension using fluorescence-labelled dideoxynucleotides (described by Seitz et al. (2015) and Kirchheiner et al. (2008)) for OCT1: *1 (wild-type), *2 (M420del, rs72552763), *3 (R61C, rs12208357), *4 (G401S, rs34130495), *5 (G465R, rs34059508 in combination with M420del, rs72552763), *6 (C88R, rs55918055 in combination with M420del, rs72552763), *7 (S14F, rs34447885), *9 (P117L, rs200684404), and *10 (S189L, rs34104736); for CYP2D6: *1, *2, *3, *4, *5, *6, *9, *10, *35, *41, and gene duplication. The CYP2C19 variants *2 (rs4244285) and *17 (rs12248560) and the OCT1 variant *8 (Arg488Met, rs35270274) were genotyped using a TaqMan SNP genotyping assay (Life Technologies). Almost all samples were genotyped in duplicate, with 100% concordant results.
Statistics
For the study in healthy volunteers, the primary endpoints were the AUCs of plasma AT and NT concentrations. Secondary endpoints were the other pharmacokinetic parameters of AT and NT, as well as heart rate, blood pressure, pupil size effects, and possible adverse events (headache, fatigue, visual or hearing impairments, restlessness, nausea, dizziness, dry mouth, tremor, as well as sensations of hypothermia and heart palpitations determined using a visual analogue scale test). Pharmacokinetic parameters were calculated by non-compartmental analysis using Phoenix 64 WinNonlin version 6.3 (Certara Inc., Princeton, NJ, United States). AUCinf of AT was calculated from the time of dosing using the linear/log trapezoidal rule and extrapolated to infinity based on the last predicted concentration and using the terminal elimination rate constant (lambda z). AUC of NT was calculated from the time of dosing until the last measurement at 48 h using the linear/log trapezoidal rule, as a decline in NT concentrations was not observed in some subjects and extrapolation to infinity thus not possible. Further parameters that were studied included the total plasma clearance after oral administration (CL/F) and the terminal half-life (t1/2), which were calculated as CL/F = dose/AUCinf and t1/2 = ln (2)/lambda z.
The correlation between AT and NT plasma AUC (study in healthy volunteers) or mean plasma concentration per dose unit (study in depressive disorder patients) and OCT1, CYP2D6, and CYP2C19 genotypes were calculated using the Jonckheere-Terpstra non-parametric analysis, which takes into consideration the a priori ordering (or trend) in gene activities from zero to normal to ultra-rapid (for CYP2C19 and CYP2D6). To do so, the genotypes were categorized into 0, 1, or 2 active alleles for OCT1, into 0, 0.5, 1, 1.5, 2, 2.5, or 3 active alleles for CYP2D6, and into 0, 1, 1.5, 2, 2.5, or 3 active alleles for CYP2C19, depending on their known effects on transporter/enzyme activity. OCT1 alleles *2, *3, *4, *5 were classified as being zero active. However, given the substrate-dependent effects of OCT1*2, calculations were repeated with OCT1*2 classified as being fully active. A semi-quantitative gene dosage was calculated for CYP2D6, as has been described earlier (Steimer et al., 2004). For calculating a CYP2C19 activity score, CYP2C19*2 was regarded as zero active, CYP2C19*1 was classified as 1, and CYP2C19*17 as 1.5. Additional multiple linear regression analyses included sex, age, body mass index, and glomerular filtration rate.
Dose-Adjustment Calculations
The genotype-based dosage adjustment recommendations were calculated by using the equations described in Stingl et al. (2013) (supplementary data), modified to base these calculations on AUC data instead of clearance values. The adjusted dose was thereby calculated for CYP2D6 extensive metabolisers (EM) as DEM = 100/(0.1 × AUCEM/AUCPM + 0.4 × AUCEM/AUCIM + 0.5) and for CYP2C19 EM as DEM = 100/(0.03 × AUCEM/AUCPM + 0.27 x AUCEM/AUCIM + 0.7). The dose adjustments for the poor (PM), intermediate (IM), and ultra-rapid (UM) metaboliser phenotypes were calculated as follows: DPM or IM or UM = DEM x AUCEM/AUCPM or IM or UM. The multipliers in the EM calculations account for the typical population frequencies of the respective genotypes in European populations (e.g. 0.1 for 10% of CYP2D6 PM). The rationale behind these calculations is that the average recommended drug dose usually determined without considering the genotypes was chosen as the average optimum for populations with the given genotype frequencies (Kirchheiner et al., 2001).
Results
In vitro Inhibition of OCT1 by Different Psychotropic Drugs
Thirty-two clinically relevant antidepressants, neuroleptics, and an anticholinergic drug for the treatment of Parkinson’s disease were screened for OCT1 inhibition. These have been selected based on their positive charge at physiological pH, as charged compounds are mostly unable to efficiently traverse biological membranes through passive diffusion and their pharmacokinetics might depend on transport proteins, such as OCT1. An inhibitor for a transporter does not necessarily have to be a substrate as well, but for many compounds, this is indeed the case. The psychotropic drugs were assessed for their potential to inhibit cell uptake of the fluorescent OCT1 model substrate ASP+ (4-(4-(dimethylamino)styryl)-N-methylpyridinium iodide) in OCT1-overexpressing cells. As shown in Figure 2, most of the tested compounds showed inhibitory potencies in the low to mid-micromolar range, indicating that these are moderate to strong inhibitors of OCT1. AT showed a mean IC50 value of 28.6 ± 18.9 µM and NT of 40.4 ± 16.2 µM, which is in agreement with previously reported data (Haenisch et al., 2012; Zhu et al., 2018). Because of this interaction with OCT1 and its widespread clinical use, AT was further analyzed with respect to the impact of genetic variation in OCT1 in volunteer and patient studies.
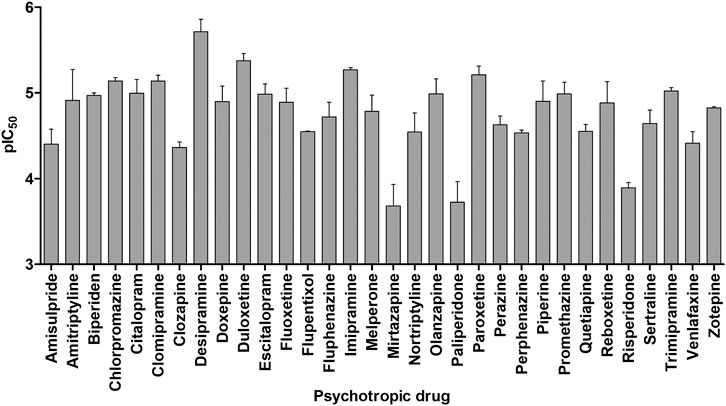
FIGURE 2. In vitro assessment of OCT1 inhibition by a range of different antidepressant and neuroleptic drugs. Shown is the mean negative logarithm of the IC50 values of 3–4 independent experiments, the error bars indicate the SEM.
Pharmacokinetics of Amitriptyline and Nortriptyline in Relation to OCT1, CYP2D6, and CYP2C19 Genotypes in Healthy Volunteers
In the clinical study in healthy volunteers, preselected according to their OCT1 genotype, 35 volunteers (19 female and 16 male) received 25 mg of AT as a single dose. The study participants were between 18 and 48 y of age, with a mean age of 27 y. The mean body mass index was 23.0 kg/m2. Stratified by OCT1 genotype, 14 subjects were homozygous carriers of the active OCT1*1 (wild-type) allele, nine subjects carried one active allele (OCT1*1) and one allele with no or reduced activity (*2,*3, *4), and 12 subjects were carriers of two OCT1 alleles with no or reduced activity (*2, *3, *4, *5). There were no significant differences in demographic data between the OCT1 genotypes (Table 1).
Large variation was seen in the pharmacokinetics of AT and, even more so, for its therapeutically active metabolite NT. The AUCinf of AT varied about fourfold (range: 109.9–429.9 h*µg/L) and the AUC48h of NT approximately sevenfold (range: 39.3–283.7 h*µg/L). However, these variations were apparently not a result of OCT1 polymorphism, as differences in AUC between carriers of two, one, or zero active OCT1 alleles were not statistically significant (Figure 3; Table 2, Supplementary Figure S1; Supplementary Table S2). The only statistically significant difference in relation to OCT1 genotype was observed for the Tmax of NT (p = 0.016, Jonckheere-Terpstra test), which was almost twofold higher in the group comprised of the carriers of two active OCT1 alleles as compared to the other two groups. However, this difference is likely explained by one subject with particularly high plasma NT concentrations, who had low CYP2D6 activity and very high CYP2C19 activity (Figure 3). Any differences in the AUC48h of the ‘active moiety’ (sum of the AUC48h of AT and NT) between the OCT1 genotypes were not significant (p = 0.059, Jonckheere-Terpstra test).
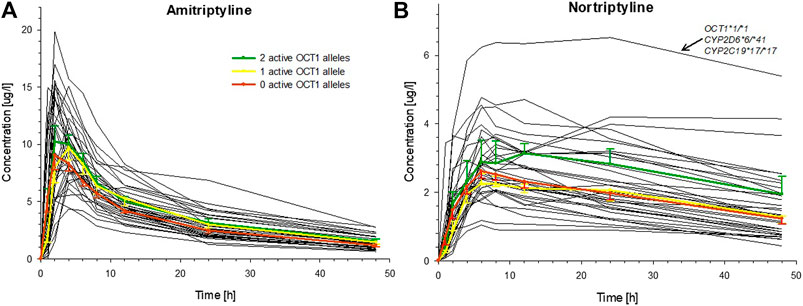
FIGURE 3. Individual plasma concentrations of (A) AT and (B) NT over time for all healthy volunteers (black curves), indicating the large interindividual variation for these tricyclic antidepressants. The mean (±SEM) concentrations for carriers of two (green), one (yellow), or zero (red) active OCT1 alleles are superimposed (OCT1-dependent differences in AUC were not statistically significant). The single participant with the highest NT concentrations had wild-type OCT1 genotype, reduced activity CYP2D6 genotype, and a very high activity CYP2C19 genotype.
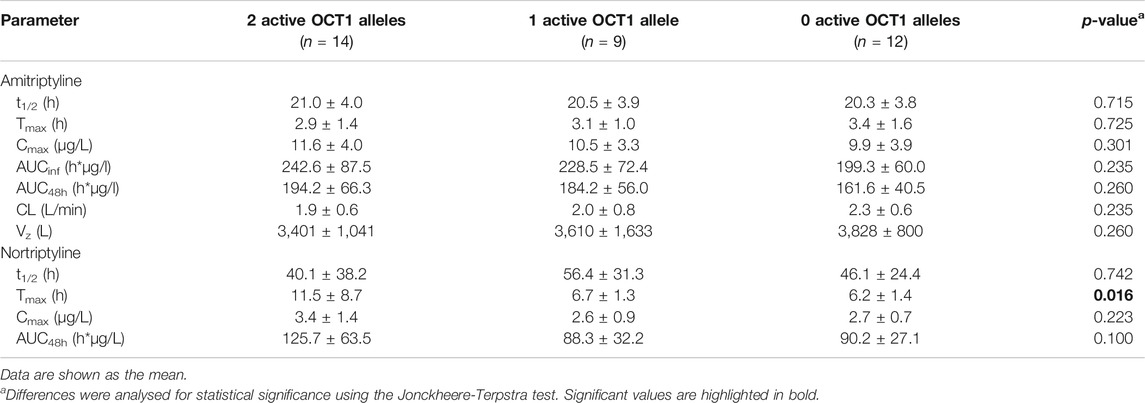
TABLE 2. Pharmacokinetic parameters stratified by OCT1 genotype.
Interestingly, if OCT1*2 would be considered as being fully active, Tmax, Cmax, and AUC48h for NT differed significantly based on OCT1 genotype (p = 0.050, 0.018, and 0.011, respectively), whereas any differences in AT pharmacokinetic parameters were still statistically not significant.
The CYP2D6 genotype had a strong effect on the pharmacokinetics of AT and NT. The plasma concentrations of AT and NT increased with decreasing CYP2D6 activity (Figure 4), and subjects with lower CYP2D6 activity showed a higher AUCinf and AUC48h as well as a longer plasma half-life and a lower AT clearance (Table 3). The CYP2C19 genotype had no significant effect on AT pharmacokinetics (Figure 4) but subjects with higher CYP2C19 activity showed a higher NT AUC48h and Cmax compared to subjects with lower CYP2C19 activity (Figure 4; Table 4).
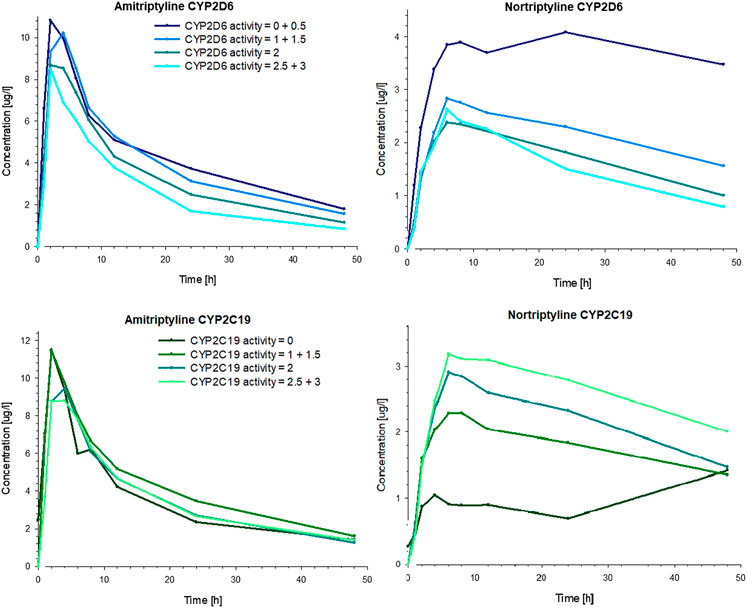
FIGURE 4. Mean plasma concentrations of AT (left) and NT (right) in healthy volunteers over time, stratified by the number of active alleles for CYP2D6 (top) and CYP2C19 (bottom).
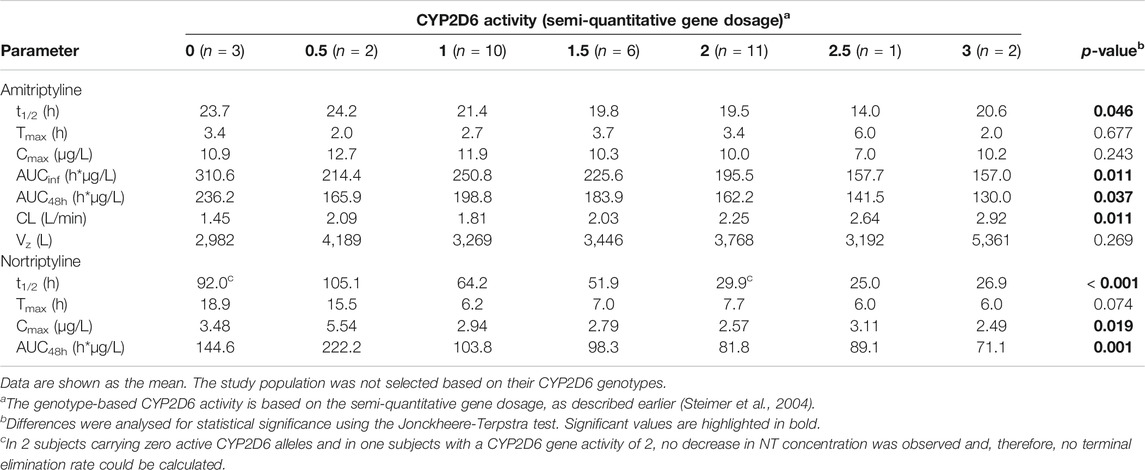
TABLE 3. Pharmacokinetic parameters stratified by CYP2D6 genotype.
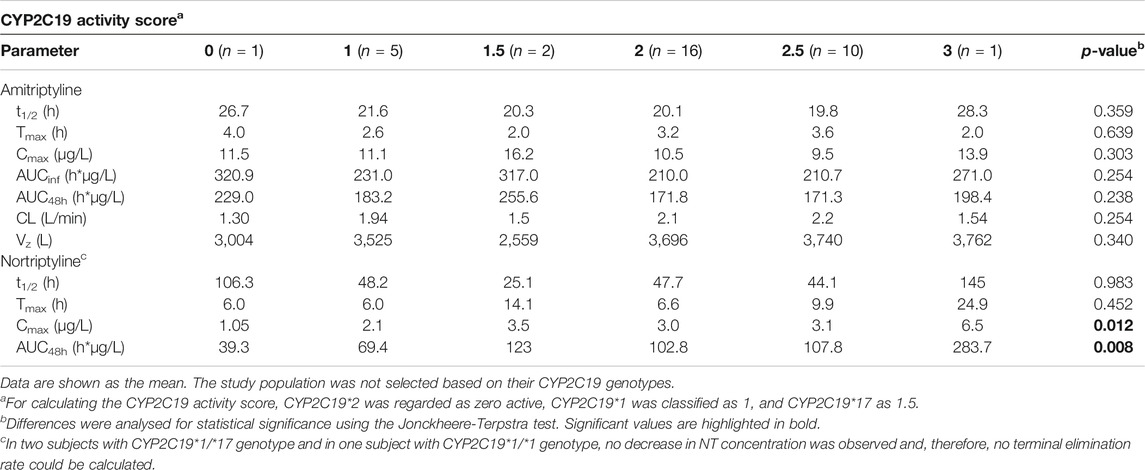
TABLE 4. Pharmacokinetic parameters stratified by CYP2C19 genotype.
A multiple linear regression analysis confirmed statistically significant effects of CYP2D6 genotype on AT pharmacokinetics (Table 5). CYP2D6 genotype accounts for 43% of the variation. Concerning NT, both CYP2D6 and CYP2C19 genotypes had statistically significant effects on the AUC48h and could explain 58% of the variation. In contrast, OCT1 genotype, gender, age, body mass index, and glomerular filtration rate had no significant effects on the variation in both the AUCinf of AT and the AUC48h of nortiptyline.
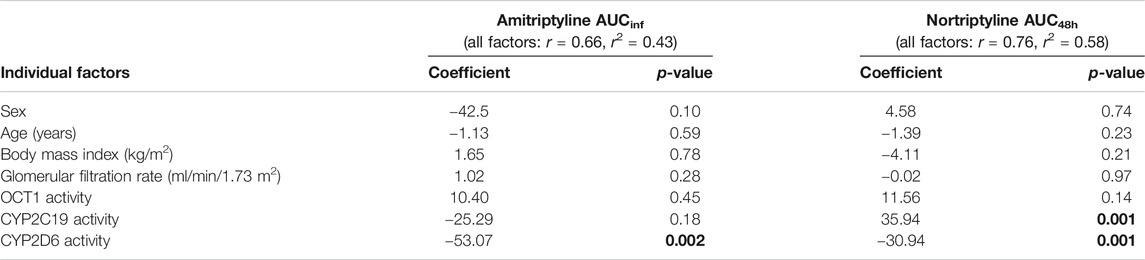
TABLE 5. Multiple linear regression analysis to determine the individual factors that influence AT and NT AUC in healthy volunteers.
Adverse Effects of Amitriptyline
AT was generally well-tolerated and no serious adverse events occurred during the entire study. Using visual analogue scales, the participants reported symptoms of fatigue, which peaked at 3 h after AT administration at which plasma AT concentrations were generally the highest (Figure 5). However, it should be taken into consideration that no placebo control was used in this pharmacokinetic study, and a fully valid assessment of adverse effects was thus not possible (i.e. reported adverse effects might not exclusively be due to AT administration but could be a result of the ‘placebo effect’ as well). The intensity of fatigue was not dependent on OCT1, CYP2D6, or CYP2C19 genotypes (p > 0.05, Jonckheere-Terpstra test). Statistically significant time- and concentration-related adverse effects like dry mouth, visual or hearing impairment, restlessness, headache, nausea, dizziness, or a sensation of cold reported using visual analogue scales as well as potential anticholinergic effects studied by pupillometry were not observed after the 25 mg AT dose.
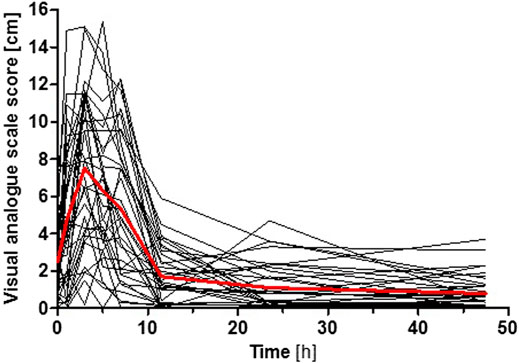
FIGURE 5. Intensity of fatigue after AT administration reported by the participants using a visual analogue scale. Shown is the time course for each participant (black curves) and the mean superimposed (red curve). The intensity of fatigue was not dependent on OCT1, CYP2D6, or CYP2C19 genotypes (p > 0.05, Jonckheere-Terpstra test).
Pharmacokinetics of Amitriptyline and Nortriptyline in Relation to OCT1 Genotype in Depressive Disorder Patients
Possible differences due to OCT1 polymorphism on the pharmacokinetics of AT and its metabolite NT were additionally studied in 50 patients suffering from medium-grade to severe depressive disorder that were recruited as part of a previous study on the impact of CYP2D6 and CYP2C19 polymorphism on AT and NT pharmacokinetics, adverse effects, and therapy response (Steimer et al., 2004; Steimer et al., 2005). These underwent a therapy of 75 mg AT twice daily at 12 h dosing intervals. Out of these 50 patients, 27 were carriers of two active OCT1 alleles (OCT1*1/*1; Supplementary Table S3), 17 were carriers of one active OCT1 allele (*1 in combination with *2, *3, or *4), and six patients carried zero active OCT1 alleles (*2, *3, or *4). Different CYP2D6 and CYP2C19 genotypes were found to be similarly distributed across all three groups (Table 6). A trend of increasing plasma concentrations with decreasing OCT1 activity was seen for AT (Figure 6, Supplementary Figure S2; Supplementary Table S3). Although the differences in mean AT concentrations between the three groups were rather modest, they showed statistical significance (p = 0.018, Jonckheere-Terpstra test). In contrast, mean plasma NT concentrations per dose unit were relatively similar for all OCT1 genotypes. Differences in the ‘active moiety’ (sum of AT and NT plasma concentrations) between OCT1 genotypes were significant (p = 0.036, Jonckheere-Terpstra test). Multiple linear regression analysis showed significant effects for OCT1 and CYP2C19 on AT and highly significant effects for CYP2D6 on NT mean plasma concentrations per dose unit (Table 7).
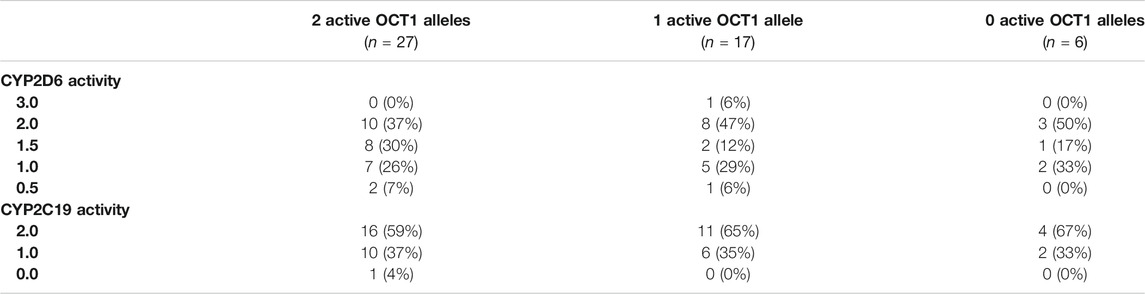
TABLE 6. Distribution of CYP2D6 and CYP2C19 activity across the study sample of 50 depressive disorder patients, stratified by OCT1 genotype.
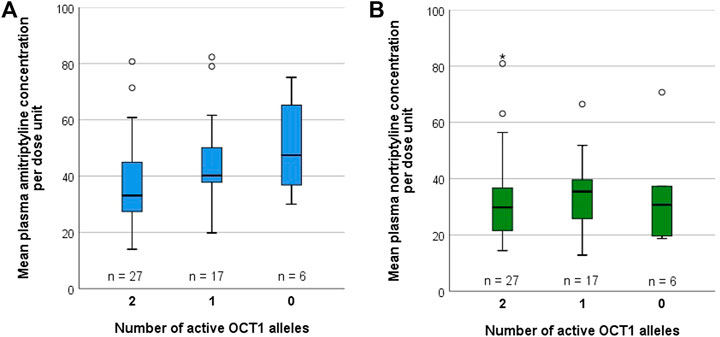
FIGURE 6. Mean plasma concentrations per dose unit of (A) AT and (B) NT, stratified by OCT1 genotype, in 50 depressive disorder patients who underwent AT therapy.
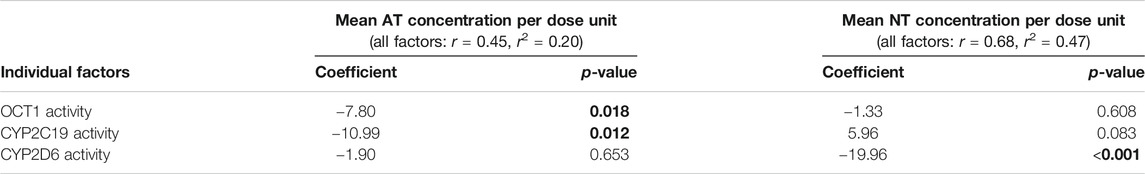
TABLE 7. Multiple linear regression analysis to determine the individual factors that influence mean plasma AT and NT concentrations per dose unit in depressive disorder patients.
If OCT1*2 would be considered as being fully active, 44 patients would be carriers of two active OCT1 alleles, five patients would be carriers of one active OCT1 allele, and one patient would be a carrier of zero active OCT1 alleles. With this classification, the mean plasma concentrations per dose unit were not significantly different between OCT1 genotypes for both AT (p = 0.216, Jonckheere-Terpstra test), and NT (p = 0.800, Jonckheere-Terpstra test), but a trend of increasing plasma concentrations with decreasing OCT1 activity was still seen for AT.
Effects of OCT1 Activity on Plasma Concentrations of Acylcarnitine Derivatives
In order to investigate the proposed suitability of IBC as a human in vivo biomarker for OCT1 activity (Luo et al., 2020), plasma concentrations of IBC as well as of 2-methylbutyrylcarnitine and propionylcarnitine were determined in a subgroup of 18 volunteers who participated in the study on AT pharmacokinetics. Because of the ambiguous role of OCT1*2 with respect to several OCT1 substrates, carriers of OCT1*2 were not included. Baseline IBC plasma concentrations were 2.9- to 4.9-fold and 2-methylbutyrylcarnitine plasma concentrations were 1.3- to 2.3-fold higher in participants with two active OCT1 alleles compared to the participants with zero active OCT1 alleles (p < 0.0001 for both, unpaired t test; Figures 7A,C), whereas plasma propionylcarnitine concentrations were similar for both groups (Figure 7D; p = 0.386, unpaired t test). At time points 2 and 4 h after AT administration, at which plasma AT concentrations were generally the highest, plasma IBC concentrations were reduced to 72 and 67% of the baseline IBC concentrations (p = 0.001 and 0.002, paired t test; Figure 7A).
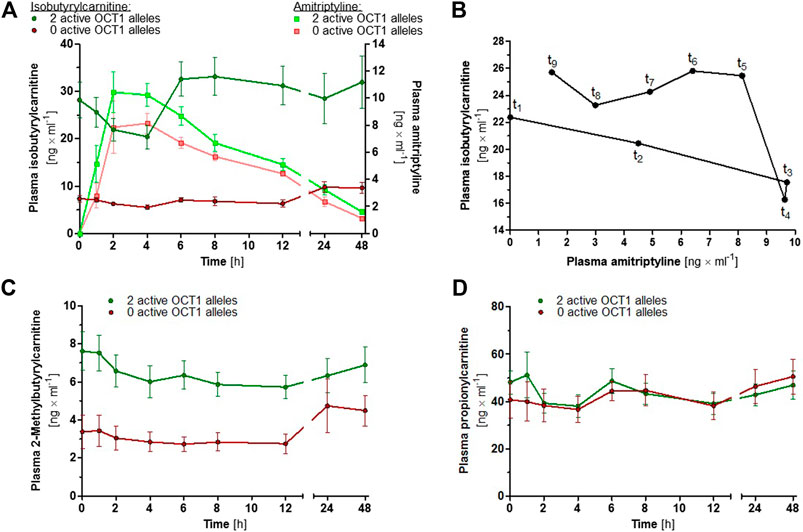
FIGURE 7. (A) Mean ± SEM of IBC (dark coloured circles) and AT (light coloured squares) plasma concentrations over time, stratified by OCT1 genotype (green data points represent two active OCT1 alleles and red data points represent zero active OCT1 alleles; carriers of OCT1*2 were not included). (B) Hysteresis plot showing the mean plasma concentrations of AT and IBC in 13 healthy volunteers with two active OCT1 alleles. (C) Mean ± SEM of 2-methylbutyrylcarnitine and (D) propionylcarnitine plasma concentrations over time, stratified by OCT1 genotype.
Discussion
In this study, the effects of OCT1 polymorphism on AT and NT pharmacokinetics were investigated comprehensively in healthy volunteers and in depressive disorder patients. With their relatively high pKa values, most tricyclic antidepressants could be typical OCT1 substrates, and this hypothesis was further supported by the fact that all tested tricyclic antidepressants were moderate to strong inhibitors of OCT1 (Figure 2). Yet, in our two studies in healthy volunteers and patients, there was no strong and consistent effect of OCT1 on the pharmacokinetics of AT and its active metabolite NT. This indicates that non-ionic diffusion, independent of transporter activity, likely is the main mechanism of biological membrane passage or, alternatively, other transporters are involved. Transporter-mediated hepatocyte uptake could be demonstrated with saturable transport kinetics for imipramine (Hallifax and Houston, 2007), another tricyclic antidepressant with similar lipophilicity. Possible candidates might include the OCTN1 and OCTN2 transporters as well as the proton-coupled organic cation antiporter that has been described in the literature but has not yet been identified on the molecular level (Tega et al., 2021).
While no statistically significant effects for OCT1 polymorphism were observed in healthy volunteers, a moderate trend of increasing plasma concentrations with decreasing OCT1 activity was seen for AT in depressive disorder patients. A possible reason for this discrepancy might be the differences in dose and duration. While the healthy volunteers were given a single dose of 25 mg of AT, the depressive disorder patients received a total of 150 mg per day and measurements were taken over two weeks after steady-state has been achieved. With regard to NT pharmacokinetics, both studies were concordant in that OCT1 does not appear to be a major determining factor.
The fact that only a single dose of AT was given in the study in healthy volunteers and that, accordingly, steady-state plasma concentrations were not achieved, is a potential limitation of this study. Also, it cannot be excluded that OCT1 effects might still be observed at higher dosage. The average Cmax for AT in the healthy volunteers was 10.7 µg/L, or 0.039 µM, which is 730-fold lower than the IC50 of 28.6 µM determined in our in vitro assays.
While it is apparently not necessary to take the OCT1 genotype into consideration for AT or NT dosing, CYP2C19 and CYP2D6 genotypes are highly relevant and AT or NT dosage should be adjusted accordingly (Brockmöller et al., 2000; Hicks et al., 2017). Several approaches have been proposed by different groups but their suggestions are essentially in concordance. Figure 8 and Supplementary Table S4 show earlier recommendations on CYP2D6 and CYP2C19 genotype-based dose adjustments by the Clinical Pharmacogenetics Implementation Consortium (CPIC®; Hicks et al., 2017), the Dutch Pharmacogenetics Working Group (DPWG; guidelines update August 2019), and based on the pharmacokinetic data from more recent clinical studies and from this study by using the calculations described in Stingl et al. (2013). The dosage adjustment recommendations based on the data from this study were similar to those calculated previously by Stingl et al. (2013), except when using the sum of the AUC48 h of AT and NT for calculating adjustments for CYP2C19 poor and ultra-rapid metabolisers. This is likely due to the strong impact this enzyme has on the NT pharmacokinetics.
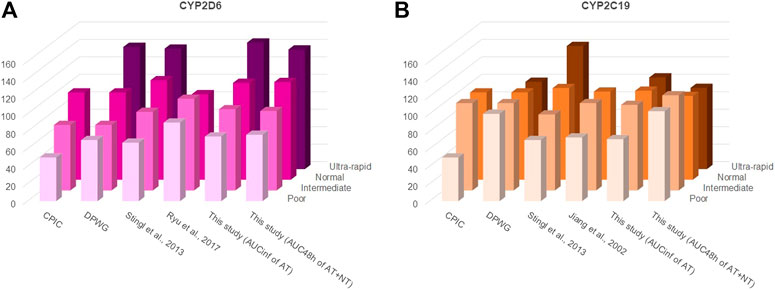
FIGURE 8. Different starting dosage adjustment recommendations from the literature and based on the results of this study for (A) CYP2D6 and (B) CYP2C19. These were taken from the Clinical Pharmacogenetics Implementation Consortium (CPIC®) guideline (Hicks et al., 2017), the Dutch Pharmacogenetics Working Group (DPWG) guideline (August 2019 update), or calculated based on the formulas described by Stingl et al. (2013) and by using the AUCs determined in the respective studies. In accordance with the CPIC® and DPWG final consensus on CYP2D6 genotype to phenotype (Caudle et al., 2020), a CYP2D6 activity score of 0 was classified in this study as poor, of 0.5 and 1 as intermediate, of 1.5 and 2.0 as normal/extensive, and of >2.5 as ultra-rapid metaboliser phenotypes. For CYP2C19, an activity score of 0 was classified in this study as poor, of 1 as intermediate, of 1.5 and 2 as normal/extensive, and of >2 as ultra-rapid metaboliser phenotypes. The starting dosage adjustment recommendations are also listed in Supplementary Table S4. As apparent, there is a high consistency between different recommendations and the measurements from this study, particularly with regard to the CYP2D6 genotype.
OCT1 is able to transport a large number of different compounds, among them many drugs, but its physiological function is not yet understood. As some endogenous acylcarnitines were shown to be OCT1 substrates, a potential physiological role of OCT1 could be the regulation of intracellular concentrations of these carnitine derivatives. It has been proposed that IBC could serve as an endogenous biomarker (Luo et al., 2020), which might be useful for further studying OCT1 activity in humans. Our results confirm its suitability, as up to five-fold differences in IBC plasma concentrations between participants with normal OCT1 activity and carriers of zero active OCT1 alleles were observed. Moreover, peak plasma concentrations of the OCT1 inhibitor AT correlated with a transient reduction in plasma IBC concentrations (Figure 7). The average peak plasma concentration of AT was 10.8 μg/L. With 95% plasma protein binding (Hardman et al., 2001), the peak concentration of unbound AT was 0.54 μg/L. Based on the calculations by Ahlin et al. and Ito et al. (Ito et al., 1998; Ito et al., 2002; Ahlin et al., 2008), the maximum concentration of unbound AT in the portal vein was estimated to be 745.9 µg/L or 2.69 µM. At this concentration, 23% OCT1 inhibition was achieved in vitro, which corresponds to the 33% decrease in IBC plasma concentration observed in vivo. Here, it can be concluded that IBC might indeed be a suitable endogenous OCT1 biomarker. 2-Methylbutyrylcarnitine could be considered as well, as OCT1-dependent differences were also observed, although these were less pronounced and plasma concentrations were generally lower than those of IBC. Despite the structural similarity, propionylcarnitine plasma concentrations were not affected by OCT1 genetic variation. A speculative but possible explanation for the reduction in plasma IBC concentrations at these time points could be a potential inhibition of OCT1 by high plasma AT concentrations. Alternatively, this association could be the result of complex metabolic crosstalk. As a placebo control was not part of this mainly pharmacokinetic study, possible effects due to diurnal rhythm and nutrition cannot be excluded.
In conclusion, the pharmacokinetics of AT and NT are strongly dependent on the CYP2C19 and CYP2D6 genotypes, while OCT1 polymorphism does not appear to be a major medically relevant factor. It thus remains to be elucidated which organic cation transporter(s) are relevant for intestinal absorption, hepatic uptake, and passage across the blood-brain barrier.
Data Availability Statement
The raw data supporting the conclusions of this article will be made available by the authors, without undue reservation.
Ethics Statement
The studies involving human participants were reviewed and approved by the ethics committees of the University of Göttingen and the Technical University of Munich as well as by the German Federal Institute for Drugs and Medical Devices (BfArM). The patients/participants provided their written informed consent to participate in this study.
Author Contributions
Conceptualisation: JB, MT; Formal analysis: JM, MR; Funding acquisition: JB, MT; Investigation: JM, MK, OJ, TO, MT, MR; Project administration: JB, MR; Resources: WS, JB; Supervision: JB; Visualisation: JM, OJ, MR; Writing – original draft: JM, JB, MR; Writing – review & editing: JB, MT, MR.
Funding
Funded in part by the Institute of Clinical Pharmacology, University Medical Center Göttingen and the German Research Foundation (DFG; grant TZ 74/1-1). We are grateful for support by the Open Access Publication Funds of the University of Göttingen.
Conflict of Interest
The authors declare that the research was conducted in the absence of any commercial or financial relationships that could be construed as a potential conflict of interest.
Acknowledgments
We are grateful to Ellen Bruns and Karoline Jobst for technical assistance and thank Aileen Grytzmann, Gerlind Krepinski, Tobias Knoch, Sabrina Messelis, and Annabelle Tann for their most dedicated medical assistance during the clinical study.
Supplementary Material
The Supplementary Material for this article can be found online at: https://www.frontiersin.org/articles/10.3389/fphar.2021.688950/full#supplementary-material
Abbreviations
ASP+, 4-(4-(dimethylamino)styryl)-N-methylpyridinium iodide; AT, amitriptyline; AUC, area under the curve; CYP, cytochrome P450; IBC, isobutyrylcarnitine; NT, nortriptyline; OCT, organic cation transporter; SLC, solute carrier.
References
Adams, S. H., Hoppel, C. L., Lok, K. H., Zhao, L., Wong, S. W., Minkler, P. E., et al. (2009). Plasma Acylcarnitine Profiles Suggest Incomplete Long-Chain Fatty Acid β-Oxidation and Altered Tricarboxylic Acid Cycle Activity in Type 2 Diabetic African-American Women. J. Nutr. 139, 1073–1081. doi:10.3945/jn.108.103754
Ahlin, G., Karlsson, J., Pedersen, J. M., Gustavsson, L., Larsson, R., Matsson, P., et al. (2008). Structural Requirements for Drug Inhibition of the Liver Specific Human Organic Cation Transport Protein 1. J. Med. Chem. 51, 5932–5942. doi:10.1021/jm8003152
Bahar, M. A., Setiawan, D., Hak, E., and Wilffert, B. (2017). Pharmacogenetics of Drug-Drug Interaction and Drug-Drug-Gene Interaction: A Systematic Review on CYP2C9, CYP2C19 and CYP2D6. Pharmacogenomics 18, 701–739. doi:10.2217/pgs-2017-0194
Baumann, P., Jonzier-Perey, M., Koeb, L., KüPfer, A., Tinguely, D., and SchöPf, J. (1986). Amitriptyline Pharmacokinetics and Clinical Response: II. Metabolic Polymorphism Assessed by Hydroxylation of Debrisoquine and Mephenytoin. Int. Clin. Psychopharmacol. 1, 102–112. doi:10.1097/00004850-198604000-00002
Breyer-Pfaff, U. (2004). The Metabolic Fate of Amitriptyline, Nortriptyline and Amitriptylinoxide in Man. Drug Metab. Rev. 36, 723–746. doi:10.1081/dmr-200033482
Brockmöller, J., Kirchheiner, J., Meisel, C., and Roots, I. (2000). Pharmacogenetic Diagnostics of Cytochrome P450 Polymorphisms in Clinical Drug Development and in Drug Treatment. Pharmacogenomics 1, 125–151. doi:10.1517/14622416.1.2.125
Caudle, K. E., Sangkuhl, K., Whirl‐Carrillo, M., Swen, J. J., Haidar, C. E., Klein, T. E., et al. (2020). Standardizing CYP 2D6 Genotype to Phenotype Translation: Consensus Recommendations from the Clinical Pharmacogenetics Implementation Consortium and Dutch Pharmacogenetics Working Group. Clin. Transl. Sci. 13, 116–124. doi:10.1111/cts.12692
Dalén, P., Dahl, M.-L., Ruiz, M. L. B., Nordin, J., and Bertilsson, L. (1998). 10-Hydroxylation of Nortriptyline in White Persons with 0, 1, 2, 3, and 13 Functional CYP2D6 Genes*. Clin. Pharmacol. Ther. 63, 444–452. doi:10.1016/S0009-9236(98)90040-6
Gillman, P. K. (2007). Tricyclic Antidepressant Pharmacology and Therapeutic Drug Interactions Updated. Br. J. Pharmacol. 151, 737–748. doi:10.1038/sj.bjp.0707253
Goldman, P., Scranton, T., and Messer, W. S. (1989). Interaction of Amitriptyline with Muscarinic Receptor Subtypes in the Rat Brain. Neurochem. Int. 14, 447–454. doi:10.1016/0197-0186(89)90034-X
Grauer, M. T., and Uhr, M. (2004). P-Glycoprotein Reduces the Ability of Amitriptyline Metabolites to Cross the Blood Brain Barrier in Mice After a 10-Day Administration of Amitriptyline. J. Psychopharmacol. 18, 66–74. doi:10.1177/0269881104042831
Haenisch, B., Drescher, E., Thiemer, L., Xin, H., Giros, B., Gautron, S., et al. (2012). Interaction of Antidepressant and Antipsychotic Drugs with the Human Organic Cation Transporters hOCT1, hOCT2 and hOCT3. Naunyn Schmiedebergs Arch. Pharmacol. 385, 1017–1023. doi:10.1007/s00210-012-0781-8
Hallifax, D., and Houston, J. B. (2007). Saturable Uptake of Lipophilic Amine Drugs into Isolated Hepatocytes: Mechanisms and Consequences for Quantitative Clearance Prediction. Drug Metab. Dispos 35, 1325–1332. doi:10.1124/dmd.107.015131
Hicks, J., Sangkuhl, K., Swen, J., Ellingrod, V., Müller, D., Shimoda, K., et al. (2017). Clinical Pharmacogenetics Implementation Consortium Guideline (CPIC) for CYP2D6 and CYP2C19 Genotypes and Dosing of Tricyclic Antidepressants: 2016 Update. Clin. Pharmacol. Ther. 102, 37–44. doi:10.1002/cpt.597
Hiemke, C., Bergemann, N., Clement, H., Conca, A., Deckert, J., Domschke, K., et al. (2018). Consensus Guidelines for Therapeutic Drug Monitoring in Neuropsychopharmacology: Update 2017. Pharmacopsychiatry 51, 9–62. doi:10.1055/s-0043-116492
Ito, K., Iwatsubo, T., Kanamitsu, S., Ueda, K., Suzuki, H., and Sugiyama, Y. (1998). Prediction of Pharmacokinetic Alterations Caused by Drug-Drug Interactions: Metabolic Interaction in the Liver. Pharmacol. Rev. 50, 387–412.
Ito, K., Chiba, K., Horikawa, M., Ishigami, M., Mizuno, N., Aoki, J., et al. (2002). Which Concentration of the Inhibitor Should be Used to Predict in vivo Drug Interactions from in vitro Data?. AAPS PharmSci. 4, E25. doi:10.1208/ps040425
Jensen, O., Brockmöller, J., and Dücker, C. (2021). Identification of Novel High-Affinity Substrates of OCT1 Using Machine Learning-Guided Virtual Screening and Experimental Validation. J. Med. Chem. 64, 2762–2776. doi:10.1021/acs.jmedchem.0c02047
Hardman, J. G., Goodman, L. S., and Gilman, A. G. (2001). Goodman & Gilman's The Pharmacological Basis of Therapeutics. New York, NY: McGraw-Hill Medical Publisher.
Kachur, J. F., Allbee, W. E., and Gaginella, T. S. (1988). Antihistaminic and Antimuscarinic Effects of Amitriptyline on Guinea Pig Ileal Electrolyte Transport and Muscle Contractility in vitro. J. Pharmacol. Exp. Ther. 245, 455–459.
Kirchheiner, J., Brøsen, K., Dahl, M. L., Gram, L. F., Kasper, S., Roots, I., et al. (2001). CYP2D6 and CYP2C19 Genotype-Based Dose Recommendations for Antidepressants: A First Step towards Subpopulation-Specific Dosages. Acta. Psychiatr. Scand. 104, 173–192. doi:10.1034/j.1600-0447.2001.00299.x
Kirchheiner, J., Keulen, J.-T. H. A., Bauer, S., Roots, I., and Brockmöller, J. (2008). Effects of the CYP2D6 Gene Duplication on the Pharmacokinetics and Pharmacodynamics of Tramadol. J. Clin. Psychopharmacol. 28, 78–83. doi:10.1097/JCP.0b013e318160f827
Kirchheiner, J., Nickchen, K., Bauer, M., Wong, M.-L., Licinio, J., Roots, I., et al. (2004). Pharmacogenetics of Antidepressants and Antipsychotics: The Contribution of Allelic Variations to the Phenotype of Drug Response. Mol. Psychiatry 9, 442–473. doi:10.1038/sj.mp.4001494
Koepsell, H. (2020). Organic Cation Transporters in Health and Disease. Pharmacol. Rev. 72, 253–319. doi:10.1124/pr.118.015578
Luo, L., Ramanathan, R., Horlbogen, L., Mathialagan, S., Costales, C., Vourvahis, M., et al. (2020). A Multiplexed HILIC-MS/HRMS Assay for the Assessment of Transporter Inhibition Biomarkers in Phase I Clinical Trials: Isobutyryl-Carnitine as an Organic Cation Transporter (OCT1) Biomarker. Anal. Chem. 92, 9745–9754. doi:10.1021/acs.analchem.0c01144
Mai, M., Tönjes, A., Kovacs, P., Stumvoll, M., Fiedler, G. M., and Leichtle, A. B. (2013). Serum Levels of Acylcarnitines are Altered in Prediabetic Conditions. PLoS One 8, e82459. doi:10.1371/journal.pone.0082459
Matthaei, J., Seitz, T., Jensen, O., Tann, A., Prukop, T., Tadjerpisheh, S., et al. (2019). OCT 1 Deficiency Affects Hepatocellular Concentrations and Pharmacokinetics of Cycloguanil, the Active Metabolite of the Antimalarial Drug Proguanil. Clin. Pharmacol. Ther. 105, 190–200. doi:10.1002/cpt.1128
Mellström, B., Bertilsson, L., Lou, Y.-C., Säwe, J., and Sjöqvist, F. (1983). Amitriptyline Metabolism: Relationship to Polymorphic Debrisoquine Hydroxylation. Clin. Pharmacol. Ther. 34, 516–520. doi:10.1038/clpt.1983.207
Mihalik, S. J., Goodpaster, B. H., Kelley, D. E., Chace, D. H., Vockley, J., Toledo, F. G. S., et al. (2010). Increased Levels of Plasma Acylcarnitines in Obesity and Type 2 Diabetes and Identification of a Marker of Glucolipotoxicity. Obesity (Silver Spring) 18, 1695–1700. doi:10.1038/oby.2009.510
Milosavljevic, F., Bukvic, N., Pavlovic, Z., Miljevic, C., Pešic, V., Molden, E., et al. (2021). Association of CYP2C19 and CYP2D6 Poor and Intermediate Metabolizer Status With Antidepressant and Antipsychotic Exposure: A Systematic Review and Meta-Analysis. JAMA Psychiatry 78, 270–280. doi:10.1001/jamapsychiatry.2020.3643
Moore, R. A., Derry, S., Aldington, D., Cole, P., and Wiffen, P. J. (2015). Amitriptyline for Neuropathic Pain in Adults. Cochrane Database Syst. Rev. 2015, CD008242. doi:10.1002/14651858.CD008242.pub3
Nishimura, M., and Naito, S. (2005). Tissue-Specific mRNA Expression Profiles of Human ATP-Binding Cassette and Solute Carrier Transporter Superfamilies. Drug Metab. Pharmacokinet. 20, 452–477. doi:10.2133/dmpk.20.452
Ramakrishn, D., and Subhash, M. N. (2012). Effect of Amitriptyline on Adrenergic Receptor Number and Second Messenger Function in Rat Brain. Pak. J. Biol. Sci. 15, 871–876. doi:10.3923/pjbs.2012.871.876
Richelson, E. (1979). Tricyclic Antidepressants and Histamine H1 Receptors. Mayo Clin. Proc. 54, 669–674.
Rico-Villademoros, F., Slim, M., and Calandre, E. P. (2015). Amitriptyline for the Treatment of Fibromyalgia: A Comprehensive Review. Expert Rev. Neurother. 15, 1123–1150. doi:10.1586/14737175.2015.1091726
Rudorfer, M. V., and Potter, W. Z. (1999). Metabolism of Tricyclic Antidepressants. Cell Mol. Neurobiol. 19, 373–409. doi:10.1023/a:1006949816036
Saadatmand, A. R., Tadjerpisheh, S., Brockmöller, J., and Tzvetkov, M. V. (2012). The Prototypic Pharmacogenetic Drug Debrisoquine is a Substrate of the Genetically Polymorphic Organic Cation Transporter OCT1. Biochem. Pharmacol. 83, 1427–1434. doi:10.1016/j.bcp.2012.01.032
Schneider, J., Patterson, M., and Jimenez, X. F. (2019). Beyond Depression: Other Uses for Tricyclic Antidepressants. Cleve. Clin. J. Med. 86, 807–814. doi:10.3949/ccjm.86a.19005
Seitz, T., Stalmann, R., Dalila, N., Chen, J., Pojar, S., Dos Santos Pereira, J. N., et al. (2015). Global Genetic Analyses Reveal Strong Inter-Ethnic Variability in the Loss of Activity of the Organic Cation Transporter OCT1. Genome Med. 7, 56. doi:10.1186/s13073-015-0172-0
Sienkiewicz-Oleszkiewicz, B., and Wiela-Hojeńska, A. (2018). CYP2C19 Polymorphism in Relation to the Pharmacotherapy Optimization of Commonly Used Drugs. Pharmazie 73, 619–624. doi:10.1691/ph.2018.8689
Silberstein, S. D. (2015). Preventive Migraine Treatment. Continuum (Minneap Minn) 21, 973–989. doi:10.1212/CON.0000000000000199
Smith, P. K., Krohn, R. I., Hermanson, G. T., Mallia, A. K., Gartner, F. H., Provenzano, M. D., et al. (1985). Measurement of Protein Using Bicinchoninic Acid. Anal. Biochem. 150, 76–85. doi:10.1016/0003-2697(85)90442-7
Steimer, W., Zöpf, K., von Amelunxen, S., Pfeiffer, H., Bachofer, J., Popp, J., et al. (2004). Allele-Specific Change of Concentration and Functional Gene Dose for the Prediction of Steady-State Serum Concentrations of Amitriptyline and Nortriptyline in CYP2C19 and CYP2D6 Extensive and Intermediate Metabolizers. Clin. Chem. 50, 1623–1633. doi:10.1373/clinchem.2003.030825
Steimer, W., Zöpf, K., von Amelunxen, S., Pfeiffer, H., Bachofer, J., Popp, J., et al. (2005). Amitriptyline or Not, that is the Question: Pharmacogenetic Testing of CYP2D6 and CYP2C19 Identifies Patients With Low or High Risk for Side Effects in Amitriptyline Therapy. Clin. Chem. 51, 376–385. doi:10.1373/clinchem.2004.041327
Stingl, J. C., Brockmöller, J., and Viviani, R. (2013). Genetic Variability of Drug-Metabolizing Enzymes: The Dual Impact on Psychiatric Therapy and Regulation of Brain Function. Mol. Psychiatry 18, 273–287. doi:10.1038/mp.2012.42
Suhre, K., Shin, S.-Y., Shin, S.-Y., Petersen, A.-K., Mohney, R. P., Meredith, D., et al. (2011). Human Metabolic Individuality in Biomedical and Pharmaceutical Research. Nature 477, 54–60. doi:10.1038/nature10354
Tega, Y., Tabata, H., Kurosawa, T., Kitamura, A., Itagaki, F., Oshitari, T., et al. (2021). Structural Requirements for Uptake of Diphenhydramine Analogs into hCMEC/D3 Cells via the Proton-Coupled Organic Cation Antiporter. J. Pharm. Sci. 110, 397–403. doi:10.1016/j.xphs.2020.09.001
Tzvetkov, M. V., Dos Santos Pereira, J. N., Meineke, I., Saadatmand, A. R., Stingl, J. C., and Brockmöller, J. (2013). Morphine is a Substrate of the Organic Cation Transporter OCT1 and Polymorphisms in OCT1 Gene Affect Morphine Pharmacokinetics after Codeine Administration. Biochem. Pharmacol. 86, 666–678. doi:10.1016/j.bcp.2013.06.019
Tzvetkov, M. V., Matthaei, J., Pojar, S., Faltraco, F., Vogler, S., Prukop, T., et al. (2018). Increased Systemic Exposure and Stronger Cardiovascular and Metabolic Adverse Reactions to Fenoterol in Individuals With HeritableOCT1Deficiency. Clin. Pharmacol. Ther. 103, 868–878. doi:10.1002/cpt.812
Tzvetkov, M. V., Saadatmand, A. R., Lötsch, J., Tegeder, I., Stingl, J. C., and Brockmöller, J. (2011). Genetically Polymorphic OCT1: Another Piece in the Puzzle of the Variable Pharmacokinetics and Pharmacodynamics of the Opioidergic Drug Tramadol. Clin. Pharmacol. Ther. 90, 143–150. doi:10.1038/clpt.2011.56
Uhr, M., Grauer, M., Yassouridis, A., and Ebinger, M. (2007). Blood-Brain Barrier Penetration and Pharmacokinetics of Amitriptyline and its Metabolites in p-Glycoprotein (abcb1ab) Knock-Out Mice and Controls. J. Psychiatr. Res. 41, 179–188. doi:10.1016/j.jpsychires.2005.10.005
Uhr, M. (2000). Penetration of Amitriptyline, But Not of Fluoxetine, Into Brain is Enhanced in Mice With Blood-Brain Barrier Deficiency Due to Mdr1a P-Glycoprotein Gene Disruption. Neuropsychopharmacology 22, 380–387. doi:10.1016/S0893-133X(99)00095-0
Zhou, S.-F. (2009). Polymorphism of Human Cytochrome P450 2D6 and Its Clinical Significance. Clin. Pharmacokinet. 48, 689–723. doi:10.2165/11318030-000000000-00000
Keywords: amitriptyline, CYP2C19, CYP2D6, drug transport, nortriptyline, OCT1, organic cation transporter 1, SLC22A1
Citation: Matthaei J, Brockmöller J, Steimer W, Pischa K, Leucht S, Kullmann M, Jensen O, Ouethy T, Tzvetkov MV and Rafehi M (2021) Effects of Genetic Polymorphism in CYP2D6, CYP2C19, and the Organic Cation Transporter OCT1 on Amitriptyline Pharmacokinetics in Healthy Volunteers and Depressive Disorder Patients. Front. Pharmacol. 12:688950. doi: 10.3389/fphar.2021.688950
Received: 31 March 2021; Accepted: 04 May 2021;
Published: 21 May 2021.
Edited by:
Edoardo Spina, University of Messina, ItalyReviewed by:
Chiara Fabbri, King's College London, United KingdomVolker Martin Lauschke, Karolinska Institutet (KI), Sweden
Copyright © 2021 Matthaei, Brockmöller, Steimer, Pischa, Leucht, Kullmann, Jensen, Ouethy, Tzvetkov and Rafehi. This is an open-access article distributed under the terms of the Creative Commons Attribution License (CC BY). The use, distribution or reproduction in other forums is permitted, provided the original author(s) and the copyright owner(s) are credited and that the original publication in this journal is cited, in accordance with accepted academic practice. No use, distribution or reproduction is permitted which does not comply with these terms.
*Correspondence: Muhammad Rafehi, muhammad.rafehi@med.uni-goettingen.de