 Mingzhe Zhu
 Meng Li
 Wenjun Zhou
 Guangbo Ge3
 Li Zhang
 Guang Ji
- 1Institute of Digestive Diseases, China-Canada Center of Research for Digestive Diseases (ccCRDD), Longhua Hospital, Shanghai University of Traditional Chinese Medicine, Shanghai, China
- 2School of Public Health, Shanghai University of Traditional Chinese Medicine, Shanghai, China
- 3Institute of Interdisciplinary Integrative Medicine Research, Shanghai University of Traditional Chinese Medicine, Shanghai, China
Qianggan formula, a designed prescription according to the Traditional Chinese Medicine (TCM) theory, is widely used in treating chronic liver diseases, and indicated to prevent blood glucose increase in patients via unknown mechanisms. To unravel the effects and underlying mechanisms of Qianggan formula on hyperglycemia, we administrated Qianggan extract to high fat and high sucrose (HFHS) diet rats. Results showed that four-week Qianggan extract intervention significantly decreased serum fasting blood glucose, hemoglobin A1c, and liver glycogen levels. Gas chromatography-mass spectrometry (GC-MS) approach was employed to explore metabolomic profiles in liver and fecal samples. By multivariate and univariate statistical analysis (variable importance of projection value > 1 and p value < 0.05), 44 metabolites (18 in liver and 30 in feces) were identified as significantly different. Hierarchical cluster analysis revealed that most differential metabolites had opposite patterns between pair-wise groups. Qianggan extract restored the diet induced metabolite perturbations. Metabolite sets enrichment and pathway enrichment analysis revealed that the affected metabolites were mainly enriched in glycometabolism pathways such as glycolysis/gluconeogenesis, pentose phosphate pathway, fructose, and mannose metabolism. By compound-reaction-enzyme-gene network analysis, batches of genes (e.g. Hk1, Gck, Rpia, etc) or enzymes (e.g. hexokinase and glucokinase) related to metabolites in enriched pathways were obtained. Our findings demonstrated that Qianggan extract alleviated hyperglycemia, and the effects might be partially due to the regulation of glycometabolism related pathways.
Introduction
Traditional Chinese medicine (TCM) has been used in clinical applications for thousands of years (Zhang et al., 2016b). TCM formulae are mainly composed of herbs and widely used to treat metabolic diseases, such as hepatic steatosis and type 2 diabetes (Liang et al., 2018; Yu et al., 2018). Herbal extracts from traditional Chinese medicines such as curcumin, capsaicin and ginsenosides have been effectively employed in preventing obesity and other metabolic diseases (Yu et al., 2018). Qianggan formula is a patent TCM drug, and composed of 16 ingredients. Qianggan formula has been implicated in clinical practice and proved to be effective in improving metabolic disease (Li et al., 2010; Gu and Huang, 2011; Wang et al., 2011). However, little has been reported the mechanisms underlying the efficacy, which needs to be clarified.
TCM is a holistic system, which comprises multicomponent complexes and has multiple therapeutic targets (Li et al., 2017). It would be helpful to apply systemic approaches to elucidate the underlying mechanisms. Metabolomics is an important part of systems biology and provides global information of small molecule metabolites in complex biological processes (Crowther et al., 2018). It offers a powerful platform to investigate metabolic pathways, identify biomarkers for diagnosing and monitoring diseases, and predict therapeutic targets of drugs (Guo et al., 2018; Procopet et al., 2018). Gas chromatography-mass spectrometry (GC-MS), which possesses high resolution, sensitivity, and available database, is one of the powerful and popular tools in metabolomics studies (Shackleton et al., 2018). It has been extensively applied to assess the effects and explore metabolic mechanisms of TCM in treating diseases. By GC-MS based plasma metabolomics, Feng D, et al. identified potential biomarkers and established metabolic networks to explain the efficacy of Xuefu Zhuyu Decoction on traumatic brain injury (Feng et al., 2017). Gou XJ, et al. employed GC-MS to elucidate the underlying mechanisms of Qushi Huayu Decoction in a fatty liver rat model and obtained 23 potential biomarkers and several regulating metabolic pathways (Gou et al., 2017). Another study using GC-MS implicated the important roles of three carbohydrate metabolism pathways of Hedyotis diffusa decoction in preventing acute liver injury (Dai et al., 2017).
In the present study, GC-MS based metabolomics (liver and fecal samples) was employed to evaluate metabolic alterations of high fat and high sucrose (HFHS) diet fed rats, and obtain Qianggan extract affected metabolites. With the aid of pattern recognition, metabolite set enrichment analysis (MSEA), pathway enrichment analysis and compound-reaction-enzyme-gene network analysis, potential candidate metabolites, and relevant metabolic pathways were identified. Our study inferred the mechanisms of Qianggan extract on hyperglycermia and suggested a new pattern for studying TCM formula on metabolic diseases.
Material and Methods
Preparation of Qianggan Extract
Qianggan formula is a marketed TCM, which was prepared by 16 herbal materials. In this study, the Qianggan extract was prepared as previously reported (Zhu et al., 2019). Briefly, all of the ingredients: Artemisia scoparia Waldst. & Kitam. (Yin-Chen) 250 g, Isatis tinctoria L. (Ban-Lan-Gen) 125 g, Angelica sinensis(Oliv.)Diels. (Dang-Gui) 125 g, Paeonia lactiflora Pall. (Bai-Shao) 125 g, Salvia miltiorrhiza Bunge. (Dan-Shen) 250 g, Curcuma wenyujin Y.H.Chen et C.Ling. (Yu-Jin) 125 g, Astragalus membranaceus(Fisch.)Bunge. (Huang-Qi) 250 g, Codonopsis pilosula(Franch.)Nannf. (Dang-Shen) 125 g, Alisma orientale(Sam.)Juz. (Ze-Xie) 125 g, Polygonatum kingianum Collett& Hemsl. (Huang-Jing) 125 g, Rehmannia glutinosa (Gaertn.) DC. (Shen-Di) 125 g, Dioscorea oppositifolia L. (Shan-Yao) 125 g, Crataegus pinnatifida Bunge.(Shan-Zha) 100 g, Medicated Leaven Massa Medicata Fermentata (Liu-Shen-Qu) 100 g, Gentiana macrophylla Pall.(Qin-Jiao) 100 g, Glycyrrhiza uralensis Fisch. (Gan-Cao) 100 g were mixed and soaked in water, and then boiled for 2 h. These herbal materials were extracted by hot-water for three times, then mixed and filtrated to get the supernatants. After then, the pH of the supernatants was adjusted to 8.0, and concentrated the solution to a density ratio of 1.35 to obtain the Qianggan water extract. The extract was re-dissolved in acetonitrile-water (1:1, v/v) for chemical profiling analysis. A Agilent 1290 UPLC system (Agilent Technologies, Palo Alto, USA) coupled with Sciex TripleTOF 4600® quadrupole-time of flight mass spectrometer (AB Sciex, Darmstadt, Germany) equipped with a DuoSpray source was used for profiling the chemical constituents in Qianggan extract. Chromatographic separation was achieved on an Acquity UPLC® HSS T3 column (2.1×100 mm, 1.7 μm; Waters, Milford, MA, USA). The mobile phase consisted of water containing 0.1% formic acid (A) and acetonitrile (B). The following gradient condition was used: 0–3.0 min, 0% B; 3.0–5.0 min, 0% B-5% B; 5.0–7.0 min 5% B-15% B; 7.0–21.0 min, 15% B-30% B; 21.0-24.0 min, 30% B–48% B; 24.0-30.0 min, 48% B–60% B; 30.0-34.0 min, 60% B-95% B; 34.0–36.0 min, 95% B; 36.0–36.1 min, 95% B-0% B; 36.1–40.0 min, 0% B. The injection volumes for all samples were 5 μl. Column oven temperatures was set at 30 °C, while the flow rate was 0.3 ml/min. Ionization was conducted using an electrospray ionization (ESI) source. Data were collected under both positive and negative ion modes. The mass spectrometer was operated in full-scan TOF-MS at m/z 100-1500 and information-dependent acquisition (IDA) MS/MS modes, the collision energy was 40 ± 20 eV. Both ion source gas 1 and 2 were set 50 psi. Curtain gas was 35 psi. The temperature and ionspray voltage floating were 500°C and 5000/-4500 V, respectively. Data recording and processing was performed by Analyst Ver. 1.6 software (AB Sciex, USA).
Animal Experiments and Sample Collection
Six-week-old male Wistar rats were purchased from Shanghai SLAC Laboratory Animal Co. Ltd, China, and maintained in specific pathogen free (SPF) environment. According to the body weight, 24 rats were randomly divided into normal group (n=8), fed with chow diet, and HFHS group (n=16), fed with a diet composing 68% chow diet, 15% lard, 15% sucrose, and 2% cholesterol; After 6-week feeding, HFHS rats were further divided into untreated group (HFHS, n=8), and Qianggan extract intervened group (n=8) that fed with HFHS diet and administered with Qianggan extract that dissolved in distilled water (1.2 g/kg/d) via gavage. The rats were allocated with 4 per cage, and fed and/or intervened for another 4 weeks. At the end, animals were weighed after 12 h-fasting, euthanized with 2% pentobarbital sodium, and sacrificed. Blood was collected and serum was separated. The livers were weighed, divided into portions, and stored at -80°C.
The study was carried out in accordance with the recommendations of National Institutes of Health Guidelines for the Care and Use of Laboratory Animals. The protocol was approved by the Animal Ethics Committee of Shanghai University of Traditional Chinese Medicine (PZSHUTCM191227006).
Serum Biochemical Analysis
Serum alanine transaminase (ALT), aspartate transaminase (AST), triglyceride (TG), total cholesterol (TC), low density lipoprotein cholesterol (LDL-c), and blood glucose (BG) were analyzed using the Hitachi full-automatic system. Serum insulin and hemoglobin A1c (HbA1c) were analyzed by enzyme-linked immunosorbent assay (ELISA). Serum insulin and BG were used to calculate the homeostasis model assessment of insulin resistance (HOMA-IR).
Detection of Liver Glycogen
Liver glycogen was measured by commercial kit (Jiancheng Tech, Nanjing, China) according to the instructions of the manufacturer. Briefly, 25 mg of liver tissue were pretreated with 30% KOH, ethanol, and saturated sodium sulfate. After collecting the supernatants, reagent anthrone and neutralized hydrolysate were added. The final solutions of reaction were read in microplate reader at 620 nm.
GC-MS Based Metabolomics Analysis
Sample preparation, GC-MS metabolomics analysis, and metabolite identification of liver tissue and feces were conducted by Shanghai Profleader Biotech Co., Ltd (Shanghai, China). After adding 20-fold volume (μl/mg) of chloroform/methanol/water solvent (v/v/v=2:5:2) containing 10 μg/ml of L-norvaline and freezing at -40°C for 30 min, the frozen liver tissue samples were ground immediately by using a TissueLyser (type JX-24, Jingxin, Shanghai, China) with zirconia beads for 3 min at 50 Hz. The homogenates were incubated at -20°C for an hour, followed by vortex and centrifugation at 14,000 g and 4°C for 15 min. The extraction was repeated with methanol as solvent and the supernatants from the two extractions were combined. The combined supernatants (100 μl) and 13C6-15N-L-isoleucine (10 μl) were blended and dried under nitrogen gas. For the extraction of feces sample, a frozen feces sample was strongly vortexed in 10-fold volume (μl/mg) of ice-cold deionized water containing 10 μg/ml of 13C4-succinic acid, and then incubated at 4°C for 30 min. Following centrifugation at 16,000 g and 4°C for 15 min, the supernatant was collected. The extraction was repeated with deionized water as solvent and the supernatants from the two extractions were combined, followed by protein precipitation with four-fold volume (v/v) of methanol. After centrifugation, 500 μl combined supernatants were mixed and evaporated to dryness under nitrogen stream. The dried residues of liver or feces were dissolved in 30 μl methoxyamine hydrochloride in pyridine (20 mg/ml) and then incubated at 37°C for 90 min. After an addition of 30 μl BSTFA (with 1% TMCS), the sample was derivatized at 70°C for 60 min prior to GC-MS analysis. Quality control (QC) sample pooled from all samples were prepared and analyzed with the same procedure as those of the experiment samples. Blank samples were also prepared where sample was replaced by deionized water so as to monitor and remove the contaminants introduced during sample preparation and column bleeds.
Metabolomics analysis was conducted on an Agilent 7890A gas chromatography system coupled to an Agilent 5975C inert MSD system (Agilent Technologies Inc., CA, USA). The experiments were performed following the previously described protocol (Liu et al., 2018). Raw data were obtained in a full scan mode. The samples were run at random, and blank samples and QC samples were inserted during sample analysis.
Data Processing, Pattern Recognition, and Metabolites Structure Identification
GC-MS raw data were processed by TagFinder software (Luedemann et al., 2008) according to previously published methods (Gao et al., 2010). The final data was obtained, which included sample names, variables (rt_mz), and peak abundances. The added internal standards were utilized to monitor the GC-MS signal fluctuation during sample analysis. The metabolite peaks with relative standard deviation (RSD) value of abundances in QC samples larger than 30% were filtered out. After filtering, the qualified data were performed median normalization before performing further univariate and multivariate statistics.
Fold change was calculated as binary logarithm of average normalized peak intensity ratio between groups. To better understand the pattern of differential metabolites among groups, hierarchical clusters were performed by Cluster 3.0 software. Venn diagram of identified metabolites between liver and feces samples was visualized by a web tool (bioinformatics.psb.ugent.be/webtools/Venn/).
To identify the structure of differential metabolites, GC-MS raw data were imported to AMDIS software and the purified mass spectra were compared to an in-house standard library, Golm Metabolome Database, and Agilent Fiehn GC-MS Metabolomics RTL Library.
Metabolite Set Enrichment Analysis (MSEA) and Pathway Analysis
To identify biologically meaningful patterns and most relevant metabolic pathways of the differential metabolites, MSEA and pathway enrichment analysis were performed by MetaboAnalyst 4.0 (http://www.metaboanalyst.ca/) as previously described (Chong et al., 2018). To demonstrate the relationships among genes, proteins, and metabolites in related pathways, Compound-Reaction-Enzyme-Gene network was constructed by Cytoscape software plug-in Metscape (Karnovsky et al., 2012).
Statistical Analysis
By SIMCA software (version 14.1, Umetrics, Umeå, Sweden), principle component analysis (PCA) and orthogonal partial least squares discriminant analysis (OPLS-DA) were conducted for multivariate statistical analysis, where the data were preprocessed by unit variance (UV) scaling and mean centering. The model quality is estimated by R2X or R2Y and Q2 values. To avoid OPLS-DA model over-fitting, 200 times permutation tests were carried out. Then variable importance of projection (VIP) values were visualized in OPLS-DA model. For univariate statistical analysis, Welch's t test was conducted on the data of normal distribution, while Wilcoxon Mann-Whitney test was conducted on the data of abnormal distribution. Finally, the metabolites with VIP > 1 and p < 0.05 were identified as different metabolites.
Data were expressed as mean ± SD and were analyzed by one-way analysis of variance (ANOVA) by SPSS v22.0 software. P value less than 0.05 was considered as statistically different.
Results
Chemical Profiling of Qianggan Extract
The complexity of MS data acquired in both mass spectrometry (MS) and tandem mass spectrometry (MS/MS) mode requires reliable peak identification tools. In this work, SCIEX natural products HR-MS/MS Spectral Library was used for identification. The library contains additional compound entries with structural information and MS/MS spectra for 1,300 selected natural compounds. The assignment of each constitute was performed by comparing the retention times (Rt), MS data (accurate mass, isotopic distribution, and fragmentation pattern) of each constitute from Qianggan extract with SCIEX natural products HR-MS/MS Spectral Library (involving compound name, molecular formula, chemical structure, CAS No, accurate MS/MS spectra, ect.) and previously reported literature (Cao et al., 2011). With the help of PeakView 1.2 and MasterView 1.1, a total of 90 constitutes have been identified or tentatively characterized in Qianggan extract (compounds of 16 herbs) under positive or negative ion mode (Figure 1 and Table 1). Among them, 4 constitutes attributed to Cynanchum otophyllum, 6 attributed to Radix isatidis, 6 attributed to Radix Angelicae sinensis, 10 attributed to Radix Paeoniae Alba, 17 attributed to Radix Salviae miltiorrhizae, 2 attributed to Curcuma aromatic, 10 attributed to Astragalus membranaceus, 2 attributed to Codonopsis pilosula, 2 attributed to Rhizoma alismatis, 2 attributed to Rehmannia glutinosa, 7 attributed to Rhizoma Dioscoreae, 3 attributed to Hawthorn, 7 attributed to Medicated Leaven, 10 attributed to Fraxinus bungeana, 23 attributed to Radix liquiritiae. Un-expectably, no metabolite was detected from Rhizoma polygonat (Table 1).
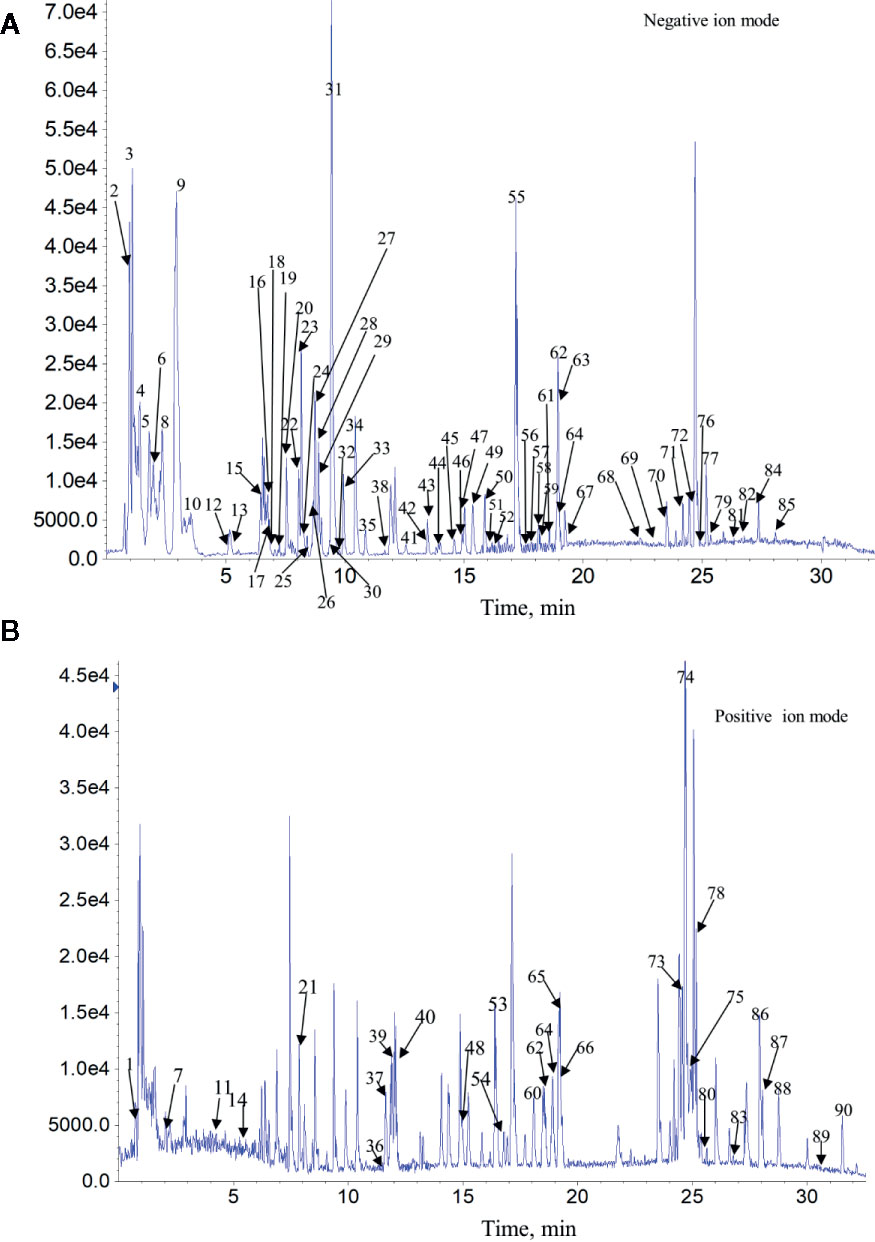
Figure 1 Total ion chromatogram of constitutes in Qianggan extract. Agilent 1290 UPLC system was applied to analyze the chemical profiling of Qianggan extract, data were collected under both negative ion mode (A) and positive ion mode (B), and processed by Analyst Ver. 1.6 software.
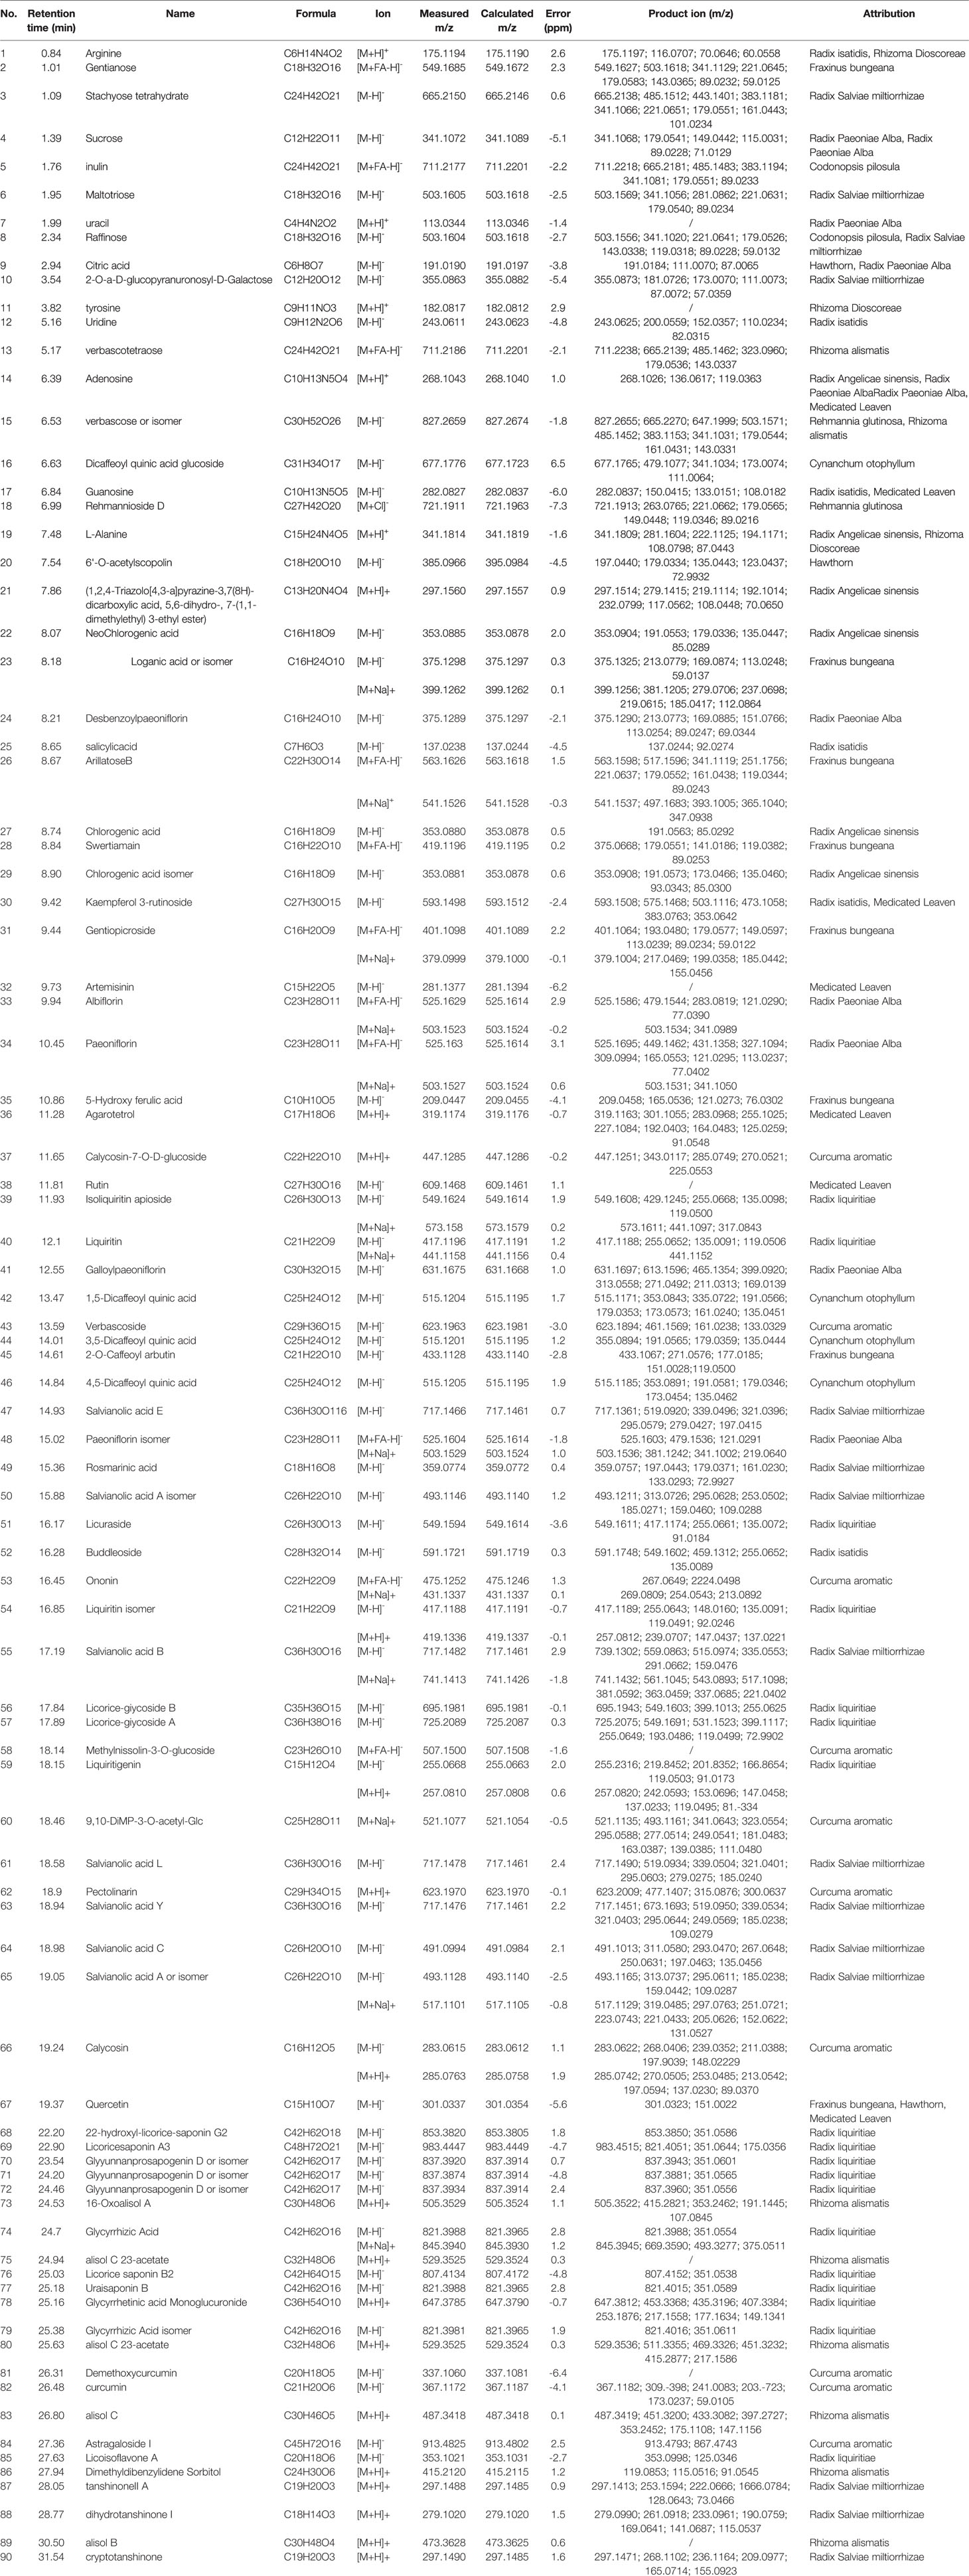
Table 1 The detected ion chromatogram of constitutes in Qianggan extract.
The Effect of Qianggan Extract on Hyperglycemia in Rats
Rats feeding HFHS diet showed hyperglycemia, as the blood glucose was significantly increased compared with chow diet control rats (Figure 2A). Four-week Qianggan extract treatment restored the blood glucose increase to normal level (Figure 2A). Similar trend was also observed in HbAlc levels (Figure 2B). Although the insulin level has no statistical difference among groups (Figure 2C), HOMA-IR was significantly increased in HFHS rats (Figure 2D), and Qianggan extract treatment markedly reduced HOMA-IR value. Glucose can be stored in the form of glycogen in liver, and liver glycogen is critical in maintaining glucose homeostasis (von Wilamowitz-Moellendorff et al., 2013). We found obviously decreased liver glycogen in HFHS rats, and Qianggan extract treatment significantly increased liver glycogen content (Figure 2E). Qianggan extract treatment also partially restored the increased serum ALT and AST levels in HFHS rats, however, the body weight, liver weight, and serum lipids did not show statistical difference among groups (Table 2).
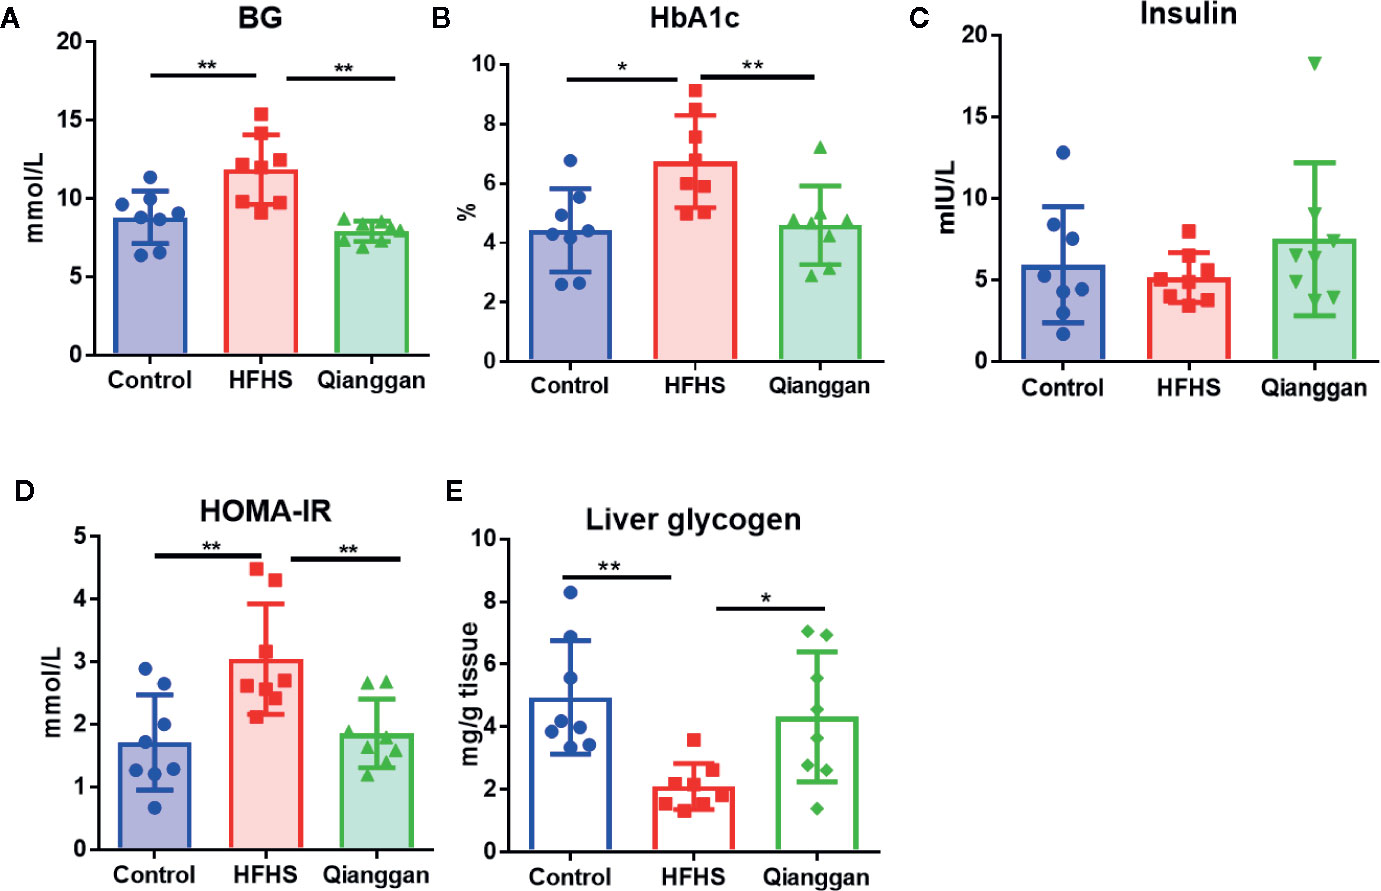
Figure 2 Effects of Qiangggan extract on hyperglycemia. Hyperglycemia was induced by HFHS feeding, Qianggan extract were treated for 4 weeks. (A) Fasting blood glucose (B) HbA1c, (C) Insulin, (D) HOMA-IR, (E) Liver glycogen. Data were presented as mean ± SD, * p < 0.05, ** p < 0.001.
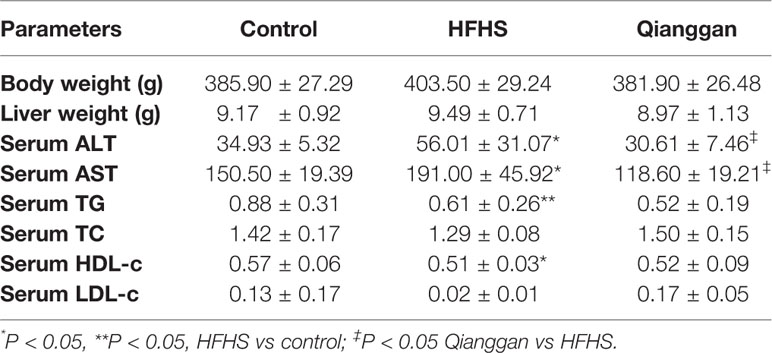
Table 2 Phenotypic parameters of the rats.
Metabolite Profile and Differential Metabolites Identification
To unravel the mechanisms under the efficacy of Qianggan extract, metabolomics were conducted to obtain metabolite profiles and identify differential metabolites in liver tissue and fecal samples. The GC-MS chromatograms of liver and fecal samples were presented in Supplemental Figure 1. PCA and OPLS-DA models were established to visualize clusters and different metabolic patterns among groups. For liver tissues, PCA model did not clearly separate control, HFHS and Qianggan groups (Figure 3A). However, OPLS-DA model revealed good separation among three groups (Figure 3B). Parameters of R2X=0.512, R2Y= 0.913, and Q2 = 0.277, indicating the good quality and accurate prediction of the model. Two hundred permutation tests were further performed, with R2 = 0.72 and Q2=-0.605, suggesting the reliability of the OPLS-DA model (Figure 3C). To identify differential metabolites between HFHS diet and Qianggan treated groups, PCA and OPLS-DA models were built. PCA did not clearly discriminate the two groups, but a good separation was observed by OPLS-DA plots (Figures 3D, E), implicating Qianggan extract improved metabolite perturbations induced by HFHS diet. Permutation test implicated the validity of OPLS-DA model with R2 = 0.992 and Q2=-0.264 (Figure 3F). Moreover, metabolites with VIP value > 1 were obtained. Coupled with univariate statistical analysis (p < 0.05), 18 metabolites (e.g. glucose-6-phosphate, fructose-6-phosphate and ribose-5-phosphate) were identified to be significantly different between HFHS diet and Qianggan treated groups (Table 3).
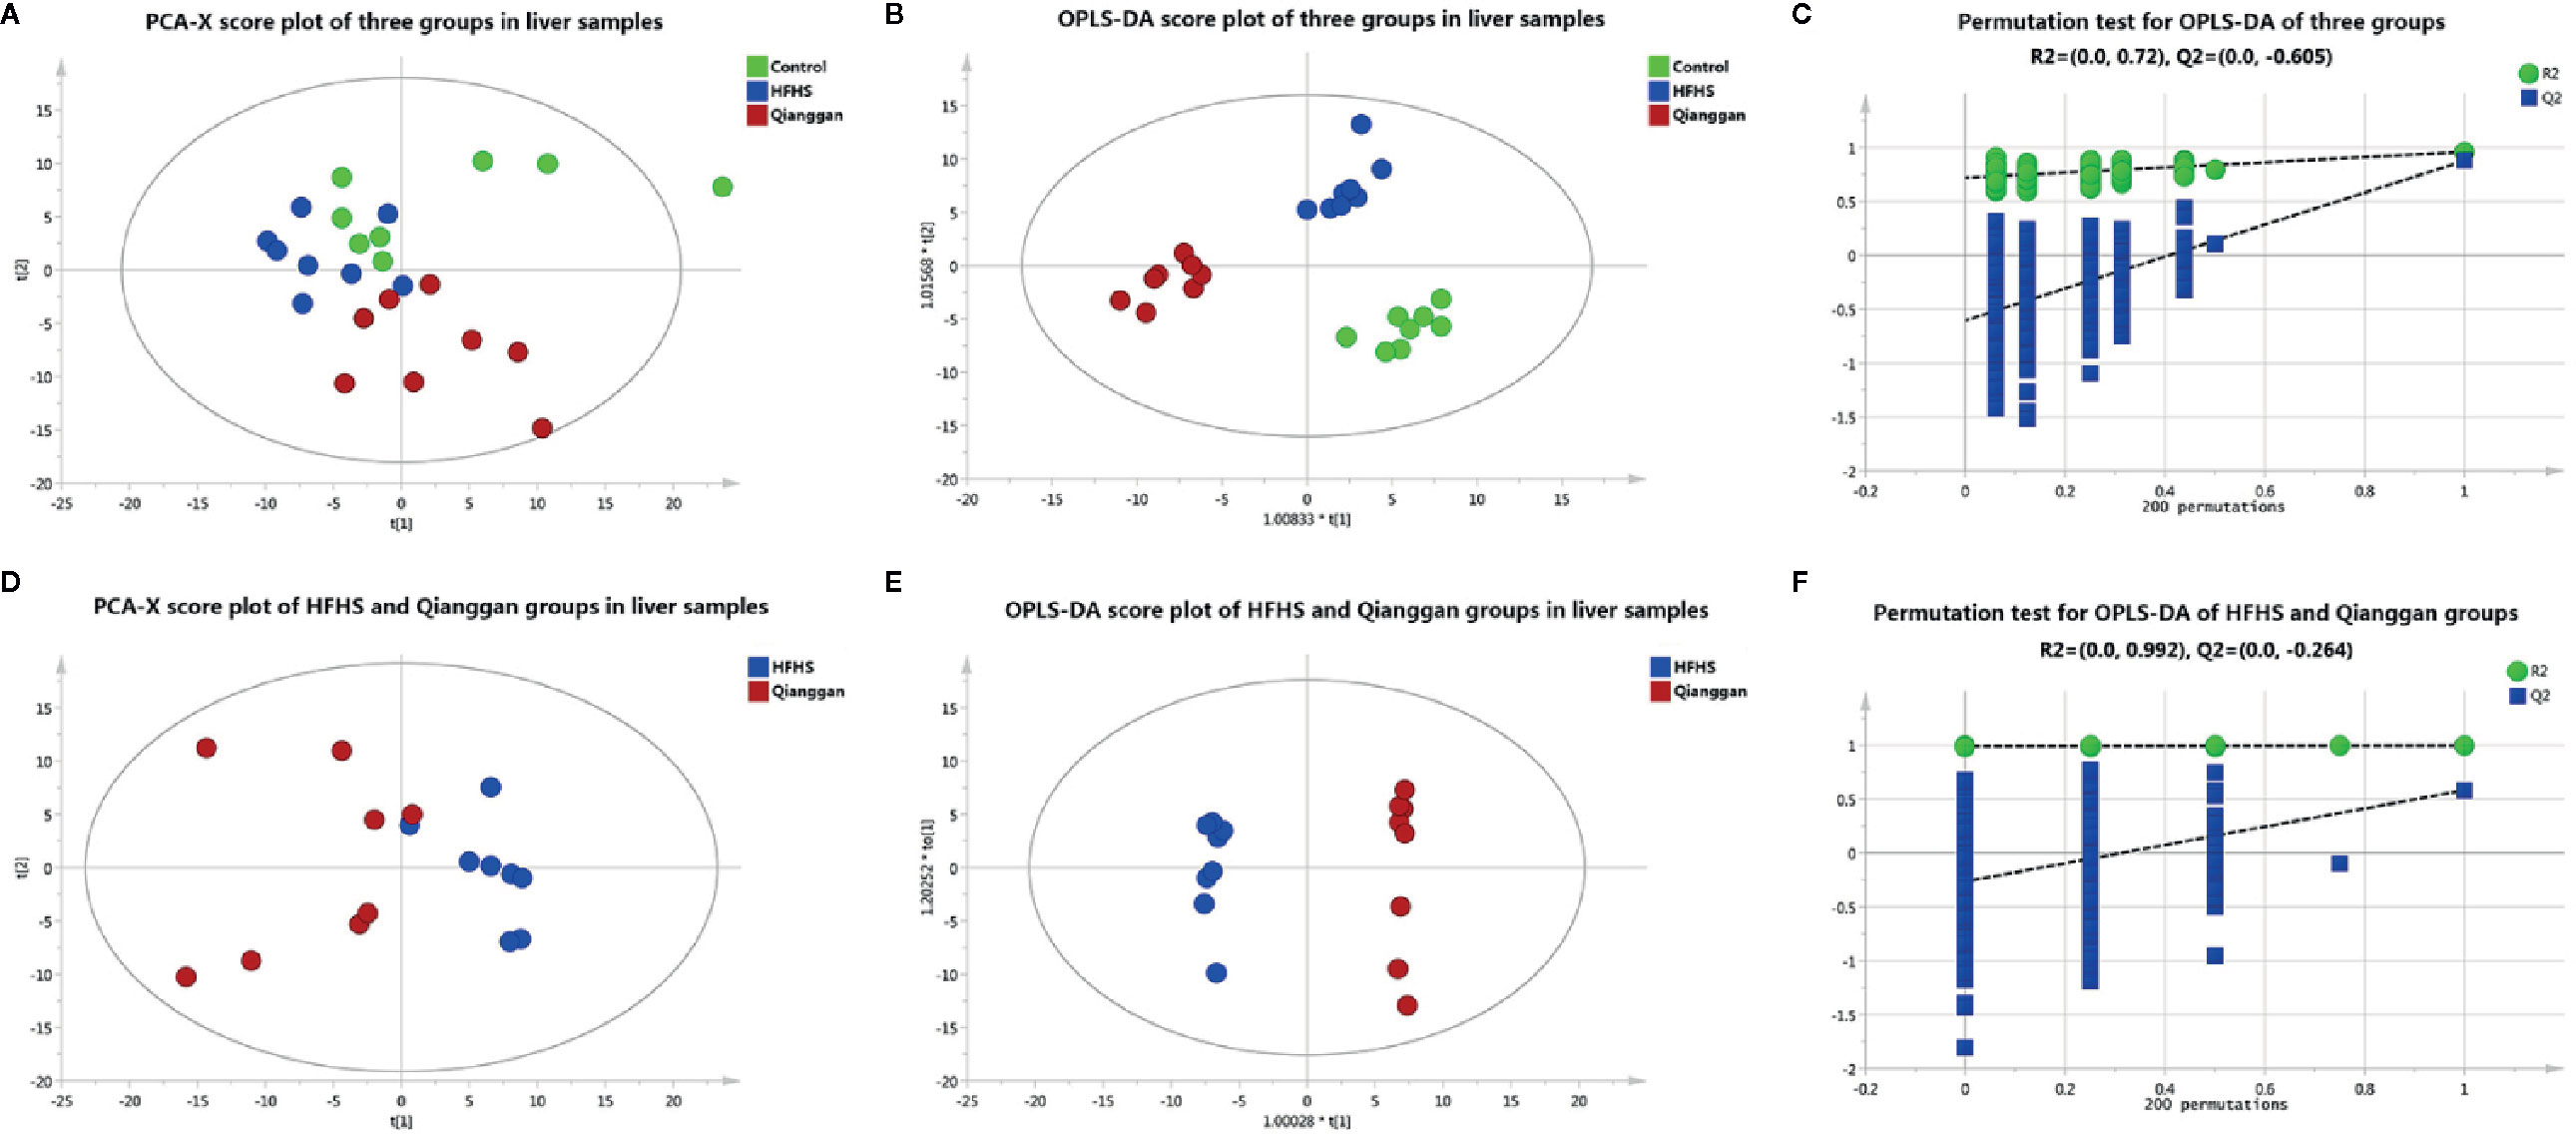
Figure 3 Multivariate analysis based on metabolomics of liver samples. (A) PCA score plot among control, HFHS diet, and Qiangggan groups. R2X=0.648, Q2 = 0.277; (B) OPLS-DA score plot among three groups. R2X=0.512, R2Y= 0.913, Q2 = 0.277; (C) 200 permutation tests validation of OPLS-DA among three groups. R2 = 0.72, Q2=-0.605; (D) PCA score plot between HFHS diet and Qiangggan groups. R2X=0.622, Q2 = 0.149; (E) OPLS-DA score plot between HFHS diet and Qiangggan groups. R2X=0.584, R2Y= 0.998, Q2 = 0.582; (F) 200 permutation tests validation of OPLS-DA between HFHS diet and Qiangggan groups. R2 = 0.992, Q2=-0.264.
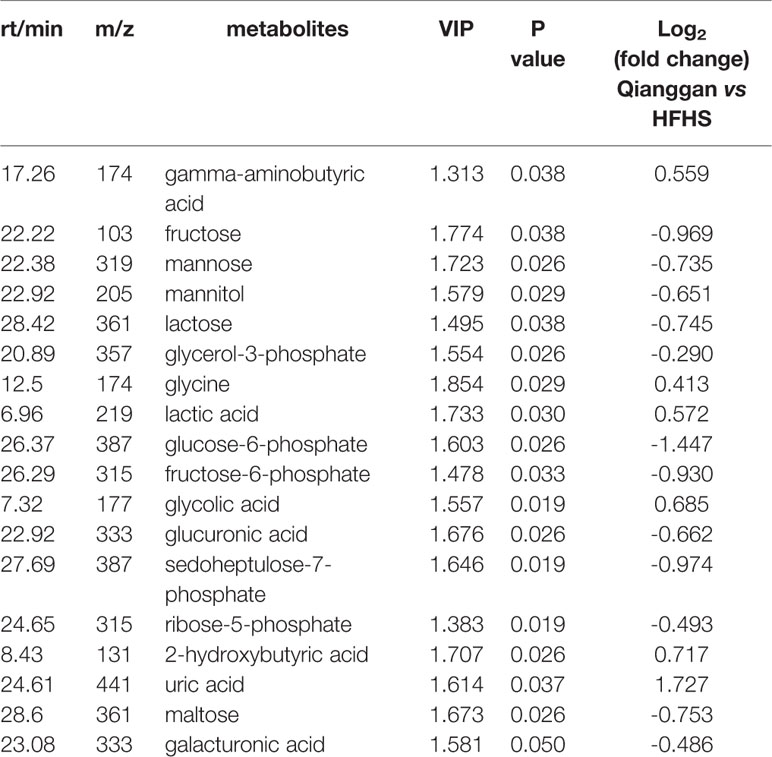
Table 3 Significantly different metabolites in liver tissues.
Same analyses in fecal samples were performed (Figure 4). OPLS-DA plots demonstrated clear separations among three groups (control, HFHS diet and Qianggan treated groups) and in pairwise groups (HFHS diet vs Qianggan intervened groups). Permutation test showed good prediction of the model. By the cutoff of VIP > 1 and p < 0.05, we obtained 30 differential metabolites (e.g. maltose, glycolic acid, and 4-hydroxyproline), suggesting Qianggan extract ameliorated HFHS diet induced metabolite disturbance in feces. Detailed metabolite information was listed in Table 4.
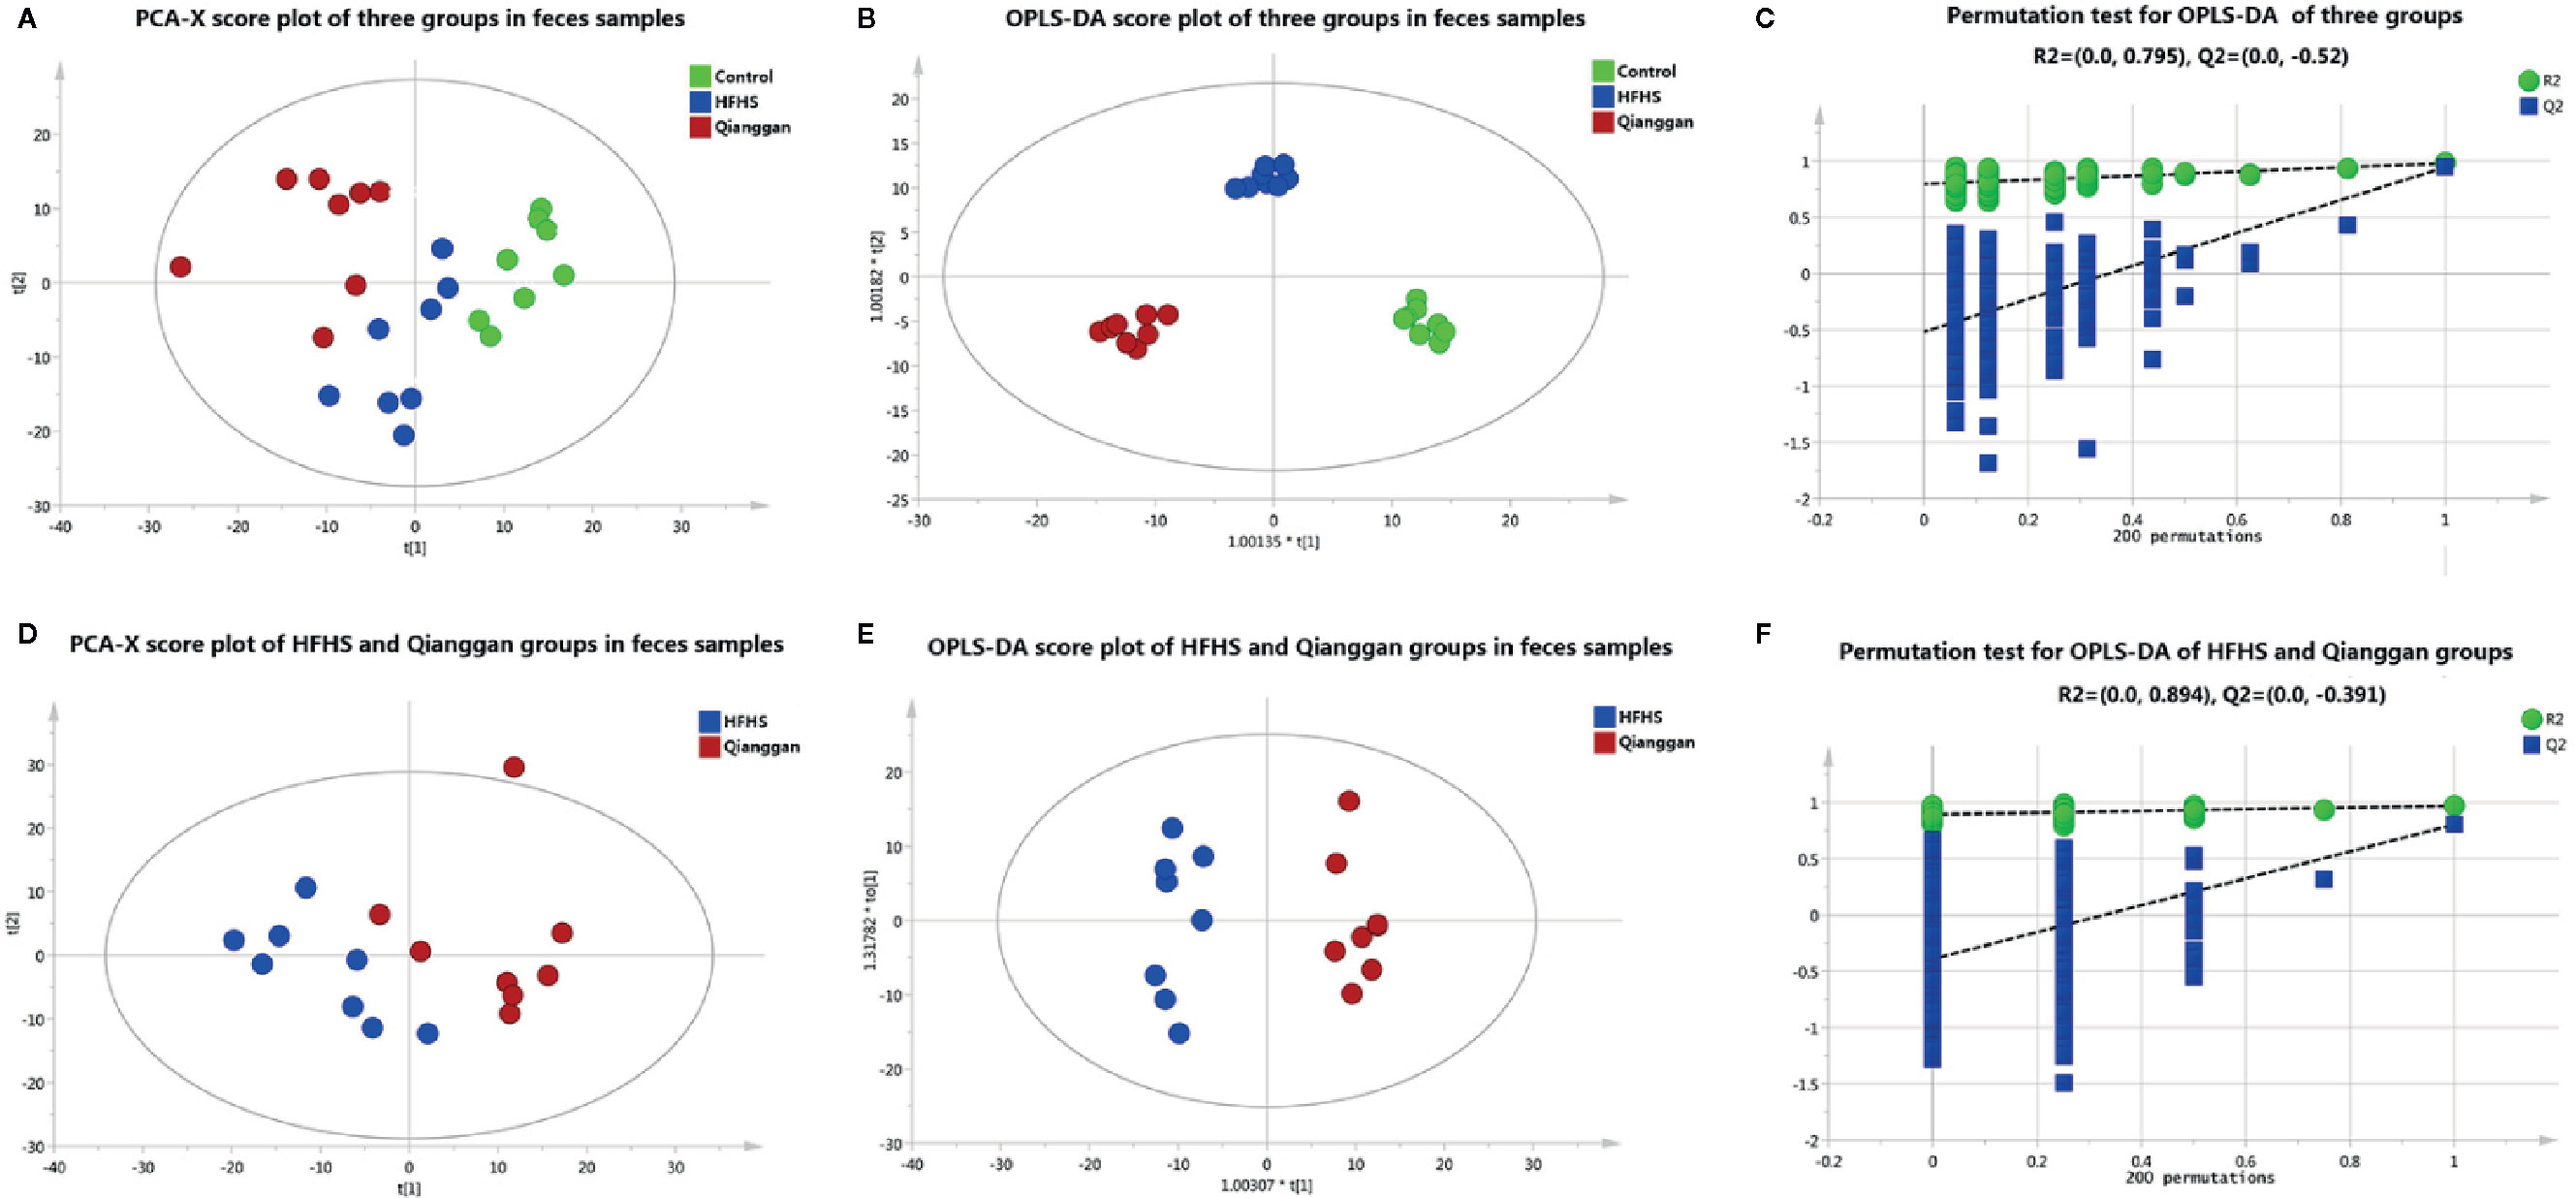
Figure 4 Multivariate analysis based on metabolomics of fecal samples. (A) PCA score plot among control, HFHS diet and Qiangggan groups. R2X=0.612, Q2 = 0.327; (B) OPLS-DA score plot among three groups. R2X=0.634, R2Y= 0.976, Q2 = 0.858; (C) 200 permutation tests validation of OPLS-DA among three groups. R2 = 0.795, Q2=-0.52; (D) PCA score plot between HFHS diet and Qiangggan groups. R2X=0.581, Q2 = 0.204, (E) OPLS-DA score plot between HFHS diet and Qiangggan groups. R2X=0.527, R2Y= 0.968, Q2 = 0. 802; (F) 200 permutation tests validation of OPLS-DA between HFHS diet and Qiangggan group. R2 = 0.894, Q2=-0.391.
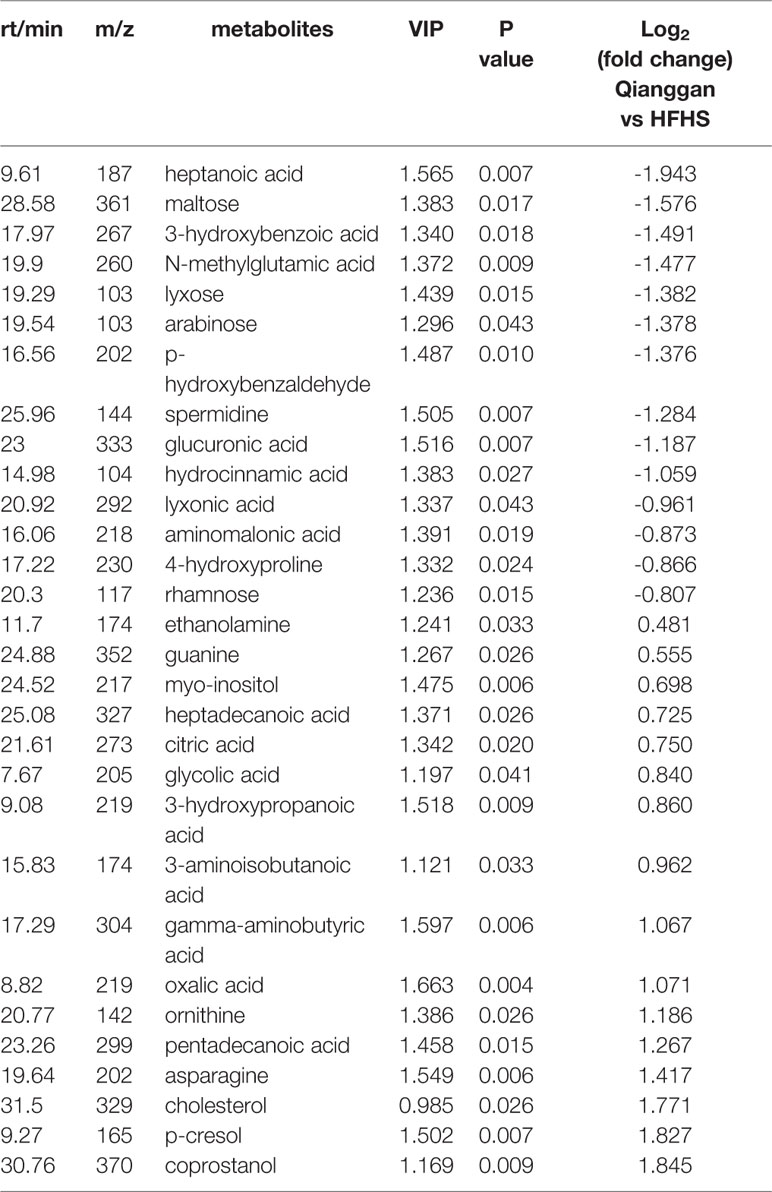
Table 4 Significantly different metabolites in fecal samples.
To better visualize the patterns of differential metabolites, hierarchical clusters were performed. As shown in Figures 5A, B, distinct discrimination can be observed in pairwise groups in both liver and fecal samples. Of interest, most metabolites are in opposite pattern between HFHS vs Control and Qiangggan vs HFHS. For instance, glucose-6-phosphate and fructose-6-phosphate levels were higher in HFHS diet group compared to control group, but significantly decreased in Qiangggan intervened group. The data implicated that Qianggan extract markedly restored HFHS diet induced metabolites disturbance, and the affected metabolites might be potential targets of the compound. By Venn diagram (Figure 5C), we observed four overlapped metabolites between liver and fecal samples. In all, we obtained 44 potential metabolites used for further analysis.
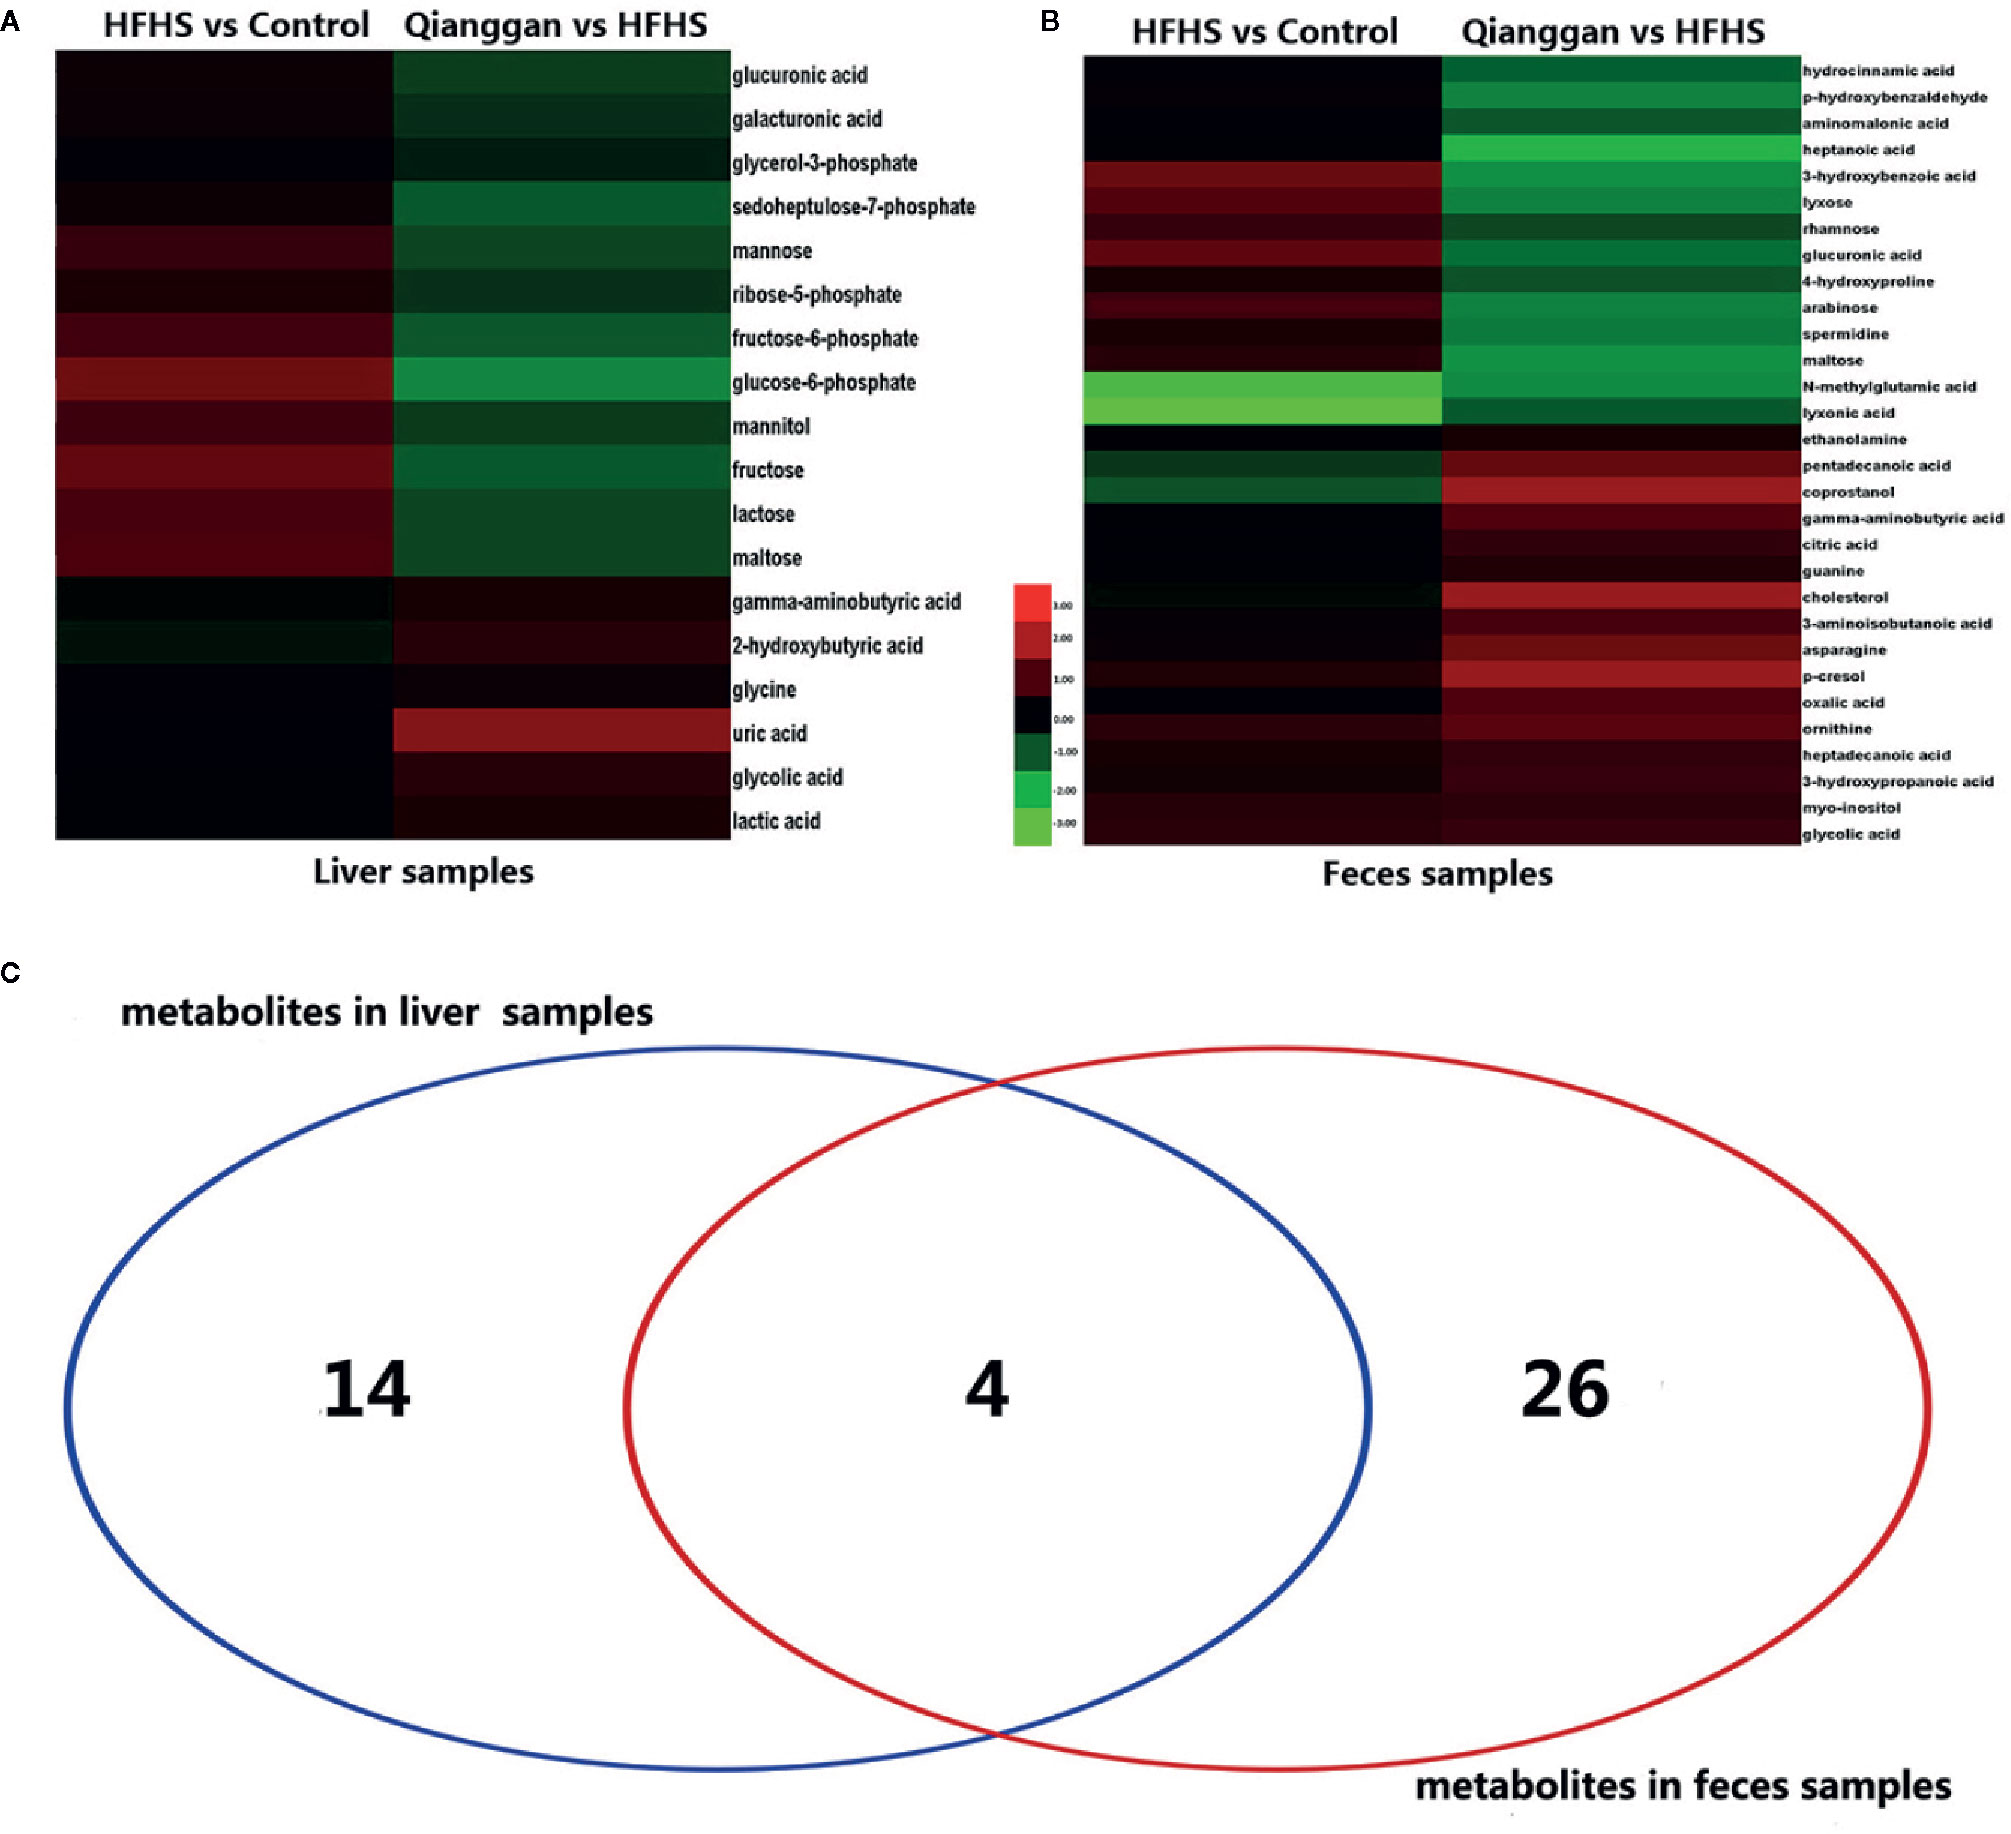
Figure 5 Significantly different metabolites among groups. (A) Hierarchical cluster analysis between pairwise groups (HFHS vs control and Qianggan vs HFHS) for identified metabolites from liver samples. (B) Hierarchical cluster analysis of identified metabolites between pairwise groups (HFHS vs control and Qianggan vs HFHS) in fecal samples. (C) Venn diagram to reveal overlapped and gross metabolites obtained from liver and fecal samples. Red color represents up-regulation and green represents down-regulation.
MSEA and Metabolic Pathway Analysis
To understand the biological meaning and relevant metabolic pathways of the identified 44 metabolites, comprehensive MSEA and pathway enrichment analysis were performed. As shown in Figure 6, these metabolites were enriched in 43 metabolic pathways, and the top 10 were all glycometabolism related pathways (e.g. glycolysis/gluconeogenesis, pentose phosphate pathway, fructose and mannose metabolism, etc), and the alteration of these pathways might account for the efficacy of Qianggan extract on hyperglycemia. Of note, these metabolic pathways interconnected with each other and formed a complex network. Furthermore, to understand the complicated correlations among genes, enzymes, and metabolites in enriched pathways, we constructed the compound-reaction-enzyme-gene network (Figure 7). For instance, the metabolite glucose-6-phosphate was disturbed by HFHS diet and improved by Qiangggan extract, and predictably, related genes (e.g. Gck, Hk1, Hk2, etc) and enzymes (e.g. glucokinase, hexokinase, etc) in glycolysis/gluconeogenesis pathway were involved in the regulation process.
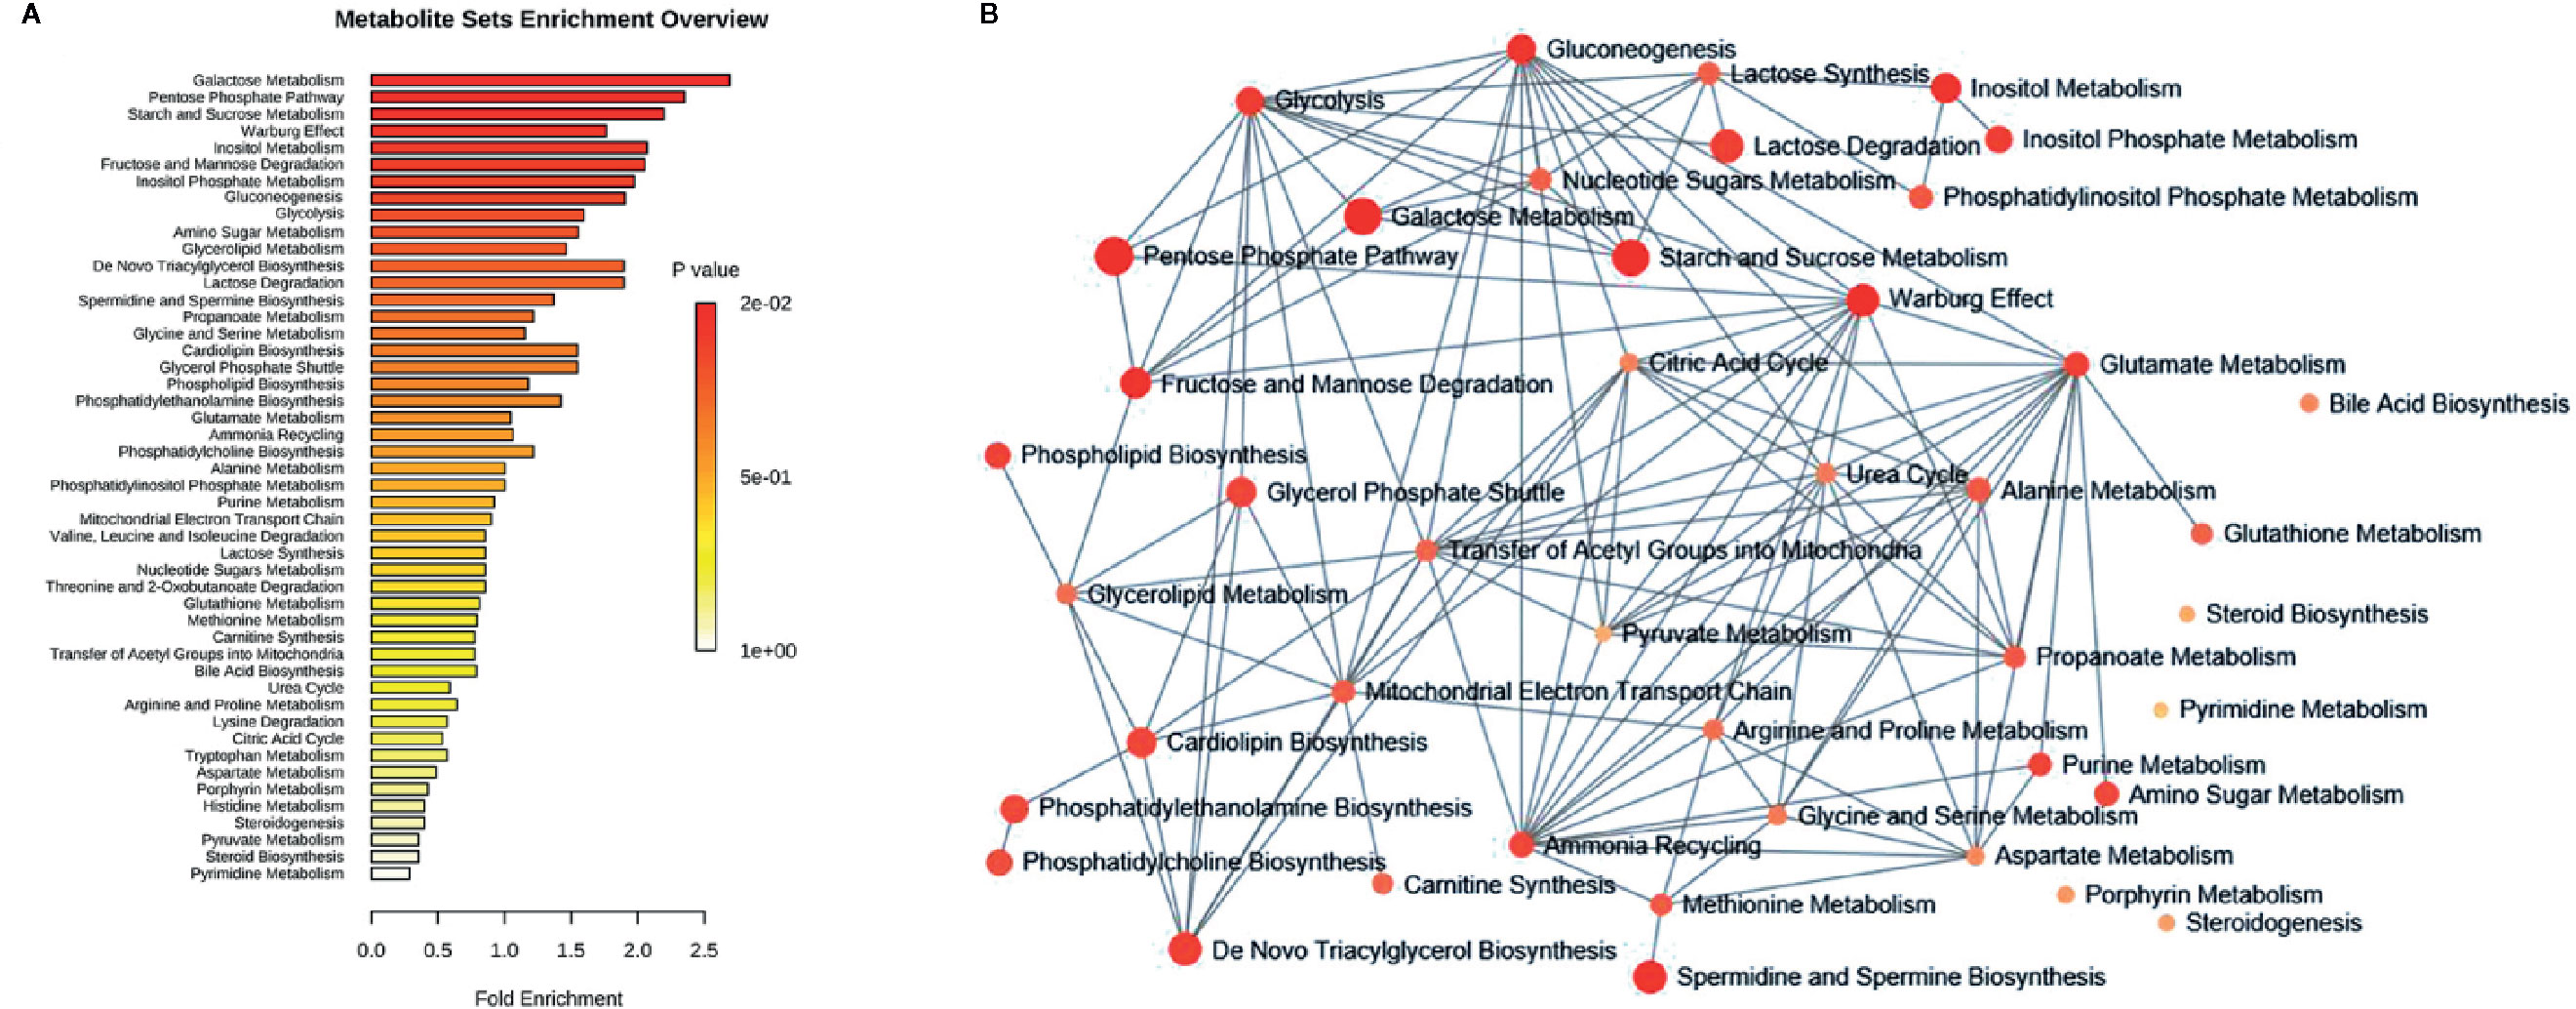
Figure 6 MSEA and pathway enrichment overview. (A) MSEA overview obtained through MetaboAnalyst 4.0 by plotting -log of p-values from pathway enrichment analysis on the y-axis, and pathway impact values from pathway topology analysis on the x-axis. (B) Pathway interaction network graph obtained by MetaboAnalyst 4.0 enrichment analysis. Nodes represent different enriched pathways and edges represent correlations.
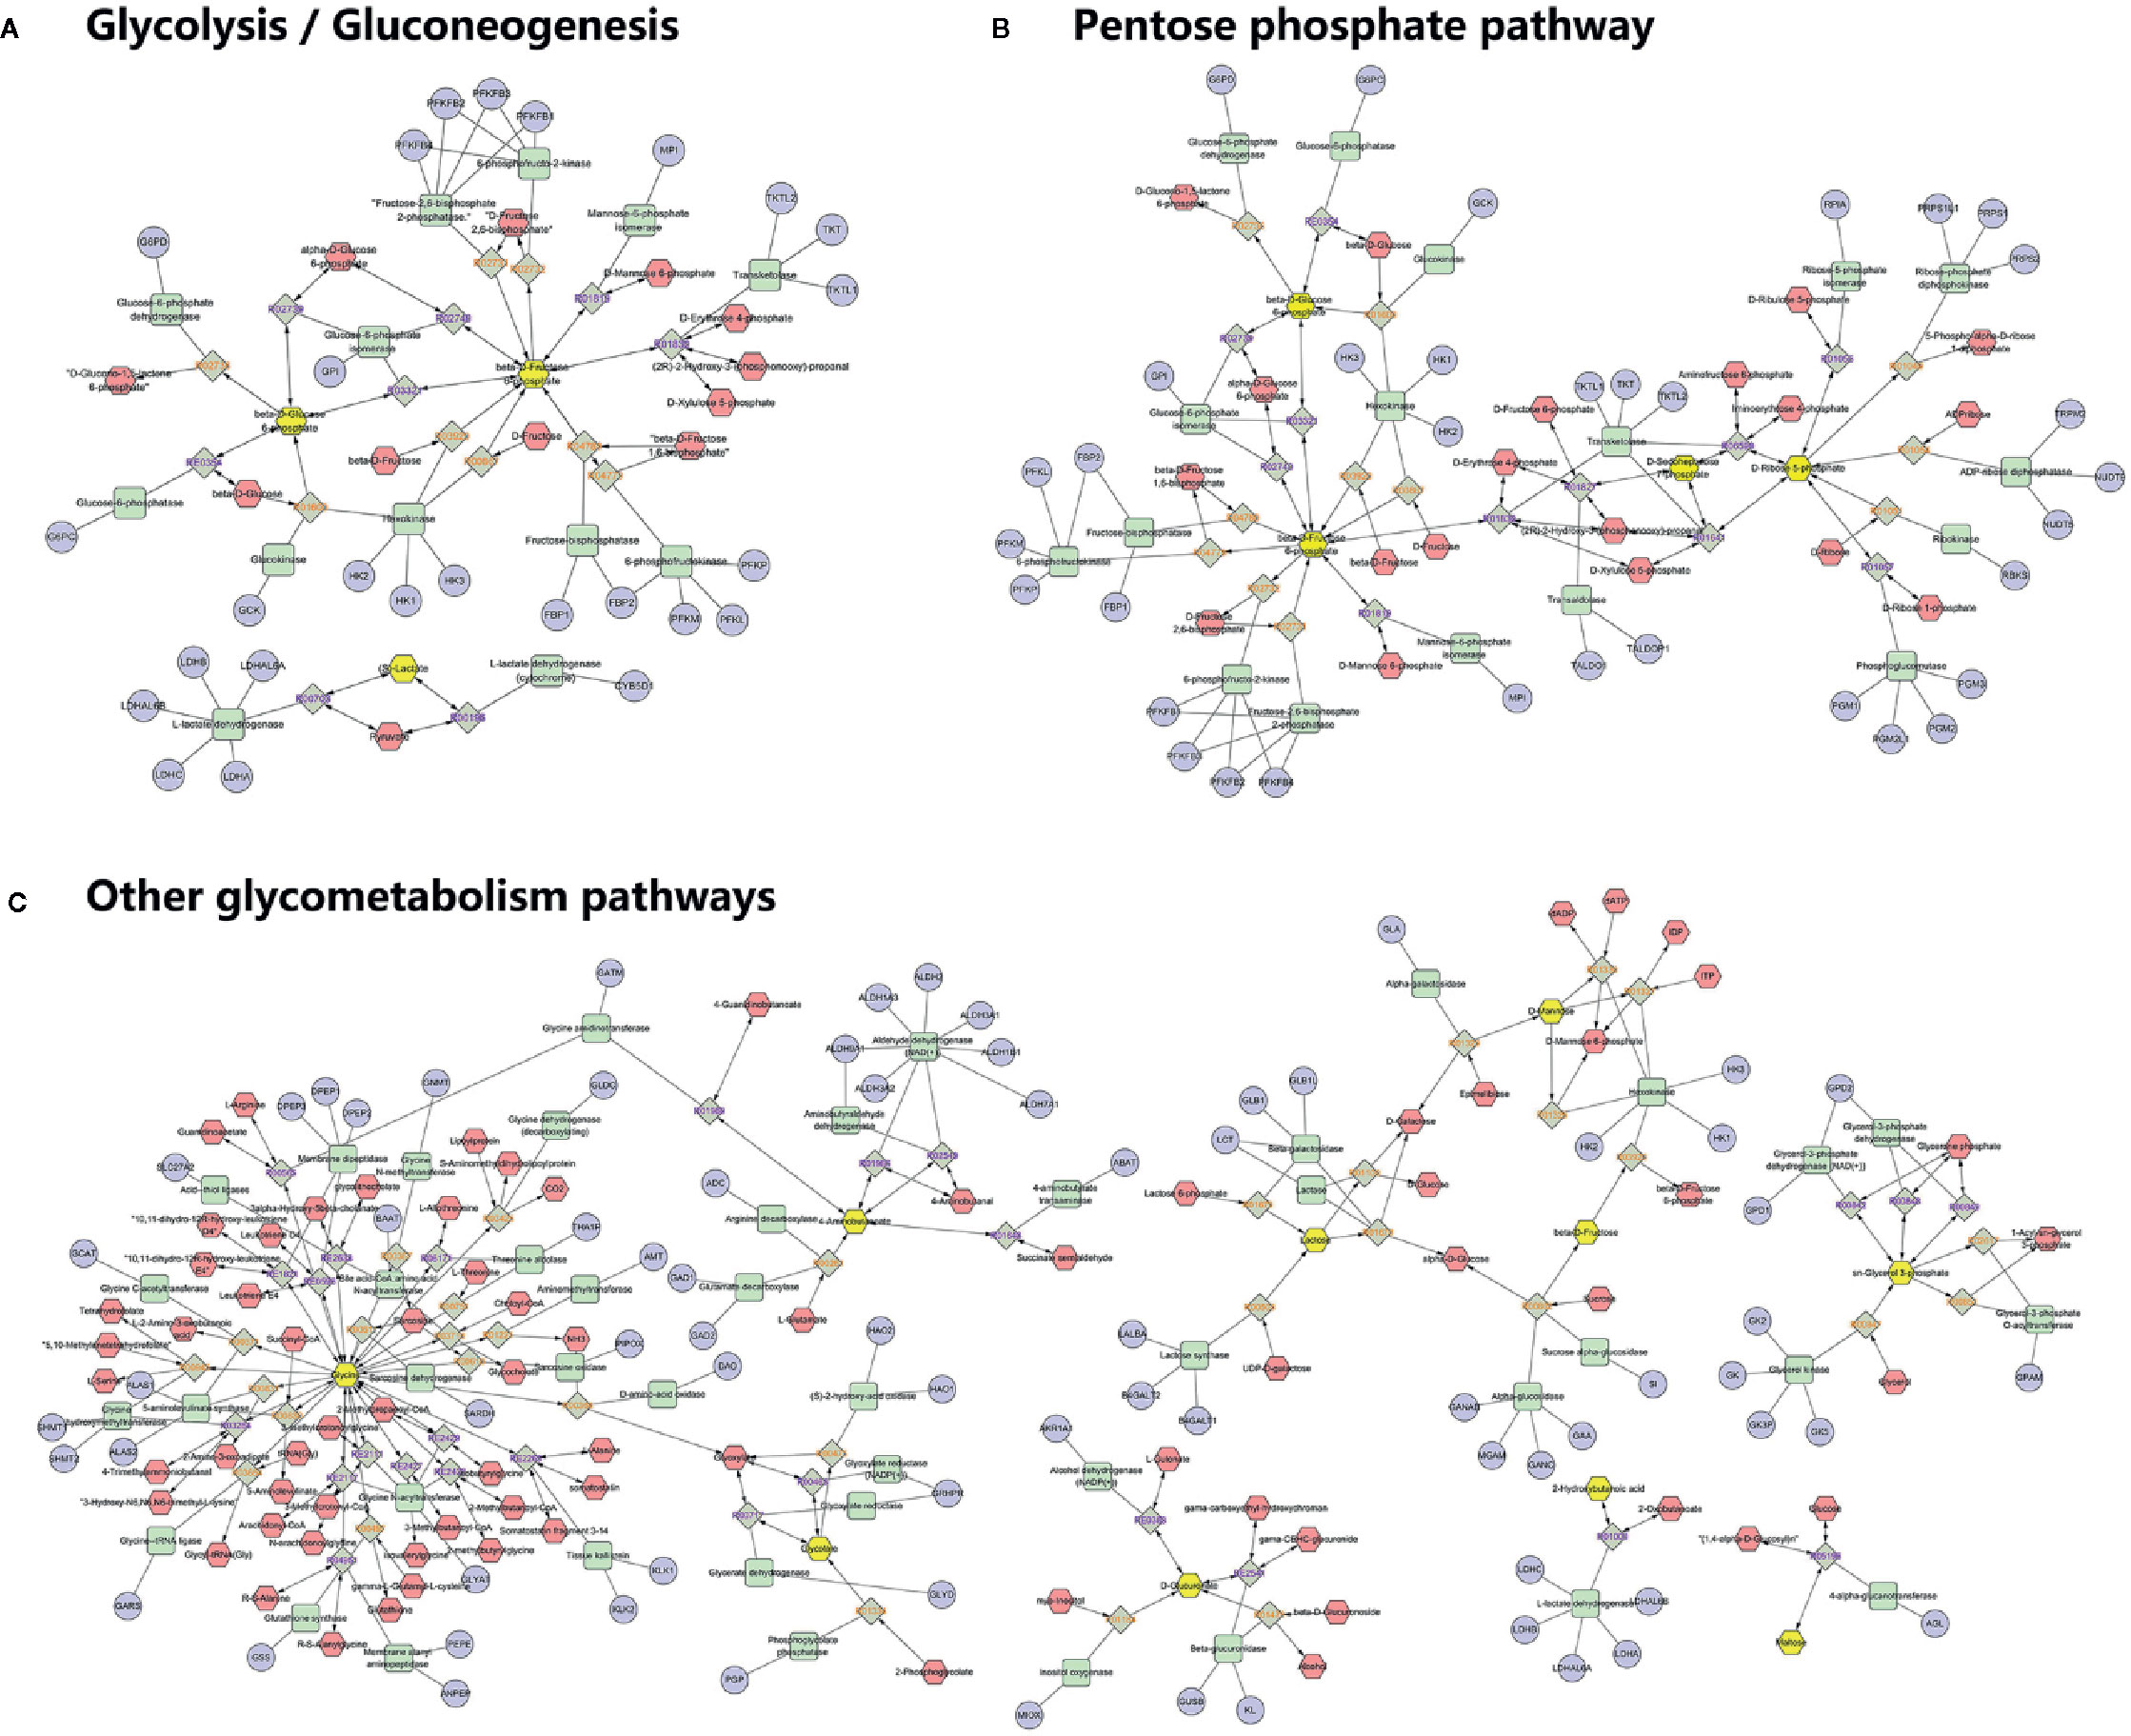
Figure 7 Compound-reaction-enzyme-gene network analysis for enriched pathways. (A) Network in glycolysis/gluconeogenesis, (B) Network in Pentose phosphate pathway, (C) Network in other related pathways. Yellow hexagons represent identified differential metabolites in relevant metabolic pathways. Red hexagons represent intermediates might related with the identified metabolites. Green squares represent enzymes which might regulate the identified metabolites. Blue circles represent genes encoding those enzymes. Grey diamonds represent reactions catalyzed by those enzymes.
Discussion
In the present study, we illustrated the effect of Qiangggan extract on diet induced hyperglycemia, and through the analysis of metabolomics, we identified glycometabolism related pathways were involved in the metabolic disturbance and under the benefit effects of Qianggan extract.
Metabolomics has been extensively employed in detecting metabolites profiles to explore the pathophysiology of diseases, predict potential biomarkers, and identify drug targets (Sun et al., 2014). The balance of glucose metabolism was impaired in patients with liver injury (Guo et al., 2015) and steatosis (Hu et al., 2018).
Glycolysis and gluconeogenesis are critical pathways in keeping glucose balance (Petersen et al., 2017). Glycolysis is a glucose utilization process, which converts glucose into pyruvate or lactate. Gluconeogenesis is opposite to that of glycolysis, which synthesizes glucose from other metabolites like pyruvate, lactate, and glucogenic amino acids (Tang et al., 2018). Glycolysis and gluconeogenesis possess several reversible enzyme-catalyzed reactions and share a series of common intermediates such as glucose-6-phosphate, fructose-6-phosphate, fructose-1, 6-bisphosphate, lactate, etc (Sharabi et al., 2015). The net flux toward glycolysis or gluconeogenesis may be regulated by the key enzymes or their related metabolites which could be influenced by multi-factors such as nutrients and drugs. Using metabolomics approach, Wan et al. reported several intermediates including fructose 6-phosphate and 6-phospho-gluconate were elevated in high fat diet fed rats liver, and the alteration was reversed by vine tea, which implicated the efficacy partially by altering glycolysis or gluconeogenesis (Wan et al., 2017). It is also reported that HFHS diet could induce accelerated gluconeogenesis to yield glucose (Commerford et al., 2001). Our data were in accordance with previous studies to some extent. We noticed that glycolysis or gluconeogenesis intermediates glucose-6-phosphate and fructose-6-phosphate were raised after HFHS diet feeding. Qianggan extract administration restored the increase of glucose-6-phosphate and fructose-6-phosphate and raised lactic acid, implicating that Qiangggan extract improved glucose metabolism disorders partially by accelerating glycolysis or suppressing gluconeogenesis. Similar results were also exhibited in another insulin resistance rat model, which reported that coreopsis tinctoria flowering tops (traditionally employed to improve hyperglycemia) could reduce the increase of fructose 6-phosphate and 6-phosphogluconate induced by high fat diet (Jiang et al., 2015).
Pentose phosphate pathway branches from glycolysis via glucose-6-phosphate at the first committed step (Cho et al., 2018). Dong et al. employed metabolomics to explore biomarkers of different stage of nonalcoholic fatty liver disease (NAFLD) and demonstrated that pentose phosphate pathway was involved in the progress of NAFLD (Dong et al., 2017). Another study reported that pentose phosphate pathway was related to diabetes retinopathy and relevant metabolites were increased (Chen et al., 2016). In the present study, hyperglycemia status showed elevated metabolites that related to pentose phosphate pathway, such as glucose-6-phosphate, ribose-5-phosphate, and sedoheptulose-7-phosphate, which were attenuated by Qianggan extract. Our data were partly in line with previous studies (Hong et al., 2017), suggested the alteration of pentose phosphate pathway more or less account for the efficacy of Qiangggan extract. Besides, glycogenesis (glycogen synthesis) is reliant on glycolysis and starts with glucose-6-phosphate, is the process of glucose storage and vital in the maintenance of glucose concentration (Han et al., 2016). It was reported that glycogen content was decreased in high fat diet induced obese rats, and improved by octreotide which might serve as a novel treatment of obesity (Wang et al., 2017). Our data showed that the level of glycogen was significantly lowered in hyperglycemia and improved after Qiangggan extract intervention, which were consistent with the previous studies.
In addition, fructose and mannose metabolism also disturbed under metabolic dysfunctions. Zhang et al. found metabolites fructose and mannose were markedly elevated, which were deemed to be potential biomarkers of type 2 diabetes in patients (Zhang et al., 2016a). Boztepe et al performed microarray analysis to explore molecular responses to high glucose, and identified fructose and mannose metabolism was altered (Boztepe and Gulec, 2018). The data suggested that fructose and mannose metabolism play a role in metabolic diseases. Consistently, we also observed increased metabolites of fructose, mannitol, and mannose in hyperglycemia group compared to control group, whereas, Qiangggan extract significantly lowered the expression of these metabolites, suggesting potential targets of Qianggan extract.
A compound-reaction-enzyme-gene network was visualized to help in understanding the complex relations among metabolites, proteins, or genes in relevant metabolic pathways. For instance, we noticed that hexokinase (encoded by genes Hk1, Hk2 and Hk3) and glucokinase (encoded by Gck) might regulate glucose-6-phosphate. Besides hexokinase, many other enzymes such as fructose-bisphosphatase (encoded by Fbp1 and Fbp2) and mannose-6-phosphate isomerase (encode by Mpi) were related to the regulation of fructose-5-phosphate. Several enzymes such as ribokinase (encoded by Rbks) and ribose-5-phosphate isomerase (encoded by Rpia) may play a role in modulating the level of ribose-5-phosphate. Our findings were corroborated by abundant previous studies. For example, the activators of the enzyme glucokinase which converts glucose to glucose-6-phosphate in glycolysis, could ameliorate hyperglycemia and have been used as novel glucose-lowering drugs in diabetic models (Erion et al., 2014; Rubtsov et al., 2015). The enzyme ribose-5-phosphate isomerase was correlated with live cancer and has been identified as potential target of therapy (Ciou et al., 2015). Further investigations on identified metabolites and their related enzymes may ascertain Qiangggan extract targets and obtain novel therapies to treat high glucose related diseases.
Notably, the dosage of Qianggan extract for alleviating hyperglycemia was two times of the dosage used for improving fatty liver disease in rats, but the proper dosage for human needs to be optimized in the clinical settings. Our data were based on GC-MS metabolomics. We identified potential metabolites, relevant pathways, and key enzymes, however, we did not detect the expressions of correlated genes or enzymes in specific metabolic pathways. Comprehensive investigation of transcriptomics or proteomics and drug-metabolites interactions should be performed to mutually validate our finding from metabolomics (Ge, 2019; Zhou et al., 2019). In addition, our findings were obtained from animal models, and massive experiments and clinical investigations should be employed to further verify the data and for later clinical translation.
Conclusion
Qiangggan extract restored diet-induced glucose metabolism perturbations. The efficacy might partially due to the regulation of relevant glycometabolism pathways such as glycolysis or gluconeogenesis, pentose phosphate pathway, glycogenesis, fructose, and mannose metabolism. Our findings may infer the potential mechanisms of Qianggan extract on hyperglycemia.
Data Availability Statement
The raw data supporting the conclusions of this article will be made available by the authors, without undue reservation, to any qualified researcher.
Ethics Statement
All animal procedures were approved by the Animal Experiment Ethics Committee of Shanghai University of Traditional Chinese Medicine, and the approval number is PZSHUTCM191227006.
Author Contributions
GJ and LZ designed the study. ML, WZ, and LZ performed the experiment. GG performed the chemical profiling. MZ analyzed the data. MZ, LZ, and GJ wrote the manuscript.
Funding
This work was supported by National Natural Science Foundation of China (No. 81620108030, 81774084). The funders had no role in study design, data collection and analysis, decision to publish, or preparation of the manuscript.
Conflict of Interest
The authors declare that the research was conducted in the absence of any commercial or financial relationships that could be construed as a potential conflict of interest.
Acknowledgments
We thank Dr. Xiaoyan Huang for her help in animal experiment.
Supplementary Material
The Supplementary Material for this article can be found online at: https://www.frontiersin.org/articles/10.3389/fphar.2020.00671/full#supplementary-material
References
Boztepe, T., Gulec, S. (2018). Investigation of the influence of high glucose on molecular and genetic responses: an in vitro study using a human intestine model. Genes Nutr. 13, 11. doi: 10.1186/s12263-018-0602-x
Cao, G., Shan, Q., Li, X., Cong, X., Zhang, Y., Cai, H., et al. (2011). Analysis of fresh Mentha haplocalyx volatile components by comprehensive two-dimensional gas chromatography and high-resolution time-of-flight mass spectrometry. Analyst 136 (22), 4653–4661. doi: 10.1039/c1an15616k
Chen, L., Cheng, C. Y., Choi, H., Ikram, M. K., Sabanayagam, C., Tan, G. S., et al. (2016). Plasma Metabonomic Profiling of Diabetic Retinopathy. Diabetes 65 (4), 1099–1108. doi: 10.2337/db15-0661
Cho, E. S., Cha, Y. H., Kim, H. S., Kim, N. H., Yook, J. I. (2018). The Pentose Phosphate Pathway as a Potential Target for Cancer Therapy. Biomol. Ther. (Seoul) 26 (1), 29–38. doi: 10.4062/biomolther.2017.179
Chong, J., Soufan, O., Li, C., Caraus, I., Li, S., Bourque, G., et al. (2018). MetaboAnalyst 4.0: towards more transparent and integrative metabolomics analysis. Nucleic Acids Res. 46 (W1), W486–W494. doi: 10.1093/nar/gky310
Ciou, S. C., Chou, Y. T., Liu, Y. L., Nieh, Y. C., Lu, J. W., Huang, S. F., et al. (2015). Ribose-5-phosphate isomerase A regulates hepatocarcinogenesis via PP2A and ERK signaling. Int. J. Cancer 137 (1), 104–115. doi: 10.1002/ijc.29361
Commerford, S. R., Bizeau, M. E., McRae, H., Jampolis, A., Thresher, J. S., Pagliassotti, M. J. (2001). Hyperglycemia compensates for diet-induced insulin resistance in liver and skeletal muscle of rats. Am. J. Physiol. Regul. Integr. Comp. Physiol. 281 (5), R1380–R1389. doi: 10.1152/ajpregu.2001.281.5.R1380
Crowther, L. M., Poms, M., Plecko, B. (2018). Multiomics tools for the diagnosis and treatment of rare neurological disease. J. Inherit Metab. Dis. 41 (3), 425–434. doi: 10.1007/s10545-018-0154-7
Dai, M., Wang, F., Zou, Z., Xiao, G., Chen, H., Yang, H. (2017). Metabolic regulations of a decoction of Hedyotis diffusa in acute liver injury of mouse models. Chin. Med. 12, 35. doi: 10.1186/s13020-017-0159-4
Dong, S., Zhan, Z. Y., Cao, H. Y., Wu, C., Bian, Y. Q., Li, J. Y., et al. (2017). Urinary metabolomics analysis identifies key biomarkers of different stages of nonalcoholic fatty liver disease. World J. Gastroenterol. 23 (15), 2771–2784. doi: 10.3748/wjg.v23.i15.2771
Erion, D. M., Lapworth, A., Amor, P. A., Bai, G., Vera, N. B., Clark, R. W., et al. (2014). The hepatoselective glucokinase activator PF-04991532 ameliorates hyperglycemia without causing hepatic steatosis in diabetic rats. PloS One 9 (5), e97139. doi: 10.1371/journal.pone.0097139
Feng, D., Xia, Z., Zhou, J., Lu, H., Zhang, C., Fan, R., et al. (2017). Metabolomics reveals the effect of Xuefu Zhuyu Decoction on plasma metabolism in rats with acute traumatic brain injury. Oncotarget 8 (55), 94692–94710. doi: 10.18632/oncotarget.21876
Gao, X., Pujos-Guillot, E., Sebedio, J. L. (2010). Development of a quantitative metabolomic approach to study clinical human fecal water metabolome based on trimethylsilylation derivatization and GC/MS analysis. Anal. Chem. 82 (15), 6447–6456. doi: 10.1021/ac1006552
Ge, G. B. (2019). Deciphering the metabolic fates of herbal constituents and the interactions of herbs with human metabolic system. Chin. J. Nat. Med. 17 (11), 801–802. doi: 10.1016/S1875-5364(19)30098-6
Gou, X. J., Feng, Q., Fan, L. L., Zhu, J., Hu, Y. Y. (2017). Serum and Liver Tissue Metabonomic Study on Fatty Liver in Rats Induced by High-Fat Diet and Intervention Effects of Traditional Chinese Medicine Qushi Huayu Decoction. Evid. Based Complement Alternat. Med. 2017, 6242697. doi: 10.1155/2017/6242697
Gu, S., Huang, M. X. (2011). [Clinical observation of Qianggan capsule in the treatment of non-alcoholic of non-alcoholic fatty liver fibrosis]. Zhonghua Gan Zang Bing Za Zhi 19 (10), 791–792.
Guo, C. H., Sun, T. T., Weng, X. D., Zhang, J. C., Chen, J. X., Deng, G. J. (2015). The investigation of glucose metabolism and insulin secretion in subjects of chronic hepatitis B with cirrhosis. Int. J. Clin. Exp. Pathol. 8 (10), 13381–13386.
Guo, W., Tan, H. Y., Wang, N., Wang, X., Feng, Y. (2018). Deciphering hepatocellular carcinoma through metabolomics: from biomarker discovery to therapy evaluation. Cancer Manag Res. 10, 715–734. doi: 10.2147/CMAR.S156837
Han, H. S., Kang, G., Kim, J. S., Choi, B. H., Koo, S. H. (2016). Regulation of glucose metabolism from a liver-centric perspective. Exp. Mol. Med. 48, e218. doi: 10.1038/emm.2015.122
Hong, M., Jung, J., Park, H. S., Lee, S. M., Jeong, N. J., Kim, S. H., et al. (2017). Shaofu Zhuyu decoction ameliorates obesity-mediated hepatic steatosis and systemic inflammation by regulating metabolic pathways. PloS One 12 (6), e0178514. doi: 10.1371/journal.pone.0178514
Hu, Y. B., Liu, X. Y., Zhan, W. (2018). Farnesoid X receptor agonist INT-767 attenuates liver steatosis and inflammation in rat model of nonalcoholic steatohepatitis. Drug Des. Devel. Ther. 12, 2213–2221. doi: 10.2147/DDDT.S170518
Jiang, B., Le, L., Wan, W., Zhai, W., Hu, K., Xu, L., et al. (2015). The Flower Tea Coreopsis tinctoria Increases Insulin Sensitivity and Regulates Hepatic Metabolism in Rats Fed a High-Fat Diet. Endocrinology 156 (6), 2006–2018. doi: 10.1210/en.2015-1015
Karnovsky, A., Weymouth, T., Hull, T., Tarcea, V. G., Scardoni, G., Laudanna, C., et al. (2012). Metscape 2 bioinformatics tool for the analysis and visualization of metabolomics and gene expression data. Bioinformatics 28 (3), 373–380. doi: 10.1093/bioinformatics/btr661
Li, L., Zhang, X. J., Lan, Y., Xu, L., Zhang, X. Z., Wang, H. H. (2010). Treatment of non-alcoholic fatty liver disease by Qianggan Capsule. Chin. J. Integr. Med. 16 (1), 23–27. doi: 10.1007/s11655-010-0023-1
Li, X., Zhang, Y., Wang, Y., Xu, J., Xin, P., Meng, Y., et al. (2017). The Mechanisms of Traditional Chinese Medicine Underlying the Prevention and Treatment of Parkinson's Disease. Front. Pharmacol. 8, 634. doi: 10.3389/fphar.2017.00634
Liang, S., Zhang, Y., Deng, Y., He, Y., Liang, Y., Liang, Z., et al. (2018). The Potential Effect of Chinese Herbal Formula Hongqijiangzhi Fang in Improving NAFLD: Focusing on NLRP3 Inflammasome and Gut Microbiota. Evid. Based Complement Alternat. Med. 2018, 5378961. doi: 10.1155/2018/5378961
Liu, Y., Wu, S., Sun, W., Chen, S., Yang, X., Yang, X. (2018). Variation in proteomics and metabolomics of chicken hepatocytes exposed to medium with or without folic acid. J. Cell Biochem. 119 (7), 6113–6124. doi: 10.1002/jcb.26810
Luedemann, A., Strassburg, K., Erban, A., Kopka, J. (2008). TagFinder for the quantitative analysis of gas chromatography–mass spectrometry (GC-MS)-based metabolite profiling experiments. Bioinformatics 24 (5), 732–737. doi: 10.1093/bioinformatics/btn023
Petersen, M. C., Vatner, D. F., Shulman, G. I. (2017). Regulation of hepatic glucose metabolism in health and disease. Nat. Rev. Endocrinol. 13 (10), 572–587. doi: 10.1038/nrendo.2017.80
Procopet, B., Fischer, P., Farcau, O., Stefanescu, H. (2018). Metabolomics: From liver chiromancy to personalized precision medicine in advanced chronic liver disease. World J. Hepatol. 10 (3), 371–378. doi: 10.4254/wjh.v10.i3.371
Rubtsov, P. M., Igudin, E. L., Tiulpakov, A. N. (2015). [Glucokinase and glucokinase regulatory proteins as molecular targets for novel antidiabetic drugs]. Mol. Biol. (Mosk) 49 (4), 555–560. doi: 10.7868/S002689841504014X
Shackleton, C., Pozo, O. J., Marcos, J. (2018). GC/MS in Recent Years Has Defined the Normal and Clinically Disordered Steroidome: Will It Soon Be Surpassed by LC/Tandem MS in This Role? J. Endocr. Soc. 2 (8), 974–996. doi: 10.1210/js.2018-00135
Sharabi, K., Tavares, C. D., Rines, A. K., Puigserver, P. (2015). Molecular pathophysiology of hepatic glucose production. Mol. Aspects Med. 46, 21–33. doi: 10.1016/j.mam.2015.09.003
Sun, H., Zhang, S., Zhang, A., Yan, G., Wu, X., Han, Y., et al. (2014). Metabolomic analysis of diet-induced type 2 diabetes using UPLC/MS integrated with pattern recognition approach. PloS One 9 (3), e93384. doi: 10.1371/journal.pone.0093384
Tang, Y., Zhang, Y., Wang, C., Sun, Z., Li, L., Cheng, S., et al. (2018). Overexpression of PCK1 Gene Antagonizes Hepatocellular Carcinoma Through the Activation of Gluconeogenesis and Suppression of Glycolysis Pathways. Cell Physiol. Biochem. 47 (1), 344–355. doi: 10.1159/000489811
von Wilamowitz-Moellendorff, A., Hunter, R. W., Garcia-Rocha, M., Kang, L., Lopez-Soldado, I., Lantier, L., et al. (2013). Glucose-6-phosphate-mediated activation of liver glycogen synthase plays a key role in hepatic glycogen synthesis. Diabetes 62 (12), 4070–4082. doi: 10.2337/db13-0880
Wan, W., Jiang, B., Sun, L., Xu, L., Xiao, P. (2017). Metabolomics reveals that vine tea (Ampelopsis grossedentata) prevents high-fat-diet-induced metabolism disorder by improving glucose homeostasis in rats. PloS One 12 (8), e0182830. doi: 10.1371/journal.pone.0182830
Wang, H., Yang, L. M., Huang, L. (2011). [Clinical effects of qianggan capsule on the liver tissue pathology and PDGF-BB, TGF-beta1, TIMP-1, and MMP-1 factors in patients with chronic hepatitis B]. Zhongguo Zhong Xi Yi Jie He Za Zhi 31 (10), 1337–1340.
Wang, X. X., Ye, T., Li, M., Li, X., Qiang, O., Tang, C. W., et al. (2017). Effects of octreotide on hepatic glycogenesis in rats with high fat dietinduced obesity. Mol. Med. Rep. 16 (1), 109–118. doi: 10.3892/mmr.2017.6586
Yu, X., Xu, L., Zhou, Q., Wu, S., Tian, J., Piao, C., et al. (2018). The Efficacy and Safety of the Chinese Herbal Formula, JTTZ, for the Treatment of Type 2 Diabetes with Obesity and Hyperlipidemia: A Multicenter Randomized, Positive-Controlled, Open-Label Clinical Trial. Int. J. Endocrinol. 2018, 9519231. doi: 10.1155/2018/9519231
Zhang, N., Geng, F., Hu, Z. H., Liu, B., Wang, Y. Q., Liu, J. C., et al. (2016a). Preliminary study of urine metabolism in type two diabetic patients based on GC-MS. Am. J. Transl. Res. 8 (7), 2889–2896.
Zhang, Q., Yang, H., An, J., Zhang, R., Chen, B., Hao, D. J. (2016b). Therapeutic Effects of Traditional Chinese Medicine on Spinal Cord Injury: A Promising Supplementary Treatment in Future. Evid. Based Complement Alternat. Med. 2016, 8958721. doi: 10.1155/2016/8958721
Zhou, Q. H., Zhu, Y. D., Zhang, F., Song, Y. Q., Jia, S. N., Zhu, L., et al. (2019). Interactions of drug-metabolizing enzymes with the Chinese herb Psoraleae Fructus. Chin. J. Nat. Med. 17 (11), 858–870. doi: 10.1016/S1875-5364(19)30103-7
Keywords: Qianggan extract, hyperglycemia, glycometabolism, metabolomics, gas chromatography-mass spectrometry
Citation: Zhu M, Li M, Zhou W, Ge G, Zhang L and Ji G (2020) Metabolomic Analysis Identifies Glycometabolism Pathways as Potential Targets of Qianggan Extract in Hyperglycemia Rats. Front. Pharmacol. 11:671. doi: 10.3389/fphar.2020.00671
Received: 15 January 2019; Accepted: 23 April 2020;
Published: 12 May 2020.
Edited by:
Xijun Wang, Heilongjiang University of Chinese Medicine, ChinaReviewed by:
Wei Zhang, Macau University of Science and Technology, MacauAntonia Garcia, Universidad CEU-San Pablo, Spain
Takashi Matsui, University of Tsukuba, Japan
Copyright © 2020 Zhu, Li, Zhou, Ge, Zhang and Ji. This is an open-access article distributed under the terms of the Creative Commons Attribution License (CC BY). The use, distribution or reproduction in other forums is permitted, provided the original author(s) and the copyright owner(s) are credited and that the original publication in this journal is cited, in accordance with accepted academic practice. No use, distribution or reproduction is permitted which does not comply with these terms.
*Correspondence: Li Zhang, zhangli.hl@163.com; Guang Ji, jiliver@vip.sina.com