Quantitative sensory testing in a magnetic resonance environment: considerations for thermal sensitivity and patient safety
 Ayeong (Jenny) Kim1,2
  Edina Szabo1,2
  Claire E. Lunde1,2,3
  Gabriela Comptdaer1,2
  David Zurakowski4
  Christine B. Sieberg1,2,5
  Scott A. Holmes1,6*
- 1Department of Anesthesiology, Critical Care, and Pain Medicine, Pain and Affective Neuroscience Center, Boston Children’s Hospital, Harvard Medical School, Boston, MA, United States
- 2Biobehavioral Pain Innovations Lab, Department of Psychiatry and Behavioral Sciences, Boston Children’s Hospital, Harvard Medical School, Boston, MA, United States
- 3Nuffield Department of Women’s & Reproductive Health, Oxford University, Oxford, United Kingdom
- 4Departments of Anesthesiology and Surgery, Boston Children’s Hospital, Harvard Medical School, Boston, MA, United States
- 5Department of Psychiatry, Harvard Medical School, Boston, MA, United States
- 6Pediatric Pain Pathway Lab, Department of Anesthesiology, Critical Care, and Pain Medicine, Boston Children’s Hospital, Harvard Medical School, Boston, MA, United States
Introduction: Quantitative sensory testing (QST) is often used to understand the perceptual basis of acute and chronic conditions, including pain. As the need grows for developing a mechanistic understanding of neurological pathways underlying perception in the basic and clinical sciences, there is a greater need to adapt techniques such as QST to the magnetic resonance (MR) environment. No studies have yet evaluated the impact of the MR environment on the perception of thermal stimuli. This study aimed to evaluate the differences in temperature sensitivity outside an MR environment and during an MRI scanning session. We hypothesized that there would be a difference in how participants reported their pain sensitivity between the two environments.
Methods: Healthy participants underwent thermal QST outside the MR scanning environment, where they were asked to rate the temperature of a noxious stimulus at which they perceived their pain to be 7/10, using a Likert scale ranging from 0 to 10. Participants repeated this procedure inside a 3.0 T MRI approximately 30 min later. We repeated our investigation in a clinical cohort of participants with a chronic pain condition.
Results: There were statistically significant changes of 1.1°C in thermal sensitivity between environments. This increase in pain threshold was found in healthy participants and replicated in the clinical cohort.
Discussion: Findings can be applied toward improving MR safety, the resolution of brain pathways underlying pain mechanisms, and to more broadly comment on the impact of the MR environment on investigations that integrate perception-influenced processes.
Introduction
The application of quantitative sensory testing (QST) in the magnetic resonance (MR) environment is the advancement of a well-studied technique into a novel environment that is promising for informing the mechanisms underlying cognitive processes. The MR environment is inherently complex, both in terms of the basic machinery and the impact it can have on the human body. As higher magnetic field environments are emerging worldwide (1), it is critical to understand the impact of the MR environment on cognitive faculties. Exposing patients to the MR environment means exposure to unique thermal (e.g., continuous flow of dehumidified room temperature air through the MR bore) and psychological environments (2, 3) and the established impact of MR and changing MR fields on the human body (4). There is little information on applying QST in the MR environment, particularly concerning complex cognitive processes such as pain perception.
Applying QST in pain cognitive neuroscience has proved pivotal in detecting clinical changes and informing pain mechanisms. Thermal QST is a valuable tool used in pain research and can help detect pathophysiological mechanisms associated with neuropathic pain (5) and detect altered central pain processing (6, 7). QST is safe and has been used in adult and pediatric cohorts (8), making it an increasingly popular method of testing pain sensitivity in patients among clinicians and researchers. The application of QST has shown to be reliable over time, including research showing the stability of the technique over a 10-week period (9). The predictive value of QST for identifying persons at risk of developing chronic pain has also been explored, with some research supporting the use of QST in predicting persistent post-surgical pain (10, 11). The application of QST has notable potential in focused populations and should be investigated for its’ application in unique environments, such as the MR environment.
To date, there have been no studies evaluating changes in thermal pain sensitivity using QST-based approaches in the MR environment. This study aimed to explore the relationship between thermal sensitivity inside and outside the MR environment using a standard QST pain sensitivity protocol that required participants to rate their level of perceived pain using a presented Likert scale. We conducted our investigation in the context of a group of healthy female participants between the ages of 13 and 43 years and extended our findings to a clinical cohort of participants with chronic pain. Our clinical cohort was comprised of patients with surgically confirmed endometriosis, a chronic pain condition that impacts approximately 1 in 10 women of reproductive age (12). Findings are discussed in terms of the application of QST in MR environments and the broader impact of MR on cognitive neuroimaging.
Materials and methods
Participants and study recruitment
Sixty-one participants were recruited for the study, and 55 (aged 13–43 years; M = 27.60, SD = 7.92) were included in the data analysis. Participants were required to be between the ages of 12–44 on the day of the study visit, with the ability to speak sufficient English to complete study visit tasks (i.e., self-report questionnaires in English). The clinical cohort included patients with surgically confirmed endometriosis, verified by research staff.
Exclusion criteria were (1) inability to speak sufficient English to complete study visit tasks; (2) severe cognitive impairments; (3) patients with co-morbid medical and/or pain conditions that may potentially confound the data; (4) MRI exclusion criteria [e.g., metallic implants, claustrophobia, weight >350 lbs (limit of MRI table)]; (5) current use of opioid analgesics, which may confound pain data; (6) history of hysterectomy or oophorectomy; and (7) participants who are already in menopause, defined as the cessation of menses for 12 consecutive menses, unrelated to exogenous hormonal influences. Participants consented to the study after being screened for MRI compatibility and study eligibility by trained research staff. Six participants were excluded from the analysis due to withdrawal by self-request, positive drug screens, and equipment issues (see Figure 1).
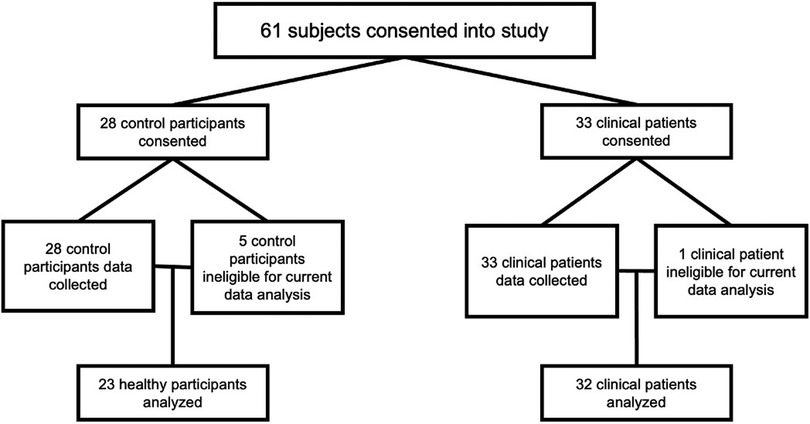
Figure 1. Participant analysis cohort breakdown. All participants are female sex assigned at birth and all clinical participants had surgically confirmed endometriosis.
Participants were female sex assigned at birth, most identified as female, with one clinical patient identifying as a transgender male and one as non-binary. Most participants identified as White (80%), with Asian being the second most prominent racial group (see Table 1). Participants were screened for birth control use and menstrual cycle history to minimize hormonal influences. All participants were either on hormonal birth control (i.e., combined birth control pill, hormonal intrauterine device (IUD), progesterone implant) or asked to come in between days 2 and 10 of their menstrual cycle, in which day 1 of the cycle was defined as the first day of their most recent period.
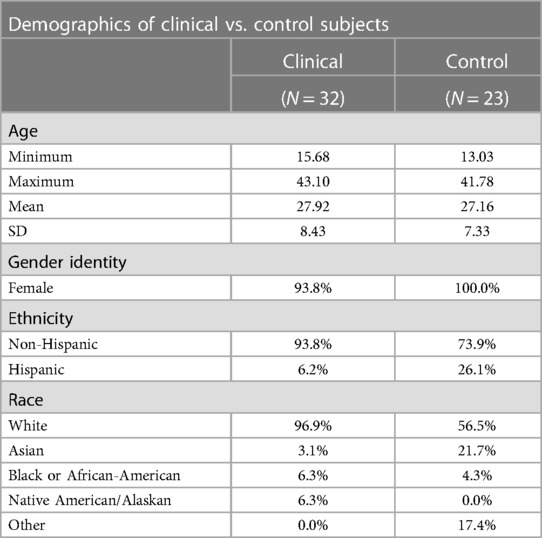
Table 1. Demographic breakdown of healthy and clinical participants.
On the day of the study, participants were asked to report their pain levels from 0 (“no pain at all”) to 10 (“worst pain imaginable”). Healthy control participants reported pain scores of 0–2 (M = 0.18, SD = 0.59), while clinical participants reported average pain scores of 0–6 (M = 1.93, SD = 1.81). Participants were given a battery of psychological questionnaires, which included select PROMIS measures (anxiety and depression) (13, 14), the Pain Catastrophizing Scale (PCS) (15, 16), and the Fear of Pain Questionnaire (FPQ) (17, 18), with pediatric or adult versions administered accordingly.
Psychological measures
Anxiety and depression measures
Anxiety
The PROMIS Anxiety 8a—Adult v1.0 (13) and Anxiety 8a—Pediatric v2.0 (14) were used to evaluate anxious symptomatology. This eight-item measure evaluates feelings of anxiety experienced within the last 7 days. Each question on the anxiety PROMIS measure includes a five-point Likert scale, ranging in value from one (Never) to five (Always). Raw scores are summed from responses, and then T-scaled to the general population. A T-score of 50 (SD = 10) represents the average score of the population. A higher PROMIS anxiety T-score represents more impaired functioning with a score of 60 or above being clinically elevated. Cronbach's alpha of the adult sample was 0.939 and for the pediatric sample was 0.953, demonstrating excellent internal item reliability in measuring anxiety and depression.
Depression
The PROMIS Depression 8a—Adult v1.0 (13) and Depression 8a—Pediatric v2.0 (14) were used to evaluate depressive symptomatology. Participants self-reported depressive feelings experienced within the last 7 days. This measure is similar in question format and scoring methodology as the PROMIS anxiety measure. A higher PROMIS depression T-score also represents more depressive symptoms with a T-score of 60 or above being clinically elevated. Cronbach's alpha for the adult sample was 0.958. Cronbach's alpha for the pediatric sample was 0.913.
Pain measures
Pain catastrophizing
The PCS (15) was used to measure pain catastrophizing, a construct assessing pain-related worry (19). It is scored on a Likert style scale from 0 (Not at all) to 4 (All the time) and is scored by summing the responses. Along with a total score, the PCS possesses three subscale scores assessing rumination, magnification, and helplessness. A total score of 30 and above represents clinically relevant catastrophizing. The Pain Catastrophizing Scale for Children (PCS-C) (16) is the pediatric version of the adult PCS. The PCS-C assesses the same symptomatology of pain catastrophizing and is well-validated in the literature for assessing pain-related rumination, magnification, and helplessness in a pediatric cohort. The Cronbach's alpha for the adult sample was 0.950. Cronbach's alpha for the pediatric sample was 0.921.
Fear of pain
The FPQ (17) measures self-reported feelings of fear of different noxious stimuli and is divided into three subscales of severe, minor, and medical pain. The questionnaire shows good internal and test–retest reliability. The Cronbach's alpha for the adult sample was 0.945. The Cronbach's alpha for the pediatric sample was 0.940. The Fear of Pain Questionnaire, child version (FOPQ-C) (18) was developed for pediatric patients and is also a five-point Likert scale (0 = “strongly disagree”; 4 = “strongly agree”) consisting of two subscales, fear of pain and avoidance of activities.
Thermal QST
The noxious thermal stimulus was administered using an fMRI-compatible Medoc TSA 2 (Medoc, Israel), with a 30 mm × 30 mm thermode. The stimulus was applied on the medial and lateral sides of their non-dominant calf. Tested temperatures ranged from 32.0°C to 48.0°C, and the temperature rate of change was 13.0°C/s. Unless a task was being run, the thermode was kept at 32.0°C. The researcher would use a non-toxic pink highlighter to mark four spaces for thermal testing: two space medial and two spaces lateral on the non-dominant calf. The researcher would switch the space used during the threshold test for each trial in a circular, clockwise pattern from where the researcher started. The space (upper versus lower medial or lateral space) was pseudorandomized per participant.
Outside of the MRI environment, in a controlled testing space, participants were instructed to rate the pain from the stimulus using the pain scale of 0 (“no pain at all”) to 10 (“the worst pain imaginable”). The temperatures of both testing environments, inside and outside the MR environment, were thermostatically controlled to be approximately 21°C. Participants were given a remote-control device connected to the Medoc that allowed them to cease temperature changes when they felt a 7 out of 10 (moderate to severe pain) pain level from the noxious stimuli. Temperature paradigms were performed online and coincident with participants rating their level of pain perception. Three trials (Trial 1, Trial 2, and Trial 3) were performed to find the participants’ individual 7 out of 10 (7/10) temperature, changing locations of the thermode on the calf in between each trial. The average 7/10 temperature was found from averaging all three trials. A thermal training paradigm was performed after finding the 7/10 temperature in preparation for further testing inside the MRI testing. All trials and averaged 7/10 temperature outside the MRI are referred to as the outside temperature thresholds.
MRI scanner protocol
Image acquisition was performed with a 3.0 T MRI (Siemens Prisma) scanner with a 64-chanel head coil. A 7 min and 02 s T1-weighted magnetization-prepared rapid acquisition gradient echo (MPRAGE), a 3 min and 07 s T2-weighted anatomical images, and a 7 min and 19 s resting-state sequence were performed (total time: 17 min and 28 s sequence). Participants were given similar verbal instruction and rated their pain with grips connected to a Nordic Neuro Lab (NNL) system that allowed participant control on an electronic visual analog scale (eVAS) from 0 to 10 (see Figure 2). When the participant reached a 7, a trained researcher stopped the thermode from changing temperature manually. The researcher holding the thermode inside the MRI briefly removed the thermode to change locations on the calf, as was performed outside. Skin was briefly wiped with a towel to remove perspiration in between each trial. Three trials were performed, and mathematical averaging was done to determine an average 7/10 temperature. These 7/10 temperatures are referred to as inside temperature thresholds. Participants were not administered blankets or sheets for the duration of the study to reduce excess overheating.
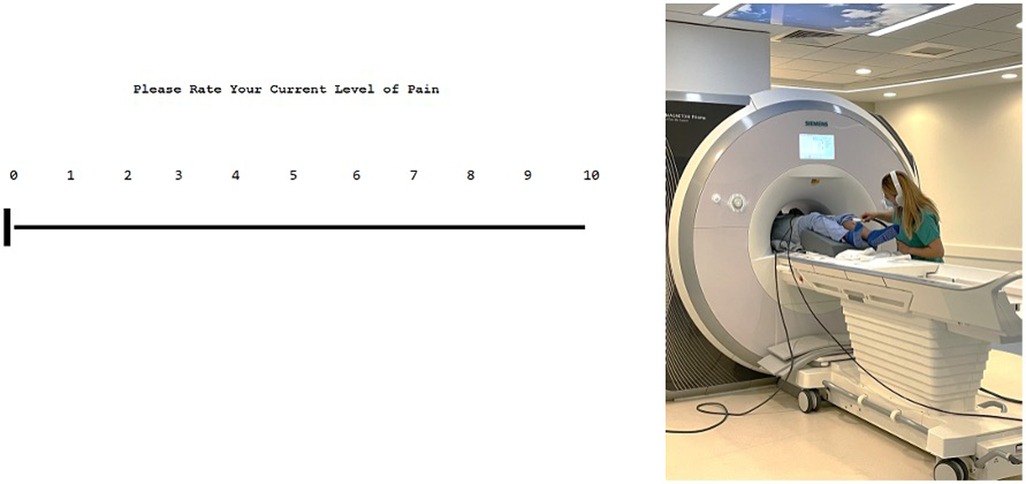
Figure 2. User interface of the eVAS (on the left) and example of inside MRI QST (on right). The interface is user-friendly and is controlled by subjects. Outside of the MRI, pain is rated via the eVAS using two keys that are marked with up and down arrows to move the slider on the scale down (less pain) and up (more pain). Inside the MRI, participants use the NNL grips to change this scale using two buttons, wherein one is to move the slider on the scale up and the other down. Participants are given instructions prior to beginning the task on proper use. This eVAS allows us to evaluate pain levels during the task. On the right, a research assistant is shown holding the thermode on the participant during the thermal QST protocol performed inside the MR environment.
Statistical analyses
Statistical analyses were performed using SPSS v. 24 (IBM, Armonk, NY, USA). Descriptive data were collected for demographics, emotional functioning, and thermal data. Shapiro–Wilk tests were used to examine normality. Fisher's exact test (chi-square test of homogeneity) was performed to examine racial breakdown proportions between cohorts. Normally distributed psychological data were compared with independent samples t-tests, while non-normally distributed data were compared via Mann–Whitney U tests. A related-samples Wilcoxon signed rank test was performed on the combined cohort data, as well as the separate clinical and control cohorts to evaluate whether there were differences between temperature threshold due to the MRI environment. We performed two-way ANOVA in order to explore an interaction effect between cohorts and MR environment. We calculated effect sizes using whole group data at 80% power and an alpha level of 0.05 to understand the effect of environment given our sample size.
Results
Control participants were aged 13–42 years (M = 27.16, SD = 7.33), while clinical participants were aged 16–42 years (M = 27.92, SD = 8.43). All participants were female sex assigned at birth. There were significant differences (p < 0.01) based on race between the control and clinical cohorts. About 97% of the clinical cohort identified as White, and 0% identified as Other; 57% of control participants identified as White, and 17.4% identified as Other (see Table 1). Both groups had similar proportions of minority populations (i.e., Black/African-American, Asian).
Anxiety T-scores of control participants ranged from 37.10 to 74.90 (M = 51.88, SD = 9.83), while T-scores of the clinical cohort ranged from 37.10 to 73.00 (M = 58.97, SD = 7.93). Depression T-scores of control participants ranged from 37.10 to 72.60 (M = 45.68, SD = 8.77), while T-scores for the clinical cohort ranged from 43.20 to 73.60 (M = 55.93, SD = 8.04). Anxiety and fear of pain scores were normally distributed (p > 0.05), but depression and pain catastrophizing were not (p < 0.05). The clinical cohort endorsed greater symptomatology relative to healthy controls in anxiety, depression, and pain catastrophizing (p < 0.005). There were no significant differences between the groups in fear of pain. Anxiety, depression, and pain catastrophizing were statistically significantly different in between chronic pain and pain-free cohorts (p < 0.01), while fear of pain was not found to be statistically significant (p = 0.56) (see Table 2).
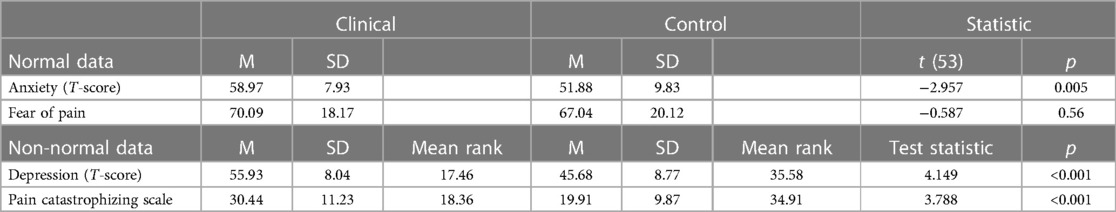
Table 2. Differences between clinical and control participants in psychological tests.
The temperatures of both testing environments were thermostatically controlled to be approximately 21°C. A paired-samples Wilcoxon signed rank test was performed on the combined (healthy and clinical) cohort data to evaluate whether there were differences in temperature threshold due to the MRI environment. This was performed for each trial and an averaged trial. Statistically significant results (p < 0.005) were found in each trial and in the average of all three trials (see Table 3). As shown in Figure 1, for the combined cohort (healthy controls and clinical participants), there was a significant increase in temperature threshold inside of the MRI scanner for each trial and averaged data (trial 1: 1.5°C, z = 3.14; trial 2: 2.4°C, z = 4.32; trial 3: 0.4°C, z = 3.11; averaged: 1.1°C, z = 4.36).
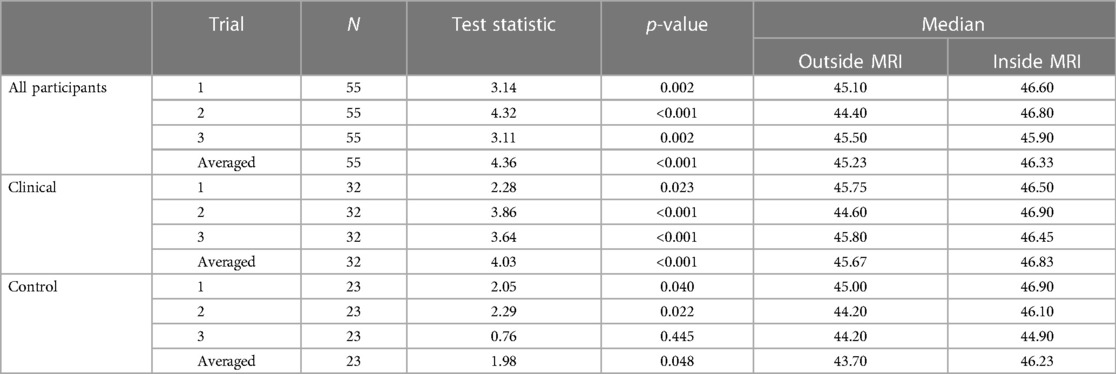
Table 3. Related-samples Wilcoxon signed rank test to compare environments.
Wilcoxon signed ranks tests were also performed within the clinical and control cohorts separately to determine if consistent differences inside and outside of the MRI were found in both cohort types. Statistically significant results were found in most trials (p < 0.05), except trial 3 of the control participants. Each trial indicated an increase [trial 1 (clinical, A): 0.75°C, trial 1 (control, B): 1.90°C; trial 2 (A): 2.30°C, trial 2 (B): 1.90°C; trial 3 (A): 0.65°C, trial 3 (B): 0.70°C; averaged (A): 1.16°C, averaged (B): 2.54°C] in the 7/10 threshold inside compared to outside of the MRI scanner (see Table 3).
To determine if there were differences in temperature thresholds between control and clinical participants, a Kruskal–Wallis H test was performed. There were no statistically significantly different 7/10 thresholds between cohort types inside of the MRI and outside of the MRI (p > .05) (see Table 4).
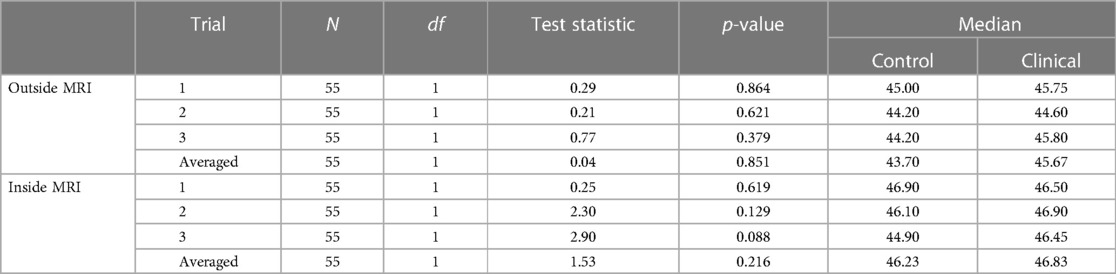
Table 4. Independent samples Kruskal–Wallis H test to compare independent cohorts.
ANOVA
We elected to perform a two-way ANOVA to explore an interaction effect between cohorts and MR environment. There was no significant interaction between the environment and cohort for temperature threshold using averaged trial data (see Table 5 and Supplementary Table 1). There was no significant difference in temperature threshold between cohorts, F(1,106) = 0.732, p = 0.039, partial η2 = 0.007. The marginal means for control and clinical participants were 44.95 ± 0.36 and 45.35 ± 0.31, respectively, with a non-significant mean difference of −0.404 (95% CI, −1.34 to 0.53). There was a significant difference in environment, F(1,106) = 4.17, p < 0.05, partial η2 = 0.04, that being inside of the MRI was associated with a mean temperature threshold increase of 0.96 (95% CI, 0.28–1.90), with unweighted marginal means for outside and inside of the MRI being 44.67 ± 0.334 and 45.63 ± 0.33, respectively. Within the combined cohort, nine individuals were higher outside the MR environment, 44 inside the MR environment, and two reached the maximum temperature threshold in both environments (Figure 3).
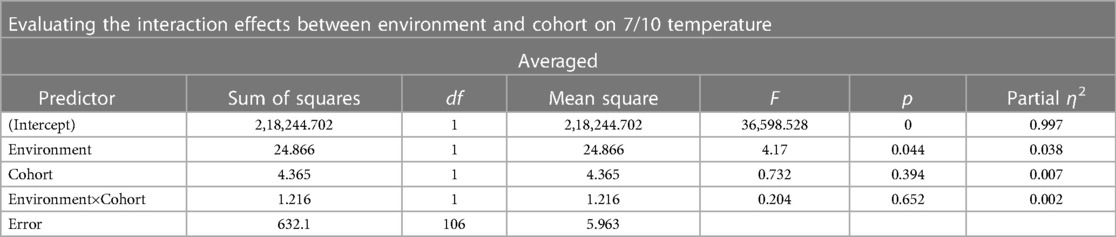
Table 5. Results of a two-way ANOVA evaluating the interaction effects between environment and cohort on 7/10 threshold during an averaged trial.
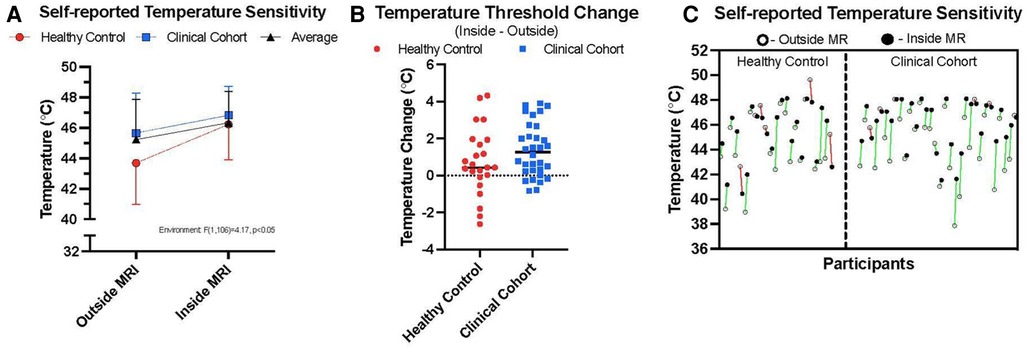
Figure 3. Thermal sensitivity. (A) outlines the average temperatures taken from median scores at which participants reported their 7/10 thermal sensitivity in the two environments, inside and outside of the MRI room. Healthy control data are presented alongside persons with chronic pain (clinical cohort) and averaged data across the two cohorts. (B) highlights the relative change between environments on an individual basis taking the difference between individual 7/10 thresholds between environments and a horizontal line plotting the median value for each cohort. (C) shows individual data points showing the relative change in thermal sensitivity ratings between the two environments for both cohorts (green = higher temperature sensitivities inside, relative to outside MR environment; red = lower temperature sensitivities inside, relative to outside the MR environment).
Discussion
A reliable change in thermal pain sensitivity was experienced by participants based on the testing environment. The ability of QST to inform patient diagnostics and delineate central mechanisms of pain perception and chronicity is contingent upon the accurate application of thermal stimuli. To date, QST has largely been performed in clinical or research settings outside of the MR environment (20); however, the application of QST in the MR environment is an emerging application of the technology. The MR scanner represents an ideal environment for studying neurocognitive processes with unique psychological stressors (e.g., claustrophobia), novel stimuli, and attributes of the physics of the MR environment itself. The findings from this investigation outline a reliable change in thermal sensitivity that was experienced when both healthy and clinical participants completed a QST thermal sensitivity protocol inside and outside of the MR scanning environment.
The MR environment can present as stressful to participants, which can be exacerbated in people with underlying anxiety. Therefore, we explored two behavioral based interpretations of the findings. First, it is possible that the findings observed in the current investigation reflect active or exacerbated psychological symptoms. Participants in this investigation are actively screened for any history of claustrophobia and psychological co-morbidities that would require clinical intervention, as the condensed volume of the MR bore can induce feelings of anxiety (21) and other undesirable psychological symptoms (22, 23). In our investigation, our healthy control cohort reported relatively normal anxiety levels, with only three individuals reporting levels higher than mild. Similar findings were observed for clinical depression (see Table 2). Notably, our clinical cohort endorsed more symptoms of anxiety, depression, and pain catastrophizing compared to the healthy controls, demonstrating the impact of chronic pain on psychological wellbeing (24). This finding is aligned with previous literature, in which anxiety and depression are observed in populations with chronic pain (25–28). Moreover, previous literature has identified pain catastrophizing as a psychiatric measure associated with lower thermal tolerance (29), as well as increased pain sensitization (30). Despite these differences, we observed similar thermal sensitivity changes between cohorts (approximately 1.1°C; see Table 3). We also performed a correlation analysis between the psychological measures and the temperature thresholds inside and outside of the MRI to observe whether psychological backgrounds are associated with differences in temperature threshold. No statistically significant results were found (see Supplementary Table 6). However, we recommend that extra vigilance be taken with individuals who report elevated psychological symptoms to ensure patient comfort.
Second, observed findings may be due to practice-related effects, as all participants received outside thermal sensitivity testing prior to being tested in the MR environment. Contradicting this hypothesis are observations that practice effects (on the order applied in our investigation) may increase thermal sensitivity (31). That is, practice may decrease the temperature at which a person identifies a 7/10 pain threshold. Indeed, we saw trends in the data to suggest this was present on a trial-to-trial basis (decreased temperatures required to produce a 7/10) in this study (see Healthy Controls, Table 3); however, the change in environment was associated with a decrease in thermal sensitivity (higher temperatures required to produce a 7/10). Given that the MR environment is cooled, it would be expected that a person would require a lower temperature to induce a 7/10 as they accommodate to the environment—the reverse was observed. We note that a circulating, randomized, pattern of testing was performed to ensure that the exact same testing site was not used (see Materials and methods). As such, we suggest that the findings observed in this investigation likely do not pertain to the psychological nature of the MR scanning environment.
The MR environment has specific physics-based attributes that are known to impact the human body. As these have been known to produce thermal differences in human tissues, we explore their possible role in our findings. Radio-frequency pulses, used to produce the different imaging sequences, have established heating impacts (32, 33), leading to specific absorption rate (SAR) cut-offs established for scanning of human participants. SAR may cause heating in body tissues (34) as well as increases in skin temperature (35). These typically depend on the strength of the MR scanner (e.g., 3 vs. 7 T) and the length of the scanning sequence performed (36). As it pertains to this investigation, there was approximately a 30 min (anatomical scanning time + time of setup) delay between the testing of the two environments (see Supplementary MRI information). That is, between recording temperature sensitivity data outside of the scanner and reaching the point of the imaging paradigm inside the scanner, there were three different scanning sequences performed including an MPRAGE (7 min; 02 s), T2 (3 min; 07 s), and resting-state blood oxygenation level dependent (BOLD) echo planar imaging (EPI) (7 min; 19 s) scan. This exposure to different magnetic field environments could, in theory, produce warming of the human body. This would be notable in the context of changes in baseline operating of c-fiber pathways (37), the nerve fibers responsible for sending thermal nociceptive volleys throughout the nervous system to produce the perception of pain. Notably, prior work has shown that c-fiber pathways may act in response to changes in thermal stimuli, rather than to absolute temperature levels (31), suggesting that the local neuro-environment where recordings were made were unique in the two environmental conditions. As noted, we randomized the recording site between trials, so observations were most likely not the product of repeated administration of thermal stimuli from the MEDOC device in the same position, but the product of a more diffuse heating that modified the perception of the test stimulus across the multiple testing sites. We suggest that the impact of MR-based protocols on our participants may have impacted the mechanisms underlying pain perception.
An exploratory analysis was performed in which the main cohort was divided into a younger half (n = 27) and older half (n = 28). Most trials (2, 3, and averaged) showed statistically significant differences (p < 0.05) in 7/10 threshold temperature from inside and outside of the MRI scanner. The impact of the scanner environment was also explored after dividing the control and clinical cohorts into younger and older halves to identify age differences based on clinical cohort designation. No control cohorts showed statistically significant differences inside and outside of the MRI scanner when divided into younger and older halves (p > 0.05). However, clinical cohorts showed statistically significant differences inside and outside the MRI scanner for nearly all trials (except the older clinical cohort in trial 1). These follow-up analyses suggest that age did not impact current environment findings. At the overall cohort level, we continued to observe a 1°C difference between environments.
The presented findings have important implications for MR scanning in cognitive neuroscience. First, the issue of patient safety must be considered, particularly in the context of pediatric and special populations who cannot effectively communicate the presence or extent of pain. For these populations, there may be limited capacity to perform within-scanner thermal sensitivity testing based on abilities to understand instructions or behavioral limitations. These scenarios may present risk by applying thermal stimuli that is not proportionate to elicit an intended response. A significant risk factor for QST investigation is the possibility of thermal burns, which can be produced if the thermode is applied for too long, or at too high of a temperature. Given that findings from the current investigation reflect more thermal energy being needed to invoke the same level of pain stimulus as outside the scanner, there should be an abundance of caution as to how this metric is computed prior to application of noxious stimuli in the MR environment. Moreover, such stimuli need to be adjusted for application outside of the MRI if a person's 7/10 is only recorded inside of the MRI. Exposure to a within-scanner 7/10 is likely to exceed safety levels when performed outside of the MRI. Second, the use of QST for thermal sensitivity testing has important diagnostic and prognostic purposes and must be applied using strict criteria. Given that prior work on QST has noted standard deviations of patient reporting on the order of 1°–2° (38), we feel that a 1° change in thermal sensitivity is significant. With this degree of change, it is possible that a person's 7/10 threshold or their maximum pain intensity may be missed or over expressed in current and/or future protocols. This has translational effects for subsequent analyses on the validity and reliability of brain function and structure observations that demand application of procedures validated outside of the scanner. Future research should integrate findings from this investigation either to introduce a correction factor or perform similar test–retest data to understand the impact of MR environment on their study findings. Third, and most broadly, observed changes in thermal sensitivity reflect a change in pain perception to the applied nociceptive stimulus (temperature). If the observed changes are a direct result of the scanning environment, the implications of findings extend beyond the pain sciences. That is, research into specific faculties such as executive function and memory are not independent of perception and should consider, alongside the findings of their own investigations, the physical impacts of the MR environment. This is especially notable given the desire to increase resolution with higher field MR environments.
The current investigation has important limitations. First, the study population was solely represented by participants who were biologically women at birth. Although we have no reason to suggest the presence of this finding would be absent in men, the strength of its effect or characteristics may differ. Second, our study cohort was of moderate size. To our knowledge, we are the first to investigate the impact of scanner environment on temperature sensitivity, so we were unable to calculate proposed effect sizes. However, we demonstrated our findings in two independent cohorts (overall group effect size of 0.47—see Material and methods), one of which presented with a chronic condition that included elevated levels of anxiety and depression. As shown in prior research (39), there is significant inter-subject variability in QST ratings. This should be kept in mind when interpreting study findings considering our smaller cohorts; however, having intra-subject data between the two environments will help increase reliability in findings. Our clinical cohort was disproportionally represented by persons identifying as White, which reflects a current disparity in access to medical care for minority populations (40). Finally, this investigation was performed under specific scanner sequence protocols using a 3 T Siemens MR scanner. If study findings were due to the physical environment of the scanner, then any changes to these, perhaps by including a higher SAR scan (e.g., diffusion-weighted vs. MPRAGE), may modify study findings. It will be of high interest to evaluate this process in future research and ultimately control or correct for its impact on study findings.
In conclusion, this investigation found a significant and reliable change in thermal sensitivity based on the MR scanning environment. We point out these findings to be significant as they pertain to patient safety, the evaluation and diagnosis of pain patients, and the evaluation of broader cognitive neuroscience research questions that are impacted by a patient's perception in the MR environment. Our answers to questions involving basic science and disease mechanisms are dependent on the proper application of quantitative sensory testing in the MR environment.
Data availability statement
The raw data supporting the conclusions of this article will be made available by the authors, without undue reservation.
Ethics statement
The studies involving humans were approved by Institutional Review Board—Boston Children's Hospital. The studies were conducted in accordance with the local legislation and institutional requirements. Written informed consent for participation in this study was provided by the participants’ legal guardians/next of kin.
Author contributions
Study conception and design: SH, CS, and AK. Data collection: AK, GC, ES, and CL. Analysis and interpretation of results: AK, SH, and DZ. Draft manuscript preparation: AK and SH. All authors contributed to the article and approved the submitted version.
Funding
Research reported in this publication was supported by the U.S. Army Medical Research and Development Command under award W81XWH-19-1-0561. Research reported in this publication was also supported by the Office of the Director, National Institutes of Health of the National Institutes of Health under Award Number S10OD025111. The content is solely the responsibility of the authors and does not necessarily represent the official views of the National Institutes of Health.
Conflict of interest
The authors declare that the research was conducted in the absence of any commercial or financial relationships that could be construed as a potential conflict of interest.
Publisher's note
All claims expressed in this article are solely those of the authors and do not necessarily represent those of their affiliated organizations, or those of the publisher, the editors and the reviewers. Any product that may be evaluated in this article, or claim that may be made by its manufacturer, is not guaranteed or endorsed by the publisher.
Supplementary material
The Supplementary Material for this article can be found online at: https://www.frontiersin.org/articles/10.3389/fpain.2023.1223239/full#supplementary-material
References
1. Huber C, Goertler M, Abert C, Bruckner F, Groenefeld M, Teliban I, et al. Additive manufactured and topology optimized passive shimming elements for permanent magnetic systems. Sci Rep. (2018) 8:14651. doi: 10.1038/s41598-018-33059-w
2. Dewey M, Schink T, Dewey CF. Frequency of referral of patients with safety-related contraindications to magnetic resonance imaging. Eur J Radiol. (2007) 63:124–7. doi: 10.1016/j.ejrad.2007.01.025
3. Harris LM, Cumming SR, Menzies RG. Predicting anxiety in magnetic resonance imaging scans. Int J Behav Med. (2004) 11:1–7. doi: 10.1207/s15327558ijbm1101_1
4. Bencsik M, Bowtell R, Bowley R. Electric fields induced in the human body by time-varying magnetic field gradients in MRI: numerical calculations and correlation analysis. Phys Med Biol. (2007) 52:2337–53. doi: 10.1088/0031-9155/52/9/001
5. Krumova EK, Geber C, Westermann A, Maier C. Neuropathic pain: is quantitative sensory testing helpful? Curr Diab Rep. (2012) 12:393–402. doi: 10.1007/s11892-012-0282-7
6. Boivie J. Central pain and the role of quantitative sensory testing (QST) in research and diagnosis. Eur J Pain. (2003) 7:339–43. doi: 10.1016/S1090-3801(03)00046-6
7. Curatolo M. Diagnosis of altered central pain processing. Spine. (2011) 36:S200–4. doi: 10.1097/BRS.0b013e3182387f3d
8. Zohsel K, Hohmeister J, Oelkers-Ax R, Flor H, Hermann C. Quantitative sensory testing in children with migraine: preliminary evidence for enhanced sensitivity to painful stimuli especially in girls. Pain. (2006) 123:10–8. doi: 10.1016/j.pain.2005.12.015
9. Nothnagel H, Puta C, Lehmann T, Baumbach P, Menard MB, Gabriel B, et al. How stable are quantitative sensory testing measurements over time? Report on 10-week reliability and agreement of results in healthy volunteers. J Pain Res. (2017) 10:2067–78. doi: 10.2147/JPR.S137391
10. van Helmond N, Aarts HM, Timmerman H, Olesen SS, Drewes AM, Wilder-Smith OH, et al. Is preoperative quantitative sensory testing related to persistent postsurgical pain? A systematic literature review. Anesth Analg. (2020) 131:1146–55. doi: 10.1213/ANE.0000000000004871
11. Paredes AC, Pinto JM, Almeida A, Pinto PR. Predictive value of quantitative sensory testing for acute and chronic postsurgical pain after total joint arthroplasty: a systematic review. Pain. (2022) 163:e385–400. doi: 10.1097/j.pain.0000000000002385
12. Giudice LC, Kao LC. Endometriosis. Lancet. (2004) 364:1789–99. doi: 10.1016/S0140-6736(04)17403-5
13. DeWalt DA, Rothrock N, Yount S, Stone AA. Evaluation of item candidates. Med Care. (2007) 45:S12–21. doi: 10.1097/01.mlr.0000254567.79743.e2
14. Kashikar-Zuck S, Carle A, Barnett K, Goldschneider KR, Sherry DD, Mara CA, et al. Longitudinal evaluation of patient-reported outcomes measurement information systems measures in pediatric chronic pain. Pain. (2016) 157:339–47. doi: 10.1097/j.pain.0000000000000378
15. Sullivan MJL, Bishop SR, Pivik J. The pain catastrophizing scale: development and validation. Psychol Assess. (1995) 7:524–32. doi: 10.1037/1040-3590.7.4.524
16. Crombez G, Bijttebier P, Eccleston C, Mascagni T, Mertens G, Goubert L, et al. The child version of the pain catastrophizing scale (PCS-C): a preliminary validation. Pain. (2003) 104:639–46. doi: 10.1016/S0304-3959(03)00121-0
17. McNeil DW, Rainwater AJ. Development of the fear of pain questionnaire—III. J Behav Med. (1998) 21:389–410. doi: 10.1023/A:1018782831217
18. Simons LE, Sieberg CB, Carpino E, Logan D, Berde C. The fear of pain questionnaire (FOPQ): assessment of pain-related fear among children and adolescents with chronic pain. J Pain. (2011) 12:677–86. doi: 10.1016/j.jpain.2010.12.008
19. Quartana PJ, Campbell CM, Edwards RR. Pain catastrophizing: a critical review. Expert Rev Neurother. (2009) 9:745–58. doi: 10.1586/ern.09.34
20. Weaver KR, Griffioen MA, Klinedinst JN, Galik E, Duarte AC, Colloca L, et al. Quantitative sensory testing across chronic pain conditions and use in special populations. Front Pain Res. (2022) 2:1–9. doi: 10.3389/fpain.2021.779068
21. Katz RC, Wilson L, Frazer N. Anxiety and its determinants in patients undergoing magnetic resonance imaging. J Behav Ther Exp Psychiatry. (1994) 25:131–4. doi: 10.1016/0005-7916(94)90005-1
22. Hutton J, Walker LG, Gilbert FJ, Evans DG, Eeles R, Kwan-Lim GE, et al. Psychological impact and acceptability of magnetic resonance imaging and x-ray mammography: the MARIBS study. Br J Cancer. (2011) 104:578–86. doi: 10.1038/bjc.2011.1
23. Dziuda Ł, Zieliński P, Baran P, Krej M, Kopka L. A study of the relationship between the level of anxiety declared by MRI patients in the STAI questionnaire and their respiratory rate acquired by a fibre-optic sensor system. Sci Rep. (2019) 9:4341. doi: 10.1038/s41598-019-40737-w
24. Vadivelu N, Kai AM, Kodumudi G, Babayan K, Fontes M, Burg MM, et al. Pain and psychology—a reciprocal relationship. Ochsner J. (2017) 17:173–80. 28638291.28638291
25. Nicholas MK, Coulston CM, Asghari A, Malhi GS. Depressive symptoms in patients with chronic pain. Med J Aust. (2009) 190:S66–70. doi: 10.5694/j.1326-5377.2009.tb02473.x
26. Polatin PB, Kinney RK, Gatchel RJ, Lillo E, Mayer TG. Psychiatric illness and chronic low-back pain. The mind and the spine—which goes first? Spine. (1993) 18:66–71. doi: 10.1097/00007632-199301000-00011
27. Ohayon MM, Schatzberg AF. Using chronic pain to predict depressive morbidity in the general population. Arch Gen Psychiatry. (2003) 60:39. doi: 10.1001/archpsyc.60.1.39
28. Rhudy JL, Meagher MW. Fear and anxiety: divergent effects on human pain thresholds. Pain. (2000) 84:65–75. doi: 10.1016/S0304-3959(99)00183-9
29. Grundström H, Larsson B, Arendt-Nielsen L, Gerdle B, Kjølhede P. Pain catastrophizing is associated with pain thresholds for heat, cold and pressure in women with chronic pelvic pain. Scand J Pain. (2020) 20:635–46. doi: 10.1515/sjpain-2020-0015
30. Meints SM, Mawla I, Napadow V, Kong J, Gerber J, Chan S, et al. The relationship between catastrophizing and altered pain sensitivity in patients with chronic low-back pain. Pain. (2019) 160:833–43. doi: 10.1097/j.pain.0000000000001461
31. Churyukanov M, Plaghki L, Legrain V, Mouraux A. Thermal detection thresholds of Aδ- and C-fibre afferents activated by brief CO2 laser pulses applied onto the human hairy skin. PLoS One. (2012) 7:e35817. doi: 10.1371/journal.pone.0035817
32. Deniz CM, Vaidya MV, Sodickson DK, Lattanzi R. Radiofrequency energy deposition and radiofrequency power requirements in parallel transmission with increasing distance from the coil to the sample. Magn Reson Med. (2016) 75:423–32. doi: 10.1002/mrm.25646
33. Altemimi A, Aziz SN, Al-Hilphy ARS, Lakhssassi N, Watson DG, Ibrahim SA Critical review of radio-frequency (RF) heating applications in food processing. Food Qual Saf. (2019) 3:81–91. doi: 10.1093/fqsafe/fyz002
34. Schaefer DJ. Safety aspects of radiofrequency power deposition in magnetic resonance. Magn Reson Imaging Clin N Am. (1998) 6:775–89. doi: 10.1016/S1064-9689(21)00481-5
35. Boss A, Graf H, Berger A, Lauer UA, Wojtczyk H, Claussen CD, et al. Tissue warming and regulatory responses induced by radio frequency energy deposition on a whole-body 3-tesla magnetic resonance imager. J Magn Reson Imaging. (2007) 26:1334–9. doi: 10.1002/jmri.21156
36. Allison J, Yanasak N. What MRI sequences produce the highest specific absorption rate (SAR), and is there something we should be doing to reduce the SAR during standard examinations? Am J Roentgenol. (2015) 205:W140. doi: 10.2214/AJR.14.14173
37. Campero M, Baumann TK, Bostock H, Ochoa JL. Human cutaneous C fibres activated by cooling, heating and menthol. J Physiol. (2009) 587:5633–52. doi: 10.1113/jphysiol.2009.176040
38. Magerl W, Krumova EK, Baron R, Tölle T, Treede R, Maier C Reference data for quantitative sensory testing (QST): refined stratification for age and a novel method for statistical comparison of group data. Pain. (2010) 151:598–605. doi: 10.1016/j.pain.2010.07.026
39. Redmond J, Cros D, Shahani BT. Variability of quantiative sensory testing: implications for clinical practice. Henry Ford Hosp Med J. (1990) 38:62–7.2228715
Keywords: magnetic resonance imaging, thermal sensitivity, MR safety, quantitative sensory testing, pain
Citation: Kim A(J), Szabo E, Lunde CE, Comptdaer G, Zurakowski D, Sieberg CB and Holmes SA (2023) Quantitative sensory testing in a magnetic resonance environment: considerations for thermal sensitivity and patient safety. Front. Pain Res. 4:1223239. doi: 10.3389/fpain.2023.1223239
Received: 15 May 2023; Accepted: 21 August 2023;
Published: 12 September 2023.
Edited by:
Gan Huang, Shenzhen University, ChinaReviewed by:
Rushi Zou, Shenzhen University, ChinaPascal Tetreault, Université de Sherbrooke, Canada
© 2023 Kim, Szabo, Lunde, Comptdaer, Zurakowski, Sieberg and Holmes. This is an open-access article distributed under the terms of the Creative Commons Attribution License (CC BY). The use, distribution or reproduction in other forums is permitted, provided the original author(s) and the copyright owner(s) are credited and that the original publication in this journal is cited, in accordance with accepted academic practice. No use, distribution or reproduction is permitted which does not comply with these terms.
*Correspondence: Scott A. Holmes Scott.Holmes@childrens.harvard.edu