 Tao Thi Tran1Jeonghee Lee2Madhawa Gunathilake2Junetae Kim1Sun-Young Kim1
 Hyunsoon Cho1
 Jeongseon Kim2*
- 1Department of Cancer Control and Population Health, Graduate School of Cancer Science and Policy, Goyang-si, Gyeonggi-do, Republic of Korea
- 2Department of Cancer Biomedical Science, Graduate School of Cancer Science and Policy, Goyang-si, Gyeonggi-do, Republic of Korea
Background: Little is known about applying machine learning (ML) techniques to identify the important variables contributing to the occurrence of gastrointestinal (GI) cancer in epidemiological studies. We aimed to compare different ML models to a Cox proportional hazards (CPH) model regarding their ability to predict the risk of GI cancer based on metabolic syndrome (MetS) and its components.
Methods: A total of 41,837 participants were included in a prospective cohort study. Incident cancer cases were identified by following up with participants until December 2019. We used CPH, random survival forest (RSF), survival trees (ST), gradient boosting (GB), survival support vector machine (SSVM), and extra survival trees (EST) models to explore the impact of MetS on GI cancer prediction. We used the C-index and integrated Brier score (IBS) to compare the models.
Results: In all, 540 incident GI cancer cases were identified. The GB and SSVM models exhibited comparable performance to the CPH model concerning the C-index (0.725). We also recorded a similar IBS for all models (0.017). Fasting glucose and waist circumference were considered important predictors.
Conclusions: Our study found comparably good performance concerning the C-index for the ML models and CPH model. This finding suggests that ML models may be considered another method for survival analysis when the CPH model’s conditions are not satisfied.
Introduction
Gastrointestinal (GI) cancer refers to cancers affecting the digestive system. Gastric cancer, colorectal cancer, liver cancer, esophageal cancer, and pancreatic cancer are recognized as common GI cancers (1). According to an estimate in 2018, GI cancer accounted for 26% of new cancer cases and 35% of deaths related to cancer worldwide (1). The trend of GI cancers varies geographically by specific types; for instance, the highest rates of liver cancer, esophageal cancer, and gastric cancer are found in Asia (2). Although the trend has been upwards for colorectal and pancreatic cancer, the remaining cancers have experienced a downwards trend since 1999; GI cancer remains one of the most common cancers in Korea (3).
Although risk factors for specific types of GI cancer vary, lifestyle-related factors contribute significantly to the development of GI cancer (2). Specifically, a Western lifestyle has been documented to be associated with a higher prevalence of GI cancer (2). Notably, metabolic syndrome (MetS), which has been reported to be a global epidemic, might be considered an important mediator of the effect of a Western lifestyle on GI cancer development (2). MetS has been described as a group of conditions including obesity, hypertension, high blood sugar, and dyslipidemia (4). Currently, there are three definitions used for MetS diagnosis, namely, the WHO 1999, the National Cholesterol Education Program (NCEP) Adult Treatment Panel III (ATP III) 2005, and the International Diabetes Federation 2006 definitions. Although MetS definitions are modified by health care organizations for different regions, MetS remains a significant and alarming global public health problem (5).
Existing evidence from epidemiological studies has revealed that MetS may be an etiologic factor for GI cancer development. For example, a previous study of large-scale molecular data for 366,016 participants reported a potential link between MetS and an elevated risk of GI cancer regardless of the MetS definition used (6). Similarly, an increased risk of colorectal cancer, liver cancer, and gastric cancer was found in participants with MetS in other cohort studies (7–11). Notably, Cox proportional hazards (CPH) model was used in these studies; a CPH model is a linear regression with good interpretability (12). CPH model is known to be a semiparametric method in which survival times are assumed in relation to predictor variables in a particular way and proportional hazards (13).
To date, attention has been drawn to the application of machine learning (ML) to cancer prediction. In particular, the application of ML in survival analysis has been indicated in recent years (14, 15). However, the value of ML models compared to CPH model is ambiguous due to inconsistent results in previous studies (15–18). For example, an ML model outperformed a CPH model in predicting breast cancer survival in a previous study (16). In contrast, a comparably good performance was observed to predict survival in patients with oral and pharyngeal cancer in another study (17). Thus, the value of ML approaches compared to CPH model in survival analysis is still debatable.
To our knowledge, little is known about the application of ML techniques in epidemiological studies to identify important predictors affecting GI cancer development. In addition, no study has compared the accuracy of ML and CPH models for predicting GI cancer. Therefore, our study aimed to examine whether MetS and its components are related to GI cancer prediction and whether ML models outperform a CPH model in predicting GI cancer based on MetS and other confounders.
Methods
Study population
The Cancer Screenee Cohort Study was established in 2002 to explore the association of risk factors with cancer development in South Korea. The information of this cohort has been described (19). In brief, we recruited 41,837 participants aged 16 and older who visited the Center for Cancer Prevention and Detection at the National Cancer Center in South Korea for health examinations between August 2002 and December 2014. We required participants to complete baseline questionnaires and identified incident cancer cases by following up with participants until December 2019. Our final analysis included 24,139 participants after exclusion of 1,754 participants with incomplete questionnaires, 2,100 participants with a diagnosis of any cancer before recruitment, 6 participants aged <20 years, and 13,122 participants who lacked information on individual characteristics (Figure 1). We obtained written informed consent from all participants and approval for the study protocol from the institutional review board of the National Cancer Center (No. NCCNCS-07-077).
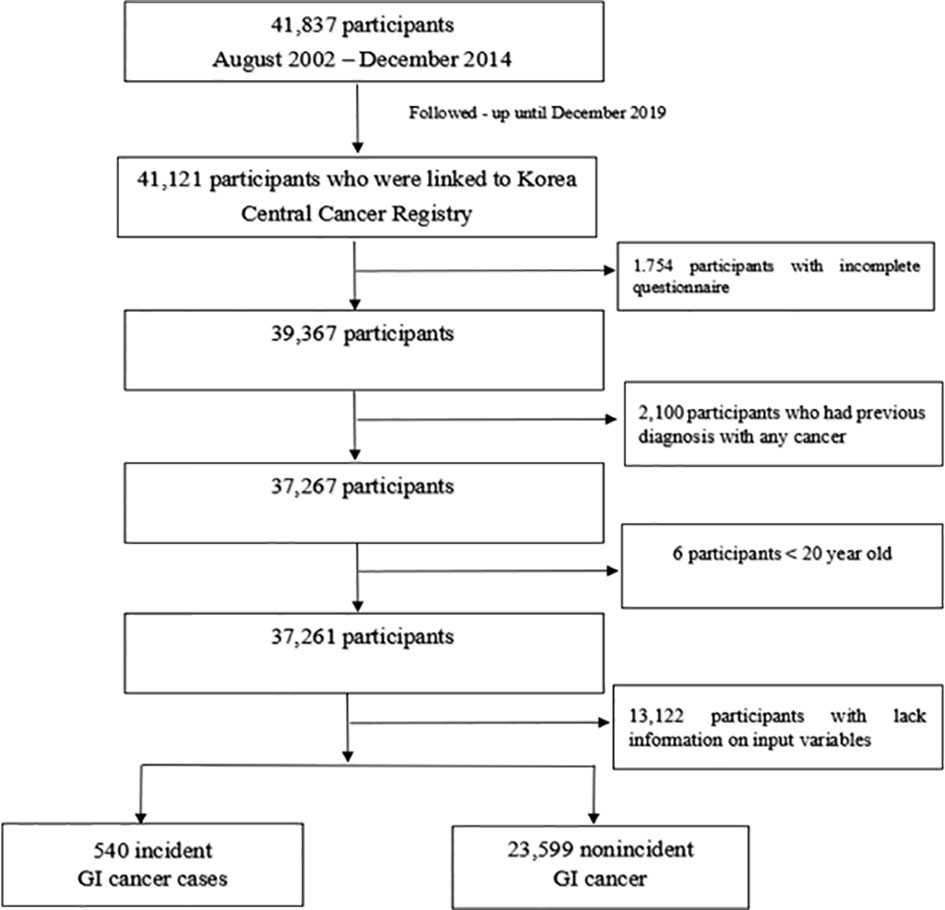
Figure 1 Flow chart of the study participants. Among 41,837 participants recruited, 41,121 participants were linked to the Korea Central Cancer Registry. Our final analysis included 24,139 participants after exclusion of 1,754 participants with incomplete questionnaires, 2,100 participants with a diagnosis of any cancer before recruitment, 6 participants aged <20 years, and 13,122 participants who lacked information on individual characteristics.
Outcome and predictor measurement
Potential incident GI cancer cases were obtained by linking to the 2019 Korea National Cancer Incidence Database of the Korea Central Cancer Registry. We used the following International Classification of Diseases, 10th Revision codes to identify common incident GI cancers: gastric cancer (C16), colorectal cancer (C18-C20), liver cancer (C22), esophageal cancer (C15), gallbladder cancer (C23), and pancreatic cancer (C25). We identified 540 incident GI cancer cases, namely, 242 (44.8%) incident cases of gastric cancer, 123 (22.8%) incident cases of colorectal cancer, 102 (18.9%) incident cases of liver cancer, 41 (7.6%) incident cases of pancreatic cancer, 16 (3.0%) incident cases of gallbladder cancer, and 16 (3.0%) incident cases of esophageal cancer.
Currently, the MetS definition in Korea is based on the criteria of the ATP III of the NCEP and specific values of waist circumference from the World Health Organization and the Korean Society for the Study of Obesity. MetS was identified among those who met 3 or more of the following criteria (20):
1. Waist circumference: males ≥ 90 cm and females ≥85 cm
2. Blood pressure: ≥130/85 mmHg
3. Triglycerides: ≥150 mg/dL
4. High-density lipoprotein cholesterol (HDL cholesterol): males <40 mg/dL and females <50 mg/dL
5. Fasting glucose: ≥100 mg/dL or a history of diabetes.
We collected venous blood samples from participants at baseline after they had fasted for 8 hours to determine the blood-related components of MetS. Height (m) and weight (kg) were measured with InBody 3.0 (Biospace, Seoul, Korea) or automatic height and weight measurements (DS-102, Dong Shin Jenix Co., Ltd., Seoul, Korea). The measurement of waist circumference was performed with a tape measure 1 cm above the umbilicus with minimal respiration. A chemistry analyzer (TBA-200FR, Toshiba, Tokyo, Japan) was used to measure fasting glucose, triglyceride, and HDL cholesterol levels. Blood pressure was measured by trained personnel with an automatic blood pressure monitor (FT-200S, Jawon Medical, Kyungsan, Korea) after the patients had 15 minutes of rest (21). In addition, a self-administered questionnaire regarding information on baseline characteristics was completed by participants.
Predictors of GI cancer incidence in our study included MetS and its individual components (waist circumference, HDL, triglycerides, blood pressure, and fasting glucose). In addition, sociodemographic variables included age, sex, educational level (high school graduate or less and college or higher), marital status (married or cohabitating and others), monthly income (10,000 Korean won/month) (<200, 200-400, and >400), and first-degree family history of cancer (yes, no). Lifestyle factors included smoking status (nonsmoker, ex-smoker and current-smoker), alcohol consumption (nondrinker, former drinker and current-drinker), and physical activity (yes, no). These sociodemographic and lifestyle characteristics may be confounders for the association between MetS and GI cancer (6).
Models and evaluation
We used a CPH model and ML survival models, including random survival forest (RSF), survival trees (ST), gradient boosting (GB), survival support vector machine (SSVM), and extra survival trees (EST), to predict GI cancer. The ability of these ML models to predict an outcome in right-censored time-to-event data has been documented in the literature as follows:
Random forest is an ML model that is most frequently used to solve problems in relation to classification and regression by constructing ensembles from decision trees and combining results to give a final decision. RSF extends random forest to censored lifetime data (22).
ST is another forest approach that has been widely used to handle time-to-event data. The implementation of ST is as follows: data partitioning is performed based on a criterion for splitting, and objects with similar events are grouped as the same node. (23).
Similar to RSF, the GB model is an ensemble model that combines the predictions of multiple base learners to improve the prediction of the overall model. However, RSF averages predictions from independent trees to obtain the overall prediction, while the GB model is additive (24).
Support vector machine aims to find a hyperplane to maximize the margin between classes. SSVM is an extension of the support vector machine to handle time-to-event data (16).
The EST model is a slightly different version of RSF (25). In comparison with RSF, the splitting criteria of EST are more random (26).
We used the following two evaluation metrics, which have been widely used in survival analyses in the literature, to compare the performance of the regression models (15, 22, 23, 26). The concordance index (C-index) is a rank order statistic for predictions against true outcomes and is defined as the ratio of the concordant pairs to the total comparable pairs (23); the closer the C-index is to 1, the better the model performs (15, 26). The integrated Brier score (IBS) reflects calibration over all time points, with a smaller value indicating greater accuracy (22). Furthermore, we evaluated the models based on the time-dependent area under the curve (AUC).
Statistical analysis
We calculated person-years from baseline to the date of cancer diagnosis, death, or end of follow-up (December 31, 2019), whichever came first. We used chi-square tests and Wilcoxon rank-sum tests to compare the baseline characteristics between the incident GI cancer cases and nonincident GI cancer.
There were several steps for model development. First, we used an 80:20 ratio to randomly split the data into training and testing datasets. The purposes of the training and testing datasets were to fit the model and evaluate the final model, respectively. Second, a grid search was utilized to search hyperparameters for C-index maximization with 10-fold cross validation. We found the following optimal hyperparameters: n_estimators=400, max_depth=4 for RSF, max_depth=4 for ST, learning_rate=1 and max_depth=1 for GB, alpha=0.0002 for SSVM, and n_estimators=500, max_depth=4 for EST. Third, we fit the models using the training dataset based on selected input variables, the optimal hyperparameters, and default values of other hyperparameters. Fourth, the testing dataset was used to evaluate and compare model performance. Then, the ELI5 package was used to explore the contribution of predictors to the models, which calculates important variables based on the permutation important method by identifying the weight of variables (26). We used bootstrapping and 10-fold cross validation to assess the robustness of the models.
Furthermore, we used the CPH model to explore the specific associations of MetS and its components with incident GI cancer after adjusting for the aforementioned confounding factors. We performed statistical analyses by using Python software (version 3.7.9) with the scikit-survival library (26) and SAS software (version 9.4, SAS Institute, Cary, NC, USA) with a two-sided P value less than 0.05 was considered statistically significant.
Results
Characteristics of the participants
A total of 540 incident GI cancer cases were identified among 24,139 participants during the follow-up period (mean, 10.7 years), among which gastric cancer accounted for the highest number of cases (44.8%), followed by colorectal cancer (22.8%). Compared with the nonincident GI cancer group, the incident GI cancer group comprised older patients (54.7 ± 8.9 years old vs. 49.2 ± 9.1 years old, P<0.001) and patients who exhibited higher proportions of a low education level (49.4% vs. 44.1%, P=0.013), a low income level (23.9% vs. 15.0%, P<0.001), being married or cohabitating (93.7% vs. 90.6%, P=0.015), a first-degree family history of cancer (49.6% vs. 44.3%, P=0.014), and BMI≥25 (44.3% vs. 33.5%, P<0.001). In addition, this group tended to be current smokers (30.0% vs. 25.0%, P<0.001) and current drinkers (67.8% vs. 65.4%, P<0.001). With regard to MetS, incident GI cancer cases accounted for a higher proportion of MetS than those without incident GI cancer (26.3% vs. 18.2%, P<0.001). Similarly, the proportions of central obesity, elevated blood pressure, and high fasting glucose levels tended to be higher in incident GI cancer cases than in nonincident GI cancer (45.2% vs. 34.6%, P<0.001, 48.5% vs. 37.5%, P<0001, and 32.2% vs. 19.2%, P<0.001, respectively) (Table 1).
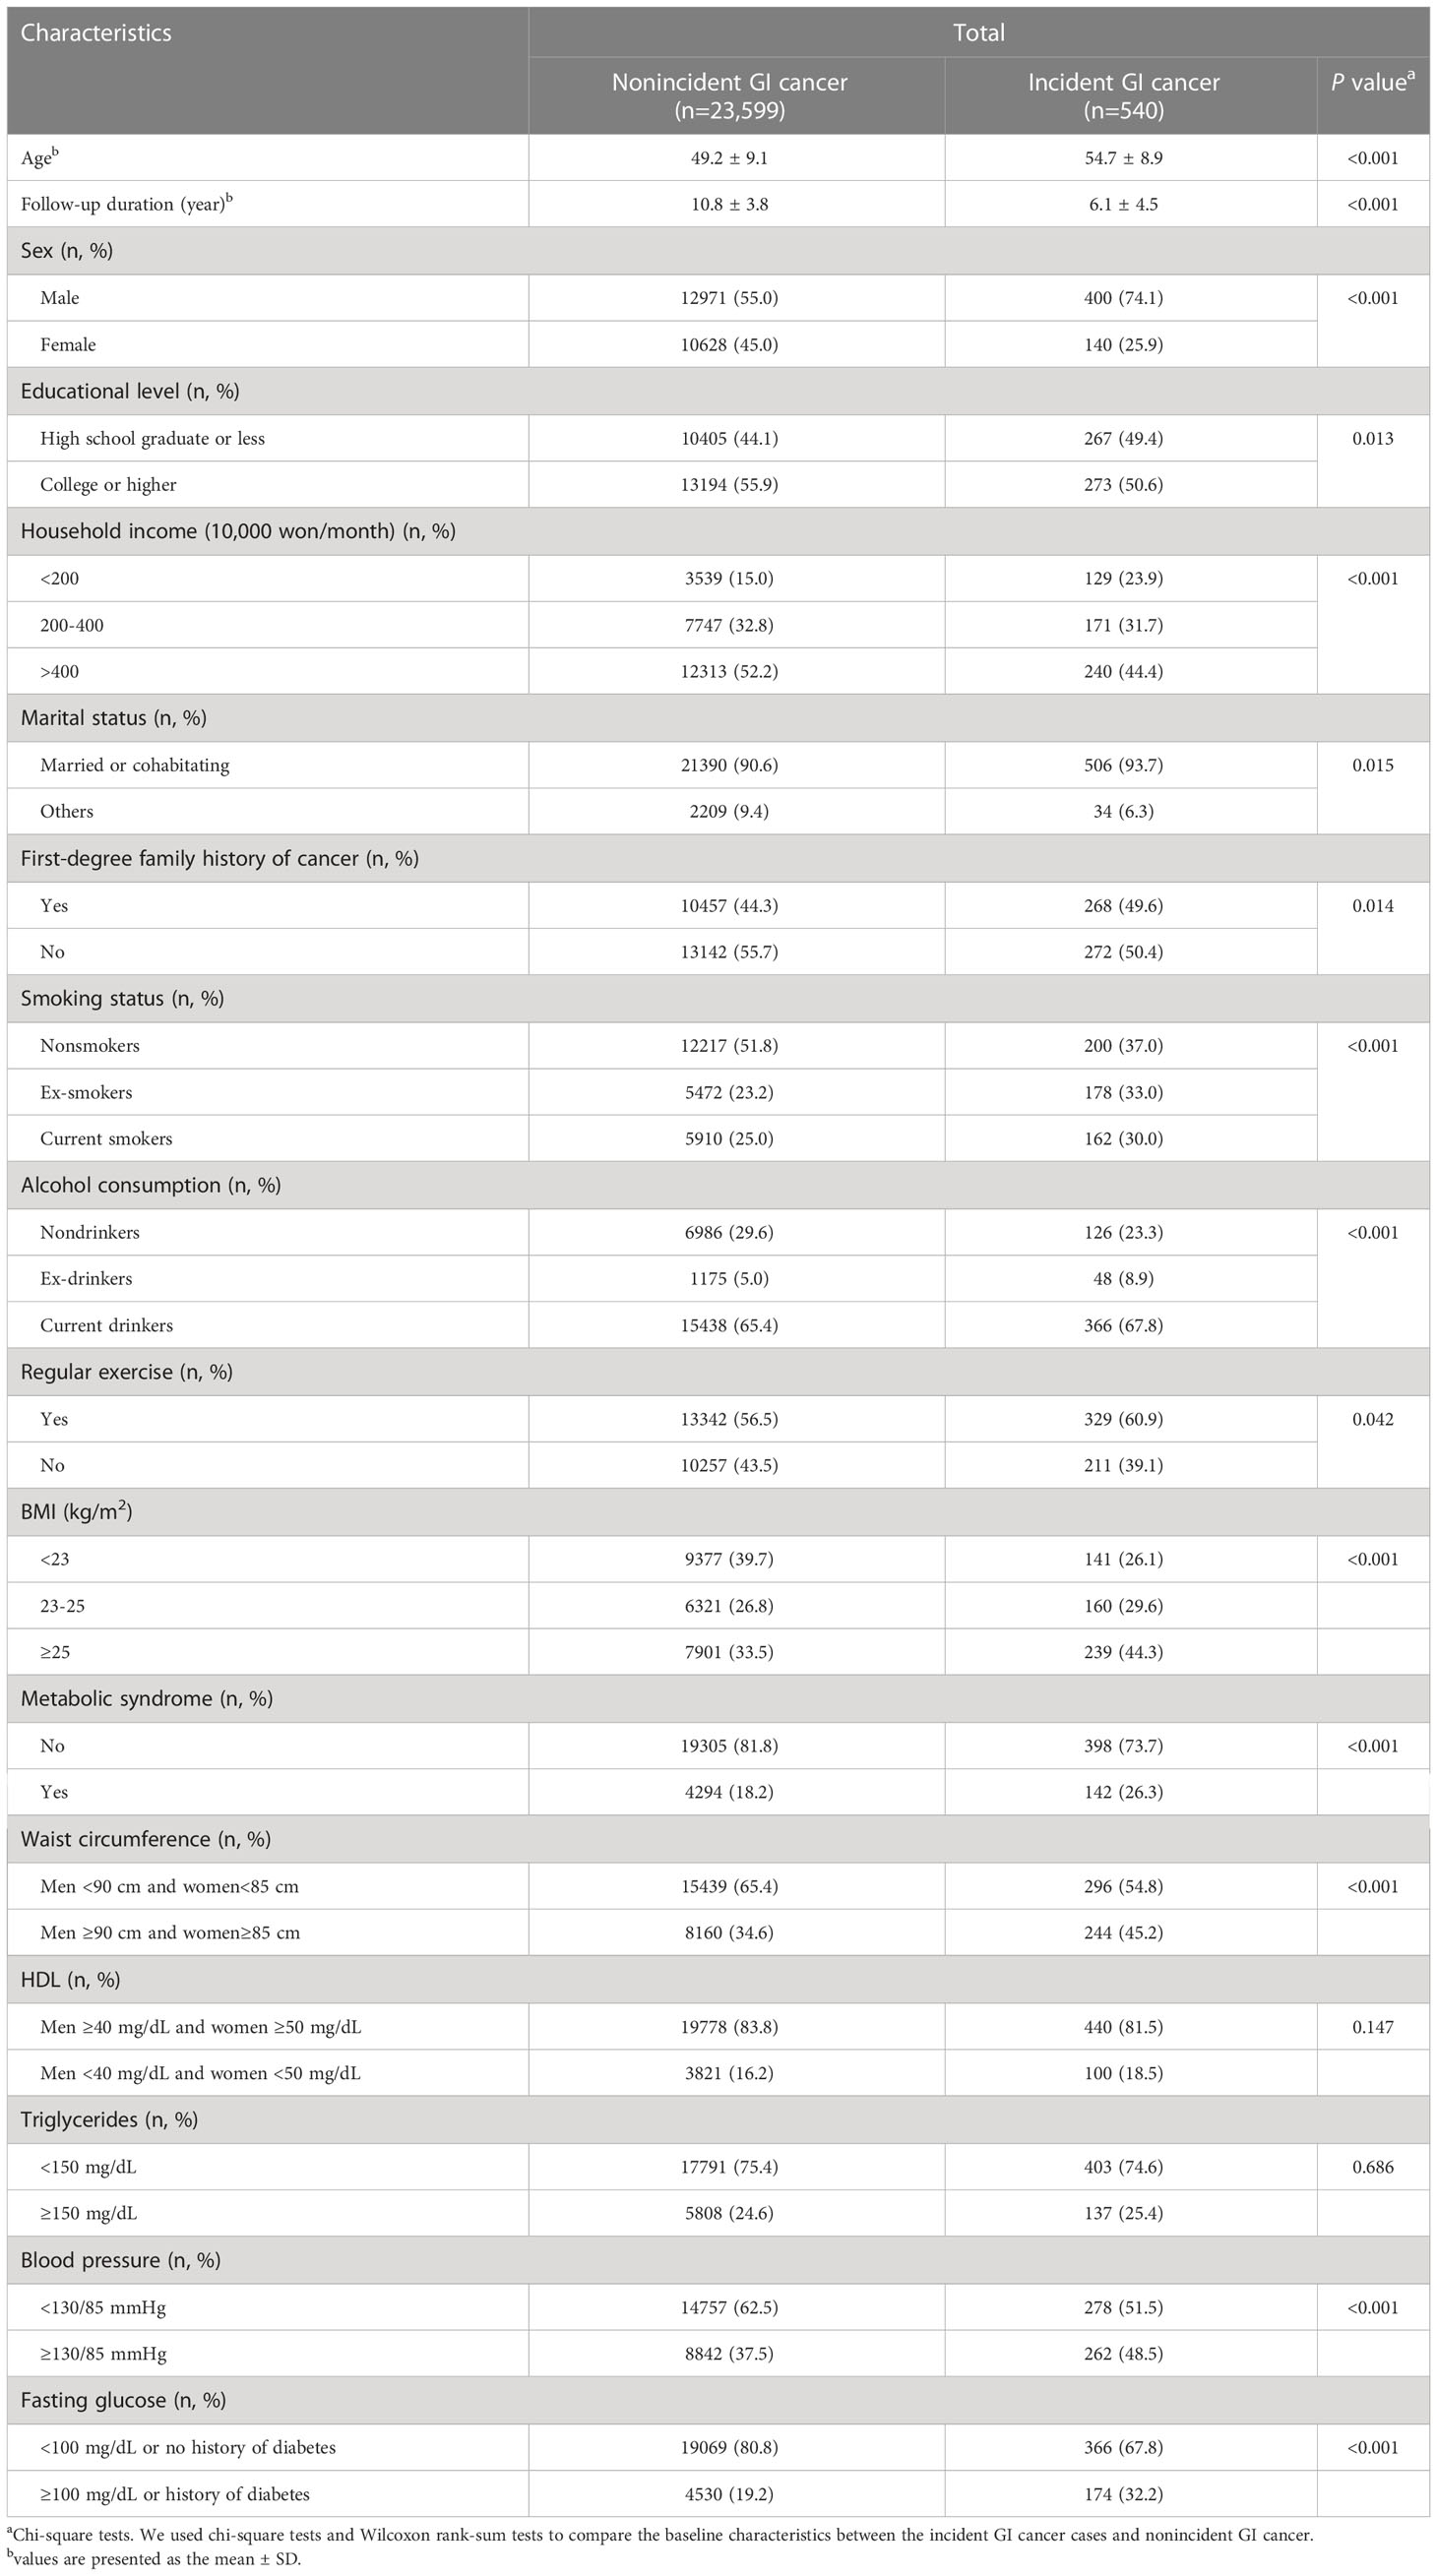
Table 1 Characteristics of the study subjects.
Model performance
The C-index and IBS were used to compare the performance of the models. Table 2 presents these metrics for the CPH and ML models based on the testing dataset. Comparably good performance was recorded for the GB, SSVM, and CPH models, with a C-index value of 0.725. The RSF and EST models exhibited a lower performance than the CPH model (0.699 vs. 0.725 and 0.671 vs. 0.725, respectively). IBS was not estimated for SSVM because it is applicable for models that can estimate a survival function. A similar value of IBS was found for the remaining models (0.017). Furthermore, comparably good discrimination was found for the ML and CPH models concerning the time-dependent AUC (Figure 2).
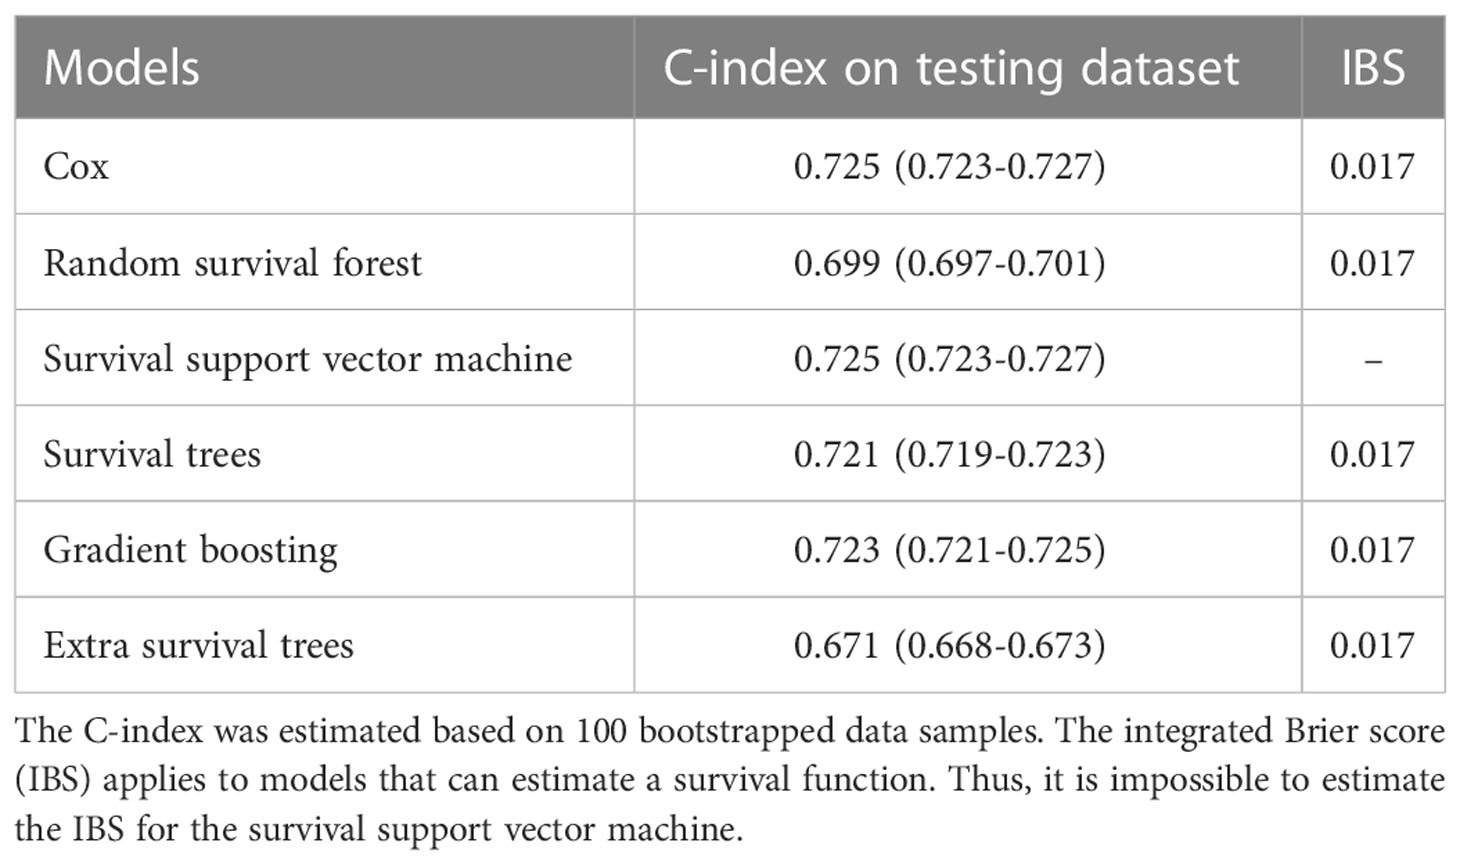
Table 2 C-index and integrated Brier score for the testing dataset.
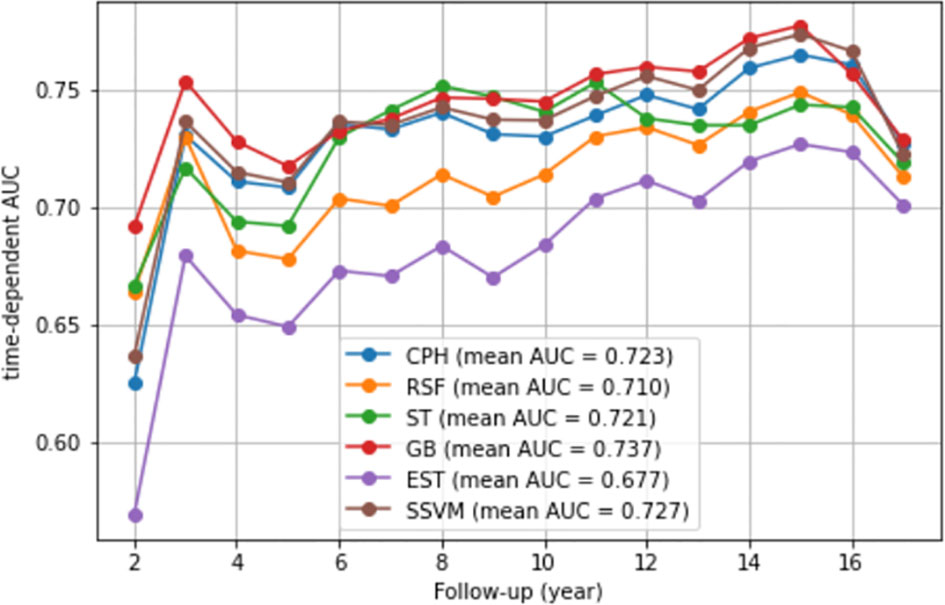
Figure 2 Time-dependent AUC. We presented the time-dependent AUC of the CPH model and five ML models, namely, the random survival forest, survival trees, gradient boosting, extra survival trees, and survival support vector machine models. The vertical axis is the time-dependent AUC. The horizontal axis is follow-up (year).
Importance of predictors of GI cancer
Table 3 presents the top five most important predictors of incident GI cancer based on the ML models. Notably, among the predictors related to MetS, fasting glucose was indicated as an important predictor for the occurrence of GI cancer across models. Furthermore, according to the GB model, waist circumference was one of the five important predictors contributing to incident GI cancer.
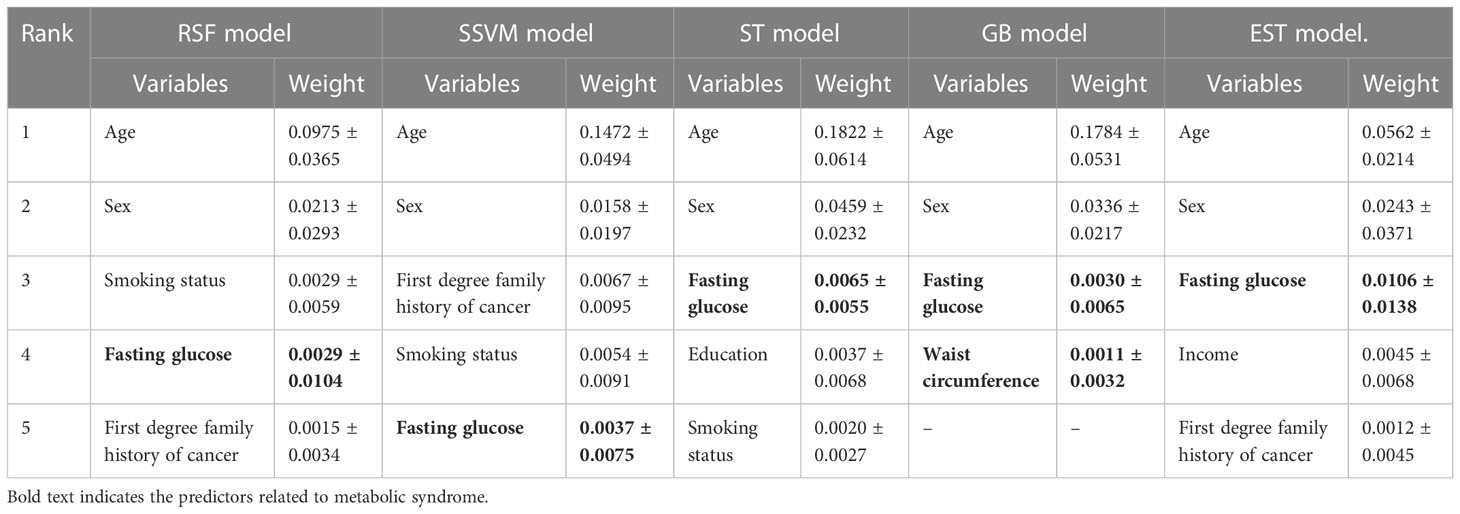
Table 3 Top 5 most important predictors for incident GI cancer based on the ML models.
We then determined the specific relationships between MetS and its components and GI cancer development by using the CPH model. Notably, the important predictors were identified by the CPH model, which were similar to those of the ML models. In detail, a higher risk of GI cancer was found for participants with high waist circumference in both the crude model and adjusted model; the HRs (95% CIs) were 1.56 (1.32-1.85) for the former and 1.36 (1.15-1.62) for the latter. Similarly, high fasting glucose was observed in relation to an increased GI cancer risk in the crude model [HR=2.05 (1.71-2.46)], and this significance remained unchanged in the adjusted model [HR=1.41 (1.17-1.69)]. Furthermore, participants with MetS exhibited a significantly higher risk of GI cancer than those without MetS, and the HRs (95% CIs) were 1.64 (1.35-1.98) in the crude model and 1.29 (1.06-1.56) in the adjusted model (Table 4).
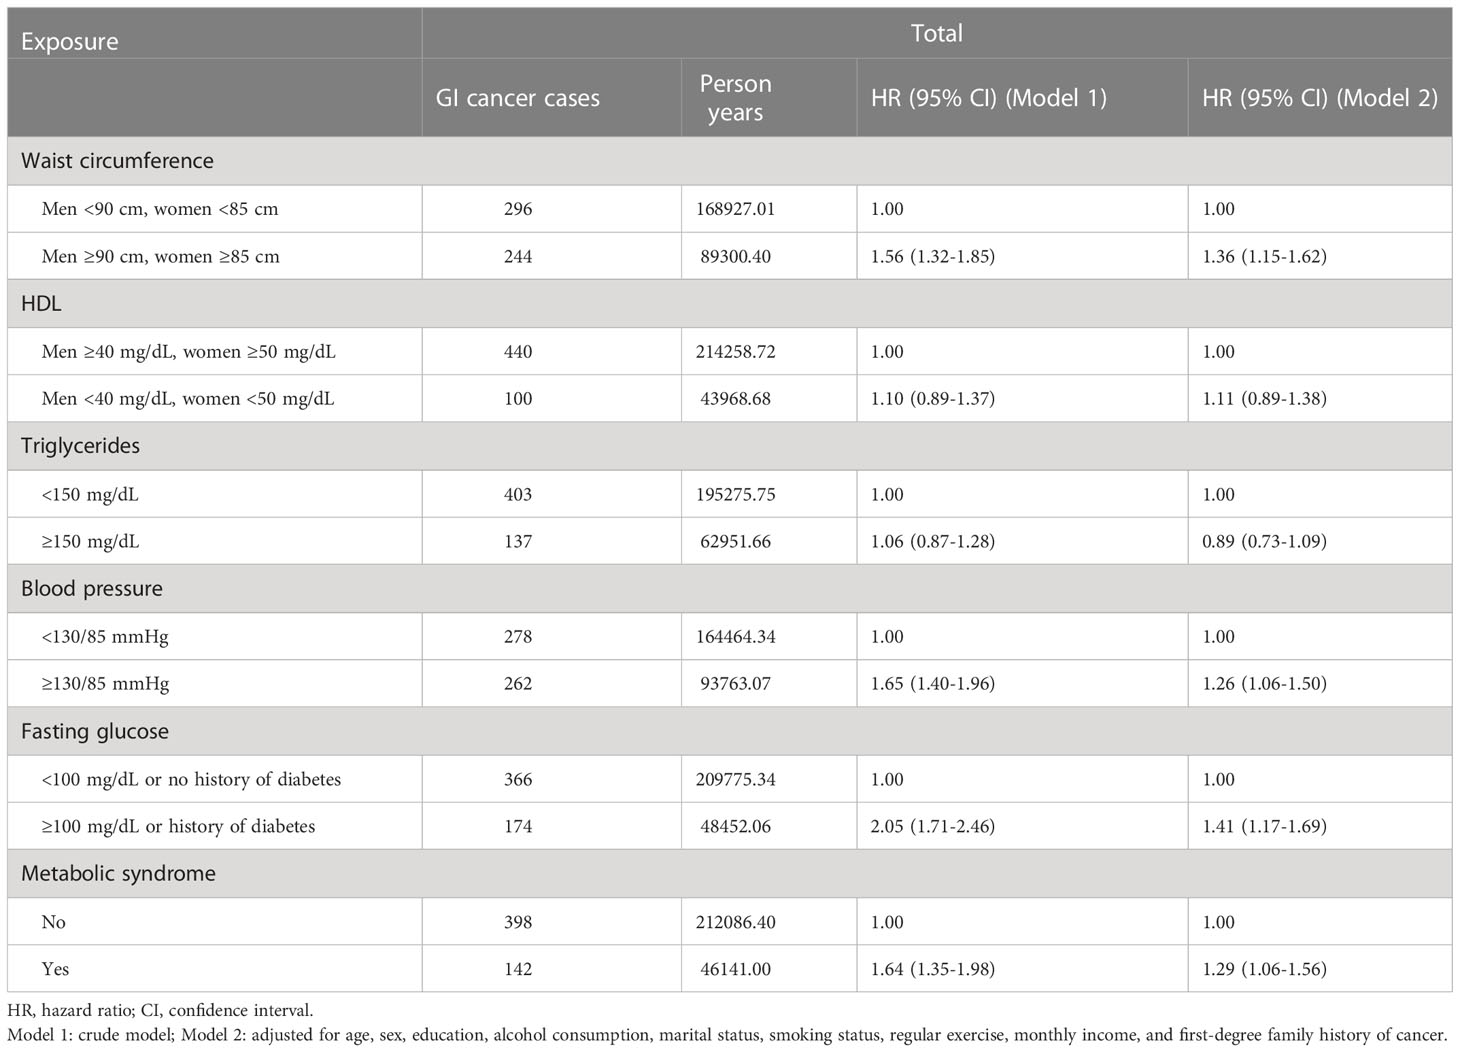
Table 4 Hazard ratios and 95% confidence intervals of incident GI related to metabolic syndrome and its components.
Discussion
In this study, we constructed five ML models and compared them with a conventional CPH model to predict incident GI cancer and identify whether MetS and its components are potential predictors of GI cancer development. Our findings identified a comparably good performance concerning the C-index for the GB, SSVM, and CPH models. High fasting glucose was found to be a predictor for GI cancer development across six models. However, the important predictor was not restricted to high fasting glucose, and the importance of high waist circumference emerged in the GB and CPH models.
To date, attention has been drawn to the application of ML models to time-to-event data. As a result, many studies have been conducted to compare the predictive performance of ML models against CPH models. For example, based on a previous study, an extreme gradient boosting model outperformed a CPH model in predicting breast cancer survival based on C-index values (0.73 vs. 0.63) (16). Similar results were obtained in other studies comparing RSF models and CPH models for survival prediction in patients with liver transplantation or oral squamous cell carcinoma (18, 27). The C-index values obtained in these studies were 0.622/0.620 and 0.764/0.694 for the RSF and CPH models, respectively (18, 27). However, the value of ML models against CPH model is still open to discussion because inconsistent results have been obtained in other studies. Specifically, a comparably good performance was recorded for RSF, conditional inference forest, and CPH models in predicting the survival of patients with oral and pharyngeal cancer (17). Similarly, a CPH model showed better performance in another study conducted in China, where CPH and RSF models were used to predict the progression of high-grade glioma after proton and carbon ion radiotherapy (15).
To our knowledge, our study is the first attempt to use ML and CPH models for the prediction of GI cancer development based on MetS and other confounders. CPH model has been widely applied to investigate the impact of risk factors on incident cancers due to its simple, fast computation and meaningful outputs; however, its limitations need to be clarified (16). First, the proportional hazard assumption must be satisfied in the model. Survival curves for different strata need to have hazard functions that are proportional over time. Second, there is a linear relationship between log hazards and covariates (28). Thus, CPH model may not be appropriate for a dataset with nonlinearity due to a decreased accuracy in prediction (12, 17). To date, the development of ML has been documented to address the limitations of conventional statistical analysis in cancer prediction (16). The self-study, classification, prediction, and feature selection abilities of ML have been well recognized. ML methods can be adapted to deal with data with nonlinearity and high-dimensional covariates (22, 29). However, we found comparable performance for the CPH and ML models. This finding is consistent with some previous studies (17, 30) and may be explained as follows. First, a CPH model tries to fit the data to a specific model and tests the proportional hazards assumptions to examine the influence of predictors on an outcome (17). Thus, the proportional hazards assumption of CPH was satisfied in our data, which may be a potential explanation. Second, complex associations and interactions seem to be unimportant in our data. Third, a small number of predictors were used in our study. Overall, it is important to realize that the superiority of ML models is found only when a CPH model meets its limitations (17). Notably, we evaluated the models based on the C-index, which can account for censoring and does not depend on a single fixed evaluation time (27). Taken together, a CPH model should be considered a method in epidemiological studies when its conditions are satisfied. Additionally, a combination of ML and CPH models could be used to provide further insight into predictors; specifically, nonlinear interactions may be obtained using ML models, whereas a CPH model is used to summarize the risk in a dataset that is not suitable for CPH model analysis (14, 17).
Among the variables related to MetS, the importance of high fasting glucose as a predictor for GI cancer development was found across all models. This finding is consistent with the results of a previous study, where diabetes mellitus was documented to be associated with elevated GI cancer (31). Notably, a consistent association was also found for specific types of GI cancer. For instance, high fasting glucose was demonstrated to play an important role in gastric cancer development in our previous study (32). Similarly, we identified a positive association for colorectal cancer (11). Our finding was reinforced by the conclusions of other studies (33, 34). For example, a higher risk of colorectal cancer was observed in participants with type II diabetes in two large prospective cohorts in the U.S (33). Additionally, a higher risk of primary liver cancer and pancreatic cancer may be attributed to increased fasting glucose (35–37). Our study suggests that greater emphasis must be placed on participants with high fasting glucose, including those with prediabetes (100 mg/dL-125 mg/dL) and diabetes (≥126 mg/dL or a history of diabetes). Prediabetes may have a potential link to GI cancer development (32). Several biological mechanisms may be involved in the effect of high fasting glucose on GI cancer development. First, hyperglycemia could provide nutrients for tumor cells, which has certain effects on the proliferation of these cells. For example, epidermal growth factor expression and epidermal growth factor receptor transactivation may be induced by high glucose, which can contribute to promoting cell proliferation in pancreatic cancer (38). Second, there is a positive association between hyperglycemia and proinflammatory factor production; proinflammatory factors are known to stimulate the expression of oncogenes, regulate the cell cycle, promote the proliferation of tumor cells, inhibit apoptosis, and even induce the epithelial-to-mesenchymal transition (38). Third, insulin-like growth factor 1 (IGF-1) bioavailability could be promoted by insulin, which could inhibit apoptosis, stimulate cellular proliferation, and induce carcinogenesis (39).
Furthermore, high waist circumference was considered an important predictor of the occurrence of GI cancer in the CPH model and GB model in our study. Overall obesity has received more attention in previous studies than central obesity. However, central obesity may have more influence on cancer risk than overall obesity because metabolic derangement is reflected by insulin and IGF levels (40). This hypothesis was supported by a conclusion drawn from a previous study, which emphasized the stronger influence of waist circumference on colon cancer risk than BMI (41). Furthermore, the adverse effect of central obesity on GI cancer development was reinforced by evidence from two meta-analyses of prospective studies (42, 43). The pathophysiological mechanisms can be explained as follows. First, insulin resistance is an important mediator of the link between central obesity and cancer. In detail, high insulin levels lead to IGF activation, promote cellular proliferation, and inhibit apoptosis (44). Second, sex hormones may be a possible mechanism because they are related to a relationship between body size and shape. The pathogenesis of the link between body size and shape and cancer may include obesity-induced hypoxia, genetic susceptibility, and adipose stromal cell migration (44). Notably, MetS was demonstrated to be associated with GI cancer development in the CPH model. However, it was not indicated as the top five important variables in the ML models. A possible reason may be the stronger effects of high fasting glucose and waist circumference. These components are implied to be central factors for the causal link between MetS and GI cancer.
Notably, with regard to variable importance, CPH model exhibits a straightforward interpretation as an HR, whereas a large important variable has more influence on the transition to predict an outcome, and ML models do not provide the sign of the prediction (negative or positive effect) (45). To date, the direct comparison of CPH with ML models regarding interpretation is limited due to the lack of a common metric. Thus, it is necessary to address this limitation in further studies (18).
There are several strengths in our study. First, this is the first attempt to use an ML approach to predict and identify the adverse effects of high fasting glucose and central obesity on GI development with time-to-event data. Second, our study has a relatively large sample size with a long follow-up time, accurately identifying incident cases by linking to the national cancer registry using a high-quality database. Third, we used standardized operating procedures to perform the laboratory tests with standardized equipment and trained personnel. However, there are some limitations in our study. First, we used a small number of predictors. Second, the predictive power may be affected by a low proportion of incident cases in our study. Thus, further studies with a larger number of incident cases and predictors may be warranted to clarify the value of ML models against CPH model. Third, information on medication and dietary factors was not available to consider in our models.
In conclusion, our study found comparably good performance according to the C-index for the ML and CPH models. This finding suggested that ML models may be considered another method for survival analysis when a CPH model has limitations. However, further studies with a larger number of predictors are necessary to clarify the value of ML models. Furthermore, our study indicated that preventing high fasting glucose and central obesity could be expected to reduce GI cancer development.
Data availability statement
The raw data supporting the conclusions of this article will be made available by the authors, without undue reservation.
Ethics statement
The studies involving human participants were reviewed and approved by institutional review board of the National Cancer Center (No. NCCNCS-07-077). Written informed consent to participate in this study was provided by the participants’ legal guardian/next of kin.
Author contributions
Formal analysis, TT, JL. Preparation of original draft, TT. Writing-review and editing, JSK, S-YK, HC, JTK, MG. Data curation, JL, JSK. Investigation, JL. Methodology, JL, JSK. Funding acquisition, JSK. Project administration, JSK. Supervision, JSK. All authors contributed to the article and approved the submitted version.
Funding
This work was supported by International Cooperation & Education Program (NCCRI•NCCI 52210-52211, 2020) of National Cancer Center, Korea and National Research Foundation of Korea (2021R1A4A1032861)
Conflict of interest
The authors declare that the research was conducted in the absence of any commercial or financial relationships that could be construed as a potential conflict of interest.
Publisher’s note
All claims expressed in this article are solely those of the authors and do not necessarily represent those of their affiliated organizations, or those of the publisher, the editors and the reviewers. Any product that may be evaluated in this article, or claim that may be made by its manufacturer, is not guaranteed or endorsed by the publisher.
Abbreviations
ATP III, Adult Treatment Panel III; BMI, body mass index; CI, confidence interval; CPH, Cox proportional hazards; EST, extra survival trees; GB, gradient boosting; GI, gastrointestinal; HDL cholesterol, high-density lipoprotein cholesterol; HR, hazard ratio; IBS, integrated Brier score; MetS, metabolic syndrome; ML, machine learning; NCEP, National Cholesterol Education Program; RSF, random survival forest; SSVM, survival support vector machine; ST, survival trees.
References
1. Arnold M, Abnet CC, Neale RE, Vignat J, Giovannucci EL, McGlynn KA, et al. Global burden of 5 major types of gastrointestinal cancer. Gastroenterology (2020) 159:335–49. doi: 10.1053/j.gastro.2020.02.068
2. Lu L, Mullins CS, Schafmayer C, Zeißig S, Linnebacher M. A global assessment of recent trends in gastrointestinal cancer and lifestyle-associated risk factors. Cancer Commun (Lond) (2021) 41:1137–51. doi: 10.1002/cac2.12220
3. Hong S, Won YJ, Lee JJ, Jung KW, Kong HJ, Im JS, et al. Cancer statistics in Korea: Incidence, mortality, survival, and prevalence in 2018. Cancer Res Treat (2021) 53:301–15. doi: 10.4143/crt.2021.291
4. Yoo H, Kim H, Lee JH, Lee KS, Choi MJ, Song HR, et al. Study on the relevance of metabolic syndrome and incidence of gastric cancer in Korea. Int J Environ Res Public Health (2019) 16:1101. doi: 10.3390/ijerph16071101
5. Saklayen MG. The global epidemic of the metabolic syndrome. Curr Hypertens Rep (2018) 20:12. doi: 10.1007/s11906-018-0812-z
6. Rothwell JA, Jenab M, Karimi M, Truong T, Mahamat-Saleh Y, Ferrari P, et al. Metabolic syndrome and risk of gastrointestinal cancers: an investigation using large-scale molecular data. Clin Gastroenterol Hepatol (2022) 20:e1338–e52. doi: 10.1016/j.cgh.2021.10.016
7. Jimba T, Kaneko H, Yano Y, Itoh H, Yotsumoto H, Seki H, et al. Relation of the metabolic syndrome to incident colorectal cancer in young adults aged 20 to 49 years. Am J Cardiol (2021) 158:132–8. doi: 10.1016/j.amjcard.2021.07.049
8. Ku MS, Chiu SY, Chien KL, Lee YC, Chen SL, Chen CD. Gender difference in metabolic syndrome and incident colorectal adenoma: A prospective observational study (KCIS No.42). Medicine (2021) 100:e26121. doi: 10.1097/MD.0000000000026121
9. Xia B, Peng J, Enrico DT, Lu K, Cheung EC, Kuo Z, et al. Metabolic syndrome and its component traits present gender-specific association with liver cancer risk: A prospective cohort study. BMC Cancer (2021) 21:1084. doi: 10.1186/s12885-021-08760-1
10. Lin Y, Ness-Jensen E, Hveem K, Lagergren J, Lu Y. Metabolic syndrome and esophageal and gastric cancer. Cancer Causes Control (2015) 26:1825–34. doi: 10.1007/s10552-015-0675-4
11. Tran TT, Gunathilake M, Lee J, Kim J. Association between metabolic syndrome and its components and incident colorectal cancer in a prospective cohort study. Cancer (2022) 128:1230–41. doi: 10.1002/cncr.34027
12. Liu P, Fu B, Yang SX, Deng L, Zhong X, Zheng H. Optimizing survival analysis of XGBoost for ties to predict disease progression of breast cancer. IEEE Trans BioMed Eng (2021) 68:148–60. doi: 10.1109/TBME.2020.2993278
13. Kartsonaki C. Survival analysis. Diagn Histopathol (2016) 22:263–70. doi: 10.1016/j.mpdhp.2016.06.005
14. Aivaliotis G, Palczewski J, Atkinson R, Cade JE, Morris MA. A comparison of time to event analysis methods, using weight status and breast cancer as a case study. Sci Rep (2021) 11:14058. doi: 10.1038/s41598-021-92944-z
15. Qiu X, Gao J, Yang J, Hu J, Hu W, Kong L, et al. A comparison study of machine learning (Random survival forest) and classic statistic (Cox proportional hazards) for predicting progression in high-grade glioma after proton and carbon ion radiotherapy. Front Oncol (2020) 10:551420. doi: 10.3389/fonc.2020.551420
16. Moncada-Torres A, van Maaren MC, Hendriks MP, Siesling S, Geleijnse G. Explainable machine learning can outperform cox regression predictions and provide insights in breast cancer survival. Sci Rep (2021) 11:6968. doi: 10.1038/s41598-021-86327-7
17. Du M, Haag DG, Lynch JW, Mittinty MN. Comparison of the tree-based machine learning algorithms to cox regression in predicting the survival of oral and pharyngeal cancers: Analyses based on SEER database. Cancers (2020) 12:2802. doi: 10.3390/cancers12102802
18. Kantidakis G, Putter H, Lancia C, de Boer J, Braat AE, Fiocco M. Survival prediction models since liver transplantation - comparisons between cox models and machine learning techniques. BMC Med Res Methodol (2020) 20:277. doi: 10.1186/s12874-020-01153-1
19. Kim J. Cancer screenee cohort study of the national cancer center in south Korea. Epidemiol Health (2014) 36:e2014013. doi: 10.4178/epih/e2014013
20. Lee SH, Tao S, Kim HS. The prevalence of metabolic syndrome and its related risk complications among koreans. Nutrients (2019) 11:1755. doi: 10.3390/nu11081755
21. Cho YA, Kim J, Cho ER, Shin A. Dietary patterns and the prevalence of metabolic syndrome in Korean women. Nutr Metab Cardiovasc Dis (2011) 21:893–900. doi: 10.1016/j.numecd.2010.02.018
22. Liu Y, Zhou S, Wei H, An S. A comparative study of forest methods for time-to-event data: Variable selection and predictive performance. BMC Med Res Methodol (2021) 21:193. doi: 10.1186/s12874-021-01386-8
23. Wang P, Li Y, Reddy CK. Machine learning for survival analysis: A survey. ACM Comput Surv (2019) 51:1–36. doi: 10.1145/3214306
24. Natekin A, Knoll A. Gradient boosting machines, a tutorial. Front Neurorobot (2013) 7:21. doi: 10.3389/fnbot.2013.00021
25. Dey AK, Suhas N, Teja TS, Juneja A. Some variations on ensembled random survival forest with application to cancer research . Available at: https://www.arxiv-vanity.com/papers/1709.05515/ (Accessed 04 February 2022).
26. Pölsterl S. Scikit-survival:a library for time-to-event analysis built on top of scikit-learn. J Mach Learn Res (2020) 21:1–6.
27. Kim DW, Lee S, Kwon S, Nam W, Cha I-H, Kim HJ. Deep learning-based survival prediction of oral cancer patients. Sci Rep (2019) 9:6994. doi: 10.1038/s41598-019-43372-7
28. Hashim D, Weiderpass E. Cancer survival and survivorship. In: Encyclopedia of cancer, 3rd ed. Elsevier (2019). p. 250–59.
29. Ryo M, Rillig MC. Statistically reinforced machine learning for nonlinear patterns and variable interactions. Ecosphere https://www.sciencedirect.com/science/article/pii/B9780128012383651024?via%3Dihub (2017) 8:e01976. doi: 10.1002/ecs2.1976
30. Datema FR, Moya A, Krause P, Bäck T, Willmes L, Langeveld T, et al. Novel head and neck cancer survival analysis approach: Random survival forests versus cox proportional hazards regression. Head Neck (2012) 34:50–8. doi: 10.1002/hed.21698
31. Luo J, Chlebowski R, Liu S, McGlynn KA, Parekh N, White DL, et al. Diabetes mellitus as a risk factor for gastrointestinal cancers among postmenopausal women. Cancer Causes Control (2013) 24:577–85. doi: 10.1007/s10552-012-9996-8
32. Tran TT, Lee J, Gunathilake M, Cho H, Kim J. Influence of fasting glucose level on gastric cancer incidence in a prospective cohort study. Cancer Epidemiol Biomarkers Prev (2022) 31:254–61. doi: 10.1158/1055-9965.EPI-21-0670
33. Ma Y, Yang W, Song M, Smith-Warner SA, Yang J, Li Y, et al. Type 2 diabetes and risk of colorectal cancer in two large U.S. prospective cohorts. Br J Cancer (2018) 119:1436–42. doi: 10.1038/s41416-018-0314-4
34. Ali Khan U, Fallah M, Sundquist K, Sundquist J, Brenner H, Kharazmi E. Risk of colorectal cancer in patients with diabetes mellitus: A swedish nationwide cohort study. PloS Med (2020) 17:e100343. doi: 10.1371/journal.pmed.1003431
35. Feng X, Wang G, Li N, Lyu Z, Chen S, Wei L, et al. The association between fasting blood glucose and the risk of primary liver cancer in Chinese males: A population-based prospective study. Br J Cancer (2017) 117:1405–11. doi: 10.1038/bjc.2017.296
36. Rapp K, Schroeder J, Klenk J, Ulmer H, Concin H, Diem G, et al. Fasting blood glucose and cancer risk in a cohort of more than 140,000 adults in Austria. Diabetologia (2006) 49:945–52. doi: 10.1007/s00125-006-0207-6
37. Jee SH, Ohrr H, Sull JW, Yun JE, Ji M, Samet JM. Fasting serum glucose level and cancer risk in Korean men and women. Jama (2005) 293:194–202. doi: 10.1001/jama.293.2.194
38. Li W, Zhang X, Sang H, Zhou Y, Shang C, Wang Y, et al. Effects of hyperglycemia on the progression of tumor diseases. J Exp Clin Cancer Res (2019) 38:327. doi: 10.1186/s13046-019-1309-6
39. Kwon HJ, Park MI, Park SJ, Moon W, Kim SE, Kim JH, et al. Insulin resistance is associated with early gastric cancer: A prospective multicenter case control study. Gut Liver (2019) 13:154–60. doi: 10.5009/gnl17556
40. Lee KR, Seo MH, Do Han K, Jung J, Hwang IC. Waist circumference and risk of 23 site-specific cancers: a population-based cohort study of Korean adults. Br J Cancer (2018) 119:1018–27. doi: 10.1038/s41416-018-0214-7
41. Moore LL, Bradlee ML, Singer MR, Splansky GL, Proctor MH, Ellison RC, et al. BMI and waist circumference as predictors of lifetime colon cancer risk in framingham study adults. Int J Obes (2004) 28:559–67. doi: 10.1038/sj.ijo.0802606
42. Du X, Hidayat K, Shi BM. Abdominal obesity and gastroesophageal cancer risk: Systematic review and meta-analysis of prospective studies. Biosci Rep (2017) 37. doi: 10.1042/BSR20160474
43. Aune D, Greenwood DC, Chan DS, Vieira R, Vieira AR, Navarro Rosenblatt DA, et al. Body mass index, abdominal fatness and pancreatic cancer risk: A systematic review and non-linear dose-response meta-analysis of prospective studies. Ann Oncol (2012) 23:843–52. doi: 10.1093/annonc/mdr398
44. Barberio AM, Alareeki A, Viner B, Pader J, Vena JE, Arora P, et al. Central body fatness is a stronger predictor of cancer risk than overall body size. Nat Commun (2019) 10:383. doi: 10.1038/s41467-018-08159-w
Keywords: metabolic syndrome, gastrointestinal cancer, machine learning, prospective cohort study, Korea
Citation: Tran TT, Lee J, Gunathilake M, Kim J, Kim S-Y, Cho H and Kim J (2023) A comparison of machine learning models and Cox proportional hazards models regarding their ability to predict the risk of gastrointestinal cancer based on metabolic syndrome and its components. Front. Oncol. 13:1049787. doi: 10.3389/fonc.2023.1049787
Received: 03 October 2022; Accepted: 20 January 2023;
Published: 02 March 2023.
Edited by:
Recep Avci, The University of Auckland, New ZealandReviewed by:
Abraham A. Pouliakis, National and Kapodistrian University of Athens Medical School, GreeceWen Wei, Arizona State University, United States
Copyright © 2023 Tran, Lee, Gunathilake, Kim, Kim, Cho and Kim. This is an open-access article distributed under the terms of the Creative Commons Attribution License (CC BY). The use, distribution or reproduction in other forums is permitted, provided the original author(s) and the copyright owner(s) are credited and that the original publication in this journal is cited, in accordance with accepted academic practice. No use, distribution or reproduction is permitted which does not comply with these terms.
*Correspondence: Jeongseon Kim, jskim@ncc.re.kr