 Lin Yan
 Sneha Sundaram
 Bret M. Rust
- U.S. Department of Agriculture, Agricultural Research Service, Grand Forks Human Nutrition Research Center, Grand Forks, ND, United States
Male breast cancer, while uncommon, is a highly malignant disease. Monocyte chemotactic protein-1 (MCP-1) is an adipokine; its concentration in adipose tissue is elevated in obesity. This study tested the hypothesis that adipose-derived MCP-1 contributes to male breast cancer. In a 2x2 design, male MMTV-PyMT mice with or without adipose-specific Mcp-1 knockout [designated as Mcp-1-/- or wild-type (WT)] were fed the AIN93G standard diet or a high-fat diet (HFD) for 25 weeks. Mcp-1-/- mice had lower adipose Mcp-1 expression than WT mice. Adipose Mcp-1 deficiency reduced plasma concentrations of MCP-1 in mice fed the HFD compared to their WT counterparts. Mcp-1-/- mice had a longer tumor latency (25.2 weeks vs. 18.0 weeks) and lower tumor incidence (19% vs. 56%), tumor progression (2317% vs. 4792%), and tumor weight (0.23 g vs. 0.64 g) than WT mice. Plasma metabolomics analysis identified 56 metabolites that differed among the four dietary groups, including 22 differed between Mcp-1-/- and WT mice. Pathway and network analyses along with discriminant analysis showed that pathways of amino acid and carbohydrate metabolisms are the most disturbed in MMTV-PyMT mice. In conclusion, adipose-derived MCP-1 contributes to mammary tumorigenesis in male MMTV-PyMT. The potential involvement of adipose-derived MCP-1 in metabolomics warrants further investigation on its role in causal relationships between cancer metabolism and mammary tumorigenesis in this male MMTV-PyMT model.
Introduction
Breast cancer in men accounts for roughly 1% of all breast cancer cases (1). However, breast cancer is an aggressive disease in men. Approximately, 90% of all breast cancer diagnosed in men are invasive carcinoma (2), and 25% of male breast cancer patients have distant metastasis at the time of clinical presentation (3). Additionally, results from the Surveillance, Epidemiology, and End Results (SEER) program show that improvements in breast cancer survival for men lag behind that for women (4).
Similar to female breast cancer, male breast cancer is classified into various subtypes including luminal b (5), an aggressive subtype of a higher grade with poorer prognosis (6) that accounts for 21% of breast cancer in men (5). The mouse mammary tumor virus-polyoma middle T antigen (MMTV-PyMT) model is a commonly used model in research of luminal b breast cancer (7). The MMTV-PyMT model conserves many of the defining characteristics of human subtypes (7). Compared to females, male MMTV-PyMT mice exhibit a delayed onset of palpable mammary tumors with a lower penetrance of metastasis (8). This delayed onset mimics clinical observations that breast cancer in men occurs approximately five to 10 years later than the average age of breast cancer occurrence in women (9).
Obesity is a major risk factor for breast cancer. Obese breast cancer patients often present high-grade lesions, elevated risk of recurrence, and increased incidence of lymph node involvement and metastasis (10, 11). Body fat accumulation, a hallmark of obesity (12, 13), may account for this association. Adipose tissue produces proinflammatory adipokines, including monocyte chemotactic protein-1 (MCP-1), that are elevated by obesity and contribute to obesity-related diseases.
MCP-1 is a major member of the adipokine family (14). In response to obesity, adipocytes increase the production of MCP-1 leading to obesity-induced inflammation (14–16). Clinical studies show that an elevation in MCP-1 occurs with cancer progression and has prognostic value for breast cancer. Poor outcomes and short disease-free intervals are related to high levels of MCP-1 in breast cancer patients (10, 17, 18). Silencing the expression of Mcp-1 or its receptor protects mice against obesity-mediated inflammation in visceral adipose tissue (19, 20) and inhibits mammary tumor growth and metastasis in MDA-MB-231 mice (21). Depletion of MCP-1 reduces mammary tumorigenesis in C3(1)/SV40Tag mice (22) and spontaneous metastasis of Lewis lung carcinoma in C57BL/6 mice (23).
We have reported that adipose specific Mcp-1 knockout reduces high-fat diet-enhanced mammary tumorigenesis in female mice (24) and metastasis of Lewis lung carcinoma (25) in male mice. However, the role of adipose-derived MCP-1 in male breast cancer remains unelucidated. We hypothesized that adipose-derived MCP-1 contributes to mammary tumorigenesis in male mice. The present study tested this hypothesis by investigating the effects of adipose specific MCP-1 deficiency on mammary tumorigenesis in male MMTV-PyMT mice fed a high-fat diet.
Materials and Methods
Animals and Diets
The Grand Forks Human Nutrition Research Center vivarium provided mice for this study. The breeders were obtained from The Jackson Laboratory (Bar Harbor, ME, USA). Hemizygous male MMTV-PyMT mice on an FVB background were bred to female C57BL/6 mice with both alleles of the MCP-1 exons 2-3 flanked by loxP sites (MCP-1fl/fl). Adipose tissue-specific knockout of MCP-1 was achieved by breeding male mice homozygous for MCP-1fl/fl and heterozygous for the PyMT oncogene (MMTV-PyMT+/MCP-1fl/fl) with female MCP-1fl/fl mice expressing Cre recombinase driven by the adiponectin promoter (MCP-1fl/fl/Adipoq-Cre+). Male mice heterozygous for the PyMT oncogene carrying two floxed MCP-1 alleles and positive for Cre expression (MMTV-PyMT+/MCP-1fl/fl/Adipoq-Cre+) were designated as adipose Mcp-1 knockout (Mcp-1-/-) mice. Male littermates that were negative for Cre expression (MMTV-PyMT+/MCP-1fl/fl/Adipoq-Cre-) served as wild-type (WT) controls. All mice used in this study were on a combination of the FVB and C57BL/6 backgrounds. Mice were maintained in a pathogen-free room on a 12:12-hour light/dark cycle with a temperature of 22 ± 1°C. The standard AIN93G diet (26) and a high-fat diet (HFD) providing 16% and 45% of energy from soybean oil, respectively, were used in this study (Table 1). Both diets were powder diets and were stored at −20°C until feeding. The study was performed in accordance with the Guide for the Care and Use of Laboratory Animals by the National Institutes of Health (27).
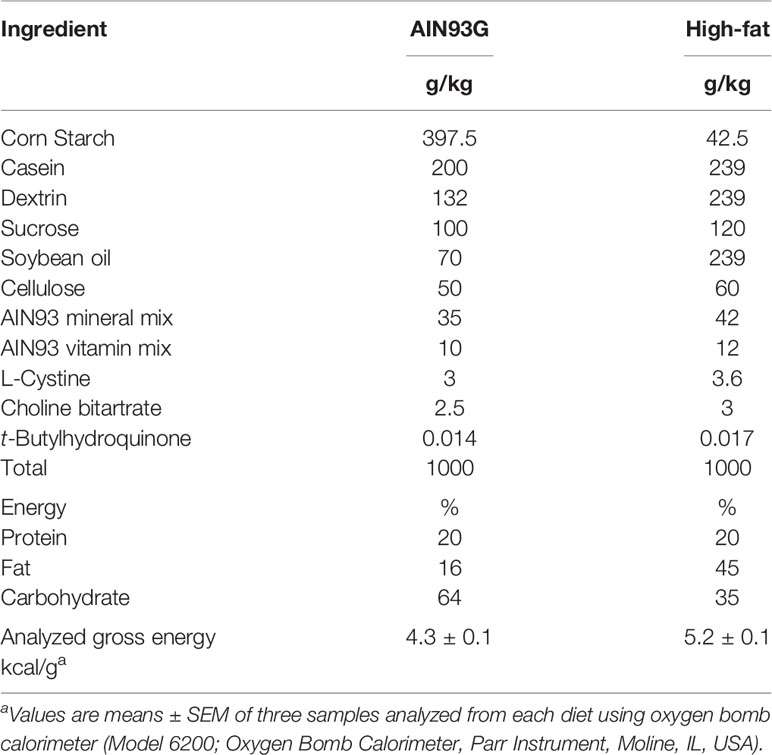
Table 1 Composition of diets.
Experimental Design
Mice were weaned onto the AIN93G diet at three weeks of age. Following one week of acclimation with the AIN93G diet, WT and Mcp-1-/- mice each were randomly assigned into one of four groups (32 per group for WT and 34 per group for Mcp-1-/- mice fed the AIN93G and HFD, respectively). Mice were housed two per cage to avoid stress related to single housing and weighed weekly. Food intake (12 mice per group) was recorded daily for three consecutive weeks one week after the initiation of the HFD. Body composition of conscious, immobilized mice was assessed one week prior to the end of the study by using the Echo Whole Body Composition Analyzer (Model 100, Echo Medical Systems, Houston, TX, USA). The percent body fat mass was calculated by using the formula: (fat mass/body mass) x 100; the percent body lean mass was obtained by using the formula: (lean mass/body mass) x 100.
Measurement of Mammary Tumors
Mice were palpated for mammary tumors twice weekly. Tumor latency was defined as the age at which the first mammary tumor was detected (28). Palpable tumors were measured weekly by using a digital caliper (Fred V Fowler Company, Newton, MA, USA). Tumor volume was calculated by using the formula: length x width2 x 0.5 (28). Tumor progression was defined as the percentage change in tumor volume over time and calculated by using the formula: [(end volume – start volume)/start volume] x 100 (29). End volume was the tumor volume measured at the end of the study; start volume was the volume of the palpable tumor when it was first detected.
Tissue Harvest
At termination, mice were fasted for six hours before they were euthanized with an intraperitoneal injection of a mixture of ketamine and xylazine followed by exsanguination. Mammary tumors were collected and weighed. Epididymal adipose tissue and plasma were harvested and stored at -80°C. Lungs were collected and fixed in Bouin’s solution for assessing the extent of metastasis (30).
RNA Isolation and Real-Time Quantitative PCR
Total RNA was isolated from epididymal adipose tissue by using the RNeasy Lipid Tissue Mini Kit following the manufacturer’s protocol (Qiagen, Germantown, MD, USA). The quality and quantity of RNA were analyzed by using Nanodrop 8000 Spectrophotometer (Thermo Scientific, Wilmington, DE, USA). cDNA was synthesized by using the High Capacity cDNA Reverse Transcription Kit (Applied Biosystems, Waltham, MA, USA) following the manufacturer’s protocol. Real-time qPCR of Mcp-1 was analyzed and normalized to the 18s rRNA by using the TaqMan Assay of Demand primers on the ABI QuantStudio 12K-Flex Real-time PCR system (Applied Biosystems). The 2-ΔΔCT method was used to calculate the relative changes in gene expression (31).
Quantification of MCP-1 in Plasma
Sandwich enzyme-linked immunosorbent assay (ELISA) kit was used to quantify MCP-1 (R&D Systems, Minneapolis, MN, USA) in plasma following the manufacturer’s protocol. Samples were read within the linear range of the assay. The accuracy of the analysis was confirmed by using the controls provided in the kit.
Metabolomics Analyses
Metabolomics analysis was conducted on plasma samples from mice without palpable mammary tumors (n = 10 per group) (32, 33). This was because few mice developed palpable tumors, particularly Mcp-1-/- mice. Samples were extracted and derivatized by silylation methyloximation and analyzed by gas chromatography time-of-flight mass spectrometry (GC-TOF-MS) for untargeted metabolomics of primary metabolism. The analysis was performed and obtained data were processed by using the BinBase database (34) at the West Coast Metabolomics Center (University of California-Davis, Davis, CA, USA). Unidentified peaks were removed from the dataset and excluded from the subsequent analysis. For the remaining identified compounds, quantifier ion peak heights were normalized to the sum intensities of all known compounds. Compounds representing less than 0.02% of total signal intensity for identified compounds were excluded from statistical analysis. Additional compounds were excluded if they could not be identified as either an intermediate species or metabolic endpoint common to mammalian metabolism based upon the Kyoto Encyclopedia of Genes and Genomes (KEGG) Database or the Human Metabolome Database (35–37).
Statistical Analyses
Two-way analysis of variance (ANOVA) and Tukey contrasts were performed to examine the effects of diet (AIN93G or HFD), genotype (WT or Mcp-1-/-), and their interactions on Mcp-1 expression in adipose tissue, MCP-1 concentration in plasma, body weight, body composition, and energy intake among the four dietary groups. The LIFEREG procedure was used to fit the Lognormal model to latency data. The LIFETEST procedure was used to produce the Kaplan-Meier plots. Results are reported as means ± standard error of the mean (SEM); tumor latency is reported as medians and 95% confidence intervals (95% CI). Data were analyzed by using SAS 9.4 (SAS Institute, Cary, NC, USA). Differences with a p ≤ 0.05 are considered significant.
Metabolomics analyses were performed by using MetaboAnalyst 5.0 (McGill University, Sainte Anne de Bellevue, Quebec, Canada). Data were scaled by Pareto scaling method and analyzed by sparse partial least square-discriminant analysis (sPLSDA) (38, 39). Hierarchical clustering heatmap was constructed by using the normalized peak intensity with Euclidean distance for distance measurement and the Ward error sum of squares hierarchical clustering methods for Cluster algorithm. Group averages were reported for the top 25 metabolites identified. The MACRO procedure (SAS 9.4) was used to examine effects of diet, genotype, and their interactions on changes in plasma metabolites with the false discovery rate-corrected p-values reported. Results of metabolomics analyses from treatment groups are presented as fold changes in comparison to the WT control group fed the AIN93G diet.
Pathway and network analyses were performed by using MetaboAnalyst 5.0 (40). Pathway analysis of alterations in metabolic pathways in MMTV-PyMT mice was performed by using the pathway library for Mus musculus according to the KEGG database (41). Pathway enrichment analysis coupled with pathway topology analysis was performed to identify the altered metabolic pathways. Obtained p values from the pathway enrichment analysis were adjusted by the Holm method (42). Network analysis was performed to map the functional relationships of identified metabolites between the AIN93G and HFD, between WT and Mcp-1-/- mice, and between WT and Mcp-1-/- mice fed the HFD by using the KEGG Global Metabolic Network and the Metabolite-Metabolite Interaction Network. Differences with a p ≤ 0.05 are considered significant.
Results
Body Weight, Adipose Mcp-1 Expression, and Plasma MCP-1 Concentrations
Mice fed the HFD were heavier than mice fed the AIN93G diet, regardless of genotype (Figure 1A). The difference was significant after three weeks on the HFD and remained for the remainder of the study (p < 0.05) (Figure 1A). Mcp-1-/- mice fed the AIN93G diet were smaller than their WT counterparts; the difference was significant in the last four weeks of the study (p < 0.05) (Figure 1A).
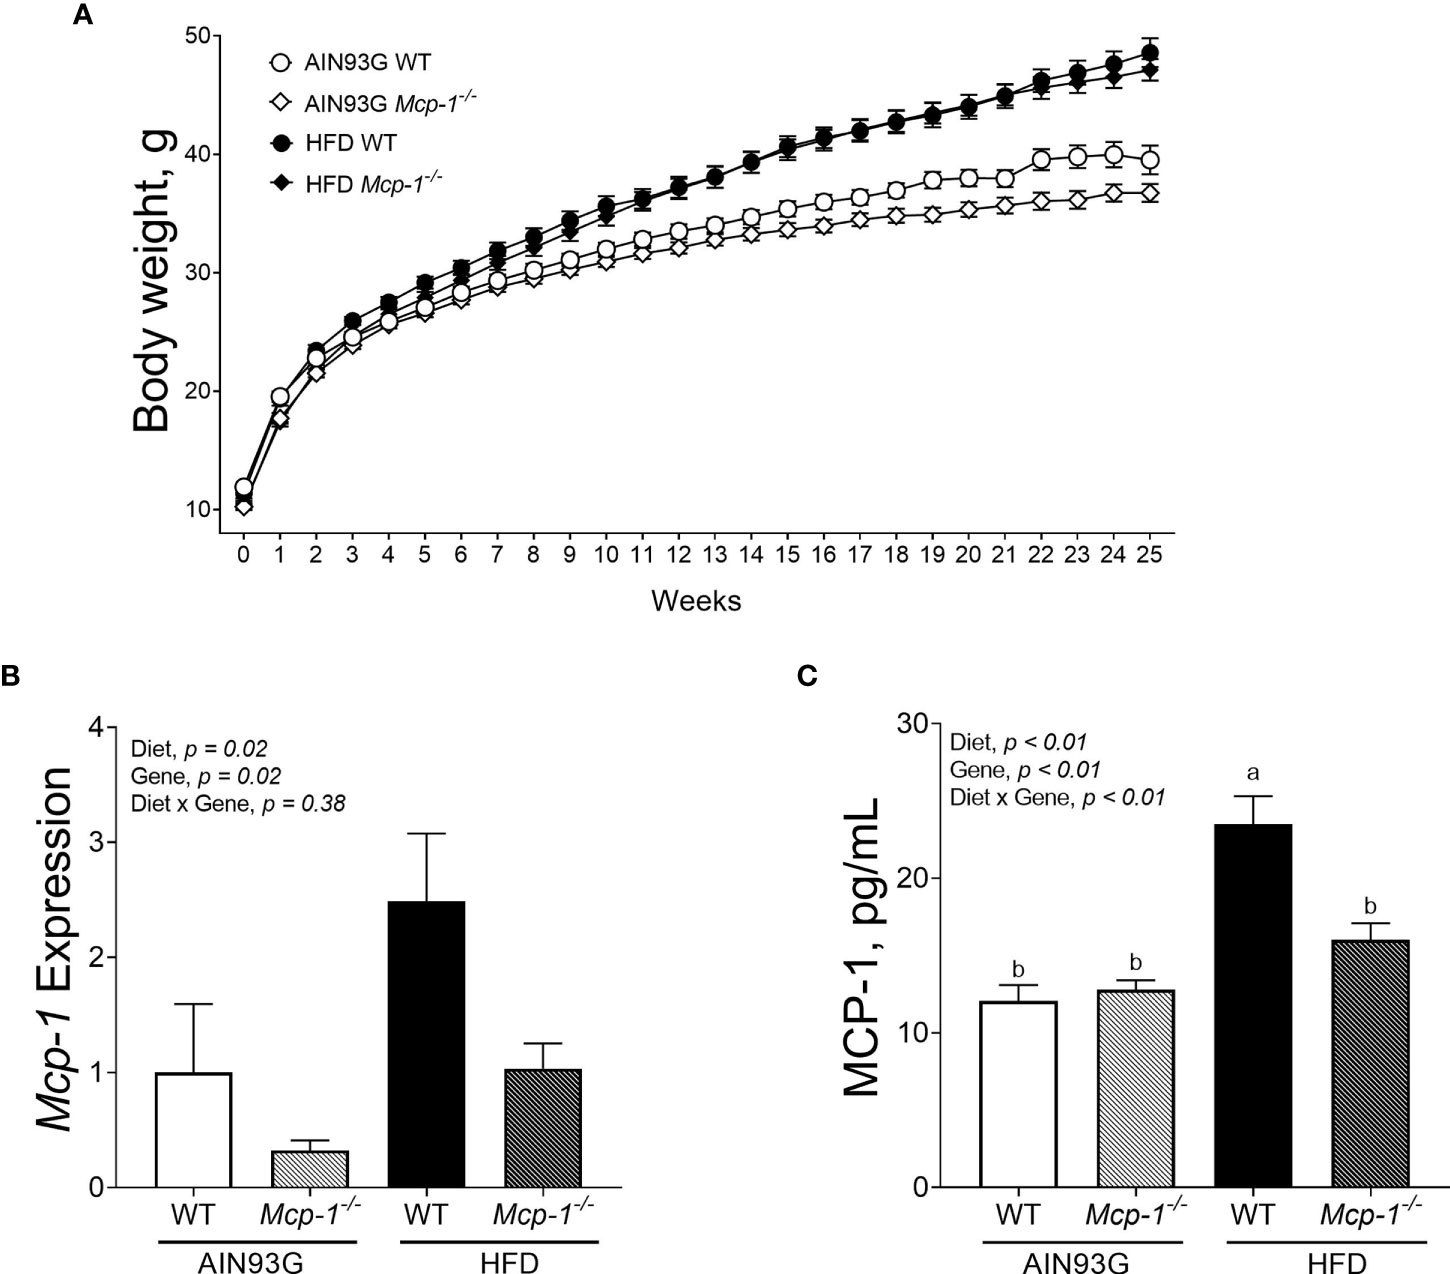
Figure 1 Body weight (A), adipose Mcp-1 expression (B), and plasma concentrations of MCP-1 (C) in MMTV-PyMT mice with or without adipose monocyte chemotactic protein-1 knockout [Mcp-1-/- or wild-type (WT)] and fed the AIN93G or high-fat diet (HFD). Mice fed the HFD were heavier than mice fed the AIN93G diet; the difference was significant three weeks after the HFD (p < 0.05). Mcp-1-/- mice fed the AIN93G diet were smaller than their WT counterparts; the difference was significant for the last four weeks of the study (p < 0.05). Values are means ± SEM [n = 32 per group for WT mice, n = 34 per group for Mcp-1-/- mice for (A); n = 10 per group for (B); n = 16 per group for (C)]. Values with different letters are significant at p ≤ 0.05 for (C).
The HFD elevated Mcp-1 expression in adipose tissue by 166% compared to the AIN93G diet, regardless of genotype (Figure 1B). Adipose Mcp-1 knockout diminished Mcp-1 elevation by 61% compared to WT mice, regardless of diet (Figure 1B). Plasma concentrations of MCP-1 from WT mice fed the HFD were 95% higher than that from WT mice fed the AIN93G diet (Figure 1C). Adipose Mcp-1 deficiency prevented plasma MCP-1 elevation in HFD-fed Mcp-1-/- mice, which did not differ from that of AIN93G-fed Mcp-1-/- mice (Figure 1C).
Body Composition and Energy Intake
Regardless of genotype, the percent body fat mass of mice fed the HFD was 37% greater than that of mice fed the AIN93G diet (28.8 ± 0.9% vs. 21.1 ± 0.9%) (Figure 2A). The percent body lean mass of the HFD-fed mice was 11% less than that of the AIN93G-fed mice (69.7 ± 0.9% vs. 77.9 ± 0.9%) (Figure 2B). The absolute lean mass of mice fed the HFD was slightly higher than that of mice fed the AIN93G diet (28.5 ± 0.4 g vs. 26.6 ± 0.4 g) (Figure 2C). Energy intake of the HFD-fed mice was 7% higher than that of the AIN93G-fed mice (39.4 ± 0.7 kcal per day vs. 37.0 ± 0.7 kcal per day) (Figure 2D). There were no significant differences in percent body fat mass, percent body lean mass, absolute lean mass, and energy intake between WT and Mcp-1-/- mice, regardless of diet (Figures 2A–D).
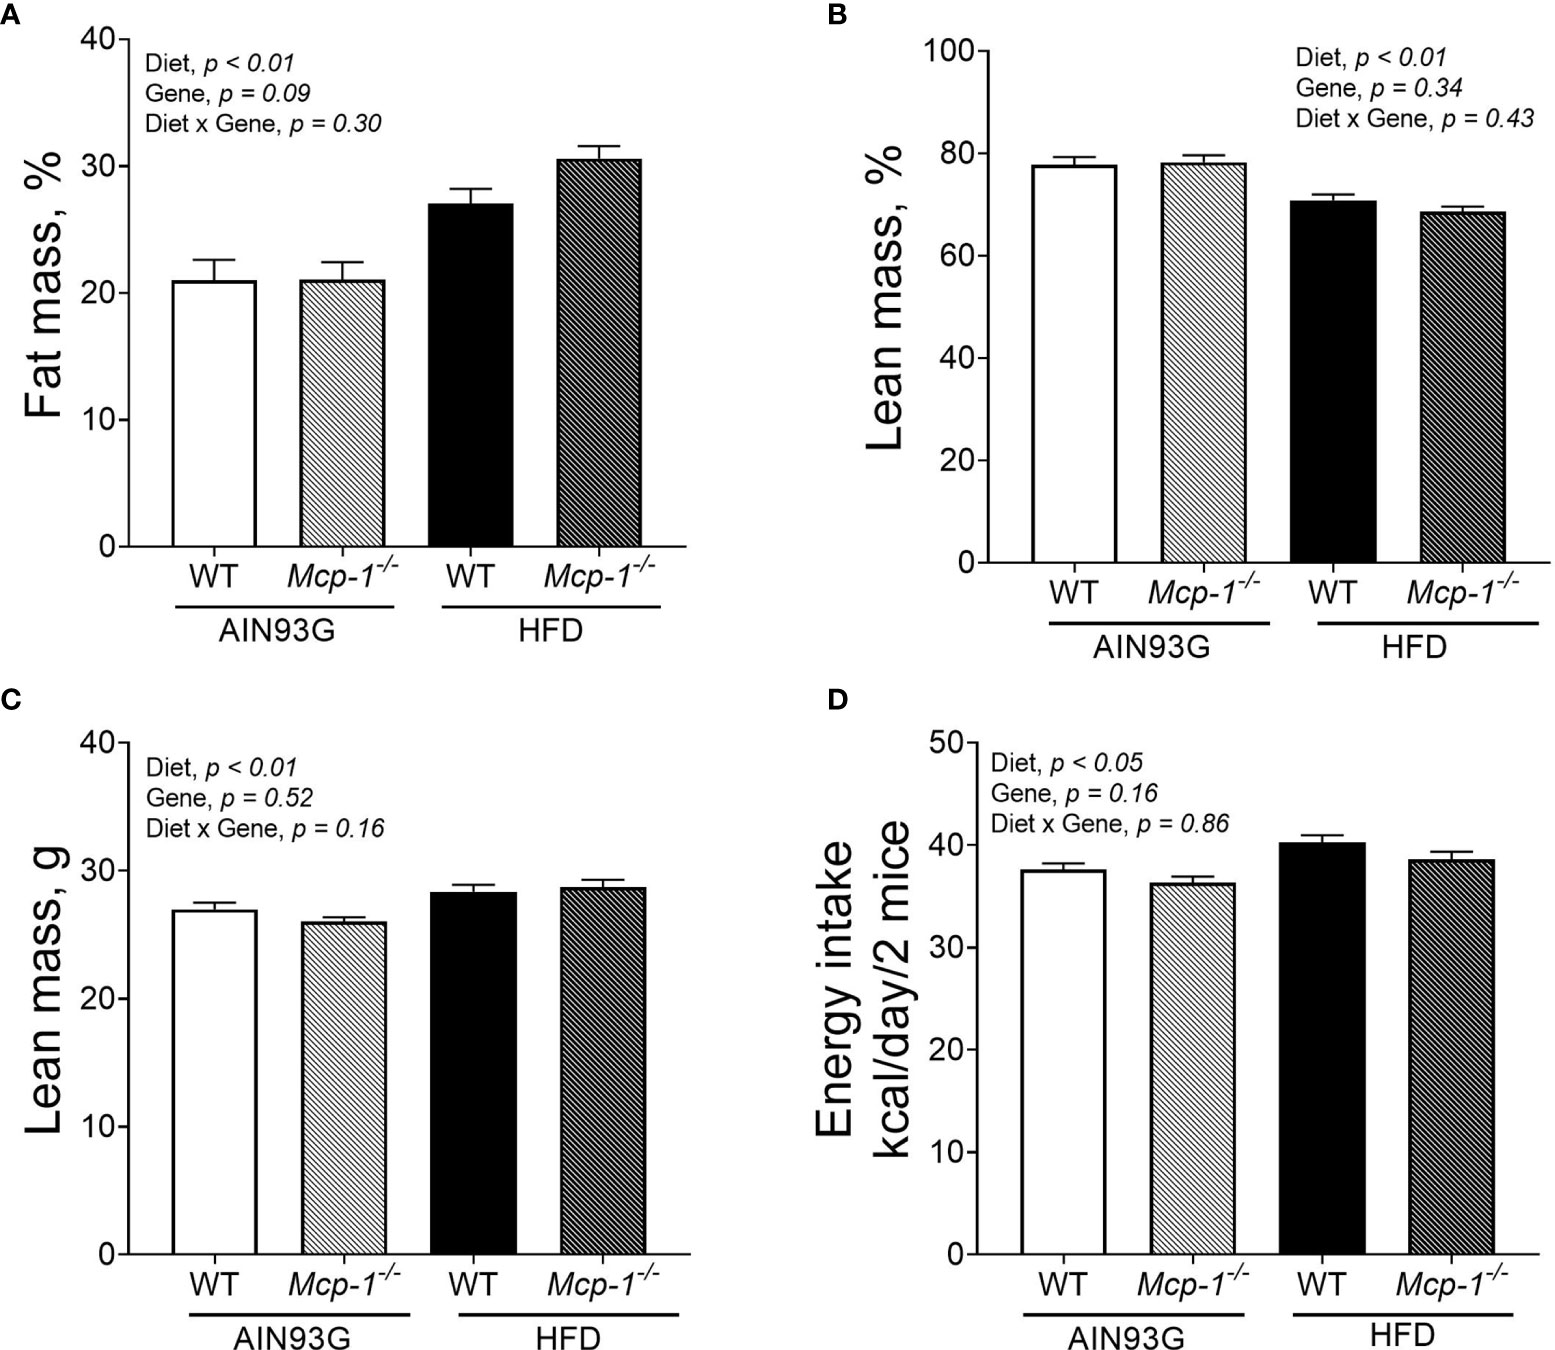
Figure 2 The percent body fat mass (A), percent body lean mass (B), absolute lean mass (C), and energy intake (D) of MMTV-PyMT mice with or without adipose monocyte chemotactic protein-1 knockout [Mcp-1-/- or wild-type (WT)] and fed the AIN93G or high-fat diet (HFD). Values are means ± SEM [n = 32 per group for WT mice, n = 34 per group for Mcp-1-/- mice for (A–C); n = 12 mice per group for (D)].
Mammary Tumorigenesis and Lung Metastasis
Fewer Mcp-1-/- mice developed palpable mammary tumors than WT mice. The tumor incidence was 19% for Mcp-1-/- mice (13 out of 68 mice) and 56% for WT mice (36 out of 64 mice) (p < 0.01), regardless of diet. There was no difference in tumor incidence between the HFD (26 out of 66 mice) and the AIN93G diet (23 out of 66 mice), regardless of genotype.
Palpable mammary tumors were detected later in Mcp-1-/- mice than in WT mice. Tumor latency of Mcp-1-/- mice fed the AIN93G and HFD was 25.2 weeks and 25.1 weeks, respectively (Figure 3A). Tumor latency of WT mice fed the AIN93G and HFD was 17.4 weeks and 18.5 weeks, respectively (Figure 3A). The difference between Mcp-1-/- and WT mice was significant (p < 0.01), regardless of diet (Figure 3A).
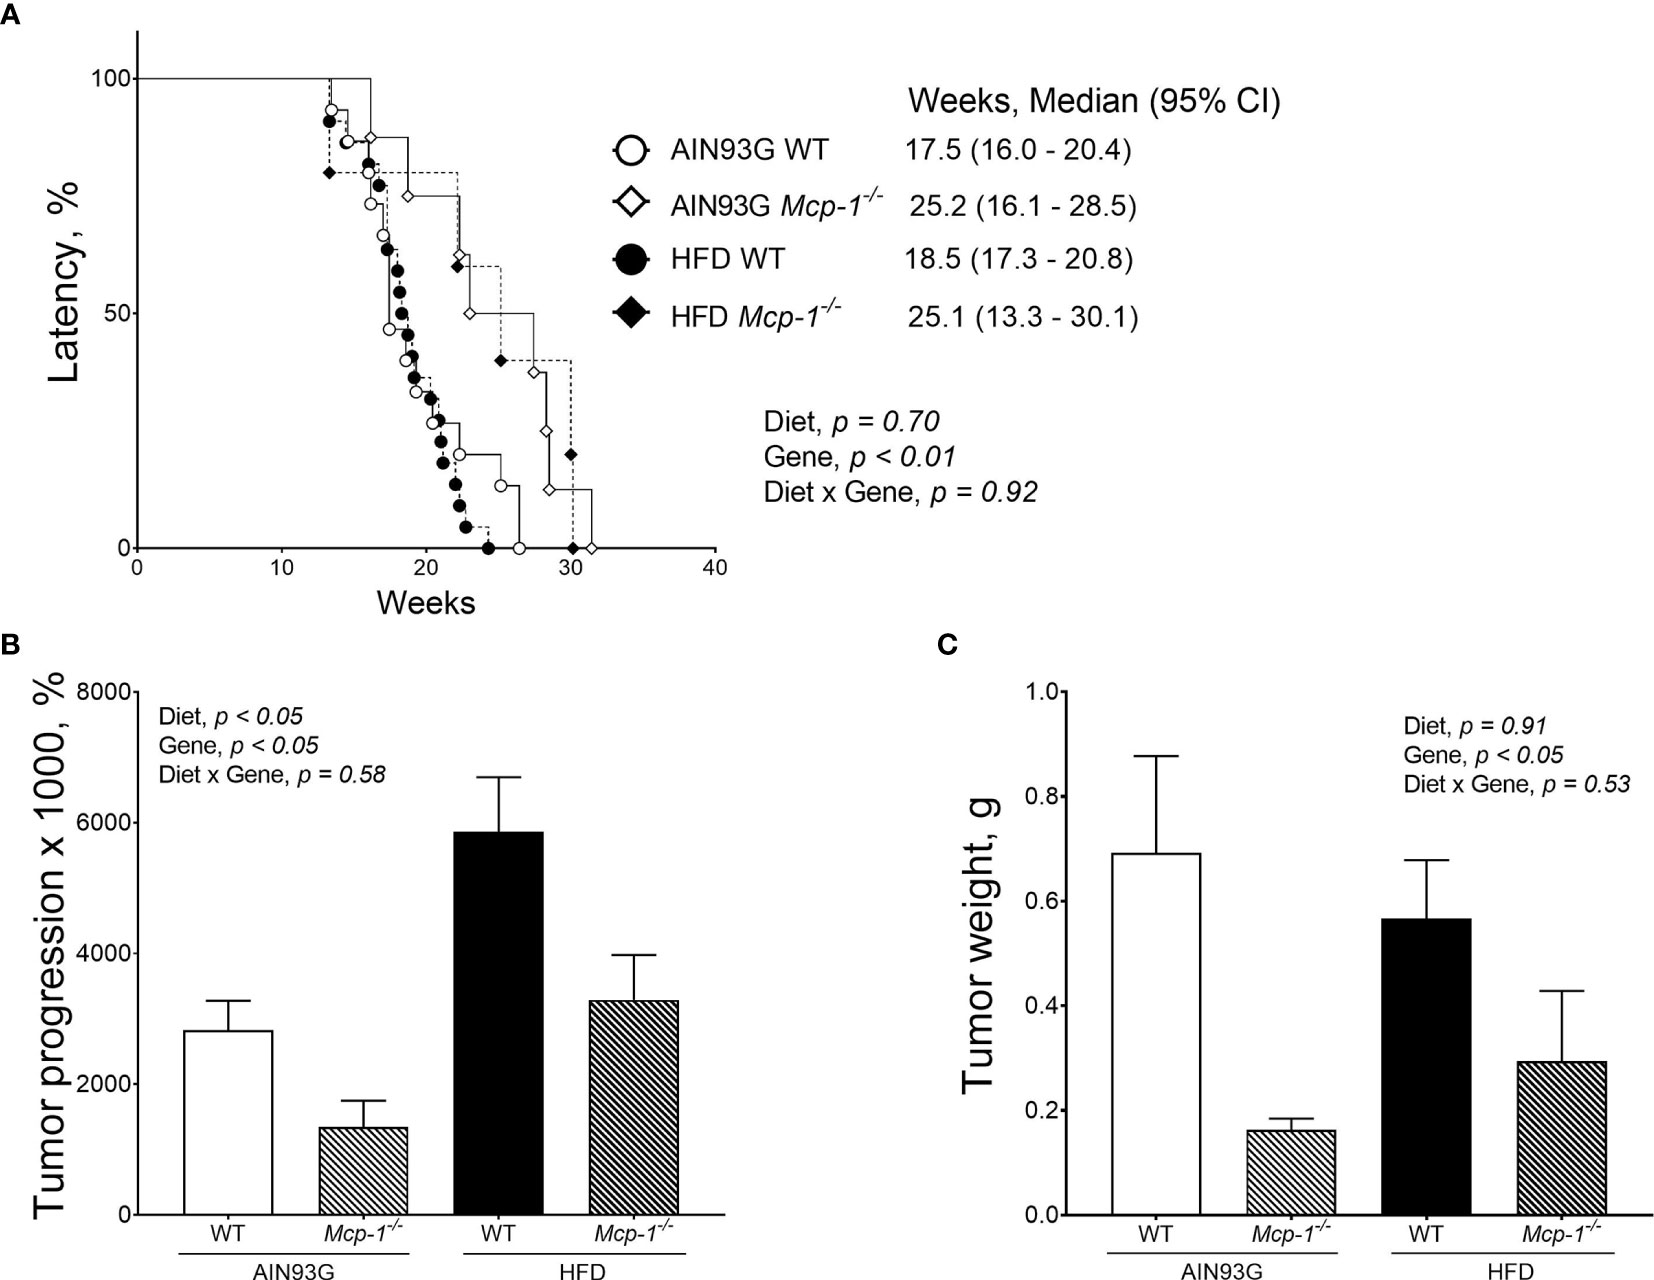
Figure 3 Mammary tumor latency (A), tumor progression (B), and tumor weight (C) of MMTV-PyMT mice with or without adipose monocyte chemotactic protein-1 knockout [Mcp-1-/- or wild-type (WT)] and fed the AIN93G or high-fat diet (HFD). Values are means ± SEM [(n = 5-22 per group) for (B, C)]. N = 32-34 per group for (A).
Mice fed the HFD had greater tumor progression than mice fed the AIN93G diet (4679 ± 786% vs. 2430 ± 700%), regardless of genotype (Figure 3B). The tumor progression of Mcp-1-/- mice was lower than that of WT mice (2317 ± 901% vs. 4792 ± 545%), regardless of diet (Figure 3B). At the end of the study, mammary tumors from Mcp-1-/- mice weighed 64% less than that from WT mice (0.23 ± 0.15 g vs. 0.64 ± 0.09 g), regardless of diet (Figure 3C). There was no significant difference in tumor weight between the two diets, regardless of genotype (Figure 3C).
Few tumor-bearing mice in each group had detectable metastases in the lungs. The incidence of metastasis was 38% for Mcp-1-/- mice (5 out of 13 mice) and 39% for WT mice (14 out of 36 mice), regardless of diet. The incidence of metastasis was 50% for the HFD (13 out of 26 mice) and 26% for the AIN93G diet (6 out of 23 mice) regardless of genotype. There were no significant differences in these comparisons.
Plasma Metabolomics Analysis
Plasma metabolomics analysis was performed to investigate effects of adipose MCP-1 deficiency and HFD on metabolome. Because few mice developed palpable mammary tumors, particularly Mcp-1-/- mice, the analysis was performed by using plasma samples from mice that did not develop palpable tumors. We identified 127 compounds from 467 discrete signals detected in plasma by the GC-TOF-MS. Eighty-seven of the 127 compounds met the criteria for statistical analysis (Supplementary Table 1). Fifty-six of these 87 compounds differed significantly among the four groups, including 22 differed by diet, 22 by genotype, and 34 by diet and genotype interactions (Tables 2–4).
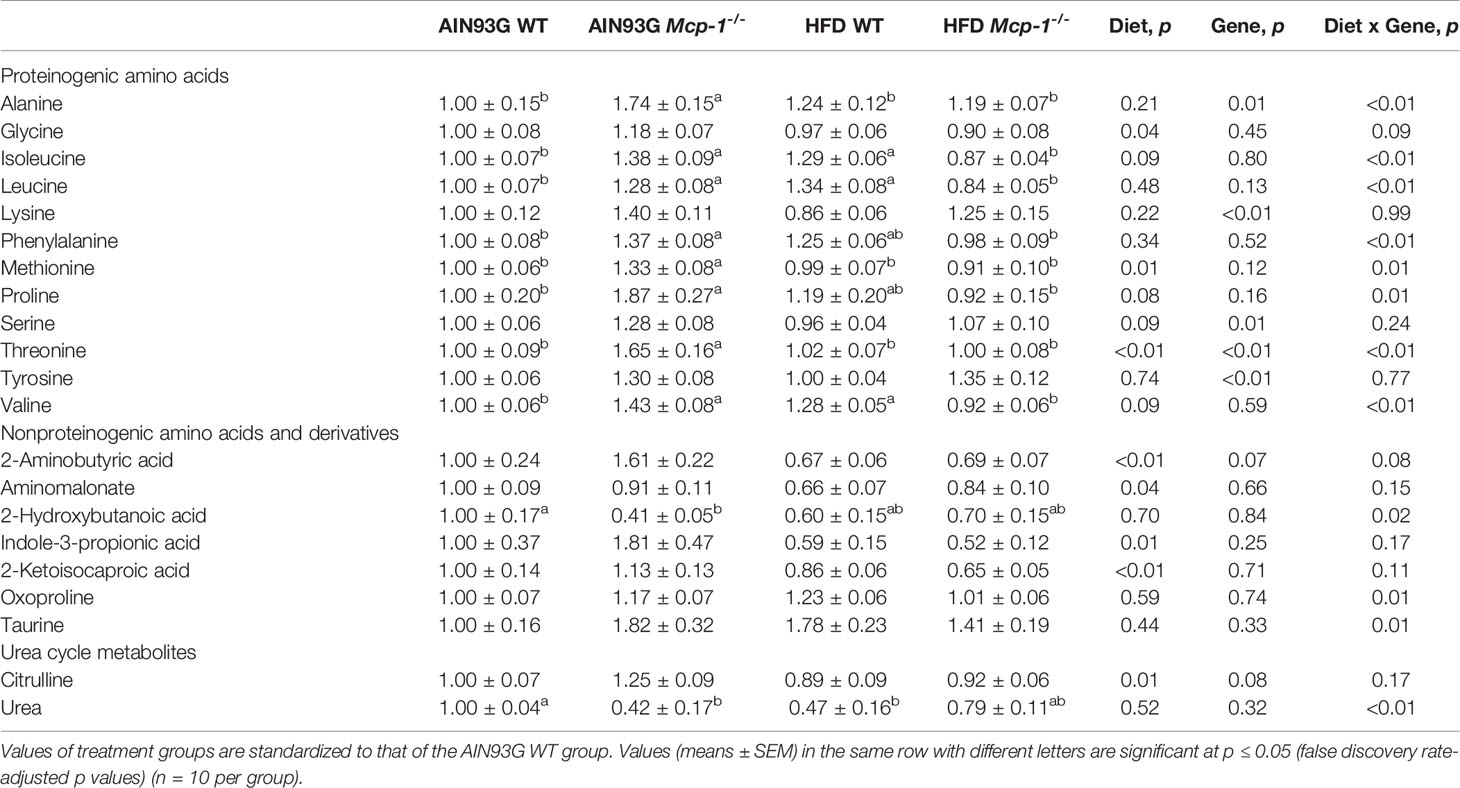
Table 2 Identified plasma metabolites related to amino acid metabolism that differed in MMTV-PyMT mice with or without adipose monocyte chemotactic protein-1 knockout [Mcp-1-/- or wild-type (WT)] and fed the AIN93G or high-fat diet (HFD).
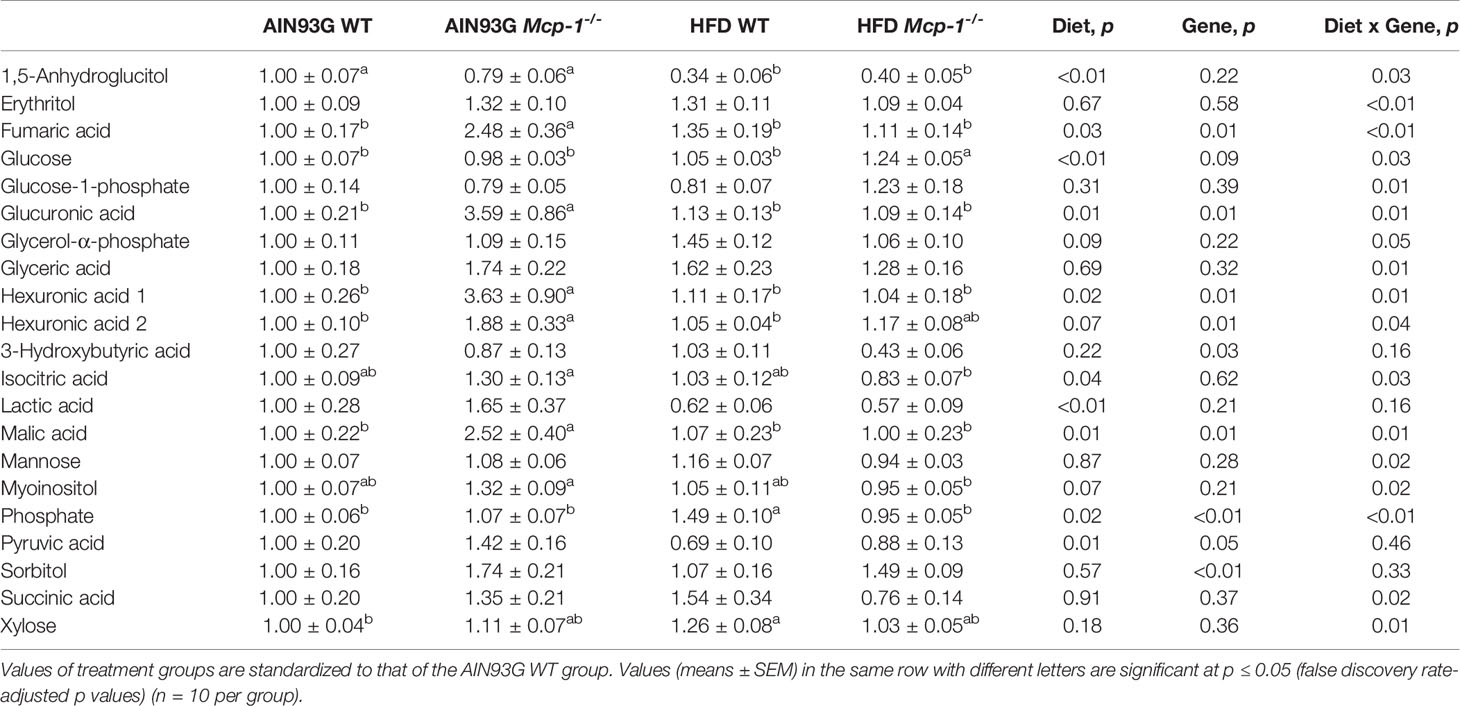
Table 3 Identified plasma metabolites related to carbohydrate metabolism that differed in MMTV-PyMT mice with or without adipose monocyte chemotactic protein-1 knockout [Mcp-1-/- or wild-type (WT)] and fed the AIN93G or high-fat diet (HFD).
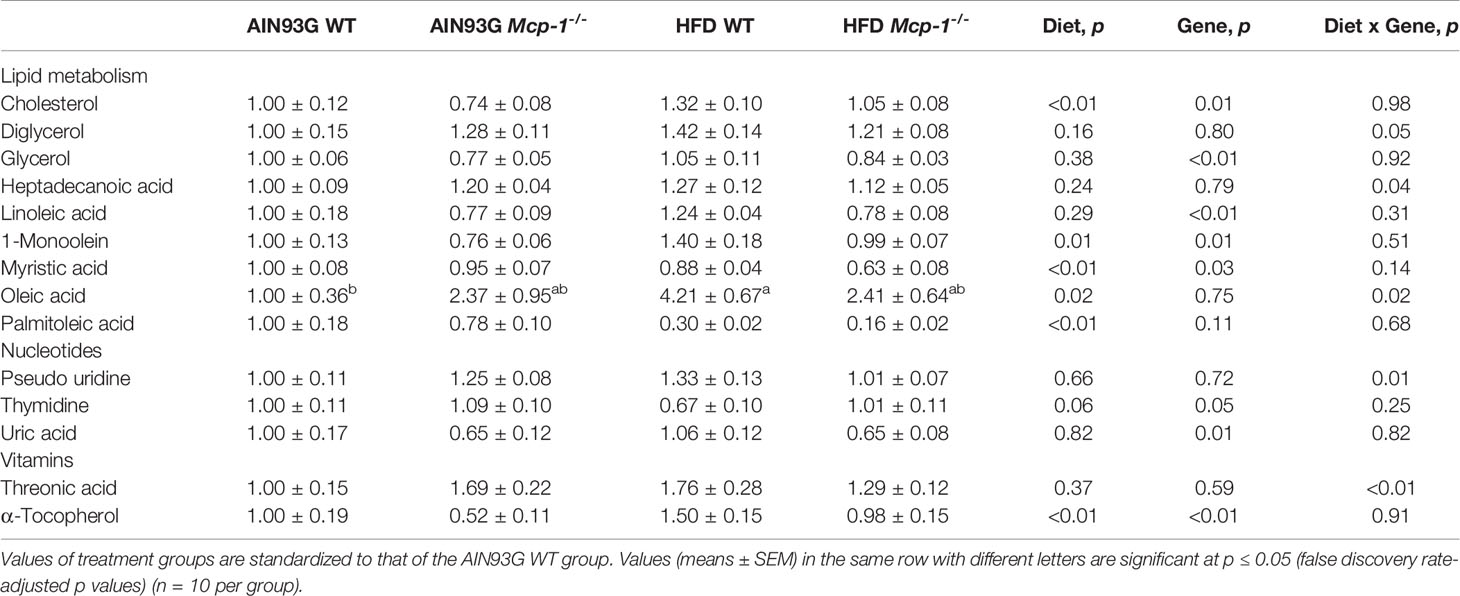
Table 4 Identified plasma metabolites related to lipid, nucleotide, and vitamin metabolisms that differed in MMTV-PyMT mice with or without adipose monocyte chemotactic protein-1 knockout [Mcp-1-/- or wild-type (WT)] and fed the AIN93G or high-fat diet (HFD).
The heatmap analysis of plasma metabolites provided intuitive visualization of the results. It produced five responsive clusters, 1) those that elevated in WT mice fed the HFD, 2) those that elevated in Mcp-1-/- mice regardless of diet, 3) those that remained relatively high in mice fed the AIN93G diet regardless of genotype, 4) those that elevated in Mcp-1-/- mice fed the AIN93G diet and WT mice fed the HFD, and 5) those that were higher in Mcp-1-/- mice fed the AIN93G diet compared to other groups (Figure 4).
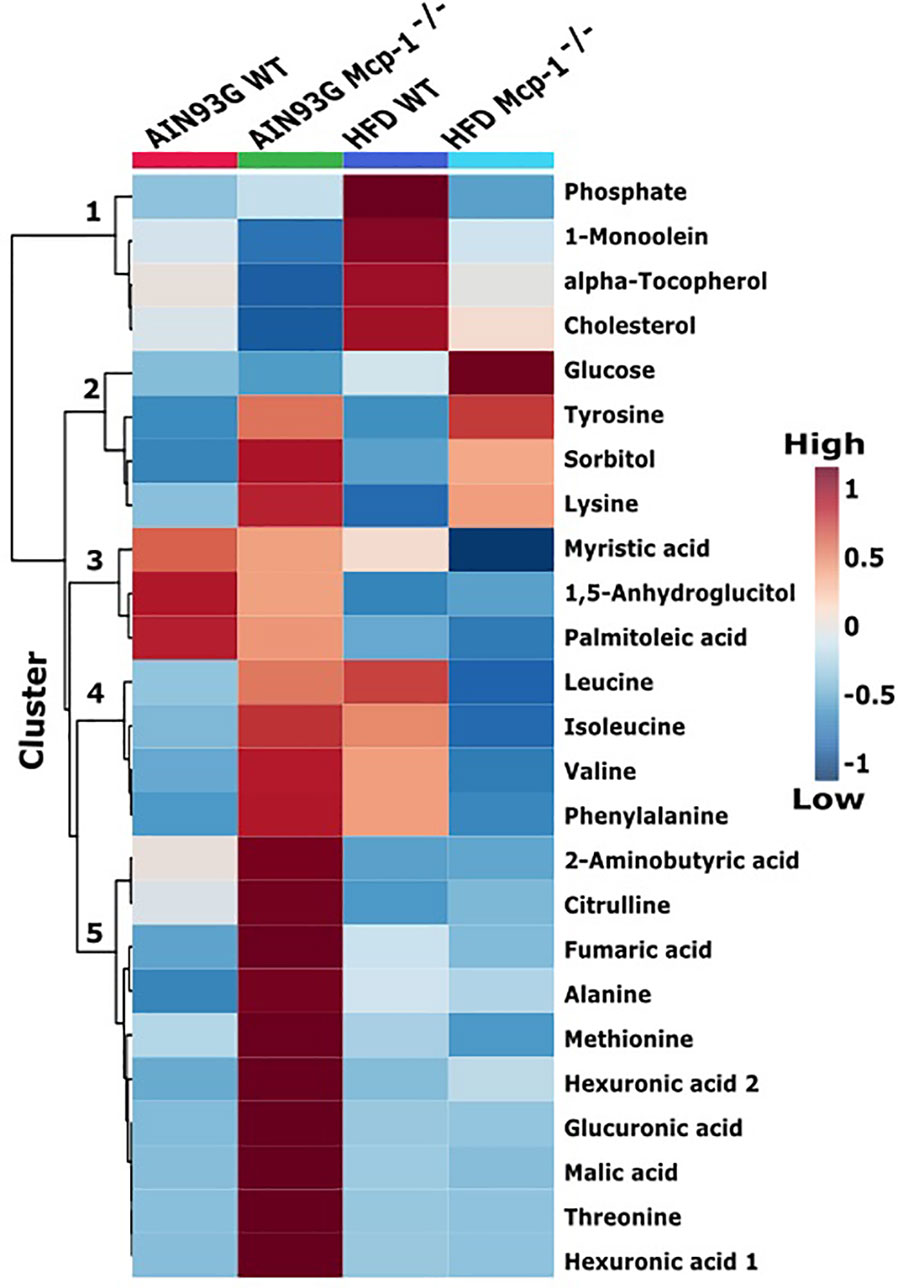
Figure 4 Hierarchical clustering heatmap of the top 25 plasma metabolites that differ among the four dietary groups. AIN WT (red): wild-type mice fed the AIN93G diet; AIN Mcp-1-/- (green): Mcp-1-/- mice fed the AIN93G diet; HFD WT (blue): wild-type mice fed the high-fat diet; HFD Mcp-1-/- (cyan): Mcp-1-/- mice fed the high-fat diet. Each cell on the map represents the group average of a metabolite (n = 10 per group).
The sPLSDA scores plot showed separations by diet and genotype (Figures 5, 6). Along the x-axis, component 1 showed that WT mice fed the HFD and Mcp-1-/- mice fed the AIN93G diet were separated from WT mice fed the AIN93G diet whereas Mcp-1-/- mice fed the HFD remained similar to WT mice fed the AIN93G diet (Figure 5A). The loadings plot for component 1 identified the amino acids (alanine, isoleucine, leucine, phenylalanine, threonine, and valine) and carbohydrate metabolites (fumaric acid, glucuronic acid, hexuronic acid, and malic acid) as major determinants of separation (Figure 6A).
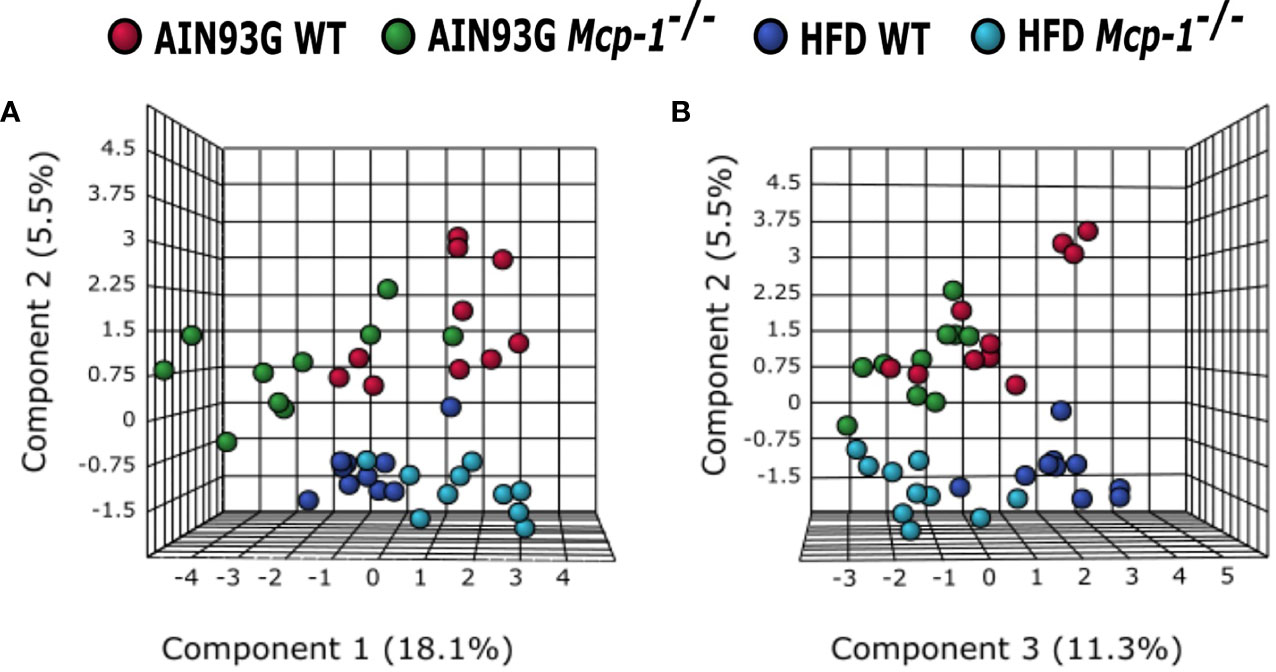
Figure 5 Sparse partial least square discriminant analysis of the plasma metabolome among the four dietary groups. (A) Components 1 vs 2; (B) Components 2 vs 3. AIN WT (red): wild-type mice fed the AIN93G diet; AIN Mcp-1-/- (green): Mcp-1-/- mice fed the AIN93G diet; HFD WT (blue): wild-type mice fed the high-fat diet; HFD Mcp-1-/- (cyan): Mcp-1-/- mice fed the high-fat diet (n = 10 per group).
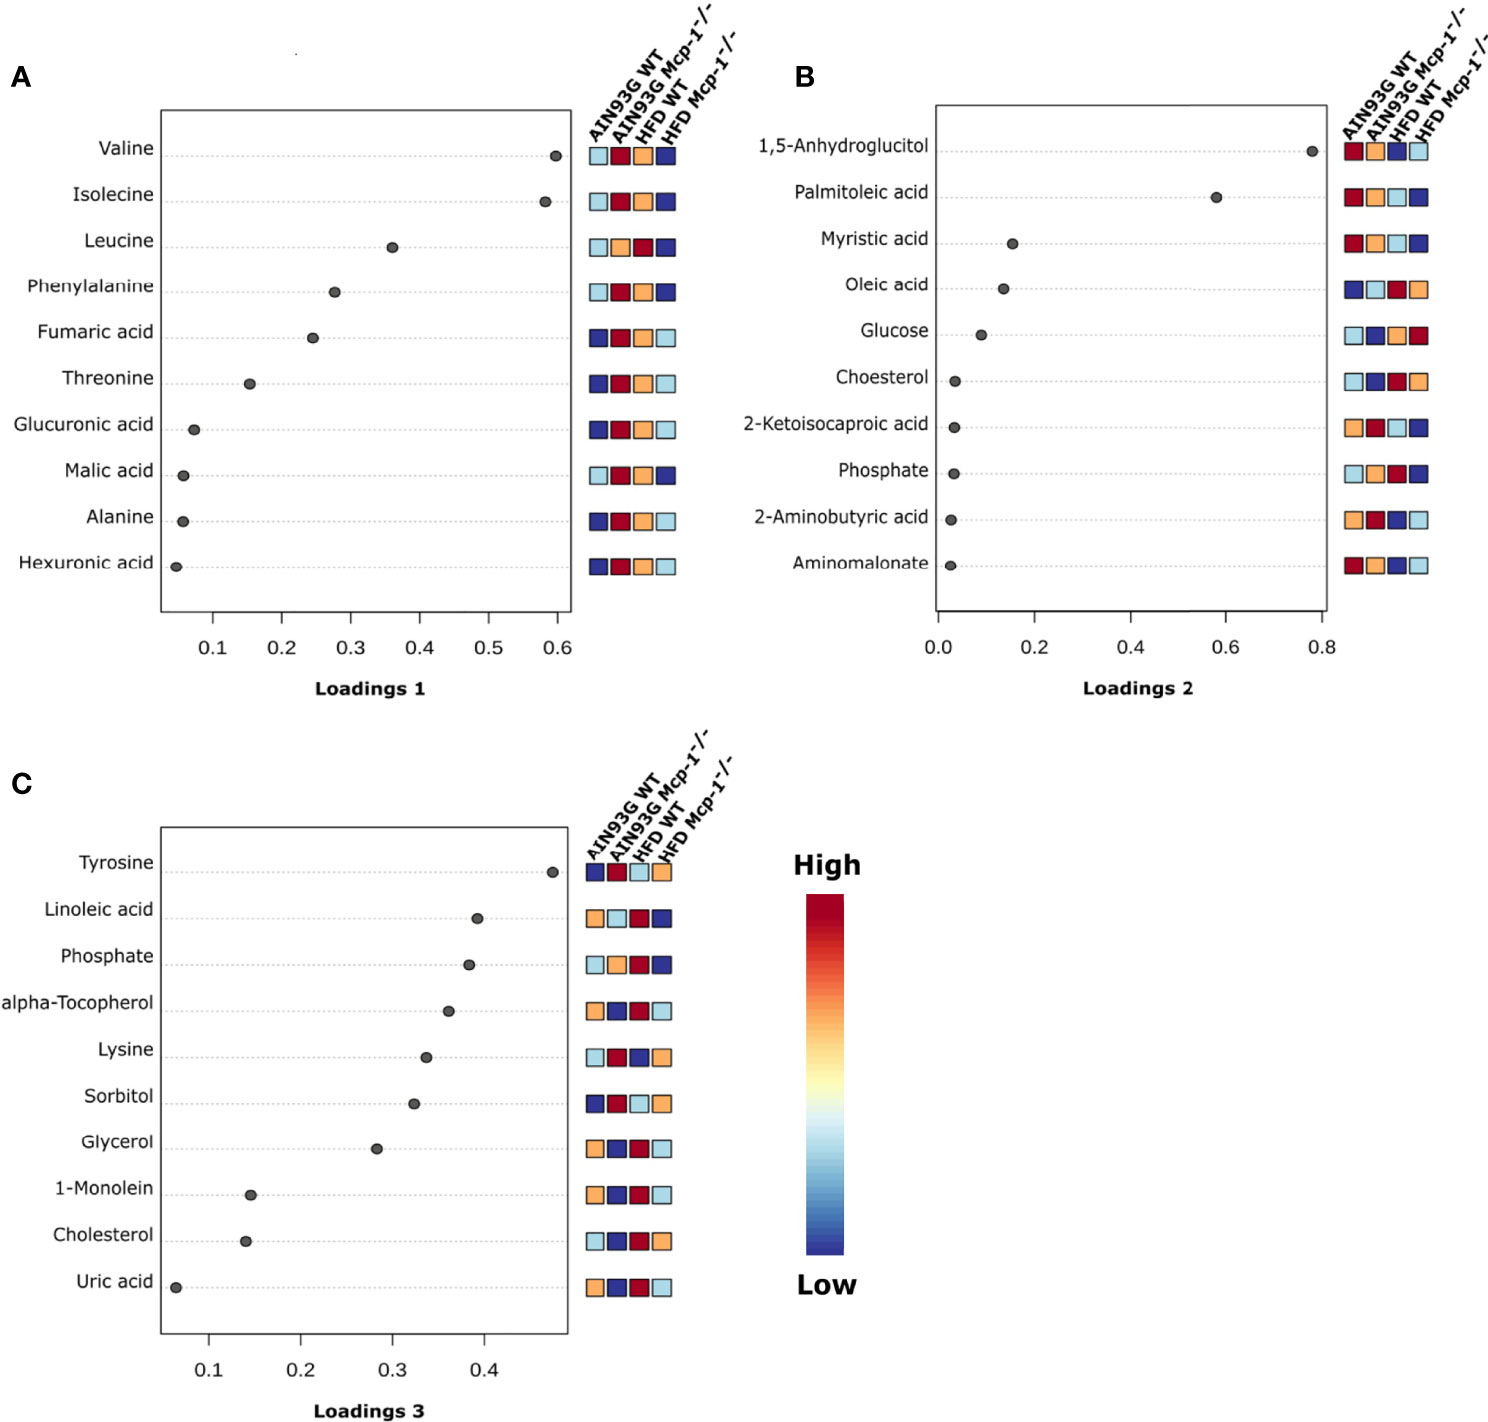
Figure 6 Loadings plots of the 10 metabolites that are the most influential in treatment separation among the four groups for components 1 (A), 2 (B), and 3 (C) (n = 10 per group).
Along the y-axis, component 2 separated the groups into two categories based upon the diet, mice fed the AIN93G diet and mice fed the HFD, regardless of genotype (Figure 5A). The loadings plot for component 2 identified carbohydrate metabolites (1,5-anhydroglucitol, glucose, and phosphate), cholesterol, fatty acids (myristic acid, oleic acid, and palmitoleic acid), and amino acid derivatives (2-aminobutyric acid, aminomalonate, and 2-ketoisocapronic acid) as major determinants of separation (Figure 6B).
Along the x-axis, component 3 separated HFD-fed mice, but not AIN93G-fed mice, by genotype (Figure 5B). The loadings plot for component 3 identified amino acids (lysine and tyrosine), carbohydrate metabolites (phosphate and sorbitol), cholesterol, linoleic acid, lipid metabolites (glycerol and 1-monoolein), vitamin α-tocopherol and uric acid as major determinants of separation (Figure 6C).
Pathway Analysis
Pathway analysis was conducted to determine metabolic pathways that were altered in MMTV-PyMT mice. The identified metabolites (Supplementary Table 2) were mapped into 55 metabolic pathways according to the KEGG database (35, 41). Six pathways were altered the most (Table 5 and Figure 7). These included aminoacyl-tRNA biosynthesis, arginine biosynthesis, valine, leucine and isoleucine biosynthesis, alanine, aspartate and glutamate metabolism, glyoxylate and dicarboxylate metabolism, and citrate cycle (Table 5).
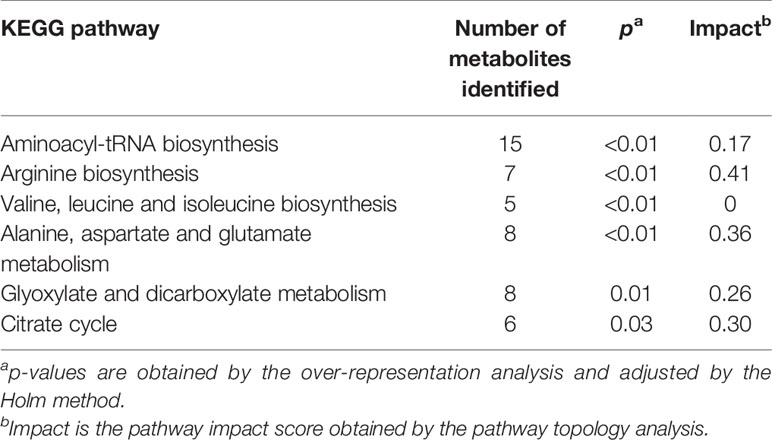
Table 5 Metabolic pathways identified by the pathway analysis that are significantly altered in MMTV-PyMT mice.
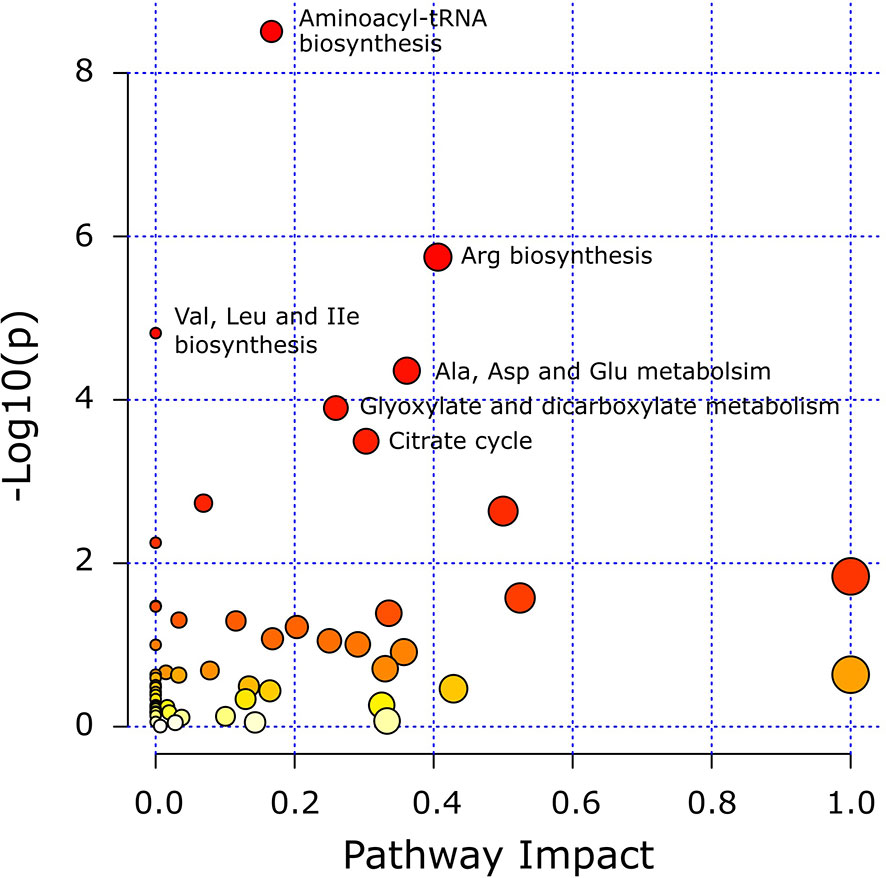
Figure 7 Matched metabolic pathway plot by using identified metabolites in MMTV-PyMT mice. The x-axis marks the pathway impact. The y-axis marks the pathway enrichment. Each node represents a pathway. The nodes with larger sizes and darker colors (from yellow to red) positioning towards top right region represent higher pathway impact values and higher pathway enrichment. Pathways that are significantly altered are presented with their names next to their nodes and are in Table 5. All detected metabolic pathways are presented in Supplementary Table 2.
Network Analysis
Network analysis of plasma metabolites by using the KEGG Global Metabolic Network identified 9 metabolic pathways that differed between the AIN93G diet and HFD, regardless of genotype (Table 6). These pathways were glycine, serine, and threonine metabolism, valine, leucine, and isoleucine biosynthesis, arginine biosynthesis, citrate cycle, pyruvate metabolism, glycolysis/gluconeogenesis, alanine, aspartate, and glutamine metabolism, glyoxylate and dicarboxylate metabolism, and cysteine and methionine metabolism (Table 6). Nine pathways differed between WT and Mcp-1-/- mice, regardless of diet (Table 6). These included alanine, aspartate, and glutamine metabolism, glycine, serine, and threonine metabolism, tyrosine metabolism, citrate cycle, pyruvate metabolism, galactose metabolism, phenylalanine, tyrosine, and tryptophan biosynthesis, linoleic metabolism, and biotin metabolism (Table 6). Three pathways differed when HFD-fed Mcp-1-/- mice were compared to HFD-fed WT mice (Table 6). They were valine, leucine, and isoleucine biosynthesis, valine, leucine, and isoleucine degradation, and pantothenate and CoA biosynthesis (Table 6). Networks of the metabolites mapped by the Metabolite-Metabolite Interaction Network between AIN93G diet and HFD, between WT and Mcp-1-/- mice, and between the HFD-fed Mcp-1-/- and the HFD-fed WT mice are in Figures 8A, B, and 9, respectively; their network statistics are in Supplementary Table 3.
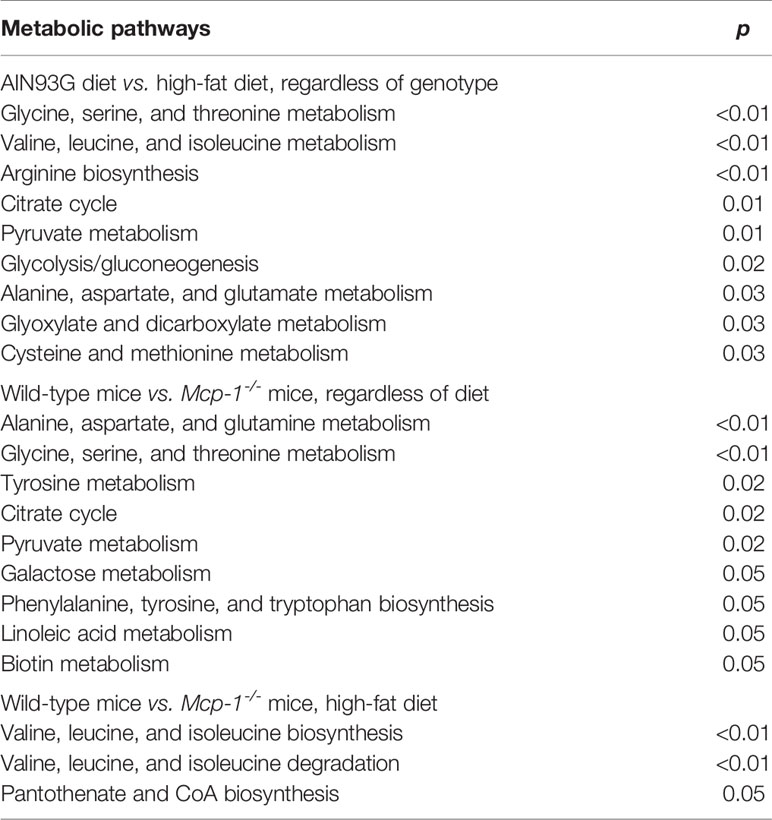
Table 6 Metabolic pathways identified by the KEGG Global Metabolic Network that are significantly altered by the diet (AIN93G vs. high-fat diet) and genotype (wild-type vs. Mcp-1-/-) in MMTV-PyMT mice with or without adipose monocyte chemotactic protein-1 knockout (Mcp-1-/- or wild-type) and fed the AIN93G or high-fat diet.
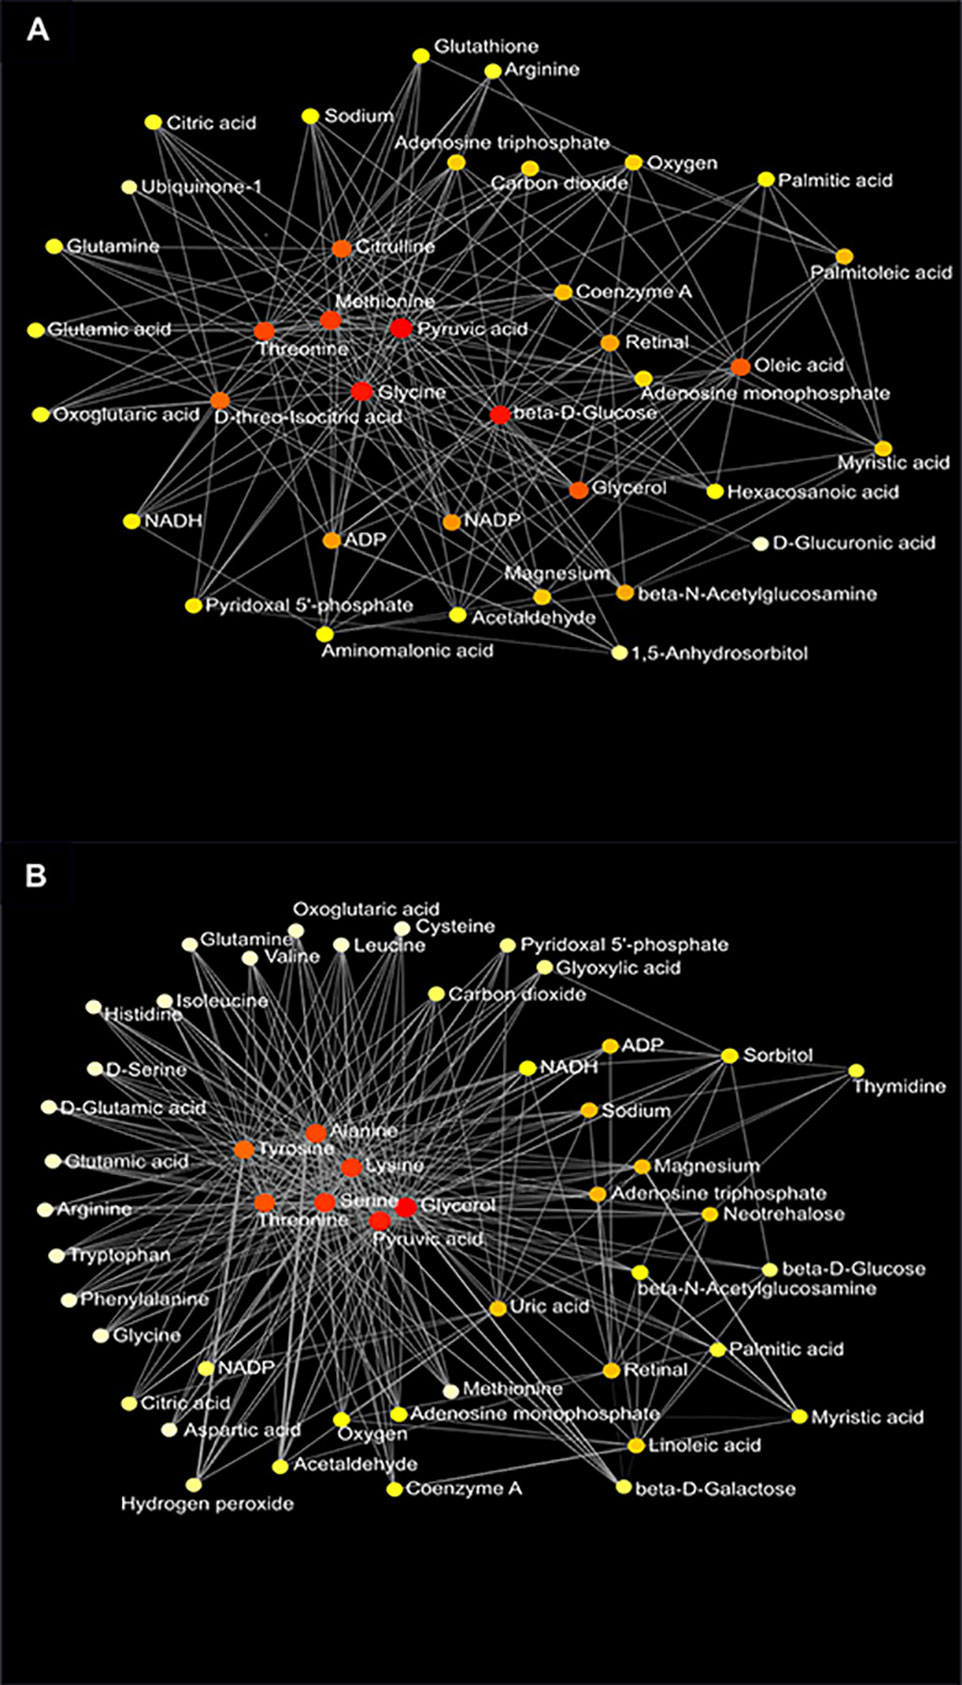
Figure 8 Metabolic network of plasma metabolites between the AIN93G and high-fat diet (A) and between wild-type and Mcp-1-/- mice (B). Colors, from white-yellow to red, indicate levels of impact the metabolites have on the network in an ascending order (the number of connections a node has to other nodes and the number of shortest paths going through the node). Network statistics for (A, B) are presented in Supplementary Table 3.
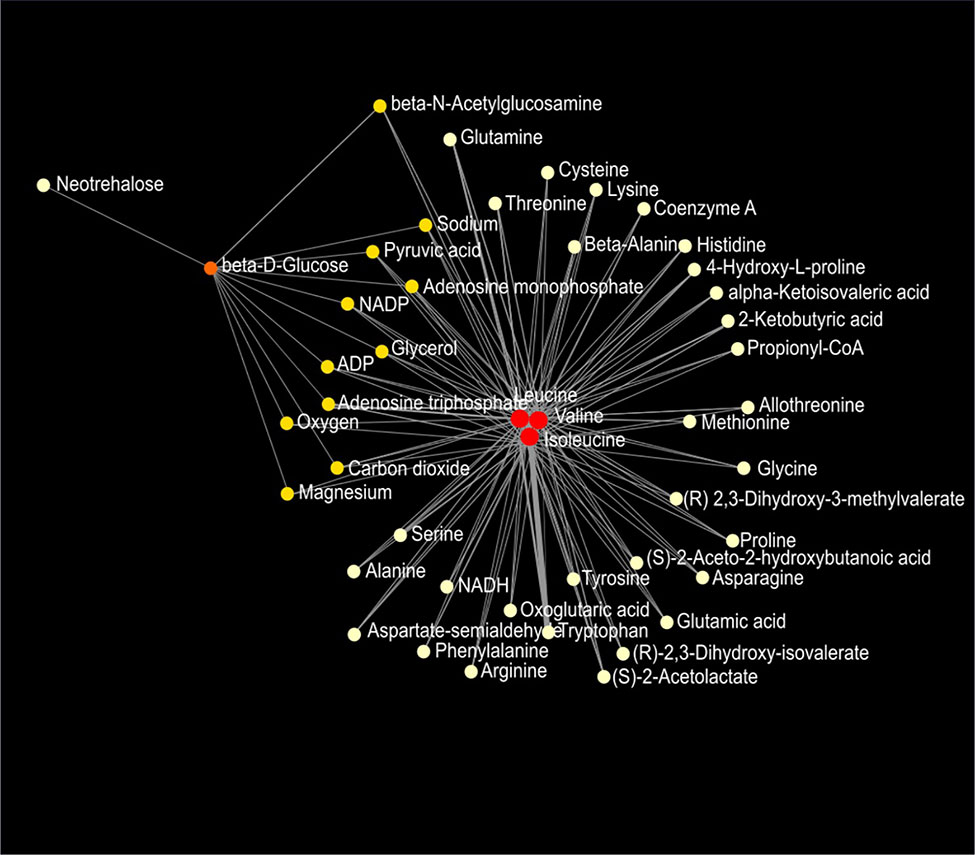
Figure 9 Metabolic network of plasma metabolites between wild-type and Mcp-1-/- mice fed the high-fat diet. Colors, from white-yellow to red, indicate levels of impact the metabolites have to the network in an ascending order (the number of connections a node has to other nodes and the number of shortest paths going through the node). Network statistics are presented in Supplementary Table 3.
Discussion
The present study showed that adipose-derived MCP-1 contributed to mammary tumorigenesis in male MMTV-PyMT mice. We have three important findings with this male breast cancer model. First, mammary tumorigenesis is slow and less aggressive in male MMTV-PyMT mice. This is evidenced by a longer latency before detection of palpable mammary tumors (17.4 weeks) and a lower tumor incidence (56%) compared to female MMTV-PyMT mice reported to have a shorter latency (6 to 8 weeks) and 100% tumor incidence (24, 28, 43). The observed delay in onset of mammary tumorigenesis is consistent with a previous report showing a 14-week tumor latency with a 70% tumor incidence in male MMTV-PyMT mice (44). Findings from this study support clinical observations that breast cancer occurs late in life in men than that in women (9).
Second, mammary tumorigenesis in male MMTV-PyMT mice responds to dietary changes, evidenced by the increased tumor progression in mice fed the HFD. Mice fed the HFD gained body fat mass. Diet-induced obesity enhances mammary tumorigenesis in female MMTV-PyMT mice (24, 28, 43). Adipose tissue, considered an endocrine organ, produces proinflammatory cytokines that can be tumorigenic in rodent models of cancer, including the MMTV-PyMT model (24, 28, 43). Results from this study suggest that adipose-derived cytokines may be responsible, at least partly, for the HFD-enhanced mammary tumorigenesis in male mice.
Third, adipose-derived MCP-1 contributes to mammary tumorigenesis in male MMTV-PyMT mice. This is demonstrated by longer latency and lower tumor incidence, tumor progression, and tumor weight in Mcp-1-/- mice. These observations are MCP-1 specific and independent on body fat, because there were no differences in body fat mass between Mcp-1-/- and WT mice, particularly those fed the HFD. These findings are consistent with a previous report that adipose MCP-1 deficiency mitigates mammary tumorigenesis in female MMTV-PyMT mice (24).
In this study, we analyzed plasma metabolome in male MMTV-PyMT mice. Pathway analysis showed disturbances in metabolic pathways in MMTV-PyMT mice. The two most significant alterations are pathways related to amino acid and carbohydrate metabolisms. The aminoacyl-tRNA biosynthesis pathway is important in protein synthesis (45). It is a group of aminoacyl-tRNA synthetases that catalyze aminoacylations by covalently linking an amino acid to its cognate tRNA in the first step of protein translation. This includes glycine, serine, and threonine metabolism, valine, leucine and isoleucine biosynthesis, arginine biosynthesis, alanine, aspartate and glutamate metabolism, and phenylalanine, tyrosine, and tryptophan biosynthesis identified by the network analysis in MMTV-PyMT mice.
Alteration in the citrate cycle and pyruvate metabolism is an evidence of disturbed carbohydrate metabolism. However, it is interest to find the glyoxylate and dicarboxylate metabolism pathway in MMTV-PyMT mice. The glyoxylate cycle, a modification of the citrate cycle, was found in plants and some microorganisms but not in animals because animals lack two key enzymes of the cycle (isocitrate lyase and malate synthase). However, available studies have showed that the glyoxylate cycle occurs in animals (46, 47). The detection of isocitric acid and malic acid in plasma of MMTV-PyMT mice support the existence of the glyoxylate cycle in these mice. The potential involvement of glyoxylate and dicarboxylate metabolism in altered carbohydrate metabolism in MMTV-PyMT mice and its impact on mammary tumorigenesis certainly warrant further investigation.
Results from the network analysis support findings from the pathway analysis. It further demonstrates that both the HFD and adipose MCP-1 deficiency alter amino acid and carbohydrate metabolisms in male MMTV-PyMT mice. It is particularly interesting that both branched-chain amino acid (BCAA) biosynthesis and degradation pathways were altered when HFD-fed Mcp-1-/- mice were compared to their WT counterparts. Our findings of accelerated BCAA metabolism support the clinical observations of disturbed BCAA metabolism in human breast cancer patients (48, 49).
Heatmap analysis illustrates the top 25 metabolites that are major determinants in separation of the four dietary groups. The expression of 17 of them was higher in AIN93G-fed Mcp-1-/- mice than in their WT counterparts. These include essential amino acids (isoleucine, leucine, lysine, methionine, phenylalanine, threonine, and valine), nonessential amino acids (alanine and tyrosine), amino acid metabolites (2-aminobutyric acid and citrulline), metabolites of carbohydrate metabolism (fumaric acid, glucuronic acid, malic acid, and sorbitol), and fatty acid metabolite hexuronic acids. These findings indicate that MCP-1 deficiency may have altered metabolism in AIN93G-fed mice, particularly amino acid metabolism, and that adipose-derived MCP-1 may contribute to metabolic homeostasis in mice fed a non-obesogenic diet. It is interest to note that the expression of 14 of these 17 metabolites (except lysine, sorbitol, and tyrosine) were lower in HFD-fed Mcp-1-/- mice. It suggests that a high-energy intake may attenuate, at least partly, the metabolic alterations caused by adipose MCP-1 deficiency.
Multivariate and clustered heatmap analyses showed the separation of plasma metabolome among the four groups. Component 1 of the sPLSDA scores plot showed that clusters of WT mice differed by diet. However, the cluster of HFD-fed Mcp-1-/- mice remained similar to that of AIN93G-fed WT controls. This is the case for the major determinant metabolites shown in the loadings plot for component 1, in which BCAAs and phenylalanine are major determinants that separate the dietary groups. BCAAs account for one-third dietary essential amino acids and make up 20% of total protein content (50). BCAAs, specifically leucine, activate mammalian target of rapamycin complex (mTORC) signal pathway that is essential for initiation of protein synthesis (51, 52). Elevated expression of BCAAs in HFD-fed WT mice, compared to that in AIN93G-fed WT mice, are consistent with findings from both human and rodent studies (53, 54) and support the concept that the impaired BCAA catabolic pathway in obesity leads to BCAA buildup in the blood (53, 54). Significantly lower expression of BCAAs in HFD-fed Mcp-1-/- mice, compared to that in HFD-fed WT mice, indicates that adipose MCP-1 deficiency may attenuate the impaired BCAA metabolism in mice fed an obesogenic diet.
The elevated expression of four metabolites (cholesterol, phosphate, 1-monoolein, and α-tocopherol) identified by the heatmap in HFD-fed WT mice suggests accelerated metabolism in mice fed an obesogenic diet. Phosphate is involved in many anabolic and catabolic metabolisms. Cholesterol is essential for membrane biogenesis and a precursor for steroid hormone synthesis. Cholesterol is elevated in mammary tumors in MMTV-PyMT mice fed an HFD (55). Hypercholesterolemia promotes mammary tumorigenesis in MMTV-PyMT mice (56, 57). Elevations in α-tocopherol (an essential nutrient) and 1-monoolein (a major hydrolysis product of dietary triacylglycerol) (58) indicate an increase in nutrient uptake from the diet and an up-regulation in lipolysis of triacylglycerol in these mice. The attenuated expression of these metabolites in HFD-fed Mcp-1-/- mice suggests that adipose-derived MCP-1 may contribute to the diet-induced metabolic dysregulation in WT mice.
The significant elevation in glucose in HFD-fed Mcp-1-/- mice suggests impaired glucose metabolism under the MCP-1 deficiency in mice consuming an obesogenic diet. This elevation is not solely due to MCP-1 deficiency nor HFD alone, because such elevation was not observed in Mcp-1-/- mice fed the AIN93G diet nor WT mice fed the HFD. Rather, it is likely an interaction between MCP-1 deficiency and the HFD. The impairment is supported by the lower expression of 1,5-anhydroglucitol in these HFD-fed Mcp-1-/- mice. 1,5-Anhydroglucitol is a marker of glycemic control; its blood level is inversely correlated with blood glucose (59). Cancer cells demand high glucose uptake for their rapid, uncontrolled proliferation (60). The roles of adipose-derived MCP-1 in glucose metabolism under the obesogenic condition and its impact on mammary tumorigenesis warrant further investigation.
We found there were no differences in plasma concentrations of MCP-1 between Mcp-1-/- and WT mice fed the AIN93G diet. In this study, the expression of Mcp-1 in adipose tissue was low in Mcp-1-/- mice. However, it does not exclude the possibility that MCP-1 from non-adipose tissue may contribute to plasma concentrations in mice consuming the AIN93G diet. Nevertheless, significant decreases in plasma MCP-1 in HFD-fed Mcp-1-/- mice, compared to their WT counterparts, demonstrates the validity of the model and that decreases in plasma MCP-1 are a result of MCP-1 deficiency in adipose tissue.
A limitation of this study is that we were not able to analyze plasma metabolome from tumor-bearing mice because few mice, particularly Mcp-1-/- mice, developed palpable mammary tumors. This made us unable to examine the metabolic profile in the presence of mammary tumor. Furthermore, cautions should be taken in data interpretation, as the observed plasma alterations could be results from undetected nonpalpable tumors, stromal or systematic changes, or their combinations. Nevertheless, this study showed plasma metabolome in mice carrying PyMT oncogene and its changes resulted from adipose Mcp-1 knockout and high-fat consumption. To our knowledge, this is the first study providing an assessment of plasma metabolic profile in this male MMTV-PyMT breast cancer model. Metabolomics differences between mammary tumors and mammary glands and the resulting systematic changes by adipose MCP-1 deficiency certainly warrant further investigation.
In summary, the present study showed that adipose-specific MCP-1 deficient mice had longer tumor latency and lower tumor incidence, tumor progression, and tumor burden compared to WT mice. It indicates that adipose-derived MCP-1 may contribute to mammary tumorigenesis in male MMTV-PyMT mice. Plasma metabolomics analysis identified 56 metabolites that differed significantly among the four dietary groups. Pathway and network analyses of the identified metabolites showed that amino acid and carbohydrate metabolisms are the most disturbed pathways in MMTV-PyMT mice. These metabolomics findings warrant further investigation on the role of adipose-derived MCP-1 in causal relationships between cancer metabolism and mammary tumorigenesis with this MMTV-PyMT model and through which to build strategies for prevention and treatment of male breast cancer.
Data Availability Statement
The original results for this study are presented in the article/Supplementary Material. Further inquiries can be directed to the corresponding author.
Ethics Statement
The animal study was reviewed and approved by The Institutional Animal Care and Use Committee, Grand Forks Human Nutrition Research Center, Grand Forks, ND, USA.
Author Contributions
LY and SS designed the study, conducted experiments, and collected and analyzed data. All authors contributed to data interpretation, wrote and revised the manuscript, and agreed to be accountable for the content of the work.
Funding
This work was funded by the USDA Agricultural Research Service Projects #3062-51000-050-00D and #3062-51000-056-00D.
Conflict of Interest
The authors declare that the research was conducted in the absence of any commercial or financial relationships that could be construed as a potential conflict of interest.
Publisher’s Note
All claims expressed in this article are solely those of the authors and do not necessarily represent those of their affiliated organizations, or those of the publisher, the editors and the reviewers. Any product that may be evaluated in this article, or claim that may be made by its manufacturer, is not guaranteed or endorsed by the publisher.
Acknowledgments
The authors gratefully acknowledge the assistance the following staff of the Grand Forks Human Nutrition Research Center: Lana DeMars, Shawn Krueger, and Jack He for technical support, Dr. Susan Komanetsky for suggestions to manuscript revision, and vivarium staff for preparing experimental diets and providing high-quality animal care.
Supplementary Material
The Supplementary Material for this article can be found online at: https://www.frontiersin.org/articles/10.3389/fonc.2021.667843/full#supplementary-material
References
1. White J, Kearins O, Dodwell D, Horgan K, Hanby AM, Speirs V. Male Breast Carcinoma: Increased Awareness Needed. Breast Cancer Res (2011) 13:219. doi: 10.1186/bcr2930
2. Stalsberg H, Thomas DB, Rosenblatt KA, Jimenez LM, Mctiernan A, Stemhagen A, et al. Histologic Types and Hormone Receptors in Breast Cancer in Men: A Population-Based Study in 282 United States Men. Cancer Causes Control (1993) 4:143–51. doi: 10.1007/BF00053155
3. Foerster R, Schroeder L, Foerster F, Wulff V, Schubotz B, Baaske D, et al. Metastatic Male Breast Cancer: A Retrospective Cohort Analysis. Breast Care (Basel) (2014) 9:267–71. doi: 10.1159/000365953
4. Liu N, Johnson KJ, Ma CX. Male Breast Cancer: An Updated Surveillance, Epidemiology, and End Results Data Analysis. Clin Breast Cancer (2018) 18:e997–e1002. doi: 10.1016/j.clbc.2018.06.013
5. Kornegoor R, Verschuur-Maes AH, Buerger H, Hogenes MC, De Bruin PC, Oudejans JJ, et al. Molecular Subtyping of Male Breast Cancer by Immunohistochemistry. Mod Pathol (2012) 25:398–404. doi: 10.1038/modpathol.2011.174
6. Parise CA, Caggiano V. Breast Cancer Survival Defined by the ER/PR/HER2 Subtypes and a Surrogate Classification According to Tumor Grade and Immunohistochemical Biomarkers. J Cancer Epidemiol (2014) 2014:469251. doi: 10.1155/2014/469251
7. Herschkowitz JI, Simin K, Weigman VJ, Mikaelian I, Usary J, Hu Z, et al. Identification of Conserved Gene Expression Features Between Murine Mammary Carcinoma Models and Human Breast Tumors. Genome Biol (2007) 8:R76. doi: 10.1186/gb-2007-8-5-r76
8. Guy CT, Cardiff RD, Muller WJ. Induction of Mammary Tumors by Expression of Polyomavirus Middle T Oncogene: A Transgenic Mouse Model for Metastatic Disease. Mol Cell Biol (1992) 12:954–61. doi: 10.1128/MCB.12.3.954
9. Giordano SH, Buzdar AU, Hortobagyi GN. Breast Cancer in Men. Ann Intern Med (2002) 137:678–87. doi: 10.7326/0003-4819-137-8-200210150-00013
10. Loi S, Milne RL, Friedlander ML, Mccredie MR, Giles GG, Hopper JL, et al. Obesity and Outcomes in Premenopausal and Postmenopausal Breast Cancer. Cancer Epidemiol Biomarkers Prev (2005) 14:1686–91. doi: 10.1158/1055-9965.EPI-05-0042
11. Carmichael AR. Obesity and Prognosis of Breast Cancer. Obes Rev (2006) 7:333–40. doi: 10.1111/j.1467-789X.2006.00261.x
12. Lumeng CN, Saltiel AR. Inflammatory Links Between Obesity and Metabolic Disease. J Clin Invest (2011) 121:2111–7. doi: 10.1172/JCI57132
13. Weisberg SP, Mccann D, Desai M, Rosenbaum M, Leibel RL, Ferrante AW Jr. Obesity Is Associated With Macrophage Accumulation in Adipose Tissue. J Clin Invest (2003) 112:1796–808. doi: 10.1172/JCI19246
14. Christiansen T, Richelsen B, Bruun JM. Monocyte Chemoattractant Protein-1 Is Produced in Isolated Adipocytes, Associated With Adiposity and Reduced After Weight Loss in Morbid Obese Subjects. Int J Obes (Lond) (2005) 29:146–50. doi: 10.1038/sj.ijo.0802839
15. Chen A, Mumick S, Zhang C, Lamb J, Dai H, Weingarth D, et al. Diet Induction of Monocyte Chemoattractant Protein-1 and its Impact on Obesity. Obes Res (2005) 13:1311–20. doi: 10.1038/oby.2005.159
16. Sartipy P, Loskutoff DJ. Monocyte Chemoattractant Protein 1 in Obesity and Insulin Resistance. Proc Natl Acad Sci USA (2003) 100:7265–70. doi: 10.1073/pnas.1133870100
17. Lebrecht A, Grimm C, Lantzsch T, Ludwig E, Hefler L, Ulbrich E, et al. Monocyte Chemoattractant Protein-1 Serum Levels in Patients With Breast Cancer. Tumour Biol (2004) 25:14–7. doi: 10.1159/000077718
18. Daniell HW. Increased Lymph Node Metastases at Mastectomy for Breast Cancer Associated With Host Obesity, Cigarette Smoking, Age, and Large Tumor Size. Cancer (1988) 62:429–35. doi: 10.1002/1097-0142(19880715)62:2<429::AID-CNCR2820620230>3.0.CO;2-4
19. Weisberg SP, Hunter D, Huber R, Lemieux J, Slaymaker S, Vaddi K, et al. CCR2 Modulates Inflammatory and Metabolic Effects of High-Fat Feeding. J Clin Invest (2006) 116:115–24. doi: 10.1172/JCI24335
20. Kanda H, Tateya S, Tamori Y, Kotani K, Hiasa K, Kitazawa R, et al. MCP-1 Contributes to Macrophage Infiltration Into Adipose Tissue, Insulin Resistance, and Hepatic Steatosis in Obesity. J Clin Invest (2006) 116:1494–505. doi: 10.1172/JCI26498
21. Fang WB, Yao M, Brummer G, Acevedo D, Alhakamy N, Berkland C, et al. Targeted Gene Silencing of CCL2 Inhibits Triple Negative Breast Cancer Progression by Blocking Cancer Stem Cell Renewal and M2 Macrophage Recruitment. Oncotarget (2016) 7:49349–67. doi: 10.18632/oncotarget.9885
22. Cranford TL, Velazquez KT, Enos RT, Bader JE, Carson MS, Chatzistamou I, et al. Loss of Monocyte Chemoattractant Protein-1 Expression Delays Mammary Tumorigenesis and Reduces Localized Inflammation in the C3(1)/SV40Tag Triple Negative Breast Cancer Model. Cancer Biol Ther (2017) 18:85–93. doi: 10.1080/15384047.2016.1276135
23. Yan L, Sundaram S. Monocyte Chemotactic Protein-1 Deficiency Reduces Spontaneous Metastasis of Lewis Lung Carcinoma in Mice Fed a High-Fat Diet. Oncotarget (2016) 7:24792–9. doi: 10.18632/oncotarget.8364
24. Sundaram S, Yan L. Adipose Monocyte Chemotactic Protein-1 Deficiency Reduces High-Fat Diet-Enhanced Mammary Tumorigenesis in MMTV-PyMT Mice. J Nutr Biochem (2020) 77:108313. doi: 10.1016/j.jnutbio.2019.108313
25. Sundaram S, Yan L. Adipose-Specific Monocyte Chemotactic Protein-1 Deficiency Reduces Pulmonary Metastasis of Lewis Lung Carcinoma in Mice. Anticancer Res (2019) 39:1729–38. doi: 10.21873/anticanres.13279
26. Reeves PG, Nielsen FH, Fahey GCJ. AIN-93 Purified Diets for Laboratory Rodents: Final Report of the American Institute of Nutrition Ad Hoc Writing Committee on the Reformulation of the AIN-76A Rodent Diet. J Nutr (1993) 123:1939–51. doi: 10.1093/jn/123.11.1939
27. Institute for Laboratory Animal Research. Guide for the Care and Use of Laboratory Animals. Washington, D.C: National Academies Press (2011). doi: 10.17226/12910
28. Sundaram S, Yan L. High-Fat Diet Enhances Mammary Tumorigenesis and Pulmonary Metastasis and Alters Inflammatory and Angiogenic Profiles in MMTV-PyMT Mice. Anticancer Res (2016) 36:6279–87. doi: 10.21873/anticanres.11223
29. Sundaram S, Freemerman AJ, Johnson AR, Milner JJ, Mcnaughton KK, Galanko JA, et al. Role of HGF in Obesity-Associated Tumorigenesis: C3(1)-TAg Mice as a Model for Human Basal-Like Breast Cancer. Breast Cancer Res Treat (2013) 142:489–503. doi: 10.1007/s10549-013-2741-5
30. Yan L, Demars LC. Effects of Dietary Fat on Spontaneous Metastasis of Lewis Lung Carcinoma in Mice. Clin Exp Metastasis (2010) 27:581–90. doi: 10.1007/s10585-010-9347-7
31. Livak KJ, Schmittgen TD. Analysis of Relative Gene Expression Data Using Real-Time Quantitative PCR and the 2(-Delta Delta C(T)) Method. Methods (2001) 25:402–8. doi: 10.1006/meth.2001.1262
32. Fiehn O, Garvey WT, Newman JW, Lok KH, Hoppel CL, Adams SH. Plasma Metabolomic Profiles Reflective of Glucose Homeostasis in Non-Diabetic and Type 2 Diabetic Obese African-American Women. PLoS One (2010) 5:e15234. doi: 10.1371/journal.pone.0015234
33. Piccolo BD, Keim NL, Fiehn O, Adams SH, Van Loan MD, Newman JW. Habitual Physical Activity and Plasma Metabolomic Patterns Distinguish Individuals With Low vs. High Weight Loss During Controlled Energy Restriction. J Nutr (2015) 145:681–90. doi: 10.3945/jn.114.201574
34. Fiehn O, Wohlgemuth G, Scholz C. Setup and Annotation of Metabolomic Experiments by Integrating Biological and Mass Spectrometric Metadata. In: Ludäscher B, Raschid L, editors. Data Integration in the Life Sciences. Berlin, Heidelberg: Springer (2005). p. 224–39. doi: 10.1007/11530084_18
35. Kanehisa M, Goto S. KEGG: Kyoto Encyclopedia of Genes and Genomes. Nucleic Acids Res (2000) 28:27–30. doi: 10.1093/nar/28.1.27
36. Kanehisa M. Toward Understanding the Origin and Evolution of Cellular Organisms. Protein Sci (2019) 28:1947–51. doi: 10.1002/pro.3715
37. Wishart DS, Feunang YD, Marcu A, Guo AC, Liang K, Vazquez-Fresno R, et al. HMDB 4.0: The Human Metabolome Database for 2018. Nucleic Acids Res (2018) 46:D608–17. doi: 10.1093/nar/gkx1089
38. Xia J, Wishart DS. Using MetaboAnalyst 3.0 for Comprehensive Metabolomics Data Analysis. Curr Protoc Bioinformatics (2016) 55:14 10 11–14 10 91. doi: 10.1002/cpbi.11
39. Van Den Berg RA, Hoefsloot HCJ, Westerhuis JA, Smilde AK, van der Werf MJ. Centering, Scaling, and Transformations: Improving the Biological Information Content of Metabolomics Data. BMC Genomics (2006) 7:142. doi: 10.1186/1471-2164-7-142
40. Xia J, Wishart DS. MetPA: A Web-Based Metabolomics Tool for Pathway Analysis and Visualization. Bioinformatics (2010) 26:2342–4. doi: 10.1093/bioinformatics/btq418
41. Kanehisa M, Furumichi M, Tanabe M, Sato Y, Morishima K. KEGG: New Perspectives on Genomes, Pathways, Diseases and Drugs. Nucleic Acids Res (2017) 45:D353–61. doi: 10.1093/nar/gkw1092
42. Holm SA. A Simple Sequentially Rejective Multiple Test Procedure. Scand J Stat (1979) 6:65–70. doi: 10.2307/4615733
43. Sundaram S, Yan L. Time-Restricted Feeding Mitigates High-Fat Diet-Enhanced Mammary Tumorigenesis in MMTV-PyMT Mice. Nutr Res (2018) 59:72–9. doi: 10.1016/j.nutres.2018.07.014
44. Sundaram S, Yan L. Dietary Supplementation With Methylseleninic Acid Inhibits Mammary Tumorigenesis and Metastasis in Male MMTV-PyMT Mice. Biol Trace Elem Res (2018) 184:186–95. doi: 10.1007/s12011-017-1188-7
45. Rubio Gomez MA, Ibba M. Aminoacyl-tRNA Synthetases. RNA (2020) 26:910–36. doi: 10.1261/rna.071720.119
46. Popov VN, Moskalev EA, Shevchenko MU, Eprintsev AT. Comparative Analysis of the Glyoxylate Cycle Key Enzyme Isocitrate Lyases From Organisms of Different Systemic Groups. J Evol Biochem Physiol (2005) 41:631–9. doi: 10.1007/s10893-006-0004-3
47. Kondrashov FA, Koonin EV, Morgunov IG, Finogenova TV, Kondrashova MN. Evolution of Glyoxylate Cycle Enzymes in Metazoa: Evidence of Multiple Horizontal Transfer Events and Pseudogene Formation. Biol Direct (2006) 1:31. doi: 10.1186/1745-6150-1-31
48. Zhang L, Han J. Branched-Chain Amino Acid Transaminase 1 (BCAT1) Promotes the Growth of Breast Cancer Cells Through Improving mTOR-Mediated Mitochondrial Biogenesis and Function. Biochem Biophys Res Commun (2017) 486:224–31. doi: 10.1016/j.bbrc.2017.02.101
49. Moore SC, Playdon MC, Sampson JN, Hoover RN, Trabert B, Matthews CE, et al. A Metabolomics Analysis of Body Mass Index and Postmenopausal Breast Cancer Risk. J Natl Cancer Inst (2018) 110:588–97. doi: 10.1093/jnci/djx244
50. Harper AE, Miller RH, Block KP. Branched-Chain Amino Acid Metabolism. Annu Rev Nutr (1984) 4:409–54. doi: 10.1146/annurev.nu.04.070184.002205
51. Hong SO, Layman DK. Effects of Leucine on In Vitro Protein Synthesis and Degradation in Rat Skeletal Muscles. J Nutr (1984) 114:1204–12. doi: 10.1093/jn/114.7.1204
52. Wolfson RL, Chantranupong L, Saxton RA, Shen K, Scaria SM, Cantor JR, et al. Sestrin2 Is a Leucine Sensor for the mTORC1 Pathway. Science (2016) 351:43–8. doi: 10.1126/science.aab2674
53. Lackey DE, Lynch CJ, Olson KC, Mostaedi R, Ali M, Smith WH, et al. Regulation of Adipose Branched-Chain Amino Acid Catabolism Enzyme Expression and Cross-Adipose Amino Acid Flux in Human Obesity. Am J Physiol Endocrinol Metab (2013) 304:E1175–87. doi: 10.1152/ajpendo.00630.2012
54. She P, Van Horn C, Reid T, Hutson SM, Cooney RN, Lynch CJ. Obesity-Related Elevations in Plasma Leucine Are Associated With Alterations in Enzymes Involved in Branched-Chain Amino Acid Metabolism. Am J Physiol Endocrinol Metab (2007) 293:E1552–63. doi: 10.1152/ajpendo.00134.2007
55. Yan L, Sundaram S, Rust BM, Picklo MJ, Bukowski MR. Metabolome of Mammary Tumors Differs From Normal Mammary Glands But Is Not Altered by Time-Restricted Feeding Under Obesogenic Conditions. Anticancer Res (2020) 40:3697–705. doi: 10.21873/anticanres.14358
56. Liu J, Xu A, Lam KS, Wong NS, Chen J, Shepherd PR, et al. Cholesterol-Induced Mammary Tumorigenesis Is Enhanced by Adiponectin Deficiency: Role of LDL Receptor Upregulation. Oncotarget (2013) 4:1804–18. doi: 10.18632/oncotarget.1364
57. Llaverias G, Danilo C, Mercier I, Daumer K, Capozza F, Williams TM, et al. Role of Cholesterol in the Development and Progression of Breast Cancer. Am J Pathol (2011) 178:402–12. doi: 10.1016/j.ajpath.2010.11.005
58. Chon SH, Zhou YX, Dixon JL, Storch J. Intestinal Monoacylglycerol Metabolism: Developmental and Nutritional Regulation of Monoacylglycerol Lipase and Monoacylglycerol Acyltransferase. J Biol Chem (2007) 282:33346–57. doi: 10.1074/jbc.M706994200
59. Selvin E, Rynders GP, Steffes MW. Comparison of Two Assays for Serum 1,5-Anhydroglucitol. Clin Chim Acta (2011) 412:793–5. doi: 10.1016/j.cca.2011.01.007
Keywords: adipose MCP-1, MMTV-PyMT, plasma metabolome, diet, male, mice
Citation: Yan L, Sundaram S, Rust BM, Picklo MJ and Bukowski MR (2021) Mammary Tumorigenesis and Metabolome in Male Adipose Specific Monocyte Chemotactic Protein-1 Deficient MMTV-PyMT Mice Fed a High-Fat Diet. Front. Oncol. 11:667843. doi: 10.3389/fonc.2021.667843
Received: 14 February 2021; Accepted: 13 August 2021;
Published: 09 September 2021.
Edited by:
Pu Li, Shanghai Jiao Tong University, ChinaReviewed by:
Luca Gelsomino, University of Calabria, ItalySyn Yeo, University of Cincinnati, United States
Copyright © 2021 Yan, Sundaram, Rust, Picklo and Bukowski. This is an open-access article distributed under the terms of the Creative Commons Attribution License (CC BY). The use, distribution or reproduction in other forums is permitted, provided the original author(s) and the copyright owner(s) are credited and that the original publication in this journal is cited, in accordance with accepted academic practice. No use, distribution or reproduction is permitted which does not comply with these terms.
*Correspondence: Lin Yan, Lin.Yan@usda.gov