 Chenzhao Feng1‡Tianyu Xiang2,3‡
 Zixuan Yi4‡
 Xinyao Meng1
 Xufeng Chu5Guiyang Huang5
 Xiang Zhao1
 Feng Chen6*
 Bo Xiong5*
 Jiexiong Feng1*†
- 1Department of Pediatric Surgery, Tongji Hospital, Tongji Medical College, Huazhong University of Science and Technology, Wuhan, China
- 2Department of Control Science and Engineering, College of Electronics and Information Engineering, Tongji University, Shanghai, China
- 3State Key Laboratory of Management and Control for Complex Systems, Institute of Automation, Chinese Academy of Sciences, Beijing, China
- 4School of Mathematics and Statistics, College of Arts and Sciences, Wuhan University, Wuhan, China
- 5Department of Forensic Medicine, Tongji Medical College, Huazhong University of Science and Technology, Wuhan, China
- 6Department of Pediatric Surgery, Fujian Medical University Union Hospital, Fuzhou, China
Background: Neuroblastoma is one of the most devastating forms of childhood cancer. Despite large amounts of attempts in precise survival prediction in neuroblastoma, the prediction efficacy remains to be improved.
Methods: Here, we applied a deep-learning (DL) model with the attention mechanism to predict survivals in neuroblastoma. We utilized 2 groups of features separated from 172 genes, to train 2 deep neural networks and combined them by the attention mechanism.
Results: This classifier could accurately predict survivals, with areas under the curve of receiver operating characteristic (ROC) curves and time-dependent ROC reaching 0.968 and 0.974 in the training set respectively. The accuracy of the model was further confirmed in a validation cohort. Importantly, the two feature groups were mapped to two groups of patients, which were prognostic in Kaplan-Meier curves. Biological analyses showed that they exhibited diverse molecular backgrounds which could be linked to the prognosis of the patients.
Conclusions: In this study, we applied artificial intelligence methods to improve the accuracy of neuroblastoma survival prediction based on gene expression and provide explanations for better understanding of the molecular mechanisms underlying neuroblastoma.
Introduction
Neuroblastoma, arising from the developing sympathetic nervous system, is the most common form of malignancy in children (1). Although diverse treatments have been developed for different stages of neuroblastoma, survival rates only improved in low and intermediate risk patients (2, 3). Whole genome sequencing and RNA sequencing (RNA-seq) delineated the genomic and transcriptomic traits of neuroblastoma, in which MYCN amplification, ALK mutations, PHOX2B mutations, TERT rearrangements, abnormally expressed microRNAs (miRNA) such as Mir17-92a, etc., occur mostly (4–6). Utilizing these data, a number of previous studies attempted to quantitatively predict outcomes for neuroblastoma patients. For instance, chromosomal gain or loss status were used to construct a cox regression model in one attempt, whereas most studies implemented gene expression data into multivariable score models (7, 8).
In recent years, machine-learning (ML) has been widely applied in medical sciences, especially in radiography, healthcare monitoring and genomics (9–12). ML was adopted to predict the outcomes and survival time by different approaches, such as Artificial Neural Network, Supported Vector Machine, Decision Tree and so on in many types of cancer (13–15), a vast majority of which outperformed the traditional cox regression models.
Deep-learning (DL) is a subdiscipline of ML that allows computers to transform raw data through multiple levels of representations. DL-based image detection has been widely studied in the diagnosis of diabetes and cancers (16, 17). In genomics, a multilayer perceptron could predict survival in an unsupervised or supervised way and was extended in lung cancer and hepatocellular carcinoma (18–20). DL-models were also utilized to predict stages and clinical outcomes in neuroblastoma (21, 22). However, reports examining the accuracy of DL-model with survival time are lacking.
Here, we developed a DL-based model to predict outcomes using gene expression matrices. First, 172 features were selected by the chi-square test between gene expression levels and patient survival outcomes in the training cohort. K-means clustering method was used to divide these gene features into two groups. A two-layer neural network decoder was then used to predict survival probabilities and status. F-score, accuracy, sensitivity and specificity were calculated to demonstrate that our model could precisely classify patients. To examine the robustness of our approach, we applied the same procedure in the validation cohort. Indeed, the area under the curve (AUC) of our model was 0.974 in the 5-year-survival receiver operating characteristic (ROC) curve, outperforming existing prognostic models. Furthermore, we partitioned the patients into two subgroups according to their feature expression levels. These two subgroups diverged in survival by log-rank test in Kaplan-Meier (KM) curve with p < 0.001. Gene Ontology (GO) enrichment analysis showed that the gene feature group 1 was enriched in the JAK-STAT pathway, while genes involved in bone morphogenesis were enriched in group 2. Therefore, this DL-based approach could rigorously predict neuroblastoma survivals and shine lights over the molecular mechanisms underlying neuroblastoma.
Materials and Methods
Data Acquisition
A total of 721 microarray samples, including two datasets named GSE49710 and E-MTAB-8248 (for short, GSE49710 and EMTAB), both detected on Agilent-020382 Human Custom Microarray 44k, were retrieved from NCBI Gene Expression Omnibus and ArrayExpress. The GSE49710 cohort, part of the SEQC project, portrayed Chinese neuroblastoma atlas, while EMTAB displayed German characteristics. Gene expression matrices accompanying clinical information were downloaded directly for the following analyses. F-score, accuracy, sensitivity and specificity were calculated on the whole GSE49710 cohort. Besides, GSE49711, the RNA-seq result of the same samples from GSE49710, was also fetched for lncRNA-related analysis.
Data Preprocessing
To reduce the biases between the two datasets, we normalized the expression levels by equation (1) since the data should be better limited in 0 to 1 in the neural network.
fi here indicates the expression of each RNA. is designated for the transformed level.
Feature Selection
After data normalizing, significant gene expression features were selected by chi-square test which is implemented by ‘chi2’ function in the python package sklearn (https://scikit-learn.org/). Genes whose FDR in the chi-square test was less than 0.05 were filtered. Following this principle, only 172 differentially expressed genes were chosen.
Another common feature selection approach, the Principal Component Analysis (PCA), was used to transfer gene expression matrix into principal components. The cox proportional regression was used to filter the components. We then compared the results of the PCA method with the chi-square method.
Feature Classification
After feature selection, a classifier was built to classify genes into different subgroups. Genes with similar biological functions were clustered into the same group. The K-means model in sklearn divided the selected genes into two clusters.
Model Construction
Then a supervised classification model based on deep neural networks was built. Both of two feature groups were used as inputs of our classification. The output of this neural network was a patient’s probability which ranged between 0 and 1. 0 would indicate that the patient is likely to be alive and 1 would indicate that the patient would probably be dead.
The structure of this classifier can be seen in Figure 1. It consisted of two parts, the encoder and the decoder. For the encoder part, we encoded two different groups of features into two 10 dimensional features by two different two-layer networks.
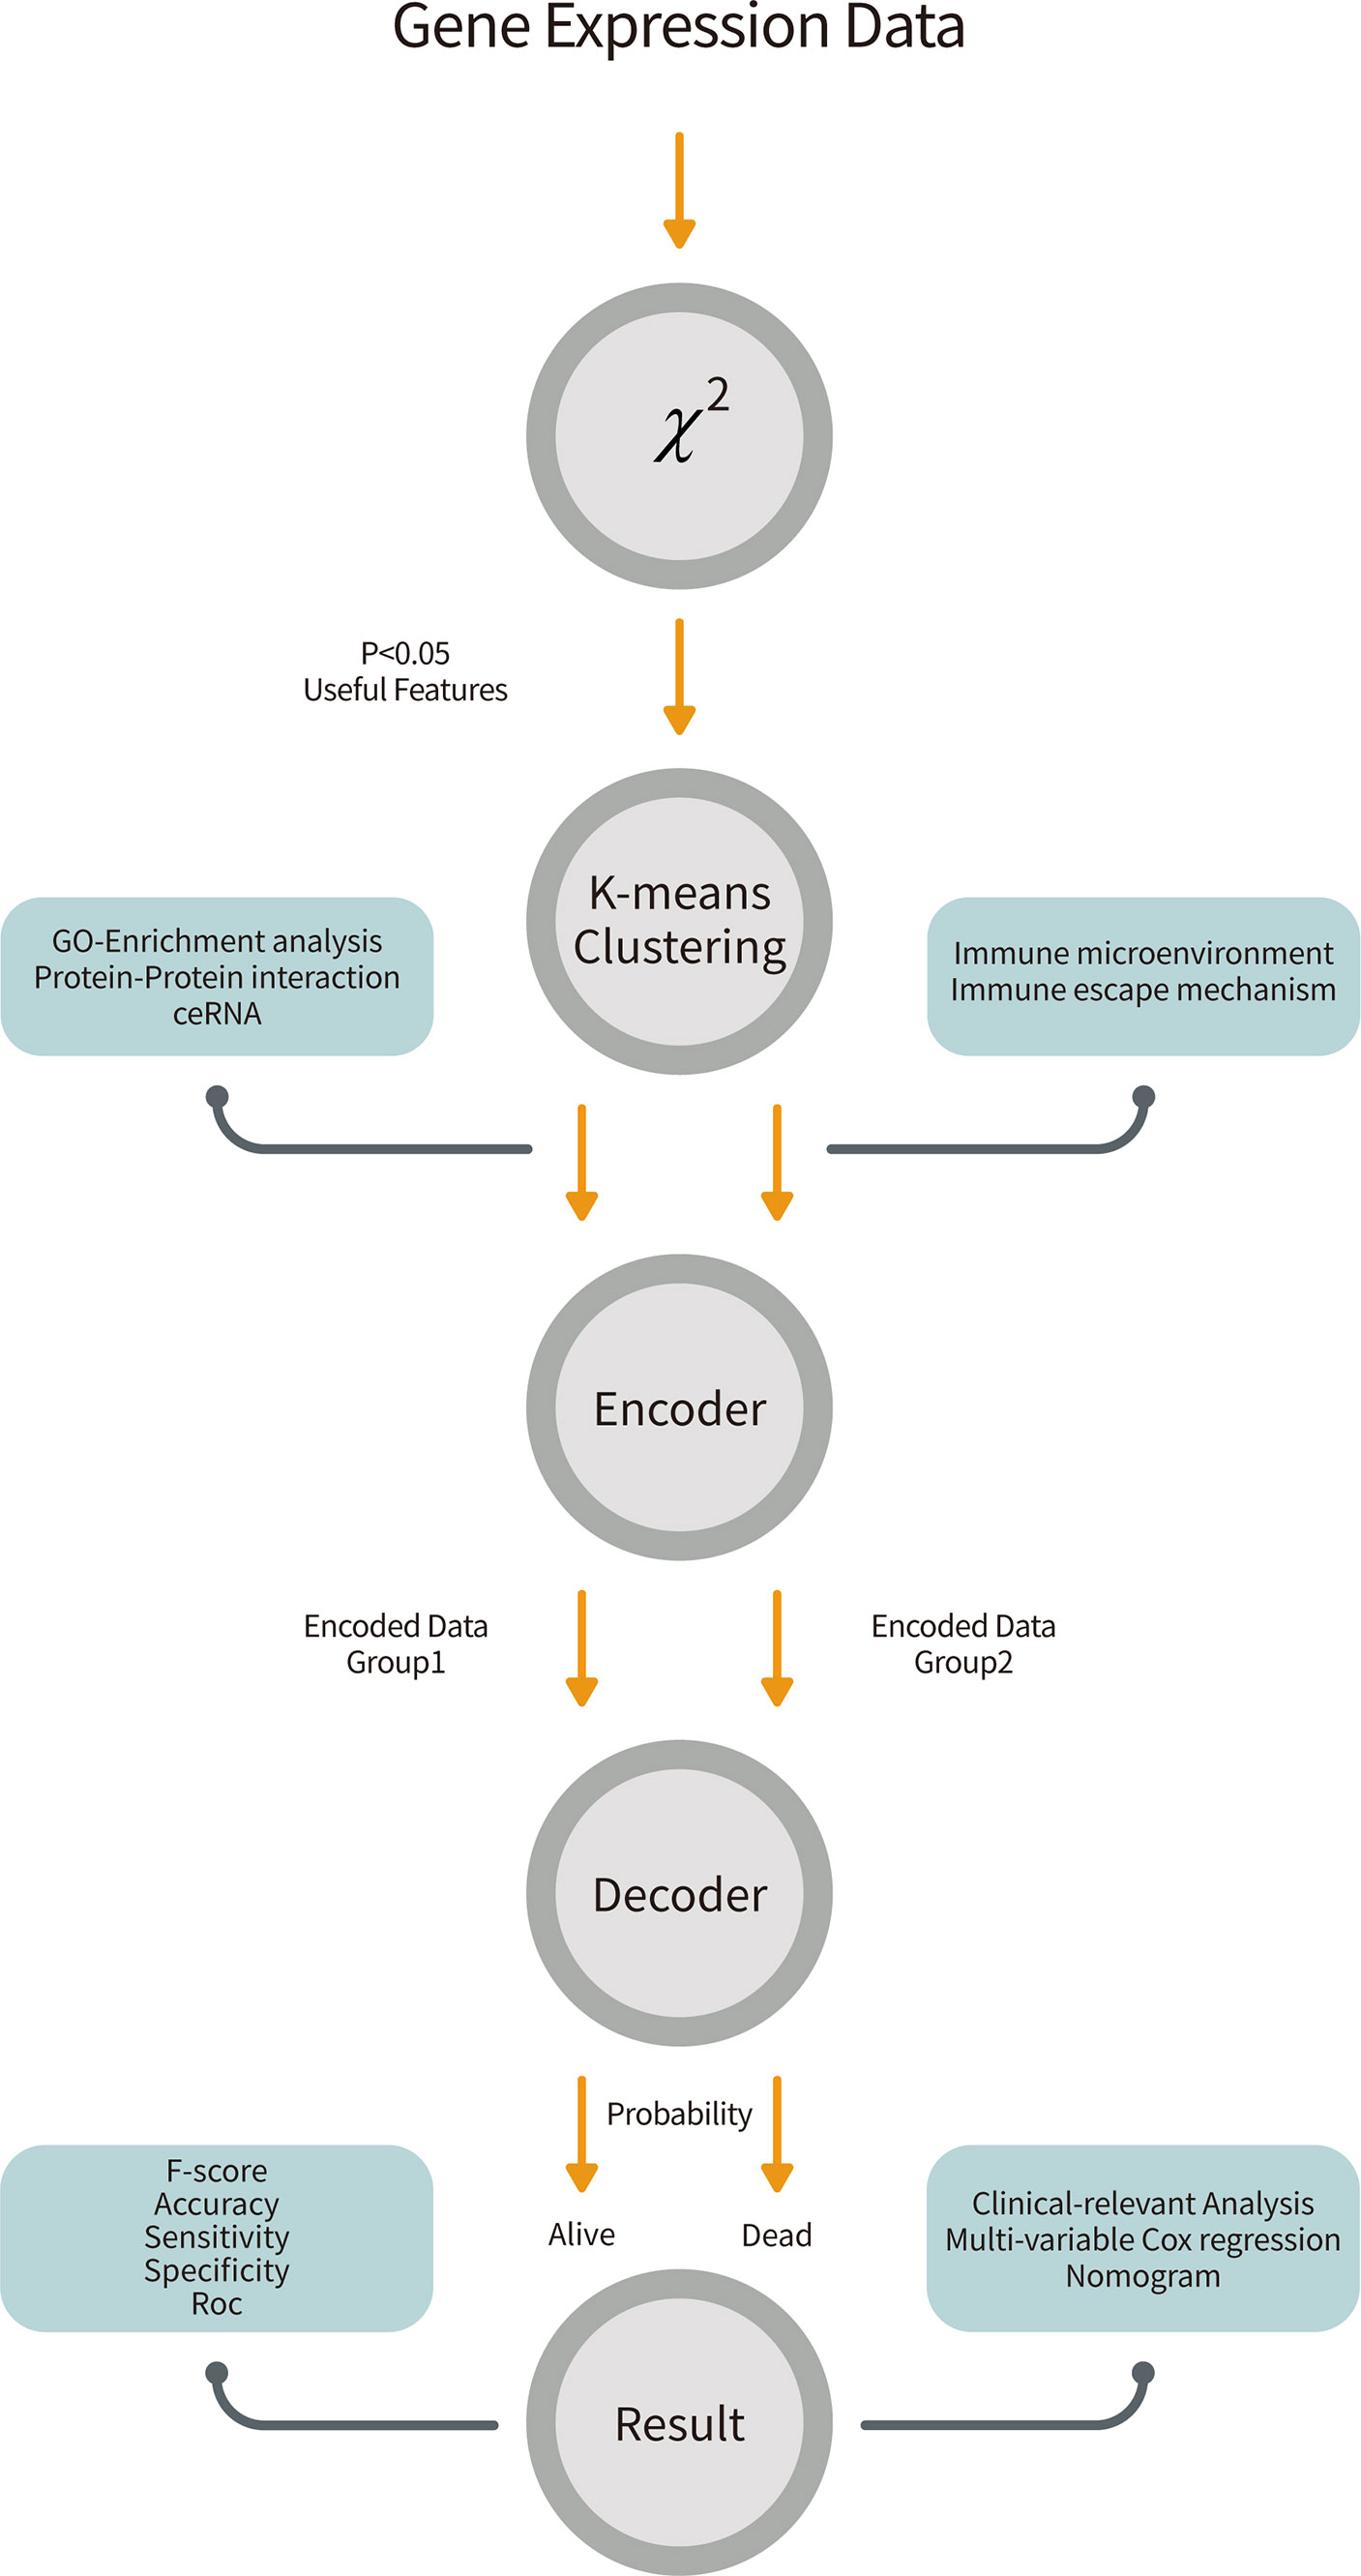
Figure 1 The overall workflow of our pipeline. Gene expression data from GSE49710 was retrieved and performed a chi-square test to filter 172 features. The K-means clustering method partitioned patients and genes into two groups. We trained two neural networks for two groups of features and combined them by the attention mechanism to predict survivals. Further, we analyzed biological effects between two groups and did clinical-relevant analysis.
are encoded features. wij are weights of the networks. fg1 and fg2 are transformed expressions using formula (1) and bij are biases of the networks. The function f indicates the activation function which is a nonlinear part of the encoder. Here, we used the ReLU as this nonlinear function:
To combine these two different encoded features together, we applied the attention mechanism to this model (23). With the difference of simply concatenating different features, this attention mechanism can learn the relationship between them.
This step is illustrated in equation 5. G refers to combined features. sig is a nonlinear function.
After seizing combined features, we input them into the decoder part. The decoder part is also a two-layer neural network.
y' is the output of this classifier.
To train this network, we defined the loss function as equation 8.
α and γ are parameters. In this system we set α to 0.2 and γ to 2. y is the true label of each patient. The patients of each group were uneven, so we used Equation 8, which is called the focal loss and was designed to solve this problem instead of cross entropy loss function (24). To avoid over-fitting, we drop 20% neurons in each layer by the dropout method. GSE49710 was chosen to train the network and EMTAB was to validate our model. For GSE49710, 70% of samples were used to train and the rest were to test.
All of the algorithms mentioned in this subsection were realized by tensorflow 2.2 (https://tensorflow.google.cn/). To optimize this neural network, we applied Adam optimizer and set the learning rate to 0.01 (25). The weights of networks were initialized by glorot uniform distribution (26).
Model Appraisal
To further evaluate our model, we calculated the accuracy, sensitivity, specificity as well as F-score of our model in two cohorts (27).
ROC curves and AUCs were estimated by pROC package in R to assess the performance of the classifier (28). The time-dependent ROC (tROC) curve and its AUC were estimated by survivalROC R package to introduce survival time into our classifier (29). The curves were plotted by ggplot2 R package (30). Besides, traditional cox regression models, devised by Zhong et al. (31) and De Preter et al. (32), were compared with ours.
Patients Clustering
In order to correspond patients to those two groups of gene features, we performed K-means clustering on patients. ConsensusClusterPlus was used to determine the best k with parameters (cluster algorithmml: km, distance: Euclidean, replicate time: 1000) (33). The CDF plot and the consensus matrix instructed us to cluster patients into 2 groups. A heatmap showing expression levels of features across samples were made by complexHeatmap R package (34). Survival rates between these two subgroups were measured by the log-rank test in KM curves. R packages survival and survminer were used to fit KM equation and plot the curves (35, 36).
Clinical-Relevance Analyses
In order to test whether our model was independent of other clinical factors and beneficial for clinicians to identify patients’ conditions, we first applied univariable cox regression on the age, MYCN status, gender, tumor stage, INSS-Risk and our probability score. A multivariable cox regression determined whether a covariate involved was decisive. Forest plots were plotted by forestplot package (https://CRAN.R-project.org/package=forestplot). Decision curve analysis was done by ggDCA (https://cran.r-project.org/web/packages/ggDCA/index.html). The construction and plot of the nomogram which can help clinicians to predict survival were done by rms (https://CRAN.R-project.org/package=rms) and regplot (https://CRAN.R-project.org/package=regplot) R package. Finally, an alluvial diagram was used to visualize the characteristics and disease progressions of each patient. This was achieved by the ggalluvial R package (37).
Biological Function Prediction
All biological analyses were done on GSE49710. We executed GO enrichment analysis on the two groups of features by clusterprofiler R package respectively (38). Gene Set Enrichment Analysis (GSEA) was done by GSEA software (Broad Institute, Inc., version 4.0.3) with gene set ‘c5.all.v7.1.symbols.gmt’ and default parameters. String (https://string-db.org/) was used to identify protein-protein interactions (PPI) between the 172 features and Cytoscape software was used to visualize the interaction networks. CytoHubba, a module inside Cytoscape, was carried out to identify the hub genes with 12 algorithms (39, 40). For lncRNAs searching, we extracted 250 lncRNA expressions by sorting lncRNA names in gencode.v34.long_noncoding_RNAs.gtf, a collection of known lncRNAs downloaded from GENCODE (https://www.gencodegenes.org/). Only lncRNAs that owned a standard error > 0.2 could be enrolled in the correlation test between the 18 mRNAs. The cut-off values were: p < 0.05 and |coefficient|>0.5. TarBase v.8 and LncBase Predicted v.2 were used to query for mRNA-miRNA and lncRNA-miRNA pairs respectively (41, 42). TarBase v.8 gave 78 CCNB1-binding miRNAs with filters (Species: Homo Sapiens, Method Type: High-throughput, Regulation Type: DOWN, Validation Type: Direct). LncBase Predicted v.2 provided predicted lncRNA-miRNA pairs with cut-off 0.7. Finally, a competing endogenous RNA (ceRNA) network was constructed using Cytoscape.
Immune Microenvironment Estimation
Inferred abundances of immune cells and normal tissue cells were calculated by single-sample gene set enrichment analysis (ssGSEA) using GSVA R package (43). Gene sets, also known as the markers of each cell, were collected by Charoentong et al. (44). Univariable cox proportional regression tests were exerted on all cells to reveal prognostic immune cells.
Statistical Analysis
For categorical and continuous data with normal distribution, we applied chi-square tests and student t tests to distinguish the differences between groups. When continuous data was not normal distributed, Wilcoxon sum rank tests and ANOVA were utilized. The Pearson correlation test was used to find linear connections between two groups of observations. A p-value<0.05 was considered statistically significant except for emphasis. To account for multiple-testing, the p-values were adjusted using the Benjamini-Hochberg FDR correction. All statistical analyses were two-tailed and done by Python (Python Software Foundation, version 3.8.2) and R (R Foundation, version 3.7.0).
Results
Neuroblastoma Genomic Atlas Was Depicted by 172 Features
The overall workflow is shown in Figure 1. After implementing the chi-square test into each feature and the survival in GSE49710, 172 features were selected (Figure 2A). The consensus clustering method determined the best k value as 2 to partition the features based on the expression matrix (Supplementary Figure 1). After that, K-means method was used to cluster the features and patients into 2 groups. Fifty genes were the markers of subgroup 1 of 336 patients (for short, S1), whereas the other 122 genes were the markers of subgroup 2 of 162 patients(S2). Basic characteristics were distributed diversely between the two subgroups except for gender (Supplementary Table 1). It is noteworthy that no MYCN amplification was detected in S1 and 92 were detected in S2 in the GSE49710 cohort while only 1 such case was detected in S1 and 45 in S2 in the EMTAB cohort, suggesting that these 172 features and the corresponding subgroups were MYCN-relevant (chi-square test p < 0.001, Supplementary Table 1). Also, these subgroups exhibited significant differences in overall survival and event-free survival (both log-rank test p < 0.001, Figures 2B, C and Supplementary Figure 2).
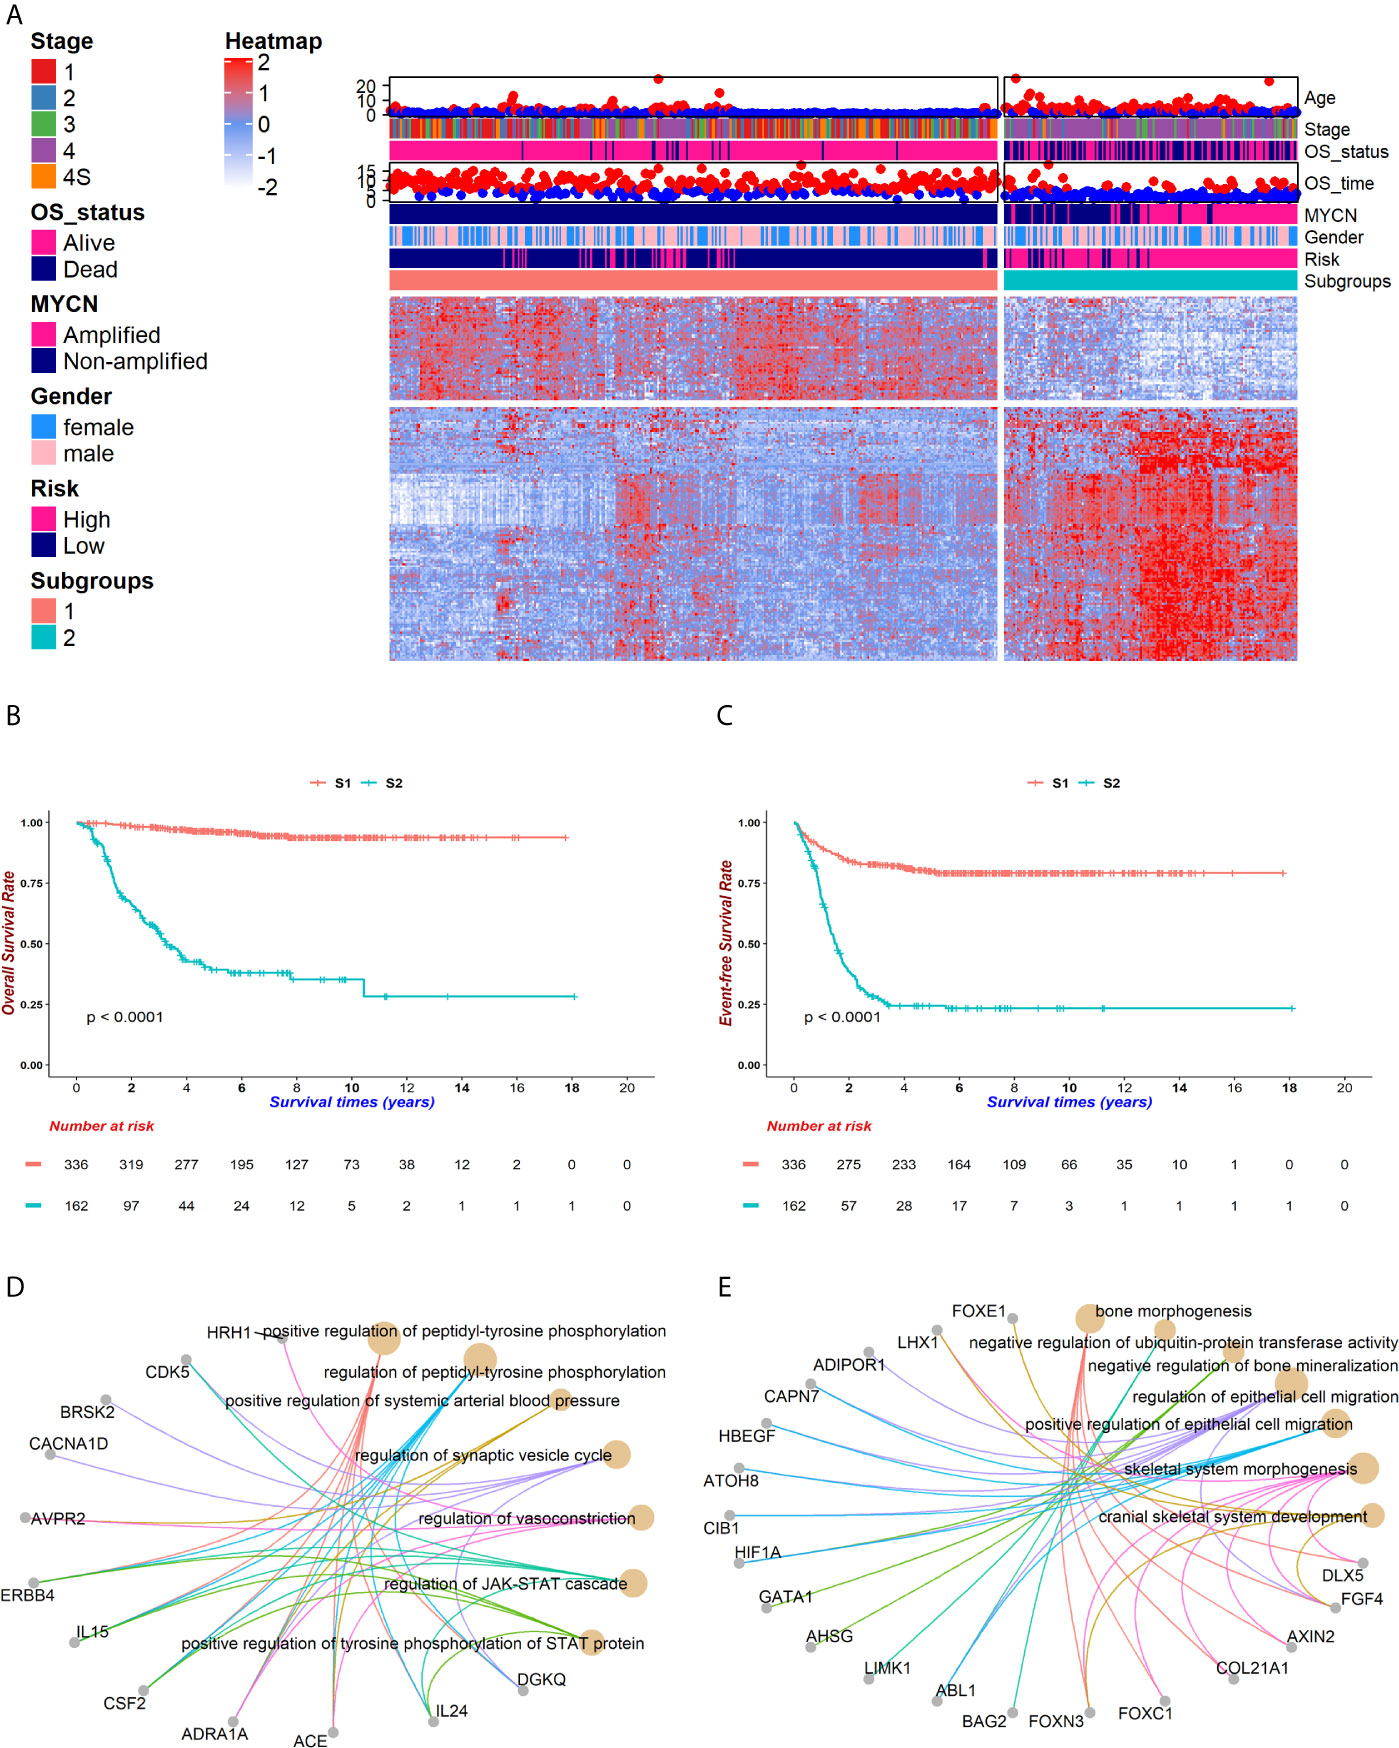
Figure 2 The genomic atlas of neuroblastoma was characterized by 172 genes. After implementing the chi-square test between gene expressions and survival status, a total of 172 genes were selected for following investigations. Patients were clustered into two groups, named subgroup 1 (S1) and subgroup 2 (S2), which owned 50 and 122 markers respectively. (A) The heatmap portraited the neuroblastoma genomic landscape in GSE49710. Gene expressions were normalized among samples. The higher expressions reached red while lower reached white. Corresponding clinical information, including age, stage, vital status, survival time, MYCN amplification, gender, INSS risk and subgroups, was attached on the top of the heatmap. (B, C) Kaplan-Meier (KM) curves showed distinct survivals between S1 (coralline line) and S2 (atroceruleous line) in overall survival (OS) (B) and event-free survival (EFS) (C) (log rank test p < 0.001 for each). (D, E) GO-enrichment analysis for feature 1 (F1) and feature 2 (F2) showed that S1 was up-regulated in the JAK-STAT pathway (D) and S2 was up-regulated in bone morphogenesis (E).
To understand the potential biological functions of the genes in each group, we performed GO-enrichment analyses. Notably, many features in group 1 (F1) are related to the JAK-STAT signaling while features in group 2 (F2) aggregated in the cell migration, bone morphogenesis and ubiquitin-protein transferase activities (Figures 2D, E). The JAK-STAT pathway promotes tumor cell proliferation, invasion and immunosuppression through a membrane-nucleus cascade (45). A Previous study has shown that the JAK1/2 inhibitor, AZD1480, could abate neuroblastoma tumor cells growth and extend survivals, suggesting that S1 patients not only maintained better survivals with neuroblastoma, but also might potentially respond to drugs such as AZD1480 to recover (46). Next, the GSEA analysis revealed that S1 showed a higher level of metabolism compared to S2 and S2 developed an intensive immune response (Supplementary Figure 3). This might be attributed to the mild symptoms in S1 where patients kept a normal or slightly elevated metabolism. However, accompanying the progression of tumors in S2, the patients started a fierce immune reaction and finally exhausted. These findings suggest that the subgrouping method could help to understand the molecular pathology underlying the differences in prognoses of neuroblastoma patients.
The Neural Network Model Manifested Great Performance in Classifying Neuroblastoma
An encoder-decoder model was then trained on the GSE49710 dataset to predict survivals (Figure 1). Since F1 and F2 contributed unequally to the body responses and outcomes, two neural networks were created for them separately in the encoder. In this encoder, a widely used activation function, the ReLU function in the hidden layer; and a binary classification function, the sigmoid function (or say logistic function), in the output layer were employed. The attention mechanism, inspired by human physiology that people would only concentrate on tasks at hand to improve the efficacy of the encoder-decoder framework with rich information, was used to combine the two encoder parts into the decoder (47). The sigmoid function was also used in the final layer, which outputted survival probabilities. If the probability is less than 0.5, we predicted this patient as alive and vice versa (Supplementary Table 2).
To assess the prediction quality of the overall survival status, we calculated the accuracy, sensitivity, specificity and F-score of our model, which reflected the proportion of correct predictions in all samples, true positives in all positives, true negatives in all negatives and the harmonic mean of precision and recall. In the training set, the accuracy (0.918), sensitivity (0.913) and specificity (0.944) were all greater than 0.9, suggesting that it could efficiently forecast whether a patient would be alive or dead using 172 features. Moreover, a descent efficacy was achieved in the test set (accuracy: 0.852, sensitivity: 0.911, specificity: 0.605), however, F1 score was slightly higher (GSE49710: 0.881, EMTAB: 0.886), indicating that the model was suitable for cohorts of various genetic background. The ROC and tROC curves were then generated which further demonstrate the eminence of the neural network (Figures 3A–C and Table 1). The AUCs of the training set and the test set achieved 0.968 and 0.891 respectively (Figure 3A), alluding the robustness of our neural network prediction model. Adding survival time into ROC curves, we found that the 5-year-survival AUCs could be boosted to 0.974 in GSE49710 (Figure 3B) and 0.896 in EMTAB (Figure 3C), which validated that our neural network could classify patients with high precision. Twenty times of 10-fold cross validation showed the stability and robustness of our neural network architecture, suggesting that our attempts of the attention mechanism would be extended into more datasets.
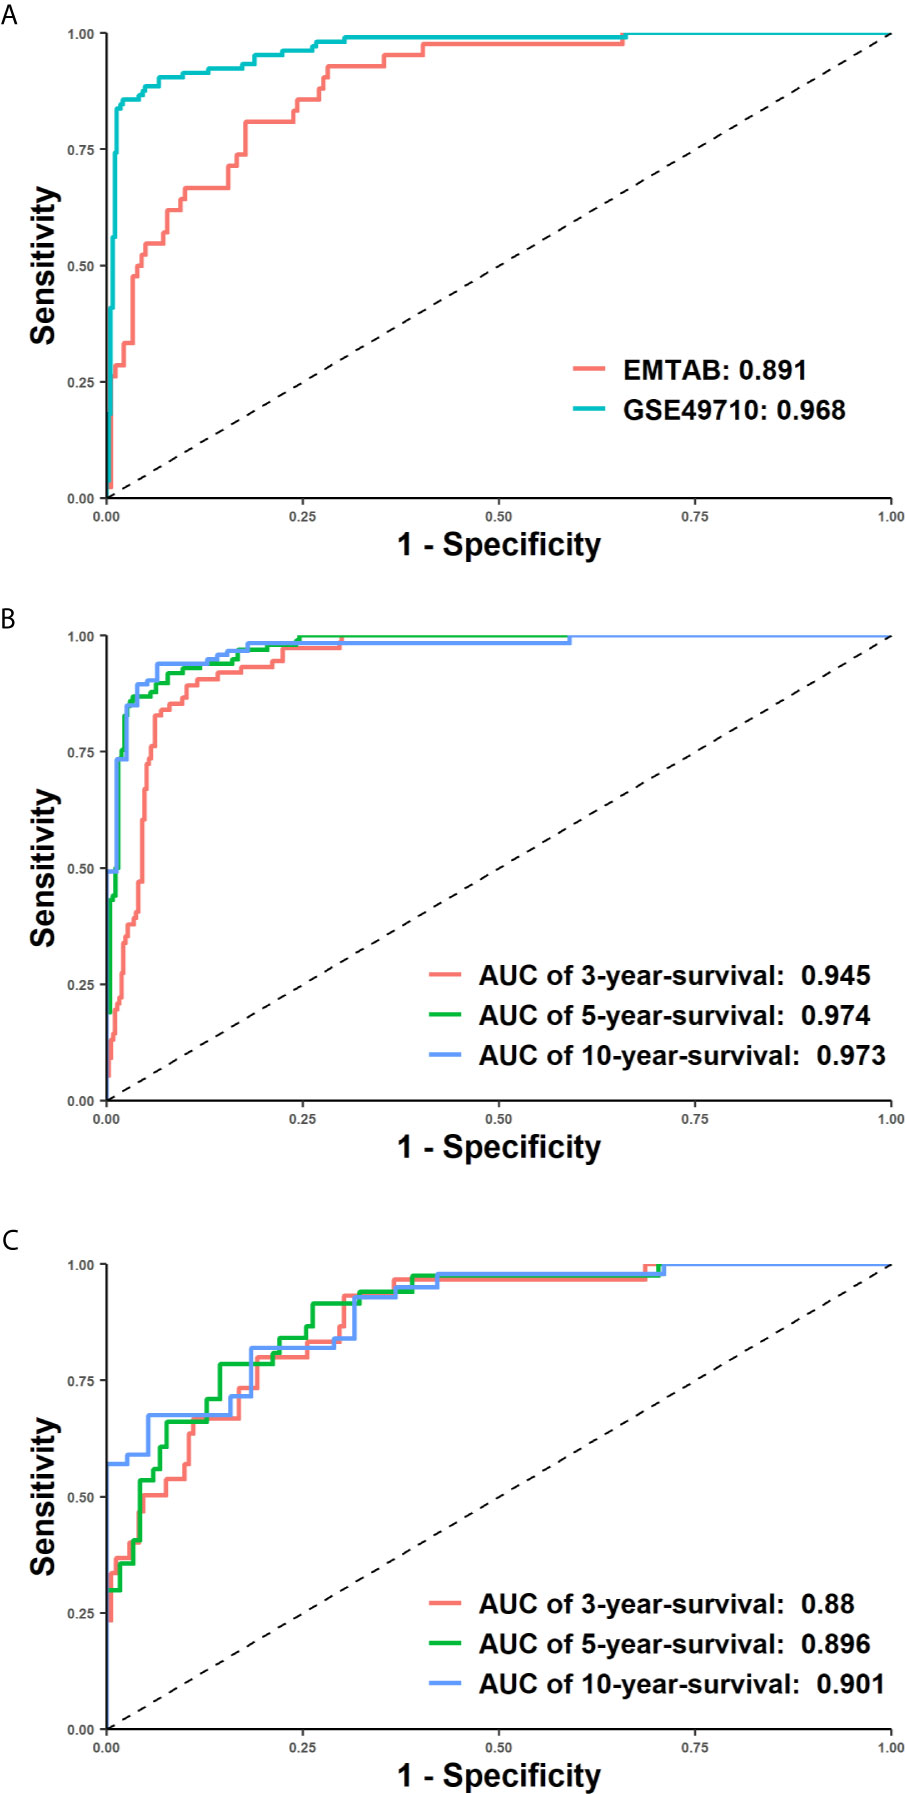
Figure 3 Receiver operating characteristic (ROC) curves demonstrated the superiority of our model. X-axis represented false positive rate (1-specificity) and y axis represented true positive rate. (A) The ROC curves of the EMTAB (coralline line) and GSE46960 (atroceruleous line) cohort. (B, C) 3-year, 5-year and 10-year time-dependent ROC curves of the GSE46960 (B) and EMTAB (C) cohort.
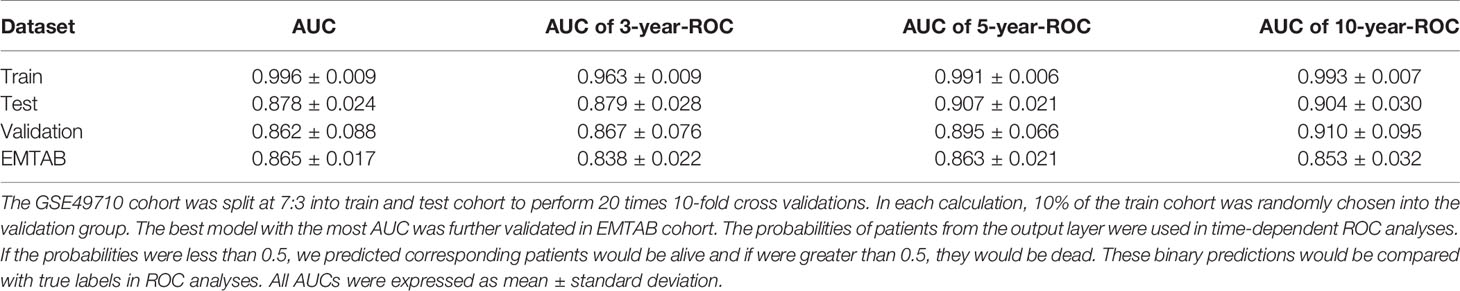
Table 1 AUCs of ROCs, 3-year-ROC, 5-year-ROC and 10-year-ROC with 20 times 10-fold cross validation.
Performance Comparison With Alternative Methods
Next, we compared the performance of alternative methods which varied in either feature selection or model construction with our model. To demonstrate that our feature selection was more closely related to prognoses, a broadly used dimension reduction and feature selection method, PCA, was utilized to select features on GSE49710. Kaiser-Harris Criterion suggests that those principal components whose eigenvalue were more than 1 would be retained. In our study, all components had an eigenvalue greater than 1. Variances explained in each component were similar (Supplementary Figure 4). The top 200 principal components were chosen with cumulative variance percent at 89.532% for further analyses. Since the survival data has not been utilized, a univariable cox regression model was implemented to principal components, resulting in 17 components being selected with p < 0.05. The Consensus cluster determined the best k=value as 3 using K-means clustering (Supplementary Figure 5). However, the 3 subgroups were not significantly different in OS (Figure 4A, log-rank test p = 0.088) but in EFS (Figure 4B, log-rank test p = 0.029), which indicated that our chi-square-based feature selection could highlight the hub genes in neuroblastoma and partitioned patients into high and low risk groups.
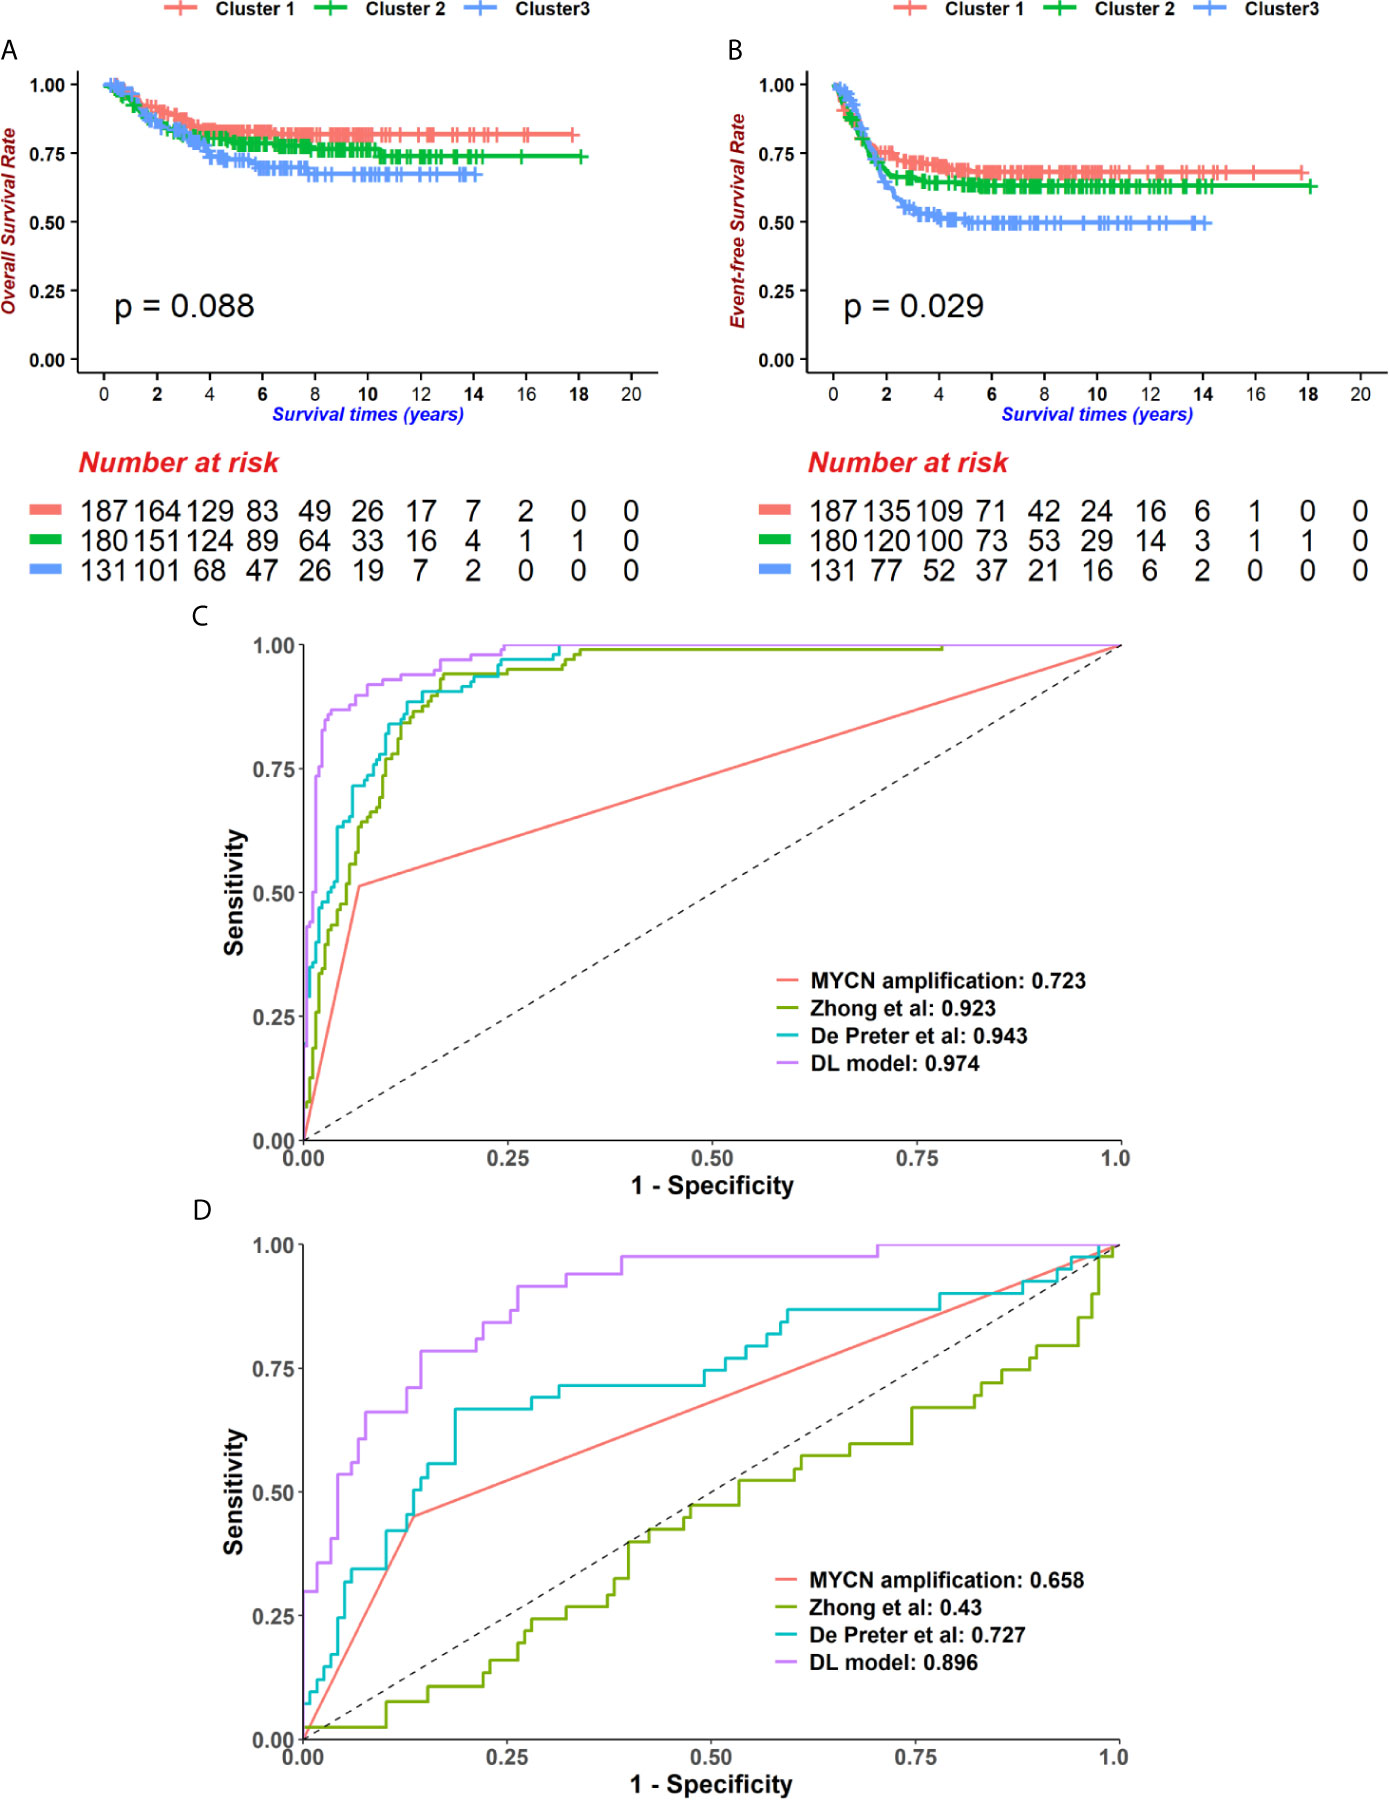
Figure 4 The Deep-learning-model (DL-model) outperformed alternatives in two aspects. (A, B) We employed the Principal component analysis (PCA) method to cut features down to 200. Using 200 PCA dimensions, we distributed patients into 3 groups, which was determined by the consensus clustering method. These groups did not show prognostic value in overall survival (OS) (A, log-rank test p = 0.088, n = 498) but event-free survival (EFS) (B, log-rank test p = 0.029, n = 498). (C, D) Compare with other models (MYCN status, 4-gene-signature by Zhong et al. and 42-gene-signature by De Preter et al.), our DL-model received the highest AUCs of 5-year-survival ROC curves in GSE49710 (C) and EMTAB (D) cohorts.
We then compared the performance of our model with several existing models. In order to reduce the biases between the cohorts used in this study and in the literatures, the expression data was normalized before calculating risk scores. We selected two previously published models as well as the ‘gold standard’, MYCN status, and then performed survival prediction in the GSE49710 and EMTAB cohorts (Supplementary Table 2) (31, 32). Our DL-model generated the highest AUC in 5-year tROC curves in both GSE49710 and EMTAB cohorts (Figures 4C, D), indicating that our model outperformed the existing model in survival prediction.
DL-Model Probabilities Were of Clinical Significance
To test whether the DL-based prediction model is widely useful for patients of various background conditions, we implemented the univariable cox regressions among the age, MYCN status, gender, diagnostic stage, risk and our output probability. All variables were converted to binaries in this test (Supplementary Figure 6). Only gender failed in this test as p > 0.05, which was discarded in the multivariable regression. In the multivariable cox model, the probability risk was still significant (Figure 5A), indicating that our DL-based model had a broad prognostic ability regardless of clinical covariates.
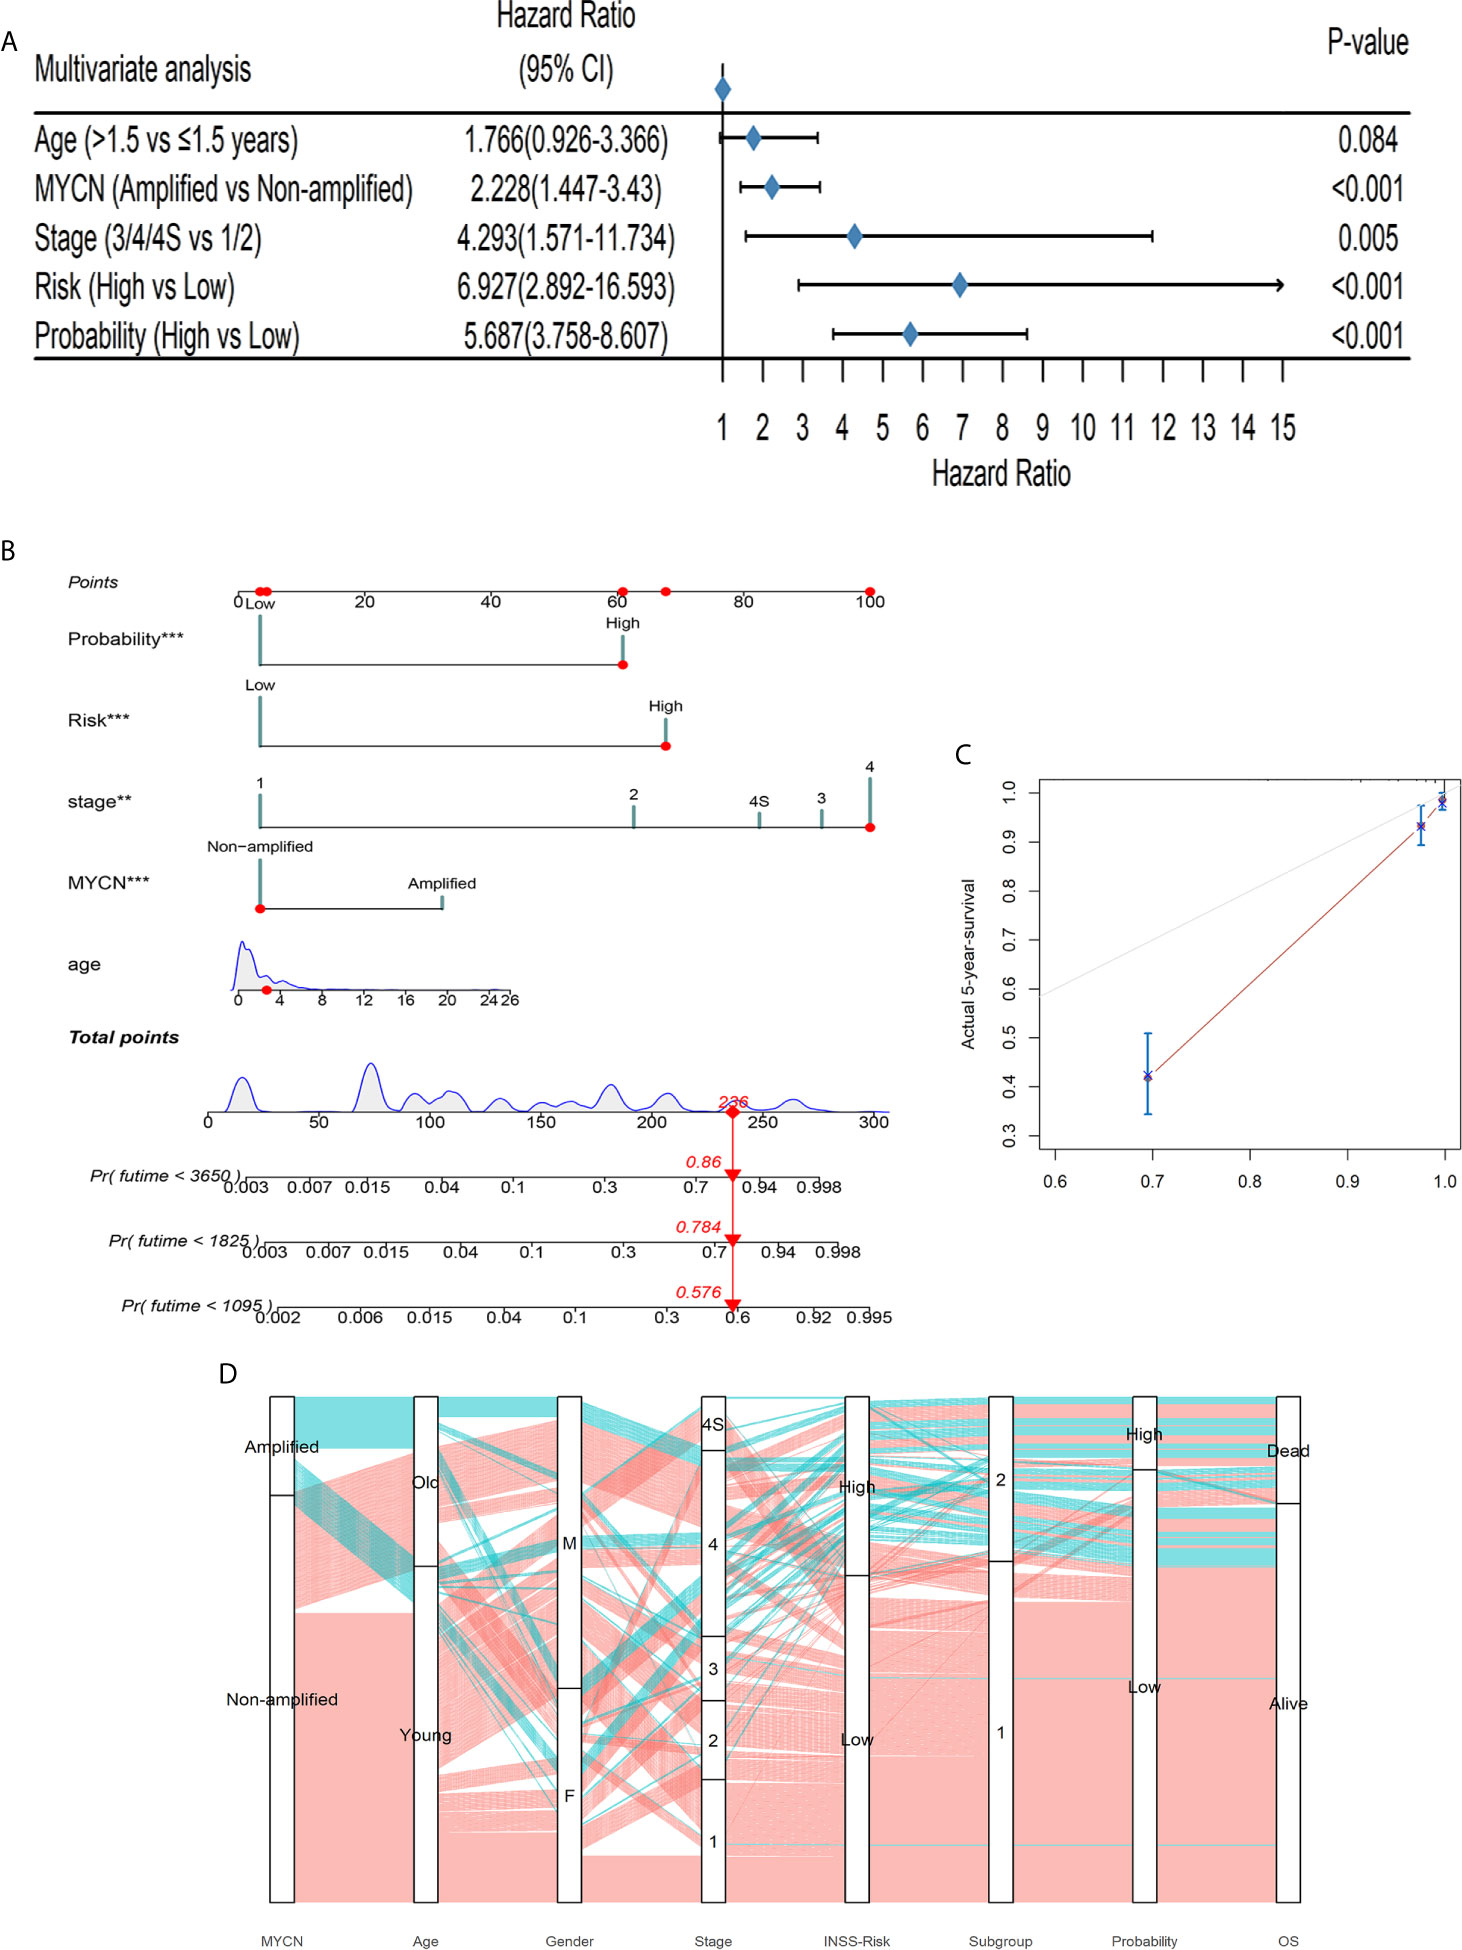
Figure 5 The DL-model was independent of clinical covariates and could aid to diagnose. (A) The DL output probability was significant in the multivariable cox regression with clinical covariates (p < 0.001). (B) A nomogram could be beneficial for survival time prediction. (C) The calibration curve of the nomogram with a C-index: 0.889. (D) The alluvial diagram visualized the general conditions of patients. Coralline lines represented patients without MYCN amplified and atroceruleous lines represented those with MYCN amplified.
We further used the decision curve analysis (DCA) to evaluate the net benefit of different models (48). We constructed 3 models: only DL-probabilities, only clinical covariates in multivariable cox analysis as well as a combined model. The combined model achieved the highest net benefit no matter how risk threshold was set (Supplementary Figure 7). The data implied that combining DL-model and clinical information could be profitable for clinicians to diagnose and to predict survivals. Therefore, we build up a nomogram which could help clinicians to predict the potential outcomes of the patients beforehand the medical treatments (Figure 5B and Supplementary Table 3). A C-index 0.889 of the nomogram along with the calibration curve predicted 5-year-survival, demonstrated that this scoring system would be handy and practical in the first-line diagnosis (Figure 5C).
The alluvial diagram summarized the samples in our study (Figure 5D). 69.07% (67/97) of MYCN-amplified patients would be at stage 4 and this tendency was notable (chi-square test: p < 0.001). Only 21 patients diagnosed INSS low risk were classified into S2 and 35 with high risk into S1, showing that our prognostic subgroups were highly clinical-relevant (chi-square test p < 0.001). Subgroups and probabilities were also correlated (chi-square test p < 0.001). In the alluvial diagram, we observed that if patients had MYCN amplified, whether they were old or young, male or female, most of them would be at stage 4, INSS high risk, Subgroup 2. Whereas MYCN was not amplified, an antithetical conclusion would be drawn.
A CCNB1-Associated ceRNA Network Is Related to the Survivals of Neuroblastoma Patients
In order to isolate the hub genes of these 172 features, we first retrieved their PPI on the String website (Figure 6A). We then input them into Cytoscape software, and used the cytoHubba module to uncover hub genes by using 12 different algorithms. We summed up the top 5 genes in each algorithm and finally selected 18 genes as pivotal molecules in the network.
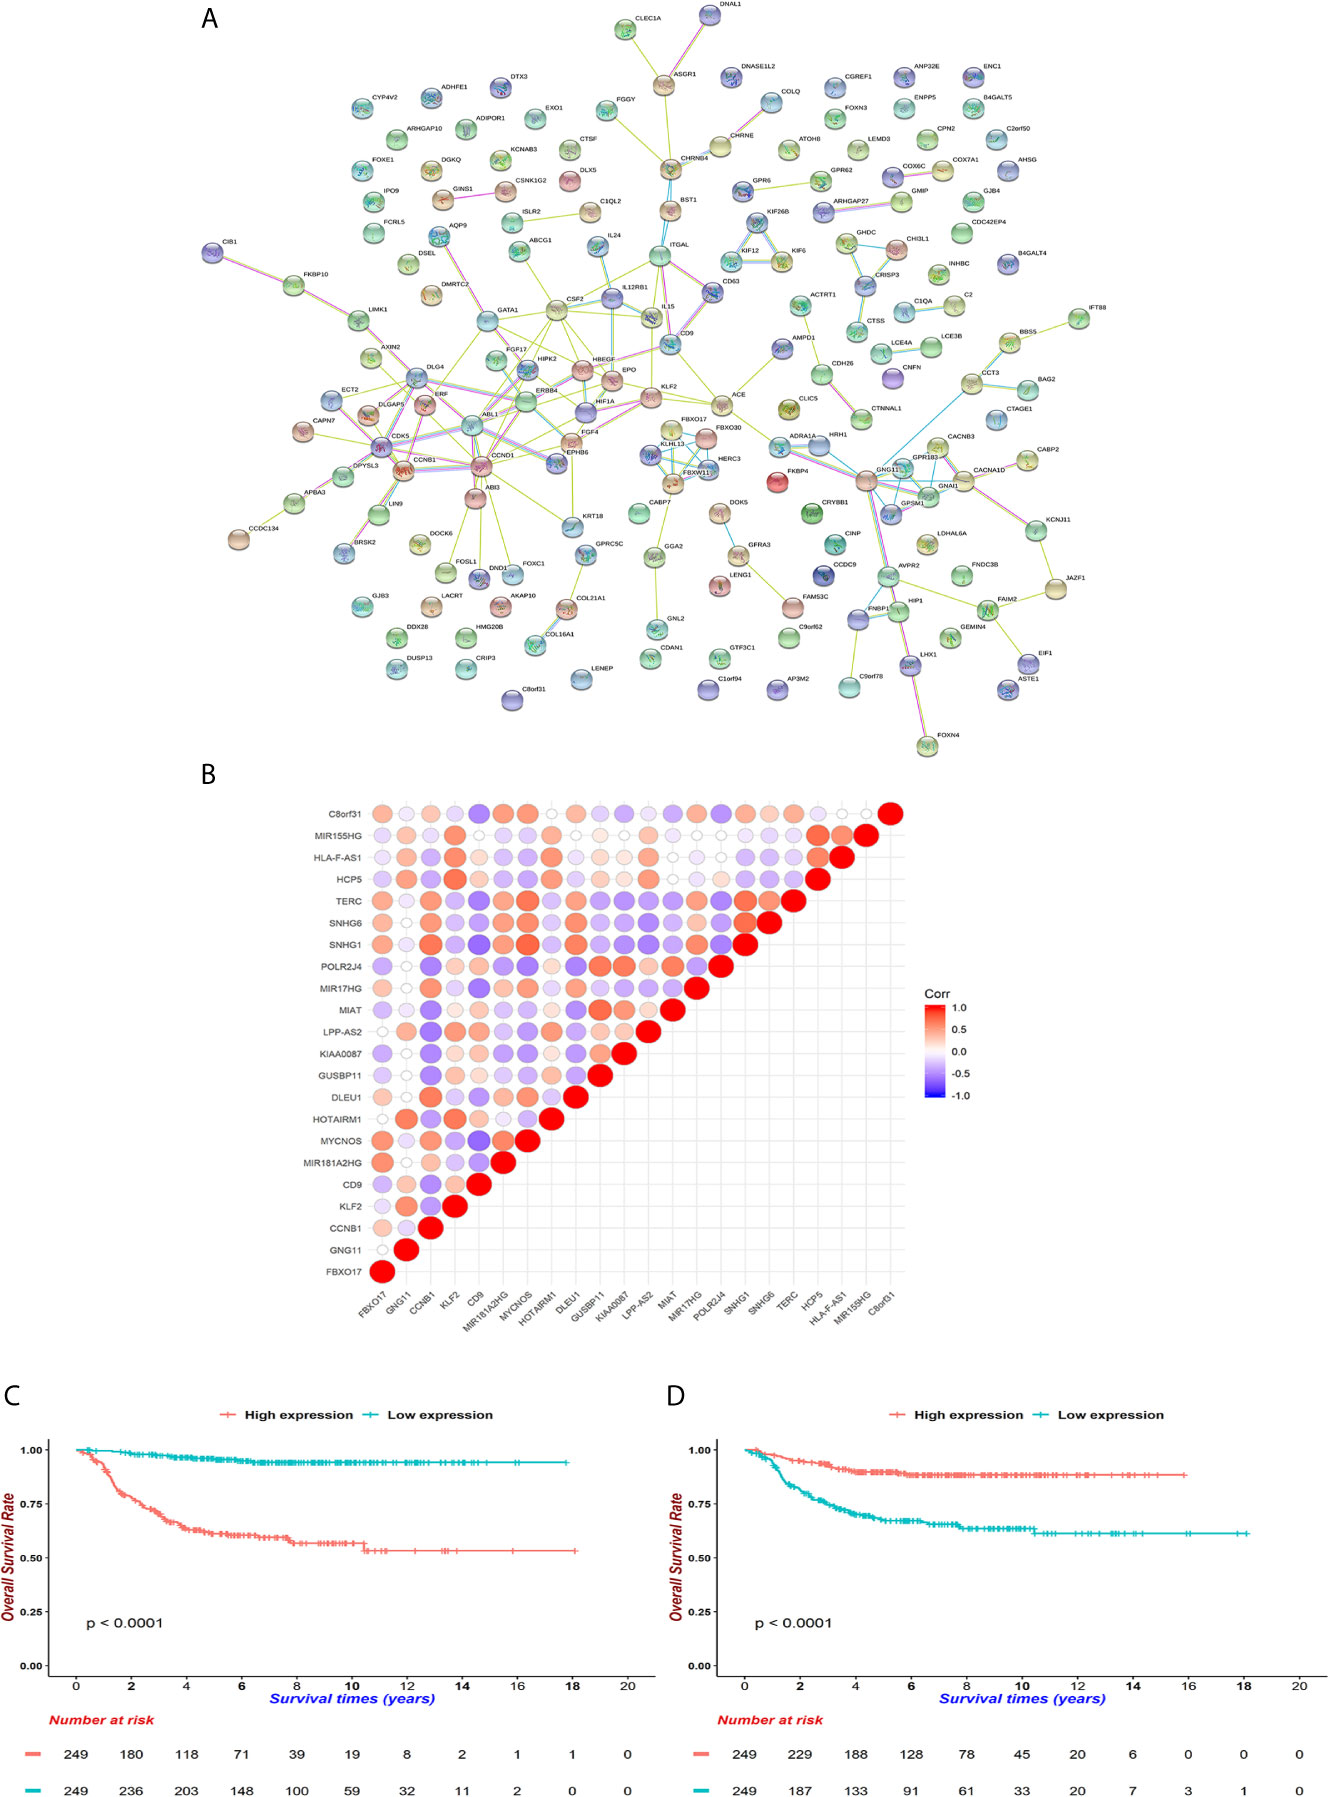
Figure 6 Underlying hub genes and associated interactions in neuroblastoma. (A) The protein-protein-interaction (PPI) network was constructed by String website. (B) Mutual correlations among 18 hub genes filtered by cytoHubba module in Cytoscape software. The dots are colored red when Pearson correlation coefficients approach 1 and dots are colored blue when coefficients reach -1. (C, D) KM curves for CCNB1 and CD9 (D). Expressions were cut by median levels. (both log-rank test p < 0.0001, n = 498).
Next, we aimed to identify lncRNAs that could participate in the regulation of hub genes. GSE49711 is the RNA-seq of the same sample with GSE49710 and was used to uncover potential lncRNA-mRNA pairs. Subsequently, 5 mRNAs (FBXO17, GNG11, CCNB1, KLF2 and CD9) were highly connected with 17 lncRNAs (Figure 6B and Supplementary Table 4). We noticed that both CCNB1 and CD9 could interact with 4 lncRNAs (MYCNOS, TERC, SNHG1, MIR17HG), along with positive coefficients between CCNB1 and lncRNAs and opposite trends on CD9. CCNB1, an oncogene that controls the cell cycle at G2/M, had been found to be overexpressed in hepatocellular carcinoma and pancreatic cancer (49, 50). CD9 is a tetraspanin involved in cell adhesion, metastasis and inflammation in cancer (51, 52). CCNB1 curtailed and CD9 increased survivals in GSE49710 and R2 (https://hgserver1.amc.nl/cgi-bin/r2/main.cgi), which were consistent with previous reports (both p < 0.001, Figures 6C, D) (49–52).
The ceRNA theory proposed that lncRNAs and mRNAs competed to interact with shared miRNAs, up-regulating downstream RNAs by impairing miRNA activities (53). We created a CCNB1-associated ceRNA network as described in Methods. (Supplementary Figure 8, Supplementary Table 5). Of note, the mir-302 family (hsa-mir-302-a, -b, -c and -d) which was highly expressed in embryonic stem cells, was associated with CCNB1 and MIR17HG. This indicated that mir-302 might reduce the proliferation of neuroblastoma as it did in other cancers (54, 55).
Inhibitory Cells and Cytokines Increased in S2
Since distinct immune response patterns were observed between the two subgroups in GO-enrichment analysis and GSEA (Supplementary Figure 3), we further analyzed the immune microenvironment in neuroblastoma. The ESTIMATE algorithm was used to infer the purity of the microenvironment by scoring immune and stromal cells (56). Two groups did differ in stromal scores but not in immune scores, suggesting that S1 might preserve more normal stromal cells (Supplementary Figure 9). We used the ssGSEA algorithm to convert gene expression data into relative cell proportions (Supplementary Figure 10A). The numbers of the T regulatory cells (Tregs), Natural Killer (NK) cells, Monocytes, MDSCs, Eosinophils and central memory CD4 T cells were up-regulated in S2 compared to S1, while the Memory B cells, Macrophages, Gamma Delta T cells and central memory CD8 T cells exhibited opposite trends. Despite a rich amount of innate cytotoxic NK cells in S2, inhibitory immune cells like Tregs and MDSCs might contribute to deficient cytolytic activities. Since GZMA*PRF1 could represent tumor microenvironment cytolytic activities (57), these data indicated that S1 may possess superior cytolytic activities which might eliminate tumor cells conspicuously (Supplementary Figure 11A). In addition, only activated CD8+ T cells were connected with survival events in two subgroups at p < 0.05, however, they anticipated contradicting outcomes (Supplementary Figure 10B, Supplementary Table 6). This implied that CD8+ T cells might play dual roles in neuroblastoma patients, i.e., CD8+ T cells functioned as a normal beneficial factor in malignant tumors in S2, however, impeding patients of S1 from recovering.
Then, we examined the intrinsic immune escape mechanism in neuroblastoma. Down-regulations of interferon signals and droppings of two γ-IFN receptors were observed in S2 (Supplementary Figures 3, 11B), whereas IL-2 was increased in S1 which might stimulate T cell differentiation. A loss of HLA-class I/II can aid tumor cells to escape from immune monitoring. HLA-A and HLA-C were lower in S2, making the tumors prone to survive (Supplementary Figure 11C) (58, 59). The expression levels of PDCD1, PDL1 and CTLA4, which are critical immune checkpoint genes, were also affected in S2 (60). Overall, these data suggest that disturbance of the immune system may be underneath the poor outcomes of the patients in S2.
Discussion
One of the cruxes for neuroblastoma treatments is the heterogeneity. MYCN amplification and INSS risk classification have improved the efficacy to herald survivals, which many studies have unraveled genetic polymorphisms among. However, the current staging and grading systems are mainly based on clinical phenotypes, while it is steadily accepted that patients should be categorized by genetic associations.
Machine-learning and deep-learning methods have been used in medicine for many years. Generally, a deep-learning model receives multi-omics data and predicts outcomes by one or more neural networks. Chaudhary et al. used RNA-seq, miRNA-seq and DNA methylation data to train an autoencoder and partition patients into two prognostic groups (20). Chabon et al. sequenced SNV and CNV data of cell-free DNA in patients with lung cancers and controls. They established a ‘Lung-CLip’ machine-learning model to score each patient and determined whether a patient got lung cancer by the relative score (19). In this study, we used a DL-based classifier to significantly improve the prediction of neuroblastoma outcomes. We fed 172 genes expression data to the neural network and enrolled the attention mechanism into the survival classifier. The output probability could tell whether a patient could be dead or alive. Moreover, the 172 features selected for survival prediction could help characterize the genetic heterogeneities among the neuroblastoma patients.
A special attention mechanism was employed to combine two different parts of RNAs together (23). The attention mechanism is firstly presented by Vaswani et al. and widely used in computer vision and natural language processing (61), which is helpful to find interactions among different features, such as importance, relationship and so on. The attention mechanism can help the network learn how these two different groups of genes interact with each other. Information learned by the network can help it achieve a better performance. Indeed, our model outperformed traditional cox models, gaining a 5-year-survival AUC 0.974 and 0.896 in GSE49710 and EMTAB cohorts respectively. Besides, the PCA method failed to partition patients into appropriate prognostic groups, suggesting the superiority of our methods. Finally, we ran the gamut from all the samples in two cohorts, showing the robustness of our DL-based model.
For a long period, lncRNAs have been thought fruitless until recent advances that they might participate in chromosome stabilization, transcriptional initiation, localization, etc., thus broadening the cancer epigenetic network and making it possible for new drugs (62–64). Here, we identified four critical lncRNAs: MYCNOS, TERC, SNHG1 and MIR17HG. MYCNOS, the antisense of MYCN, functions as the regulator of upstream MYCN promotor to enhance MYCN expressions. TERC, the telomerase RNA component, part of the telomerase, could proliferate prostate cancer cells (65, 66). SNHG1 up-regulates in colorectal, liver, prostate and gastric cancers, which is the biomarker for decreased survivals (67). Also it contributes to the neuroinflammation in Parkinson’s disease (68). MIR17HG promotes colorectal as well as gastric cancer progression and up-regulates PD-L1 expression, which could be inhibited by γ-IFN (69, 70). Investigations about those lncRNAs indicated that they could be engaged in the oncogenesis of neuroblastoma.
Our DL-based approach evinced a pathbreaking conjecture for survivals of neuroblastoma patients, still, there are some caveats should be aware of. First, neural networks are thought to be uninterpreted for now. We tried to exploit an attention mechanism to decipher underlying juxtapositions of genes involved in neuroblastoma, however, we could not declare how these neural networks work explicitly. Second, we only applied our model into two datasets that provided high-quality sequencing results as well as unequivocal labels and clinical annotations for each patient. We expected to test the reliability in more large cohorts. Last but not the least, we exerted neural networks on 172 features, which would be an obstacle for massive use in clinical examination due to its costs.
In summary, a DL-based model was constructed using 172 gene expressions to forecast survival status of neuroblastoma. Patients were split into two groups, which presented distinct microenvironments and clinical denouements. Our work paved the way for applications of artificial intelligence in medicine, not only in survival prediction, but also biological interpretations and associated accurate medicine.
Data Availability Statement
Publicly available datasets were analyzed in this study. This data can be found here: https://www.ncbi.nlm.nih.gov/geo/query/acc.cgi?acc=GSE49710 https://wwwdev.ebi.ac.uk/arrayexpress/experiments/E-MTAB-8248/.
Ethics Statement
This study did not need approvals by the Ethics Committee of Tongji Hospital, Wuhan, China according to the regulations. This study fully complied guidelines of GEO and ArrayExpress.
Author Contributions
CF, TX, and ZY contributed to devising the overall pipeline. TX trained neural networks and CF conducted the following analysis. XM, XC, GH, and XZ contributed to providing biological and technical instructions. FC, BX and JF contributed to concrete guides and funding in this project. All authors contributed to the article and approved the submitted version.
Funding
This work was supported by the National Key Research and Development Program of China [2016YFE0203900].
Conflict of Interest
The authors declare that the research was conducted in the absence of any commercial or financial relationships that could be construed as a potential conflict of interest.
Acknowledgments
We thank all colleagues and mentors for their contributions and instructions in this project.
Supplementary Material
The Supplementary Material for this article can be found online at: https://www.frontiersin.org/articles/10.3389/fonc.2021.653863/full#supplementary-material
Supplementary Figure 1 | Consensus clustering results for GSE49710. (A) Cumulative density functions (CDF) for k=2 to 8. (B) Relative changes in CDF curves. (C–F) Consensus matrices for k=2 to 5.
Supplementary Figure 2 | KM curves of the EMTAB cohort for OS (A) and EFS (B). S1 (coralline line) and S2 (atroceruleous line) were determined by the same procedure as GSE49710 (both log-rank test p < 0.0001).
Supplementary Figure 3 | GSEA plots showed that S1 exhibited higher biochemical activities (A–E) while S2 owned immune responses (F–I).
Supplementary Figure 4 | Explained variances of each top 10 PCA dimensions.
Supplementary Figure 5 | Consensus clustering results for GSE49710 using PCA dimensions. (A) Cumulative density functions (CDF) for k=2 to 8. (B) Relative changes in CDF curves. (C–F) Consensus matrices for k=2 to 5.
Supplementary Figure 6 | The univariable cox regression result of age, MYCN status, gender, stage, INSS-risk and DL-probability.
Supplementary Figure 7 | Decision curve analysis for 3 models: DL-model (red), clinical covariates (palm green) and combined model (green).
Supplementary Figure 8 | The ceRNA network associated with CCNB1, CD9, MYCNOS, TERC, SNHG1 and MIR17HG.
Supplementary Figure 9 | ESTIMATE scores for samples in GSE49710. (A) The total ESTIMATE scores. (B) Immune socres. (C) Stromal scores.
Supplementary Figure 10 | The immune microenvironment in neuroblastoma. (A) Relative proportions of cell types in S1 and S2. Wilcoxon rank sum tests were used to detect differences between two subgroups (n=498). ns, not significant; *:0.05, **:0.01, ***:0.001, ****:0.0001 (B) Cox regressions for individual cell types in S1, S2 and the whole cohort. Dots are colored red when hazard ratios are higher than 1 and are colored blue when hazard ratios are less than 1. Also, a larger circle means a lower p-value.
Supplementary Figure 11 | Immune microenvironment molecules. Differences between groups were examined by Wilcoxon rank sum tests. ns: not significant, *:0.05, **:0.01, ***:0.001, ****:0.0001 (A) S1 owned higher cytolytic activities, which were calculated by GZMA*PRF1 (Wilcoxon rank sum tests: p < 0.001). (B) Cytokines in S1 and S2. (C) HLA molecules in S1 and S2. (D) Immune checkpoint molecules in S1 and S2.
References
1. Matthay KK, Maris JM, Schleiermacher G, Nakagawara A, Mackall CL, Diller L, et al. Neuroblastoma. Nat Rev Dis Primers (2016) 2:16078. doi: 10.1038/nrdp.2016.78
2. Maris JM, Hogarty MD, Bagatell R, Cohn SL. Neuroblastoma. Lancet (2007) 369(9579):2106–20. doi: 10.1016/S0140-6736(07)60983-0
3. Pinto NR, Applebaum MA, Volchenboum SL, Matthay KK, London WB, Ambros PF, et al. Advances in Risk Classification and Treatment Strategies for Neuroblastoma. J Clin Oncol (2015) 33(27):3008–17. doi: 10.1200/JCO.2014.59.4648
4. Cheung NK, Dyer MA. Neuroblastoma: Developmental Biology, Cancer Genomics and Immunotherapy. Nat Rev Cancer (2013) 13(6):397–411. doi: 10.1038/nrc3526
5. Jones DTW, Banito A, Grunewald TGP, Haber M, Jager N, Kool M, et al. Molecular Characteristics and Therapeutic Vulnerabilities Across Paediatric Solid Tumours. Nat Rev Cancer (2019) 19(8):420–38. doi: 10.1038/s41568-019-0169-x
6. Louis CU, Shohet JM. Neuroblastoma: Molecular Pathogenesis and Therapy. Annu Rev Med (2015) 66:49–63. doi: 10.1146/annurev-med-011514-023121
7. Vandesompele J, Baudis M, De Preter K, Van Roy N, Ambros P, Bown N, et al. Unequivocal Delineation of Clinicogenetic Subgroups and Development of a New Model for Improved Outcome Prediction in Neuroblastoma. J Clin Oncol (2005) 23(10):2280–99. doi: 10.1200/JCO.2005.06.104
8. Vermeulen J, De Preter K, Naranjo A, Vercruysse L, Van Roy N, Hellemans J, et al. Predicting Outcomes for Children With Neuroblastoma Using a Multigene-Expression Signature: A Retrospective SIOPEN/COG/GPOH Study. Lancet Oncol (2009) 10(7):663–71. doi: 10.1016/S1470-2045(09)70154-8
9. Camacho DM, Collins KM, Powers RK, Costello JC, Collins JJ. Next-Generation Machine Learning for Biological Networks. Cell (2018) 173(7):1581–92. doi: 10.1016/j.cell.2018.05.015
10. Niazi MKK, Parwani AV, Gurcan MN. Digital Pathology and Artificial Intelligence. Lancet Oncol (2019) 20(5):e253–61. doi: 10.1016/S1470-2045(19)30154-8
11. Ngiam KY, Khor IW. Big Data and Machine Learning Algorithms for Health-Care Delivery. Lancet Oncol (2019) 20(5):e262–73. doi: 10.1016/S1470-2045(19)30149-4
12. Libbrecht MW, Noble WS. Machine Learning Applications in Genetics and Genomics. Nat Rev Genet (2015) 16(6):321–32. doi: 10.1038/nrg3920
13. Chen YC, Ke WC, Chiu HW. Risk Classification of Cancer Survival Using ANN With Gene Expression Data From Multiple Laboratories. Comput Biol Med (2014) 48:1–7. doi: 10.1016/j.compbiomed.2014.02.006
14. Xu X, Zhang Y, Zou L, Wang M, Li A. eds. A Gene Signature for Breast Cancer Prognosis Using Support Vector Machine, in: 2012 5th International Conference on BioMedical Engineering and Informatics. IEEE 2012 16-18 Oct (2012).
15. Delen D, Walker G, Kadam A. Predicting Breast Cancer Survivability: A Comparison of Three Data Mining Methods. Artif Intell Med (2005) 34(2):113–27. doi: 10.1016/j.artmed.2004.07.002
16. Ting DSW, Cheung CY-L, Lim G, Tan GSW, Quang ND, Gan A, et al. Development and Validation of a Deep Learning System for Diabetic Retinopathy and Related Eye Diseases Using Retinal Images From Multiethnic Populations With Diabetes. JAMA (2017) 318(22):2211–23. doi: 10.1001/jama.2017.18152
17. Bi WL, Hosny A, Schabath MB, Giger ML, Birkbak NJ, Mehrtash A, et al. Artificial Intelligence in Cancer Imaging: Clinical Challenges and Applications. CA Cancer J Clin (2019) 69(2):127–57. doi: 10.3322/caac.21552
18. Eraslan G, Avsec Z, Gagneur J, Theis FJ. Deep Learning: New Computational Modelling Techniques for Genomics. Nat Rev Genet (2019) 20(7):389–403. doi: 10.1038/s41576-019-0122-6
19. Chabon JJ, Hamilton EG, Kurtz DM, Esfahani MS, Moding EJ, Stehr H, et al. Integrating Genomic Features for Non-Invasive Early Lung Cancer Detection. Nature (2020) 580(7802):245–51. doi: 10.1038/s41586-020-2140-0
20. Chaudhary K, Poirion OB, Lu L, Garmire LX. Deep Learning-Based Multi-Omics Integration Robustly Predicts Survival in Liver Cancer. Clin Cancer Res (2018) 24(6):1248–59. doi: 10.1158/1078-0432.CCR-17-0853
21. Tranchevent L-C, Azuaje F, Rajapakse JC. A Deep Neural Network Approach to Predicting Clinical Outcomes of Neuroblastoma Patients. BMC Med Genomics (2019) 12(Suppl 8):178–. doi: 10.1186/s12920-019-0628-y
22. Park A, Nam S. Deep Learning for Stage Prediction in Neuroblastoma Using Gene Expression Data. Genomics Inform (2019) 17(3):e30–e. doi: 10.5808/GI.2019.17.3.e30
23. Vaswani A, Shazeer N, Parmar N, Uszkoreit J, Jones L, Gomez AN, et al eds. Attention Is All You Need. In: Advances in Neural Information Processing Systems. NIPS
24. Lin T-Y, Goyal P, Girshick R, He K, Dollár P. eds. Focal Loss for Dense Object Detection. In: Proceedings of the IEEE International Conference on Computer Vision. ICCV.
25. Kingma DP, Ba J. Adamml: A Method for Stochastic Optimization. (2014). arXiv preprint arXiv:14126980.
26. Glorot X, Bengio Y. eds. Understanding the Difficulty of Training Deep Feedforward Neural Networks. In: Proceedings of the Thirteenth International Conference on Artificial Intelligence and Statistics. PMLR.
27. Eusebi P. Diagnostic Accuracy Measures. Cerebrovasc Dis (2013) 36(4):267–72. doi: 10.1159/000353863
28. Robin X, Turck N, Hainard A, Tiberti N, Lisacek F, Sanchez JC, et al. pROC: An Open-Source Package for R and S+ to Analyze and Compare ROC Curves. BMC Bioinf (2011) 12:77. doi: 10.1186/1471-2105-12-77
29. Heagerty PJ, Lumley T, Pepe MS. Time-Dependent ROC Curves for Censored Survival Data and a Diagnostic Marker. Biometrics (2000) 56(2):337–44. doi: 10.1111/j.0006-341X.2000.00337.x
31. Zhong X, Liu Y, Liu H, Zhang Y, Wang L, Zhang H. Identification of Potential Prognostic Genes for Neuroblastoma. Front Genet (2018) 9:589. doi: 10.3389/fgene.2018.00589
32. De Preter K, Vermeulen J, Brors B, Delattre O, Eggert A, Fischer M, et al. Accurate Outcome Prediction in Neuroblastoma Across Independent Data Sets Using a Multigene Signature. Clin Cancer Res (2010) 16(5):1532–41. doi: 10.1158/1078-0432.CCR-09-2607
33. Wilkerson MD, Hayes DN. ConsensusClusterPlus: A Class Discovery Tool With Confidence Assessments and Item Tracking. Bioinformatics (2010) 26(12):1572–3. doi: 10.1093/bioinformatics/btq170
34. Gu Z, Eils R, Schlesner M. Complex Heatmaps Reveal Patterns and Correlations in Multidimensional Genomic Data. Bioinformatics (2016) 32(18):2847–9. doi: 10.1093/bioinformatics/btw313
35. Therneau TM, Grambsch PM. The Cox Model. In: Modeling Survival Data: Extending the Cox Model, vol. p. German: Springer (2000). p. 39–77.
36. Kassambara A, Kosinski M, Biecek P, Fabian S. Survminer: Drawing Survival Curves Using'ggplot2'. R Package version 03. (2017) 1.
37. Brunson J. Ggalluvial: Layered Grammar for Alluvial Plots. J Open Source Software (2020) 5(49). doi: 10.21105/joss.02017
38. Yu G, Wang LG, Han Y, He QY. Clusterprofiler: An R Package for Comparing Biological Themes Among Gene Clusters. OMICS: A J Integr Biol (2012) 16(5):284–7. doi: 10.1089/omi.2011.0118
39. Shannon P, Markiel A, Ozier O, Baliga NS, Wang JT, Ramage D, et al. Cytoscape: A Software Environment for Integrated Models of Biomolecular Interaction Networks. Genome Res (2003) 13(11):2498–504. doi: 10.1101/gr.1239303
40. Chin C-H, Chen S-H, Wu H-H, Ho C-W, Ko M-T, Lin C-Y. Cytohubba: Identifying Hub Objects and Sub-Networks From Complex Interactome. BMC Syst Biol (2014) 8 Suppl 4(Suppl 4):S11–S. doi: 10.1186/1752-0509-8-S4-S11
41. Karagkouni D, Paraskevopoulou MD, Chatzopoulos S, Vlachos IS, Tastsoglou S, Kanellos I, et al. DIANA-TarBase V8: A Decade-Long Collection of Experimentally Supported miRNA–Gene Interactions. Nucleic Acids Res (2017) 46(D1):D239–45. doi: 10.1093/nar/gkx1141
42. Paraskevopoulou MD, Vlachos IS, Karagkouni D, Georgakilas G, Kanellos I, Vergoulis T, et al. DIANA-LncBase V2: Indexing microRNA Targets on Non-Coding Transcripts. Nucleic Acids Res (2016) 44(D1):D231–8. doi: 10.1093/nar/gkv1270
43. Hänzelmann S, Castelo R, Guinney J. GSVA: Gene Set Variation Analysis for Microarray and RNA-Seq Data. BMC Bioinf (2013) 14(1):7. doi: 10.1186/1471-2105-14-7
44. Charoentong P, Finotello F, Angelova M, Mayer C, Efremova M, Rieder D, et al. Pan-Cancer Immunogenomic Analyses Reveal Genotype-Immunophenotype Relationships and Predictors of Response to Checkpoint Blockade. Cell Rep (2017) 18(1):248–62. doi: 10.1016/j.celrep.2016.12.019
45. Yu H, Lee H, Herrmann A, Buettner R, Jove R. Revisiting STAT3 Signalling in Cancer: New and Unexpected Biological Functions. Nat Rev Cancer (2014) 14(11):736–46. doi: 10.1038/nrc3818
46. Yan S, Li Z, Thiele CJ. Inhibition of STAT3 With Orally Active JAK Inhibitor, AZD1480, Decreases Tumor Growth in Neuroblastoma and Pediatric Sarcomas In Vitro and In Vivo. Oncotarget (2013) 4(3):433–45. doi: 10.18632/oncotarget.930
47. Young T, Hazarika D, Poria S, Cambria E. Recent Trends in Deep Learning Based Natural Language Processing [Review Article]. IEEE Comput Intell Magazine (2018) 13(3):55–75. doi: 10.1109/MCI.2018.2840738
48. Vickers AJ, Elkin EB. Decision Curve Analysis: A Novel Method for Evaluating Prediction Models. Med Decis Making (2006) 26(6):565–74. doi: 10.1177/0272989X06295361
49. Zhang H, Zhang X, Li X, Meng WB, Bai ZT, Rui SZ, et al. Effect of CCNB1 Silencing on Cell Cycle, Senescence, and Apoptosis Through the P53 Signaling Pathway in Pancreatic Cancer. J Cell Physiol (2018) 234(1):619–31. doi: 10.1002/jcp.26816
50. Chai N, Xie HH, Yin JP, Sa KD, Guo Y, Wang M, et al. FOXM1 Promotes Proliferation in Human Hepatocellular Carcinoma Cells by Transcriptional Activation of CCNB1. Biochem Biophys Res Commun (2018) 500(4):924–9. doi: 10.1016/j.bbrc.2018.04.201
51. Murayama Y, Oritani K, Tsutsui S. Novel CD9-Targeted Therapies in Gastric Cancer. World J Gastroenterol (2015) 21(11):3206–13. doi: 10.3748/wjg.v21.i11.3206
52. Brosseau C, Colas L, Magnan A, Brouard S. CD9 Tetraspanin: A New Pathway for the Regulation of Inflammation? Front Immunol (2018) 9:2316. doi: 10.3389/fimmu.2018.02316
53. Thomson DW, Dinger ME. Endogenous microRNA Sponges: Evidence and Controversy. Nat Rev Genet (2016) 17(5):272–83. doi: 10.1038/nrg.2016.20
54. Maadi H, Moshtaghian A, Taha MF, Mowla SJ, Kazeroonian A, Haass NK, et al. Multimodal Tumor Suppression by miR-302 Cluster in Melanoma and Colon Cancer. Int J Biochem Cell Biol (2016) 81:121–32. doi: 10.1016/j.biocel.2016.11.004
55. Ahmadalizadeh Khanehsar M, Hoseinbeyki M, Fakhr Taha M, Javeri A. Repression of TGF-β Signaling in Breast Cancer Cells by miR-302/367 Cluster. Cell J (2020) 21(4):444–50. doi: 10.22074/cellj.2020.6193
56. Yoshihara K, Shahmoradgoli M, Martinez E, Vegesna R, Kim H, Torres-Garcia W, et al. Inferring Tumour Purity and Stromal and Immune Cell Admixture From Expression Data. Nat Commun (2013) 4:2612. doi: 10.1038/ncomms3612
57. Rooney MS, Shukla SA, Wu CJ, Getz G, Hacohen N. Molecular and Genetic Properties of Tumors Associated With Local Immune Cytolytic Activity. Cell (2015) 160(1-2):48–61. doi: 10.1016/j.cell.2014.12.033
58. Garrido F. HLA Class-I Expression and Cancer Immunotherapy. Adv Exp Med Biol (2019) 1151:79–90. doi: 10.1007/978-3-030-17864-2_3
59. Raffaghello L, Prigione I, Airoldi I, Camoriano M, Morandi F, Bocca P, et al. Mechanisms of Immune Evasion of Human Neuroblastoma. Cancer Lett (2005) 228(1–2):155–61. doi: 10.1016/j.canlet.2004.11.064
60. Nallasamy P, Chava S, Verma SS, Mishra S, Gorantla S, Coulter DW, et al. PD-L1, Inflammation, non-Coding RNAs, and Neuroblastoma: Immuno-Oncology Perspective. Semin Cancer Biol (2018) 52(Pt 2):53–65. doi: 10.1016/j.semcancer.2017.11.009
61. Hu D. ed. An Introductory Survey on Attention Mechanisms in NLP Problems. In: Proceedings of SAI Intelligent Systems Conference. German: Springer.
62. Quinn JJ, Chang HY. Unique Features of Long non-Coding RNA Biogenesis and Function. Nat Rev Genet (2016) 17(1):47–62. doi: 10.1038/nrg.2015.10
63. Schmitt AM, Chang HY. Long Noncoding RNAs in Cancer Pathways. Cancer Cell (2016) 29(4):452–63. doi: 10.1016/j.ccell.2016.03.010
64. Matsui M, Corey DR. Non-Coding RNAs as Drug Targets. Nat Rev Drug Discovery (2017) 16(3):167–79. doi: 10.1038/nrd.2016.117
65. Laudadio I, Orso F, Azzalin G, Calabro C, Berardinelli F, Coluzzi E, et al. AGO2 Promotes Telomerase Activity and Interaction Between the Telomerase Components TERT and TERC. EMBO Rep (2019) 20(2). doi: 10.15252/embr.201845969
66. Baena-Del Valle JA, Zheng Q, Esopi DM, Rubenstein M, Hubbard GK, Moncaliano MC, et al. MYC Drives Overexpression of Telomerase RNA (hTR/TERC) in Prostate Cancer. J Pathol (2018) 244(1):11–24. doi: 10.1002/path.4980
67. Thin KZ, Tu JC, Raveendran S. Long non-Coding SNHG1 in Cancer. Clin Chim Acta (2019) 494:38–47. doi: 10.1016/j.cca.2019.03.002
68. Cao B, Wang T, Qu Q, Kang T, Yang Q. Long Noncoding RNA SNHG1 Promotes Neuroinflammation in Parkinson’s Disease via Regulating miR-7/NLRP3 Pathway. Neuroscience (2018) 388:118–27. doi: 10.1016/j.neuroscience.2018.07.019
69. Xu J, Meng Q, Li X, Yang H, Xu J, Gao N, et al. Long Noncoding RNA MIR17HG Promotes Colorectal Cancer Progression via miR-17-5p. Cancer Res (2019) 79(19):4882–95. doi: 10.1158/0008-5472.CAN-18-3880
Keywords: neuroblastoma, survival, deep-learning (DL), individual therapy, transcriptome
Citation: Feng C, Xiang T, Yi Z, Meng X, Chu X, Huang G, Zhao X, Chen F, Xiong B and Feng J (2021) A Deep-Learning Model With the Attention Mechanism Could Rigorously Predict Survivals in Neuroblastoma. Front. Oncol. 11:653863. doi: 10.3389/fonc.2021.653863
Received: 15 January 2021; Accepted: 24 June 2021;
Published: 14 July 2021.
Edited by:
Jing He, Guangzhou Medical University, ChinaCopyright © 2021 Feng, Xiang, Yi, Meng, Chu, Huang, Zhao, Chen, Xiong and Feng. This is an open-access article distributed under the terms of the Creative Commons Attribution License (CC BY). The use, distribution or reproduction in other forums is permitted, provided the original author(s) and the copyright owner(s) are credited and that the original publication in this journal is cited, in accordance with accepted academic practice. No use, distribution or reproduction is permitted which does not comply with these terms.
*Correspondence: Jiexiong Feng, fengjiexiong@126.com; Bo Xiong, bxiong@hust.edu.cn; Feng Chen, cfeng3000@163.com
†ORCID: Jiexiong Feng, orcid.org/0000-0001-9596-2330
‡These authors have contributed equally to this work