 Chengru Song1†
 Jingliang Cheng
- 1Department of MRI, The First Affiliated Hospital of Zhengzhou University, Zhengzhou, China
- 2Department of radiotherapy, Henan Provincial People’s Hospital, Zhengzhou, China
Background: This study aims to explore the utility of whole-lesion apparent diffusion coefficient (ADC) histogram analysis for differentiating nasopharyngeal lymphoma (NPL) from nasopharyngeal carcinoma (NPC) following readout-segmented echo-planar diffusion-weighted imaging (RESOLVE sequence).
Methods: Thirty-eight patients with NPL and 62 patients with NPC, who received routine head-and-neck MRI and RESOLVE (b-value: 0 and 1,000 s/mm2) examinations, were retrospectively evaluated as derivation cohort (February 2015 to August 2018); another 23 patients were analyzed as validation cohort (September 2018 to December 2019). The RESOLVE data were obtained from the MAGNETOM Skyra 3T MR system (Siemens Healthcare, Erlangen, Germany). Fifteen parameters derived from the whole-lesion histogram analysis (ADCmean, variance, skewness, kurtosis, ADC1, ADC10, ADC20, ADC30, ADC40, ADC50, ADC60, ADC70, ADC80, ADC90, and ADC99) were calculated for each patient. Then, statistical analyses were performed between the two groups to determine the statistical significance of each histogram parameter. A receiver operating characteristic curve (ROC) analysis was conducted to assess the diagnostic performance of each histogram parameter for distinguishing NPL from NPC and further tested in the validation cohort; calibration of the selected parameter was tested with Hosmer–Lemeshow test.
Results: NPL exhibited significantly lower ADCmean, variance, ADC1, ADC10, ADC20, ADC30, ADC40, ADC50, ADC60, ADC70, ADC80, ADC90 and ADC99, when compared to NPC (all, P < 0.05), while no significant differences were found on skewness and kurtosis. Furthermore, ADC99 revealed the highest diagnostic efficiency, followed by ADC10 and ADC20. Optimal diagnostic performance (AUC = 0.790, sensitivity = 91.9%, and specificity = 63.2%) could be achieved when setting ADC99 = 1,485.0 × 10−6 mm2/s as the threshold value. The predictive performance was maintained in the validation cohort (AUC = 0.817, sensitivity = 94.6%, and specificity = 56.2%)
Conclusion: Whole-lesion ADC histograms based on RESOLVE are effective in differentiating NPC from NPL.
Background
Nasopharyngeal carcinoma (NPC) and nasopharyngeal lymphoma (NPL) are two of the most common types of nasopharyngeal malignancies. The differential diagnosis is generally difficult, since NPC and NPL always have parallel clinical manifestation, such as nasal obstruction, epistaxis, and headache. Although NPL is rarely seen, the occurrence rate of lymphoma has continuously increased of late years. These two tumors significantly differ from each other in the aspect of biological behavior, prognosis, and therapeutic methods. Hence, a precise diagnosis is essential to optimize individual therapeutic regimens. Therefore, it is of significant clinical significance to differentiate NPC from NPL in the early phase.
Magnetic resonance imaging (MRI) and computed tomography (CT) are the prime non-invasive imaging methods applied to the diagnosis of nasopharyngeal tumors. Traditional MRI would, without doubt, provide a good description of the tumor and the relationship of anatomical structures. However, NPC and NPL usually share parallel imaging features on routine pre- or post-contrast scans (1), thereby leading to poor differentiating diagnostic accuracy.
To date, the availability of diffusion-weighted imaging (DWI) has been widely confirmed in head and neck tumors, such as head and neck lesions (2, 3), and maxillofacial (4), orbital (5), or sinonasal neoplasms (6). However, very few studies have focused on tumors in the nasopharynx, especially differentiating NPC from NPL (7, 8). Moreover, it is noteworthy that readout-segmented echo-planar diffusion-weighted imaging (RESOLVE sequence) can promote image quality in the area of head and neck, when compared to routine DWI, which uses the single-shot echo-planar imaging (SS-EPI) technique, reducing T2* blurring and susceptibility artifacts by reduce echo-spacing (9, 10). The apparent diffusion coefficient (ADC) maps acquired from the RESOLVE-DWI own a higher resolution and signal-to-noise ratio compared to routine DWI, thereby significantly improved the diagnostic reliability and efficiency of the ADC value. In addition, these ADC values are usually calculated by drawing a single region of interest (ROI) over the solid part of the tumor or over the maximum area of the tumor. However, this freehand procedure is often not sufficient sensitive to unconspicuous changes.
As an up-to-date technique of image processing, the whole-lesion histogram features of ADC maps based on voxel distribution can eliminate sampling bias and improve the reproducibility of the quantitative analysis. Furthermore, the assessment of the tumor heterogeneity can be improved with the application of histograms, which has been verified in previous studies of Head and Neck Squamous Cell Carcinoma (11, 12) and thyroid cancer (13, 14). Histogram parameters, including mean value, variance, kurtosis, skewness, and percentiles, are used to quantitatively describe the distributions of tumor biomarkers. With the continuous development in both signal processing methods and high-resolution MRI, the histogram analysis of MRI is being used in the characterization of tumors cumulatively, such as endometrial cancer (15), rectal cancer (16), lymph nodes in the head and neck region (17), glioma (18), posterior fossa tumors (19), etc. However, the application of RESOLVE-DWI or histograms in nasopharynx tumors was rarely reported.
The present study attempted to explore the utility of whole-lesion ADC histogram analysis for differentiating NPL from NPC following RESOLVE imaging.
Methods
Patients
The present study was approved by the Review Committee of the First Affiliated Hospital of Zhengzhou University (No:2015010039). For derivation cohort, the data obtained from patients with pathologically proved NPC or NPL in our hospital from February 2015 to August 2018 were analyzed; for validation cohort, the same set of data were collected for patients admitted from September 2018 to December 2019. The inclusion criteria were as below: (1) patients without previous treatment, surgery, or biopsy, and (2) patients who successfully received RESOLVE-DWI and routine MRI of the nasopharynx. The exclusion criteria were as below: (1) patients with obvious susceptibility or motion artifacts and (2) patients with small tumor volume (anteroposterior diameter <1 cm) that could lead to difficulties in the process of image analysis.
MRI Examination
MRI examinations were achieved on a 3.0 T MR scanner (Magnetom Skyra, Siemens Healthcare, Erlangen, Germany) with a head and neck coil (integrated 20-channel). The pre-contrast scan protocols were listed below: (1) axial T1 weighted spin echo images: repetition time (TR) = 600 ms, echo time (TE) = 9 ms, section thickness = 4 mm, and intersection gap = 1 mm; (2) fat suppressed axial/sagittal/coronal T2 weighted spin echo images: TR = 4300 ms, TE = 111 ms, section thickness = 4 mm, and intersection gap = 1 mm; (3) DWI using readout-segmented echo-planar imaging, parallel imaging, and two-dimensional navigator-based reacquisition: five readout segments, echo spacing = 0.34 ms, b value = 0 and 1,000 s/mm2, section thickness = 4 mm, intersection gap = 1 mm, FOV = 178 × 178 mm, matrix = 178 × 178, TR = 3900 ms, TE = 64 ms; (4) fat suppressed axial/sagittal/coronal T1 weighted contrast scans: TR = 884 ms, TE = 6.8 ms, section thickness = 4 mm, and intersection gap = 1 mm. Gadolinium diethylenetriamine pentaacetic acid (Gd-DTPA, Magnevist, Schering, Berlin, Germany) was intravenously injected at a rate of 2 ml/s (total dose, 0.1 mmol/kg of body weight), followed by a 20-ml saline flush.
Image Analysis
The general MR features including lesion homogeneity, symmetry, volume, and enhancement intensity were analyzed and compared between NPL and NPC patients. The lesion was considered homogeneous as the lesion signal intensity was within 10% of median values on 90% of voxels within the lesion. The degree of enhancement was defined as: High-enhancement that was equal or higher than the nasal mucosa. Low-enhancement that was equal or lower than adjacent muscles. Intermediate- degree of enhancement was between the adjacent muscles and nasal mucosa.
The ADC map was automatically reconstructed after the scan of RESOLVE. All ADC histogram data were post-processed offline using an Image processing software (ImageJ, version 1.47; https://imagej.nih.gov/ij/) by two experienced radiologists. In order to maintain the consistency among different cases, the window width and window level were adjusted to 2,560 and 1,280 respectively in advance. Then, the region of interest (ROI) including the hemorrhagic, cystic, or necrosis portion was manually drawn around the whole tumor margin (FOV 178×178 mm, matrix 178 × 178; ADC FOV 178 × 178mm, matrix 178 × 178) with reference to the pre- and post-contrast MRI and DWI image. The high-signal intensity areas were considered as tumor tissues (20); boundaries were drawn along these areas to ensure that the entire lesion was included. For evaluating the inter-reader variability of ROIs, each of the two readers extracted mean ROI value from the source images that they have not previously seen; the software will calculate the mean values after the delineation of ROIs. The inter-reader variability was analyzed using the coefficient of variation (CV) for mean ROIs between the two readers. CV was calculated as SD divided by the mean. Subsequently, the histogram and frequency distribution table of each section were automatically generated. The frequency distribution table of all sections was imported into the Excel software (Version 1909, Microsoft Corp, Chicago, IL, USA) for the summary, and the frequency distribution table of the whole tumor was obtained. SPSS (Version 25.0 Armonk, NY: IBM Corp) was used for the histogram analysis, and 15 ADC histogram parameters (ADCmean, variance, skewness, kurtosis, ADC1, ADC10, ADC20, ADC30, ADC40, ADC50, ADC60, ADC70, ADC80, ADC90, and ADC99) were calculated. The ADC histogram was plotted with the value of the ADC map on the X-axis, while the Y-axis was expressed as the frequency of each ADC value.
The representative images, which illustrate how the ROI was placed, and the histograms are presented in Figure 1.
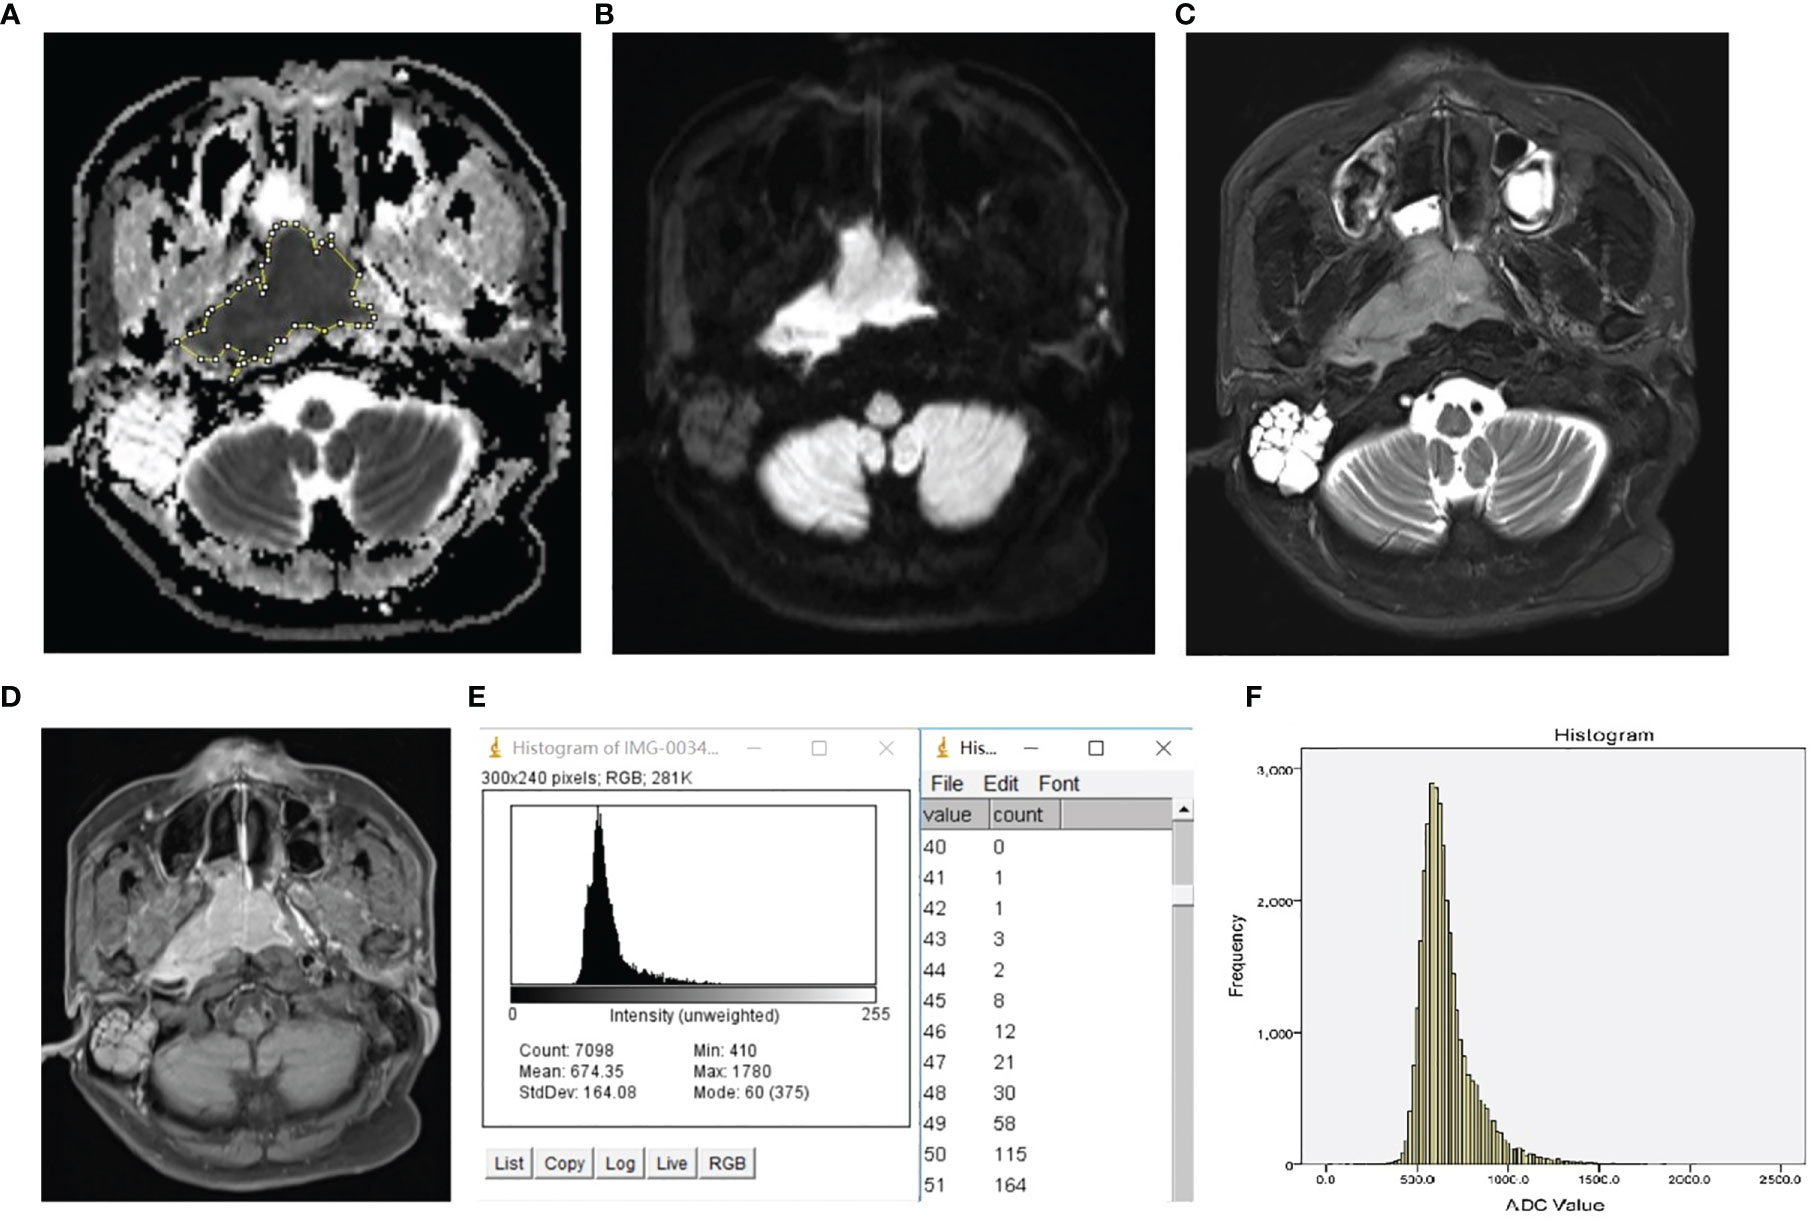
Figure 1 Representative ROI selection schematic illustration and histogram of NPL. The ROI was manually drawn around the whole tumor margin on each section of the ADC map (A) with reference to DW image (B), T2 weighted image with fat suppression (C), and T1 weighted post-contrast image with fat suppression (D). The histogram and frequency distribution table of each section (E) were automatically generated. After adding up the frequency distribution data of all sections, the whole-tumor histogram (F) was generated by SPSS.
ADCmean is the average of all levels of the ADC maps within the whole-tumor ROI (21). ADCn is the point at which the n% of the voxel values that form the histogram is found to the left (21). Calculation of ADCmean, ADCn, skewness, and variation were performed according to the methodology of a previous study (21).
Statistical Analysis
The histogram data of all the 15 parameters were evaluated for normality using the Kolmogorov–Smirnov test and test of variance homogeneity. Parameters that conformed to the normal distribution were expressed as mean ± standard deviation, while two-independent sample t-test was performed for comparisons between two groups. The other parameter values were expressed as median ± interquartile range, and the Mann–Whitney U test was used for comparison. Receiver operating characteristic (ROC) curve analysis was used to investigate the diagnostic ability of significant parameters for discrimination; calibration was assessed using Hosmer–Lemeshow test with associated P value. The cut-off value was calculated using the maximum of the Youden index (Youden index = sensitivity + specificity − 1). All statistical analysis was performed using SPSS. A probability of P <0.05 was considered statistically significant.
Results
For derivation cohort, 62 patients with NPC (54 non-keratinizing and eight keratinizing) and 38 patients with lymphoma (18 patients with NK/T lymphoma, 11 patients with diffuse large B-cell lymphoma, two patients with classic mantle cell lymphoma, two patients with Burkitt lymphoma, two patients with angioimmunoblastic T-cell lymphoma, one patient with peripheral T-cell lymphoma, one patient with anaplastic large cell lymphoma, and one patient with T-lymphoblastic lymphoma) were included in the present study. In the NPC group, 51 male and 11 female patients were included, and their mean age was 48.97 years old, which ranged within 9–85 years old. In the NPL group, 27 male and 11 female patients were included, and their mean age was 46.16 years old, which ranged within 6–76 years old. Baseline, histological and ADC values of the patients were presented in Table 1. For validation cohort, 16 patients (12 non-keratinizing and four keratinizing) with NPC and seven patients (six patients with NK/T lymphoma and one patient with diffuse large B cell lymphoma) with NPL were included; there were 18 male and five females, and their mean age was 48 years old.
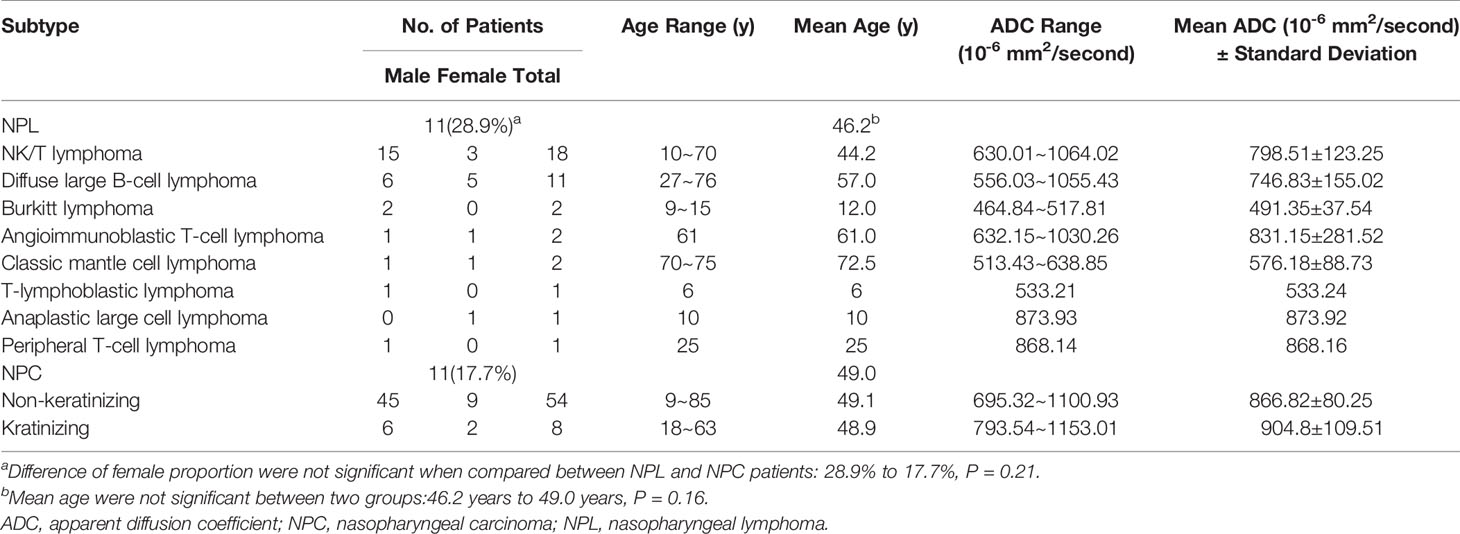
Table 1 Histologic subtypes of patients with NPL and NPC.
The statistical results revealed that only three parameters (ADCmean, ADC70, and ADC80) conformed to the normal distribution. Thus, for these three parameters, two-independent sample t-test was used for comparison, while Mann–Whitney U-test was used to evaluate the other parameters. Coefficient of variation of ROIs between the two readers was 6.55%, thus the inter-reader variability of ROIs was considered small.
As depicted in Table 1, there were no statistical difference between patients with NPL or NPC in consideration of mean age (46.2 years to 49.0 years, P = 0.16) or sex proportion (as for female, 28.9 to 17.7%, P = 0.21).
The features of MR image between patients with NPL and NPC were recorded in Table 2, When compared to NPC patients, lesions of NPL patients tend to be more symmetric (44.7 to 22.6%, P = 0.02) and homogenous on T1WI (92.1 to 72.6%, P = 0.018), T2WI (57.9 to 32.3%, P = 0.012), while the distribution of the degrees of enhancement was not significantly different between the two groups (P = 0.120). Table 3 summarizes the detailed comparison of ADC histogram parameters between NPL and NPC. The 13 parameters (ADCmean, variance, ADC1, ADC10, ADC20, ADC30, ADC40, ADC50, ADC60, ADC70, ADC80, ADC90 and ADC99) between these two groups were statistically different (all, P < 0.05). In addition, the NPL group had lower values for the above 13 parameters, when compared to those in the NPC group. However, no significant differences were found on the other two parameters (kurtosis and skewness).
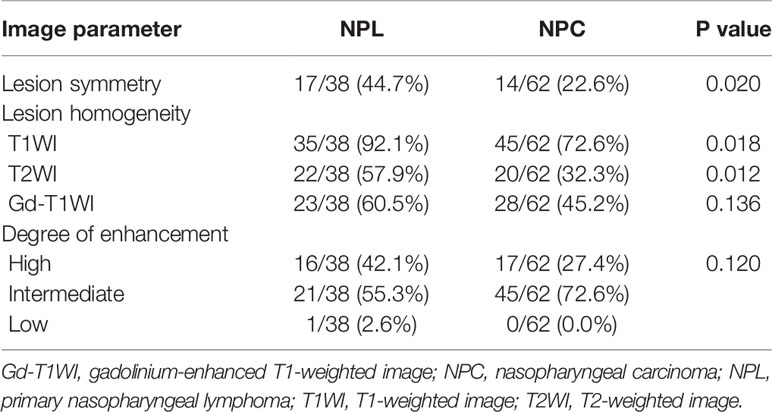
Table 2 Features of MR images between patients with NPL or NPC.
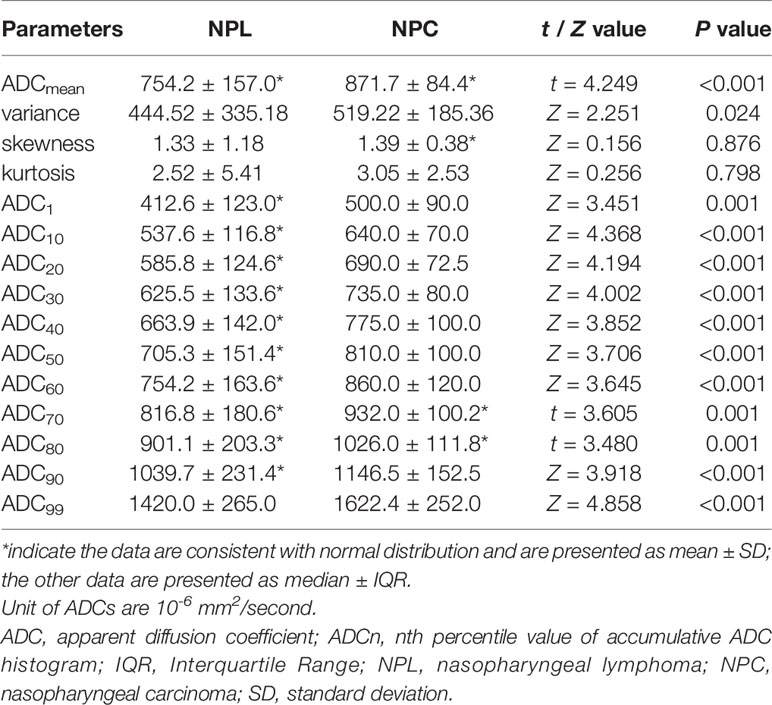
Table 3 Differences of ADC Histogram Parameters between NPL and NPC.
Table 4 summarizes the diagnostic performance of significant ADC histogram parameters in differentiating NPL from NPC. The best diagnostic performance was achieved at a threshold of ADC99 = 1,485.0 × 10−6 mm2/s (AUC = 0.790, sensitivity = 91.9%, specificity = 63.2%, Youden index = 0.551), followed by ADC10 = 545.0 × 10⁻⁶ mm2/s (AUC = 0.761, sensitivity = 95.2%, specificity = 52.6%) and ADC20 = 620.0 × 10⁻⁶ mm2/s (AUC = 0.750, sensitivity = 83.9%, specificity = 63.2%). The difference of the AUC between ADC99 and ADC10 was significant (P = 0.035).
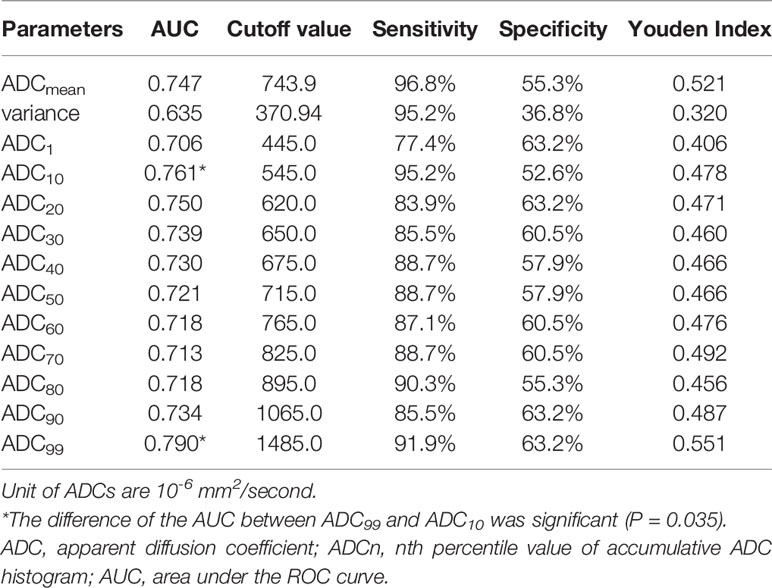
Table 4 ROC Analysis of ADC Histogram Parameters for Discriminating NPL from NPC.
The validation cohort was used to verify the predictive performance and calibration of ADC99; ROC curve tested in this cohort showed an AUC of 0.817 (sensitivity = 94.6% and specificity = 56.2%, Youden index = 0.508, detailed in Figure 2), with a Hosmer–Lemeshow chi-square of 4.3 (P = 0.138).
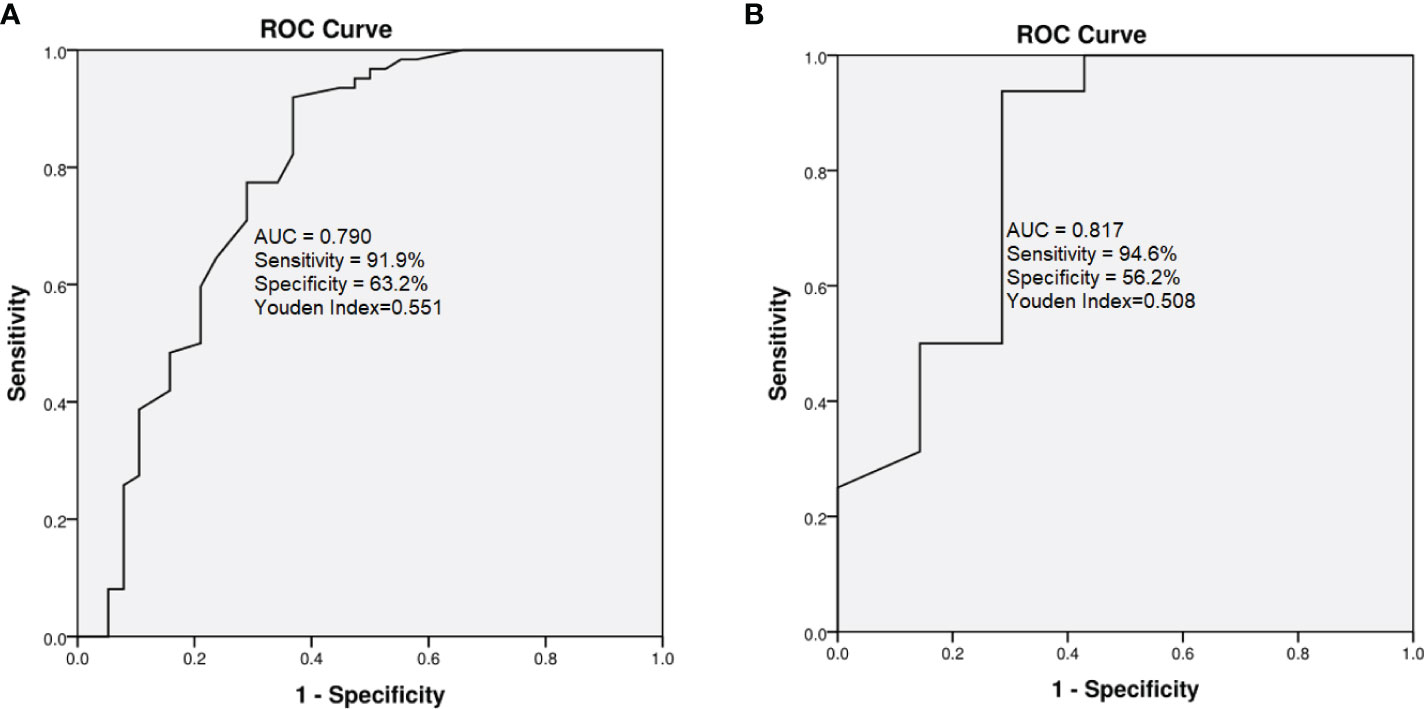
Figure 2 Comparison of ROC curves for ADC99 in derivation (A) and validation cohorts (B). In derivation cohort, AUC = 0.790, sensitivity = 91.9%, specificity = 63.2%, Youden Index = 0.551; in the validation cohort, AUC 0.817, sensitivity = 94.6% and specificity = 56.2%, Youden Index = 0.508.
Discussion
The aim of this study was to determine the role of whole-lesion ADC histogram analysis for differentiating NPL from NPC based on RESOLVE imaging. The results demonstrated that among the 15 histogram parameters, a total of 13 parameters significantly differed between the NPL and NPC groups, which indicate that in addition to the normal MR feature that differs between the two groups (Table 2), the whole-lesion histogram analysis of ADC maps can also help to efficiently differentiate NPL from NPC and demonstrate the tumors’ heterogeneity. Furthermore, the ROC curve analysis of parameters with statistical difference revealed that the ADC99 might be the most promising parameter for the differentiation work and further test in validation cohort showed good performance and calibration.
As a functional imaging technique, DWI, which can measure the mobility of water molecules in tissues, has been applied to distinguish NPL from NPC (1, 7, 8). In previous studies (1, 7, 8), ADC values were most widely measured by the single-shot echo-planar imaging (SS-EPI) DWI sequence. However, since SS-EPI is susceptible to magnetic susceptibility artifacts, its image quality has not always been satisfying (9). Furthermore, few studies (22, 23) have reported the application of RESOLVE-DWI for nasopharynx tumors, as well as the discrimination of NPL and NPC. In the present study, the ADC maps used for the histogram analysis were obtained using the RESOLVE sequence. RESOLVE is a novel technique that uses two-dimensional navigator-based reacquisition to perform a non-linear phase correction and control the real-time reacquisition of unusable data that cannot be corrected (24). Furthermore, RESOLVE has been used to acquire high resolution DWI images, and the use of parallel imaging allows for it to have suitable scan time for clinical routine applications (25, 26). Zhao et al. (24) reported that RESOLVE prominently improves image quality in evaluating lesions in nasal sinus, and offers more precise ADC values, when compared to SS-EPI. Meanwhile, compared to the majority of the previous studies, which have been mostly based on selected ROIs drawn on the tumor’s solid part for analysis, whole-lesion ADC histogram analysis is a more impersonal technique, which provides measurable information on the heterogeneity and tissue characteristics of the whole tumor (27).
In the present study, the ADCmean of NPL was much lower than that of NPC, which was in correspondence with previous similar studies (1, 7). In addition, the other ADC parameters (ADC1, ADC10, ADC20, ADC30, ADC40, ADC50, ADC60, ADC70, ADC80, ADC90 and ADC99) of NPL were also lower than that of NPL. Depending mainly on the composition of the extra-cellular matrix and cell density, the ADC value has been generally considered to be positively correlated with the volume of the extravascular extracellular space and inversely correlated with tissue cellularity (13, 14). Lymphomas often show smaller ADCs, since lymphoma cells have relatively high nuclear-to-cytoplasm ratios and are densely packed throughout lesions (17, 28, 29).
Variance, skewness, and kurtosis have been indicated as promising biomarkers relevant to tumor heterogeneity. Variance represents the dispersion of the histogram. In the present study, NPC had a higher variance value than NPL, which may indicate that the signals of NPC lesions are more heterogeneous, when compared to NPL, in ADC maps, and that the ADC value’s distribution is more discrete. Therefore, this suggests that the tumor heterogeneity of NPC is higher. Previous observations (17, 29) have implied that NPC has a higher rate of necrosis and cystization, and more significant tumor heterogeneity, which is in line with the present results. However, no significant difference was found on skewness and kurtosis. Hence, further studies with larger sample sizes or more advanced texture analysis methods are needed.
The diagnostic superiority of ADC values has been reported in various tumors (30, 31). The study conducted by Guan et al. revealed that ADC90 was the strongest predictive indicator for differentiating tumors from normal cervical tissues (30). In the present study, ADC99 also performed better in the discrimination between NPL and NPC. This might be associated with the inclusion of necrosis and cystic areas, which have a large fluctuation of ADC values. However, ADC10, ADC20, and ADCmean also revealed good differentiating performance.
In our study, the difference of ADCmean was significant between NPL and NPC cases, and the AUC of ADC99 was slightly higher than those of ADCmeans. Thus, ADC99 didn’t provide much advance in terms of differential diagnosis between NPL and NPC. However, previous studies (32) of the application of ADC histogram in the differential diagnosis of various brain tumors had described the advantage of this method over ADC values and means alone, for the range of different brain tumors usually overlap a lot. In our cohort, the overlap of ADC range also existed between different histological subtypes of NPL and NPCs (Table 1). Figure 3 depicted the ADC image and ADC value distributions of a NPC (A1 and A2) patient and a NPL patient (B1 and B2); there were overlaps of ADC value distribution between these two cases and their mean values were close (773.04 × 10⁻⁶ mm2/s vs. 674.35 × 10⁻⁶ mm2/s). But using a ADC99 cut-off value of 1,480 × 10−6 mm2/s can differ NPC from NPL (1,570 × 10−6 mm2/s vs. 1,210 × 10−6 mm2/s). It is still possible that ADC histogram will provide more valuable support in a larger and in histologically more specified cohort. Thus, results in our studies can prompt further studies on the role of ADC histogram in the diagnosis of NPL and NPC.
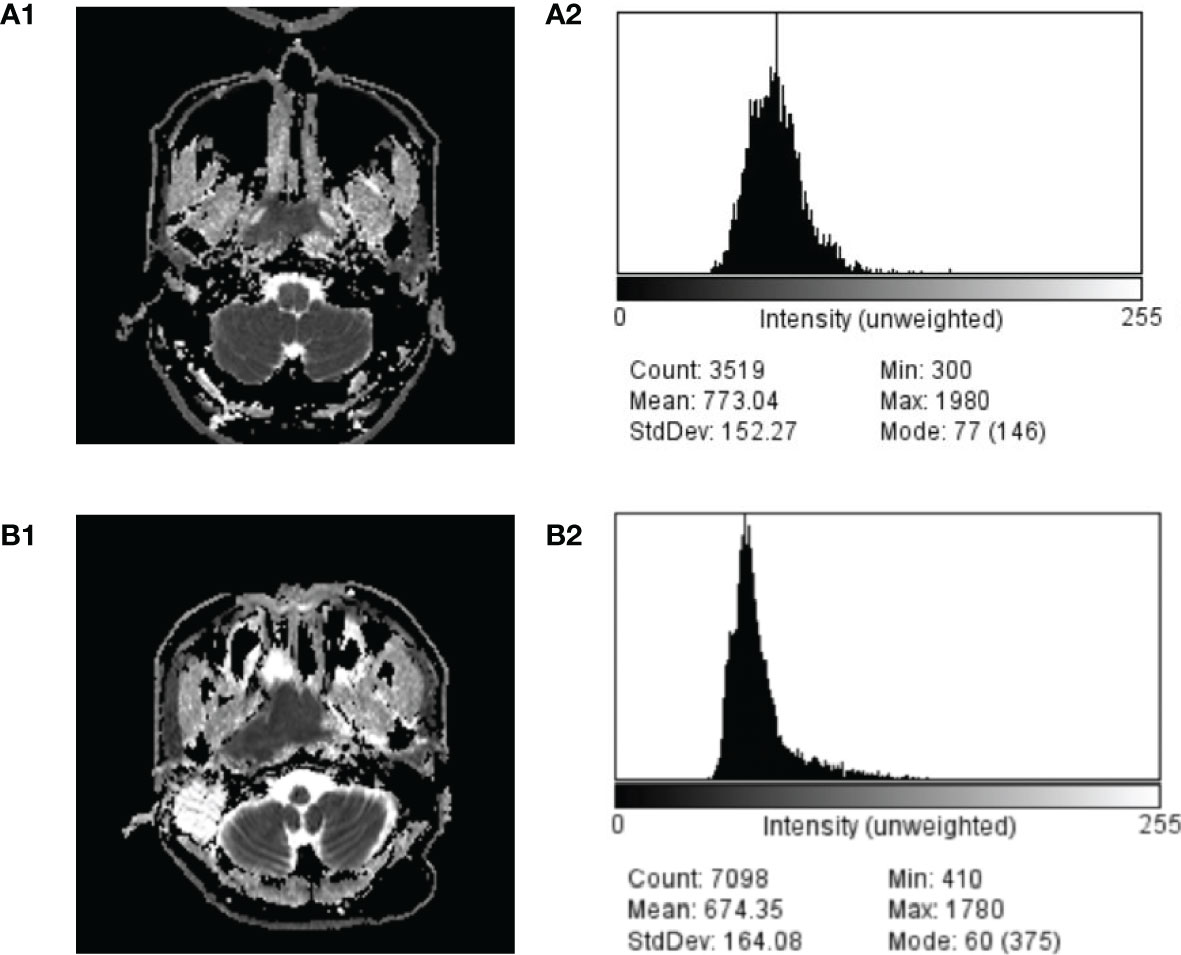
Figure 3 Comparison of ADC image and ADC value distribution of a case of NPC (A1, A2) and NPL (B1, B2).
There were several limitations in the present study. First, the sample size of NPL was limited. Further, although these NPL tumors included a variety of pathological types, a statistical analysis among the different pathological types was not performed. Third, only two b-values, 0 and 1,000 s/mm2, were set in our DWI sequence, therefore the perfusion effects may bias the ADC values. Further study based on multi-b value DWI sequence is needed. Fourth, further second order texture analysis is needed. Second-order texture parameters, such as entropy, can describe the more subtle aspects of lesion texture, and this would be more valuable for differentiation work.
Conclusion
In conclusion, the present study indicated that whole-lesion ADC histogram analysis based on high-resolution RESOLVE imaging is effective in differentiating NPL from NPC.
Data Availability Statement
The raw data supporting the conclusions of this article will be made available by the authors, without undue reservation.
Ethics Statement
This study was conducted with approval from the Review Committee of the First Affiliated Hospital of Zhengzhou University (No: 2015010039). The patients/participants provided their written informed consent to participate in this study.
Author Contributions
CS, PC, and SX acquired data. CR, PC, and SX drafted the manuscript. JC and YZ contributed substantially to its revision. All authors take responsibility for the paper as a whole. All authors contributed to the article and approved the submitted version.
Conflict of Interest
The authors declare that the research was conducted in the absence of any commercial or financial relationships that could be construed as a potential conflict of interest.
Acknowledgments
We are particularly grateful to all the people who have given us help on our article. This work was supported by the First Affiliated Hospital of Zhengzhou University.
Abbreviations
NPC, Nasopharyngeal carcinoma; NPL, nasopharyngeal lymphoma; MRI, Magnetic resonance imaging; CT, computed tomography; ADC, apparent diffusion coefficient; DWI, diffusion-weighted imaging; ROI, region of interest; ROC, Receiver operating characteristic; SS-EPI, single-shot echo-planar imaging.
References
1. Kato H, Kanematsu M, Kawaguchi S, Watanabe H, Mizuta K, Aoki M. Evaluation of imaging findings differentiating extranodal non-Hodgkin’s lymphoma from squamous cell carcinoma in naso- and oropharynx. Clin Imaging (2013) 37:657–63. doi: 10.1016/j.clinimag.2012.11.007
2. Maeda M, Kato H, Sakuma H, Maier SE, Takeda K. Usefulness of the apparent diffusion coefficient in line scan diffusion-weighted imaging for distinguishing between squamous cell carcinomas and malignant lymphomas of the head and neck. AJNR Am J Neuroradiol (2005) 26:1186–92.
3. Surov A, Meyer HJ, Wienke A. Apparent diffusion coefficient for distinguishing between malignant and benign lesions in the head and neck region: A systematic review and meta-analysis. Front Oncol (2020) 9:1362. doi: 10.3389/fonc.2019.01362
4. Kitamoto E, Chikui T, Kawano S, Ohga M, Kobayashi K, Matsuo Y, et al. The application of dynamic contrast-enhanced MRI and diffusion-weighted MRI in patients with maxillofacial tumors. Acad Radiol (2015) 22:210–6. doi: 10.1016/j.acra.2014.08.016
5. Xu XQ, Qian W, Ma G, Hu H, Su GY, Liu H, et al. Combined diffusion-weighted imaging and dynamic contrast-enhanced MRI for differentiating radiologically indeterminate malignant from benign orbital masses. Clin Radiol (2017) 72:903.e9–903.e15. doi: 10.1016/j.crad.2017.04.007
6. Sasaki M, Sumi M, Eida S, Ichikawa Y, Sumi T, Yamada T, et al. Multiparametric MR imaging of sinonasal diseases: time-signal intensity curve- and apparent diffusion coefficient-based differentiation between benign and malignant lesions. AJNR Am J Neuroradiol (2011) 32:2154–9. doi: 10.3174/ajnr.A2675
7. Yu XP, Hou J, Li FP, Xiang W, Lu Q, Hu Y, et al. Quantitative dynamic contrast-enhanced and diffusion-weighted MRI for differentiation between nasopharyngeal carcinoma and lymphoma at the primary site. Dentomaxillofac Radiol (2016) 45:20150317. doi: 10.1259/dmfr.20150317
8. Song C, Cheng P, Cheng J, Zhang Y, Sun M, Xie S, et al. Differential diagnosis of nasopharyngeal carcinoma and nasopharyngeal lymphoma based on DCE-MRI and RESOLVE-DWI. Eur Radiol (2020) 30:110–8. doi: 10.1007/s00330-019-06343-0
9. Koyasu S, Iima M, Umeoka S, Morisawa N, Porter DA, Ito J, et al. The clinical utility of reduced-distortion readout-segmented echo-planar imaging in the head and neck region: initial experience. Eur Radiol (2014) 24:3088–96. doi: 10.1007/s00330-014-3369-5
10. Holdsworth SJ, Skare S, Newbould RD, Guzmann R, Blevins NH, Bammer R. Readout-segmented EPI for rapid high resolution diffusion imaging at 3T. Eur J Radiol (2008) 65:36–46. doi: 10.1016/j.ejrad.2007.09.016
11. de Perrot T, Lenoir V, Domingo Ayllón M, Dulguerov N, Pusztaszeri M, Becker M. Apparent diffusion coefficient histograms of human papillomavirus-positive and human papillomavirus-negative head and neck squamous cell carcinoma: assessment of tumor heterogeneity and comparison with histopathology. AJNR Am J Neuroradiol (2017) 38:2153–60. doi: 10.3174/ajnr.A5370
12. Meyer HJ, Leifels L, Hamerla G, Höhn AK, Surov A. ADC-histogram analysis in head and neck squamous cell carcinoma. Associations with different histopathological features including expression of EGFR, VEGF, HIF-1α, Her 2 and p53. A preliminary study. Magn Reson Imaging (2018) 54:214–7. doi: 10.1016/j.mri.2018.07.013
13. Schob S, Meyer HJ, Dieckow J, Pervinder B, Pazaitis N, Höhn AK, et al. Histogram analysis of diffusion weighted imaging at 3T is useful for prediction of lymphatic metastatic spread, proliferative activity, and cellularity in thyroid cancer. Int J Mol Sci (2017) 18:821. doi: 10.3390/ijms18040821
14. Schob S, Voigt P, Bure L, Meyer HJ, Wickenhauser C, Behrmann C, et al. Diffusion-weighted imaging using a readout-segmented, multishot EPI sequence at 3 T distinguishes between morphologically differentiated and undifferentiated subtypes of thyroid carcinoma-a preliminary study. Transl Oncol (2016) 9:403–10. doi: 10.1016/j.tranon.2016.09.001
15. Woo S, Cho JY, Kim SY, Kim SH. Histogram analysis of apparent diffusion coefficient map of diffusion-weighted MRI in endometrial cancer: a preliminary correlation study with histological grade. Acta Radiol (2014) 55:1270–7. doi: 10.1177/0284185113514967
16. Cho SH, Kim GC, Jang YJ, Ryeom H, Kim HJ, Shin KM, et al. Locally advanced rectal cancer: post-chemoradiotherapy ADC histogram analysis for predicting a complete response. Acta Radiol (2015) 56:1042–50. doi: 10.1177/0284185114550193
17. Wang YJ, Xu XQ, Hu H, Su GY, Shen J, Shi HB, et al. Histogram analysis of apparent diffusion coefficient maps for the differentiation between lymphoma and metastatic lymph nodes of squamous cell carcinoma in head and neck region. Acta Radiol (2018) 59:672–80. doi: 10.1177/0284185117730688
18. Ryu YJ, Choi SH, Park SJ, Yun TJ, Kim JH, Sohn CH. Glioma: application of whole-tumor texture analysis of diffusion-weighted imaging for the evaluation of tumor heterogeneity. PloS One (2014) 9:e108335. doi: 10.1371/journal.pone.0108335
19. Rodriguez Gutierrez D, Awwad A, Meijer L, Manita M, Jaspan T, Dineen RA, et al. Metrics and Textural Features of MRI Diffusion to Improve Classification of Pediatric Posterior Fossa Tumors. AJNR Am J Neuroradiol (2014) 35:1009–15. doi: 10.3174/ajnr.A3784
20. Emblem KE, Nedregaard B, Nome T, Due-Tonnessen P, Hald JK, Scheie D, et al. Glioma grading by using histogram analysis of blood volume heterogeneity from MR derived cerebral blood volume maps. Radiology (2008) 247:808–17. doi: 10.1148/radiol.2473070571
21. Just N. Improving tumour heterogeneity MRI assessment with histograms. Br J Cancer (2014) 111:2205–13. doi: 10.1038/bjc.2014.512
22. Huang WY, Li MM, Lin SM, Chen F, Yang K, Zhu XL, et al. In vivo imaging markers for prediction of radiotherapy response in patients with nasopharyngeal carcinoma: RESOLVE DWI versus DKI. Sci Rep (2018) 8:15861. doi: 10.1038/s41598-018-34072-9
23. Wang Y, Wang GJ, Ye Y, Lu YT, Wu WH, Li SL. High resolution diffusion-weighted imaging for characterising nasopharyngeal carcinoma. Zhonghua Yi Xue Za Zhi (2017) 97:1303–6. doi: 10.3760/cma.j.issn.0376-2491.2017.17.006
24. Zhao M, Liu Z, Sha Y, Wang S, Ye X, Pan Y, et al. Readout-segmented echo-planar imaging in the evaluation of sinonasal lesions: A comprehensive comparison of image quality in single-shot echo-planar imaging. Magn Reson Imaging (2016) 34:166–72. doi: 10.1016/j.mri.2015.10.010
25. Holdsworth SJ, Yeom K, Skare S, Gentles AJ, Barnes PD, Bammer R. Clinical application of readout-segmented-echo-planar imaging for diffusion-weighted imaging in pediatric brain. AJNR Am J Neuroradiol (2011) 32:1274–9. doi: 10.3174/ajnr.A2481
26. Bogner W, Pinker-Domenig K, Bickel H, Chmelik M, Weber M, Helbich TH, et al. Readout-segmented echo-planar imaging improves the diagnostic performance of diffusion-weighted MR breast examinations at 3.0 T. Radiology (2012) 263:64–76. doi: 10.1148/radiol.12111494
27. Kang Y, Choi SH, Kim YJ, Kim KG, Sohn CH, Kim JH, et al. Gliomas: Histogram analysis of apparent diffusion coefficient maps with standard- or high-b-value diffusion-weighted MR imaging–correlation with tumor grade. Radiology (2011) 261:882–90. doi: 10.1148/radiol.11110686
28. Guo AC, Cummings TJ, Dash RC, Provenzale JM. Lymphomas and high-grade astrocytomas: comparison of water diffusibility and histologic characteristics. Radiology (2002) 224(1):177–83. doi: 10.1148/radiol.2241010637
29. Fong D, Bhatia KS, Yeung D, King AD. Diagnostic accuracy of diffusion-weighted MR imaging for nasopharyngeal carcinoma, head and neck lymphoma and squamous cell carcinoma at the primary site. Oral Oncol (2010) 46:603–6. doi: 10.1016/j.oraloncology.2010.05.004
30. Guan Y, Shi H, Chen Y, Liu S, Li W, Jiang Z, et al. Whole-lesion histogram analysis of apparent diffusion coefficient for the assessment of cervical cancer. J Comput Assist Tomogr (2016) 40:212–7. doi: 10.1097/RCT.0000000000000349
31. Takahashi M, Kozawa E, Tanisaka M, Hasegawa K, Yasuda M, Sakai F. Utility of histogram analysis of apparent diffusion coefficient maps obtained using 3.0T MRI for distinguishing uterine carcinosarcoma from endometrial carcinoma. J Magn Reson Imaging (2016) 43:1301–7. doi: 10.1002/jmri.25103
Keywords: nasopharyngeal carcinoma, lymphoma, magnetic resonance imaging, diffusion magnetic resonance imaging, histogram
Citation: Song C, Cheng P, Cheng J, Zhang Y and Xie S (2021) Value of Apparent Diffusion Coefficient Histogram Analysis in the Differential Diagnosis of Nasopharyngeal Lymphoma and Nasopharyngeal Carcinoma Based on Readout-Segmented Diffusion-Weighted Imaging. Front. Oncol. 11:632796. doi: 10.3389/fonc.2021.632796
Received: 24 November 2020; Accepted: 29 January 2021;
Published: 12 March 2021.
Edited by:
Alexey Surov, Leipzig University, GermanyReviewed by:
Hans-Jonas Meyer, Leipzig University, GermanyStefan Schob, Universitätsklinikum Leipzig, Germany
Copyright © 2021 Song, Cheng, Cheng, Zhang and Xie. This is an open-access article distributed under the terms of the Creative Commons Attribution License (CC BY). The use, distribution or reproduction in other forums is permitted, provided the original author(s) and the copyright owner(s) are credited and that the original publication in this journal is cited, in accordance with accepted academic practice. No use, distribution or reproduction is permitted which does not comply with these terms.
*Correspondence: Jingliang Cheng, cheng_jl332@163.com
†These authors have contributed equally to this work