 Min Tang1†
 Qianrong Xie2†
 Jiasi Wang2†
 Xiaoyu Zhai3†Hong Lin4Xiaoxue Zheng1Guoli Wei1Yan Tang1Fanwei Zeng1Yanpeng Chu2
 Jianqiong Song1*Jianqiang Cai5*
 Fanxin Zeng2*
- 1Department of Ultrasound Imaging, Dazhou Central Hospital, Dazhou, China
- 2Department of Clinical Research Center, Dazhou Central Hospital, Dazhou, China
- 3Key Laboratory of Carcinogenesis and Translational Research (Ministry of Education/Beijing), Department of Thoracic Medical Oncology, Peking University Cancer Hospital and Institute, Beijing, China
- 4Department of Public Health Information, Sichuan Center for Disease Control and Prevention, Chengdu, China
- 5Department of Hepatobiliary Surgery, National Cancer Center/Cancer Hospital, Chinese Academy of Medical Sciences and Peking Union Medical College, Beijing, China
Introduction: Worldwide, the incidence and mortality of lung cancer are at the highest levels, and the most lesions are located in the lung periphery. Despite extensive screening and diagnosis, the pathologic types of peripheral pulmonary lesions (PPLs) are difficult to diagnose by noninvasive examination. This study aimed to identify a novel index—time difference of arrival (TDOA)—to discriminate between benign inflammation and malignant PPLs.
Methods: Using contrast-enhanced ultrasound (CEUS), we retrospectively analyzed 96 patients with PPLs who had undergone biopsy to confirm the pathologic types. All data were collected from Dazhou Central Hospital between December 2012 and July 2019. The parameters of CEUS were analyzed by two assistant chief physicians of ultrasound diagnosis. Area under the receiver operating characteristic curve analysis, sensitivity, specificity, positive predictive value, and negative predictive value were calculated to assess the diagnostic ability of different indices.
Results: We found that the TDOA significantly distinguished benign inflammation from malignant lesions. The TDOA was markedly increased in patients with malignant lesions than benign inflammation lesions (P < 0.001). Compared with conventional time-intensity curve (TIC) indices, TDOA showed high diagnostic accuracy (area under the curve = 0.894). Moreover, conventional diagnostic indices did not affect the diagnostic performance of TDOA by adjusting the receiver operating characteristic curve.
Conclusion: TDOA is feasible for the diagnosis of benign inflammation and malignant PPLs.
Introduction
Lung cancer is one of the most common malignant tumors in the world with the highest incidence and mortality (1). According to the location of the tumor, lung cancer is divided into central type and peripheral type. Peripheral lung cancer accounts for about 70% of all lung cancer types and is difficult to be diagnosed with no obvious symptoms (2). The 5-year survival rate of lung cancer is about 70%–90% in the early stage (3–5), but approximately 75% patients are first diagnosed only in an advanced stage (6).
Common clinical methods such as dynamic contrast-enhanced magnetic resonance imaging (7), contrast-enhanced computed tomography (8, 9), low-dose computed tomography (10), and bronchoscopy (11) are used to diagnose the lung lesions. However, these methods have obvious diagnostic shortcomings, such as exposure to heavy dose of radiation (12), high cost (13, 14), and high false positive rates (15, 16). Some studies also have shown that the diagnostic capability of bronchoscopy is significantly reduced because of the increase in distance from the hilum and the small volume of tumor (17–19). Therefore, it is essential to improve the current screening and diagnostic ability.
Peripheral pulmonary lesions (PPLs) are close to the pleura, which can be easily detected by ultrasound. Contrast-enhanced ultrasound (CEUS) is a novel technique for real-time observation of disease states by using microbubble-based contrast agents (20, 21). CEUS has found application in many conditions such as myocardial inflammation (22), type I diabetes (23), carotid plaque (24), chronic kidney disease (25), and metastatic liver disease (9). A previous study has showed that the wash-in slope, time to peak intensity (TTP) and mean transit time (MTT) analyzed by CEUS can be used to distinguish the difference between malignant thoracic injuries and benign lesions (26). However, the low sensitivity and specificity of these conventional parameters for diagnosing PPLs by time intensity curves (TICs) analysis limits the application of CEUS.
In this study, we aimed to identify a novel index to diagnose the PPLs. For this purpose, we systematically analyzed the clinical data of 96 patients with PPLs and evaluated the efficacy of using time difference of arrival (TDOA) to distinguish between benign inflammation and malignant lesions.
Materials and Methods
Patients
We retrospectively analyzed 324 patients with PPLs who had undergone CEUS and biopsy or histopathologic examination in our hospital between December 2012 and July 2019. The inclusion criteria were as follows: i) Age from 18 to 85 years old; ii) With contrast ultrasound and biopsy or histopathologic examination; iii) Under contrast conditions, all patients with peripulmonary lesions significantly enhanced after contrast-enhanced ultrasound compared with those without contrast medium injection were hypervascular lesions. The exclusion criteria were as follows: i) Patients with bleeding tendency, severe cardiac insufficiency, pulmonary hypertension, aortic aneurysm, mental disorders, and other causes of pulmonary insufficiency; ii) Patients allergic to contrast media, with poor physical condition and not cooperating with researchers. All patients were diagnosed by biopsy. 96 patients of them were included in this study and their ages ranged from 20 to 85 years (Figure 1, Table 1). Of the 96 patients, 45 had benign inflammation lesions: 37 (82.2%) and eight (17.8%) cases of nonspecific and specific inflammation, respectively. The remaining 51 patients had malignant lesions: 23 (45.1%) cases of squamous cell carcinoma and 21 (41.2%) of adenocarcinoma; the remaining seven (13.7%) patients had other malignancies. Patients were predominantly male (71.1% in the benign inflammation lesions group and 76.5% in the malignant lesions group). Left lung lesions accounted for 48.9% and 60.8% lesions in the benign inflammation and malignant lesions groups, respectively. There were no significant differences in demographic characteristics between the benign inflammation and malignant lesions groups (Table 1). The study was approved by the ethics committee of Dazhou Central Hospital (IRB00000003-19008).
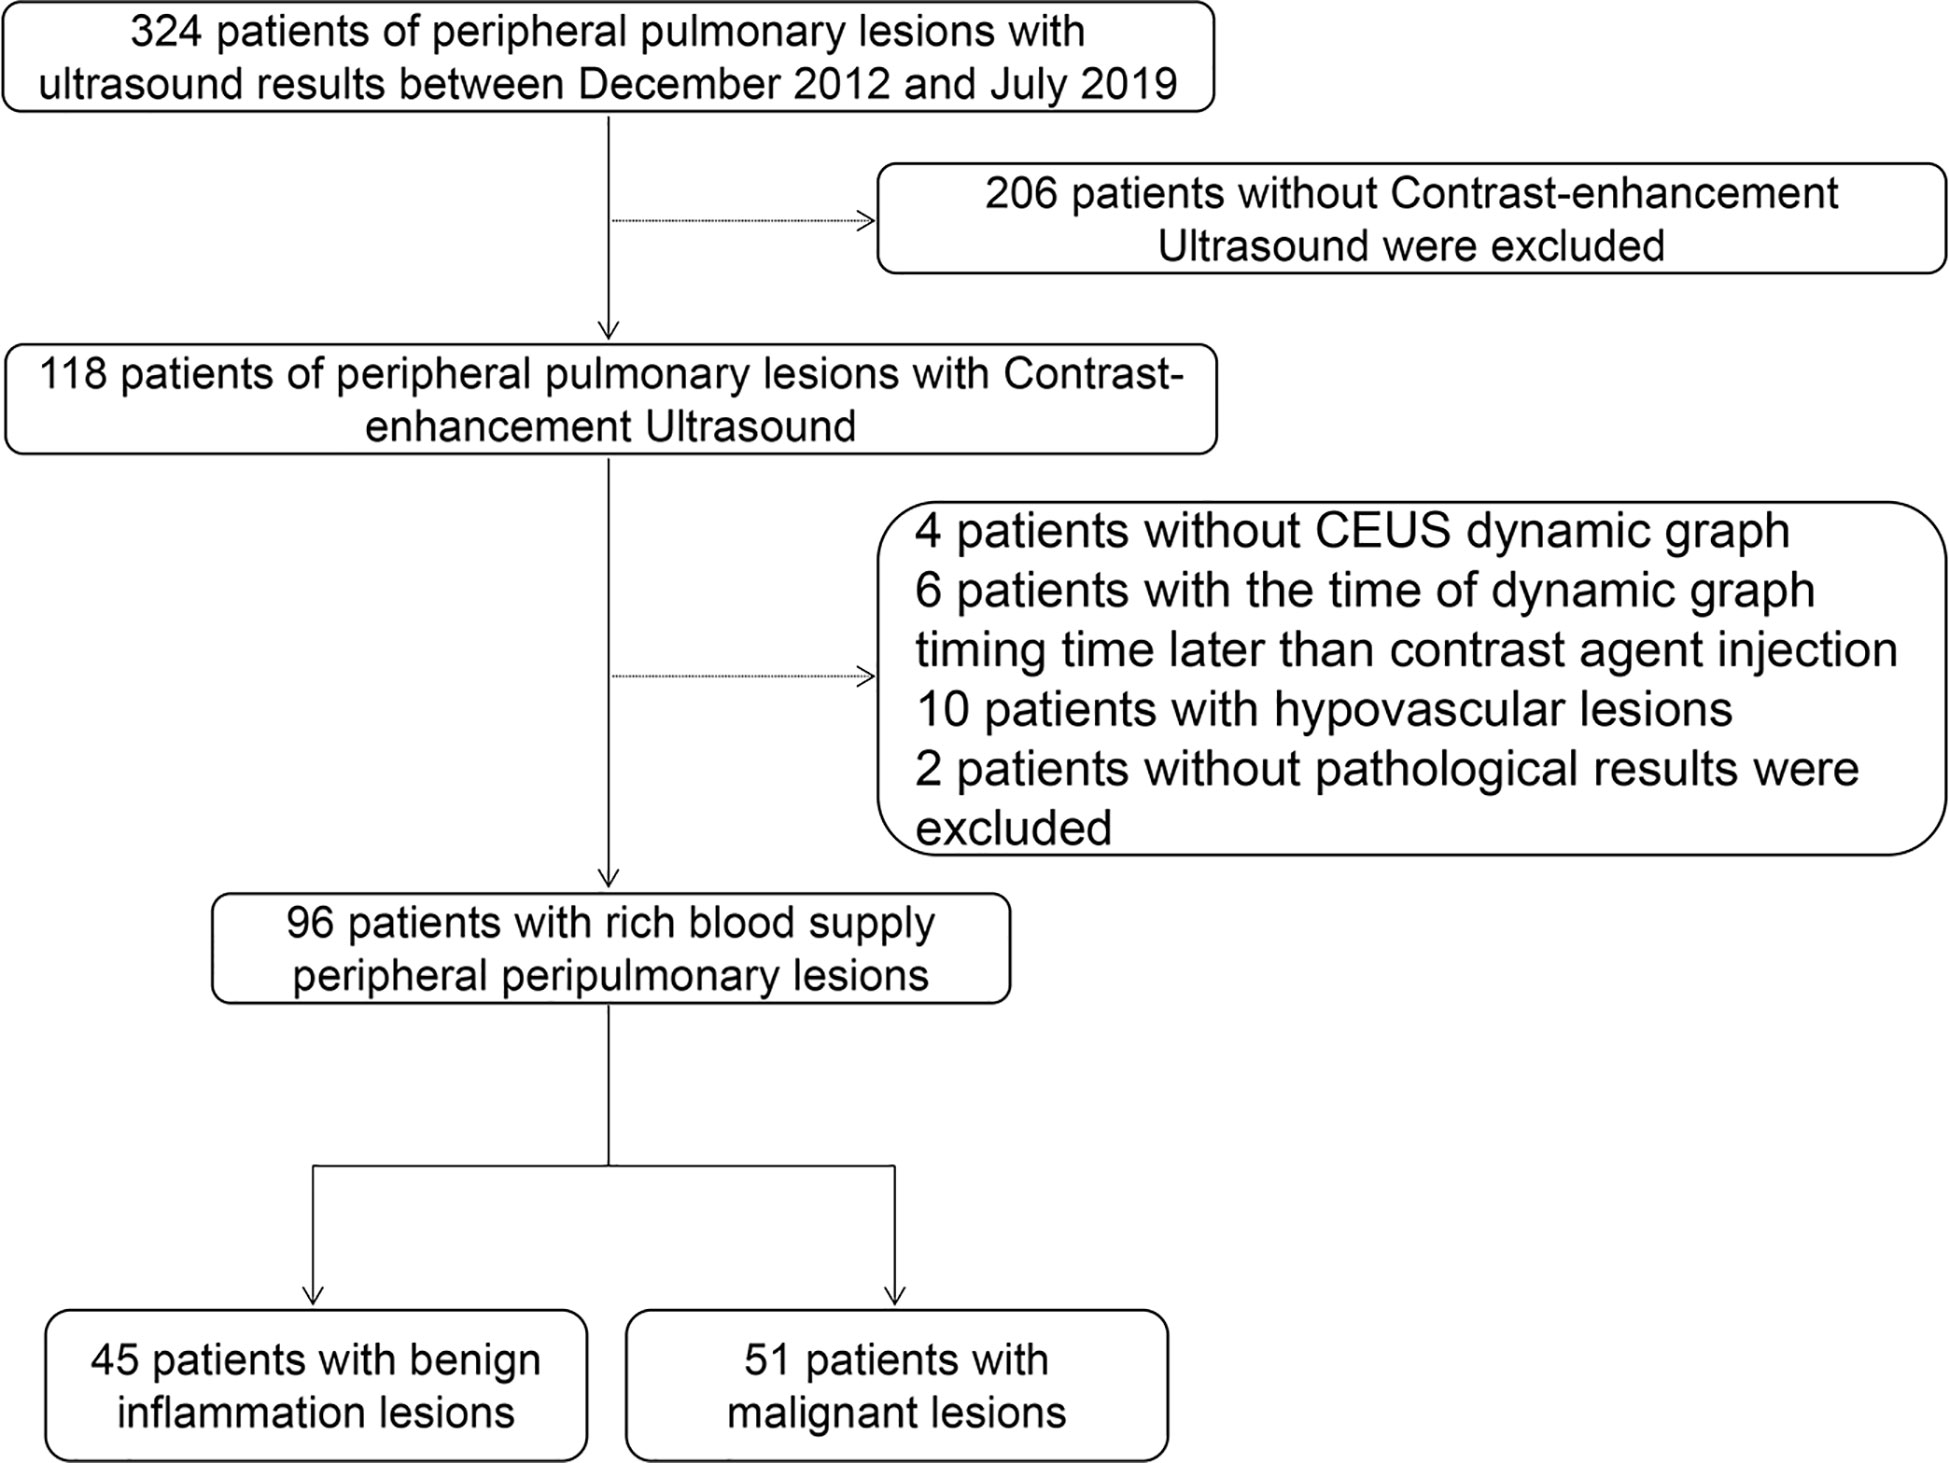
Figure 1 Workflow of the study. CEUS, contrast-enhanced ultrasound.
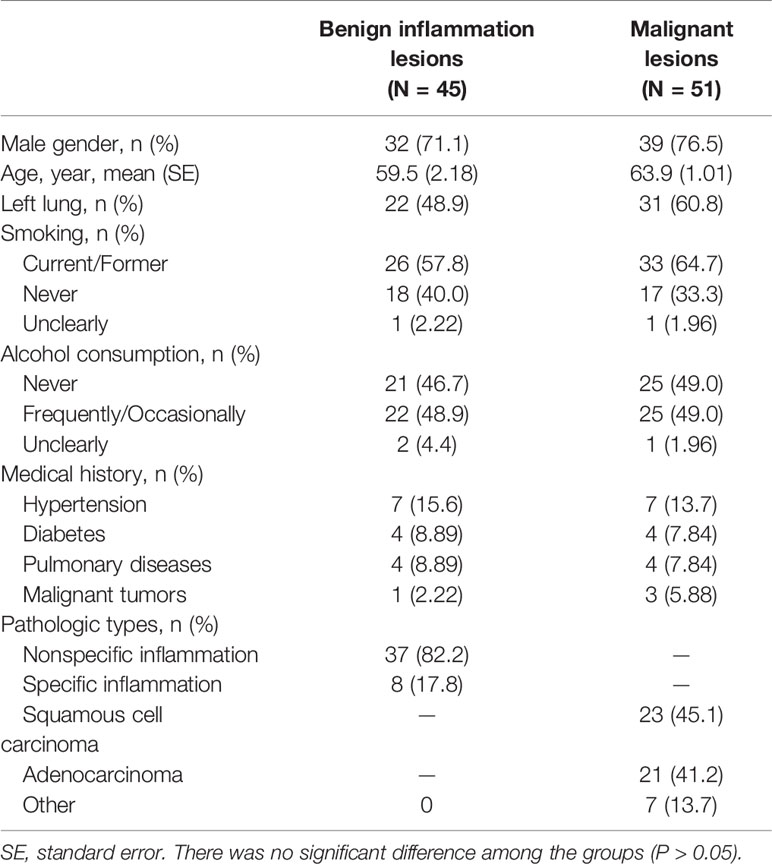
Table 1 Characteristics of 96 patients with peripheral pulmonary lesions.
Analysis of CEUS Parameters
A LOGIQ-E9 color Doppler ultrasonic diagnostic apparatus equipped with CEUS software, TIC analysis software, and a 3.5–5 MHz probe (GE Healthcare, Milwaukee, WI) were used in this study. The contrast agent for injection was white powder sulfur hexafluoride microbubble (SonoVue) for injection (Bracco SpA, Milan, Italy). Five milliliters physiological saline (0.9% NaCl) was added and agitated to form a microbubble suspension. We used conventional ultrasound to observe the size of the lesion, internal echo, and blood flow. Then, we placed the largest section of the lesion in the center of the display to initiate a double-contrast CEUS mode. Briefly, 2.4 mL sulfur hexafluoride microbubble suspensions were rapidly injected via the elbow vein, followed by a rapid bolus injection of 5 mL normal saline. The built-in timer of the ultrasound instrument was activated and observed for 3 min. All images were stored and analyzed.
Two assistant chief physicians with 5 years’ experience in ultrasound diagnosis who were blinded to the pathological diagnosis of the patient, observed the filling characteristics of the contrast agent in the lesion and performed the CEUS analysis together and reached an agreement. First, we observed the blood supply in the mass and the area where the large vessels were located, distinguished the active area from the necrotic area, traced the real part of the lesion and the adjacent lung tissue as the regions of interest (ROI), and ensured the same ROI in each depiction. Then, the TIC software that comes with the LOGIQ-E9 color Doppler ultrasound was used to quantitatively analyze the arrival time (AT) of the lesion and adjacent lung tissues. Next, we obtained the values TDOA (in triplicate) of time difference between the AT of the lesion and adjacent lung tissue (=lesion contrast agent AT-adjacent lung tissue contrast agent AT), TTP, initial intensity (II), peak intensity (PI), area under the curve (AUC), rake ratio (K), mean square error (MSE), and curve gradient and calculated the average. After the analysis, the receiver operating characteristic (ROC) curve of adjacent lung tissue, lesion contrast agent AT and TDOA were drawn. The Youden’s index was calculated to determine the best cut-off point of lesion AT and adjacent lung tissue time difference. If the arrival time was greater than the best cut-off point, the lesion was considered malignant; otherwise, it was considered benign inflammation.
Puncture Biopsy
A physician with > 5 years’ experience performed the ultrasound biopsy of all patients. Infection markers, bleeding, and coagulation time of patients were required to be normal. The blood supply and large vessels in the mass were observed, and the puncture point was located in the area with blood supply but not large vessels. During the operation, the puncture point was fixed, the distance from the sampling point in the mass was measured, the puncture area was disinfected with iodine tincture, and the puncture point was anesthetized with 2% lidocaine for local infiltration. Next, under the guidance of contrast-enhanced ultrasound, an 18G automatic biopsy gun was used for subcutaneous penetration. The obtained specimens were fixed in 10% formaldehyde solution and sent for pathological examination.
Statistical Analysis
Quantitative data were expressed as mean (standard error [SE]), and the difference between groups was analyzed by student’s t-test. The categorical data were expressed as numerical percentages. When theoretical frequency 1 ≤ N < 5, continuous correction chi-square test was used, and Pearson chi-square test was used for all theoretical frequencies n > 5. The sensitivity and specificity of the optimal cut-off point were calculated from the area under the ROC curve. The ROC curve constructed from logistic regression and the ROC-AUC difference was analyzed by the DeLong’s test. P < 0.05 was considered statistically significant. All the statistical methods were two tailed. The free degree of t-test for age, long diameter, and arrival time was 94, while the free degree of t-test for other parameters produced by the TIC analysis was 80.
Results
Ultrasound Characteristics
The mean long diameter was 5.54 cm for the benign inflammation lesions group and 7.71 cm for the malignant lesions group (P < 0.001). Benign inflammation lesions were mainly wedge shaped, while malignant lesions were mainly spherical (P < 0.001). However, the conventional two-dimensional ultrasound indicators were not specific enough for the differential diagnosis of benign inflammation and malignant lesions. In this study, the PI, II, TTP, AUC, K, MSE, and gradient values could only be obtained from 34 and 48 patients with benign inflammation and malignant lesions, respectively. Furthermore, we found that the perfusion method, TTP, and PI produced by CEUS also showed no difference between the benign inflammation and malignant lesions groups (P > 0.05) (Table 2).
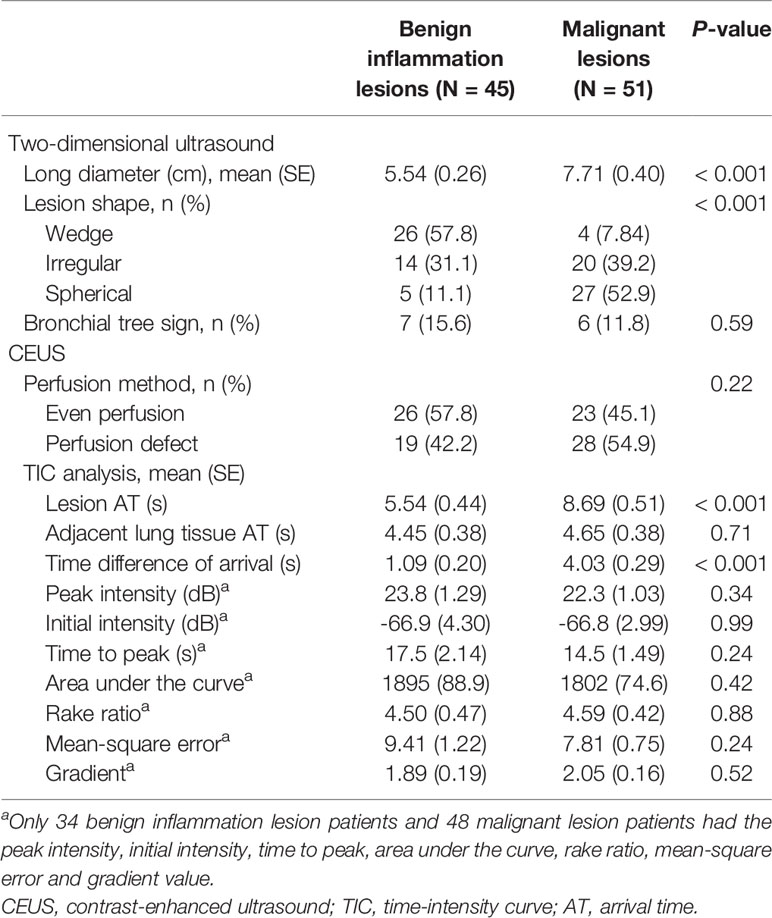
Table 2 CEUS parameters of 96 patients with peripheral pulmonary lesions.
Diagnostic Performance Comparison of Arrival Time
Based on TIC analysis, we generated the lesion AT, adjacent lung tissue AT, and a novel method of TDOA. The lesion AT and TDOA in the benign inflammation lesions group was shorter than those of the malignant lesions group (P < 0.001), but there was no difference in the adjacent lung tissue AT between both groups (Figure 2 and Figure S1). TDOA had the largest area under the curve (AUC, 0.894), compared with the lesion arrival time (AUC, 0.785) and adjacent lung tissue arrival time (AUC, 0.495) (Figure 3). The optimal cut-off value of TDOA was 2.42 s. The sensitivity and specificity of TDOA were 86.3% (95% CI: 76.5–94.1) and 88.9% (95% CI: 80.0–97.8), respectively. Positive predictive value (PPV) and negative predictive value (NPV) were 85.1% (95% CI: 71.7–93.8) and 89.8% (95% CI: 77.8–96.6), respectively (Table 3). The PPV and NPV of TDOA were higher than the lesion AT and adjacent lung tissue AT.
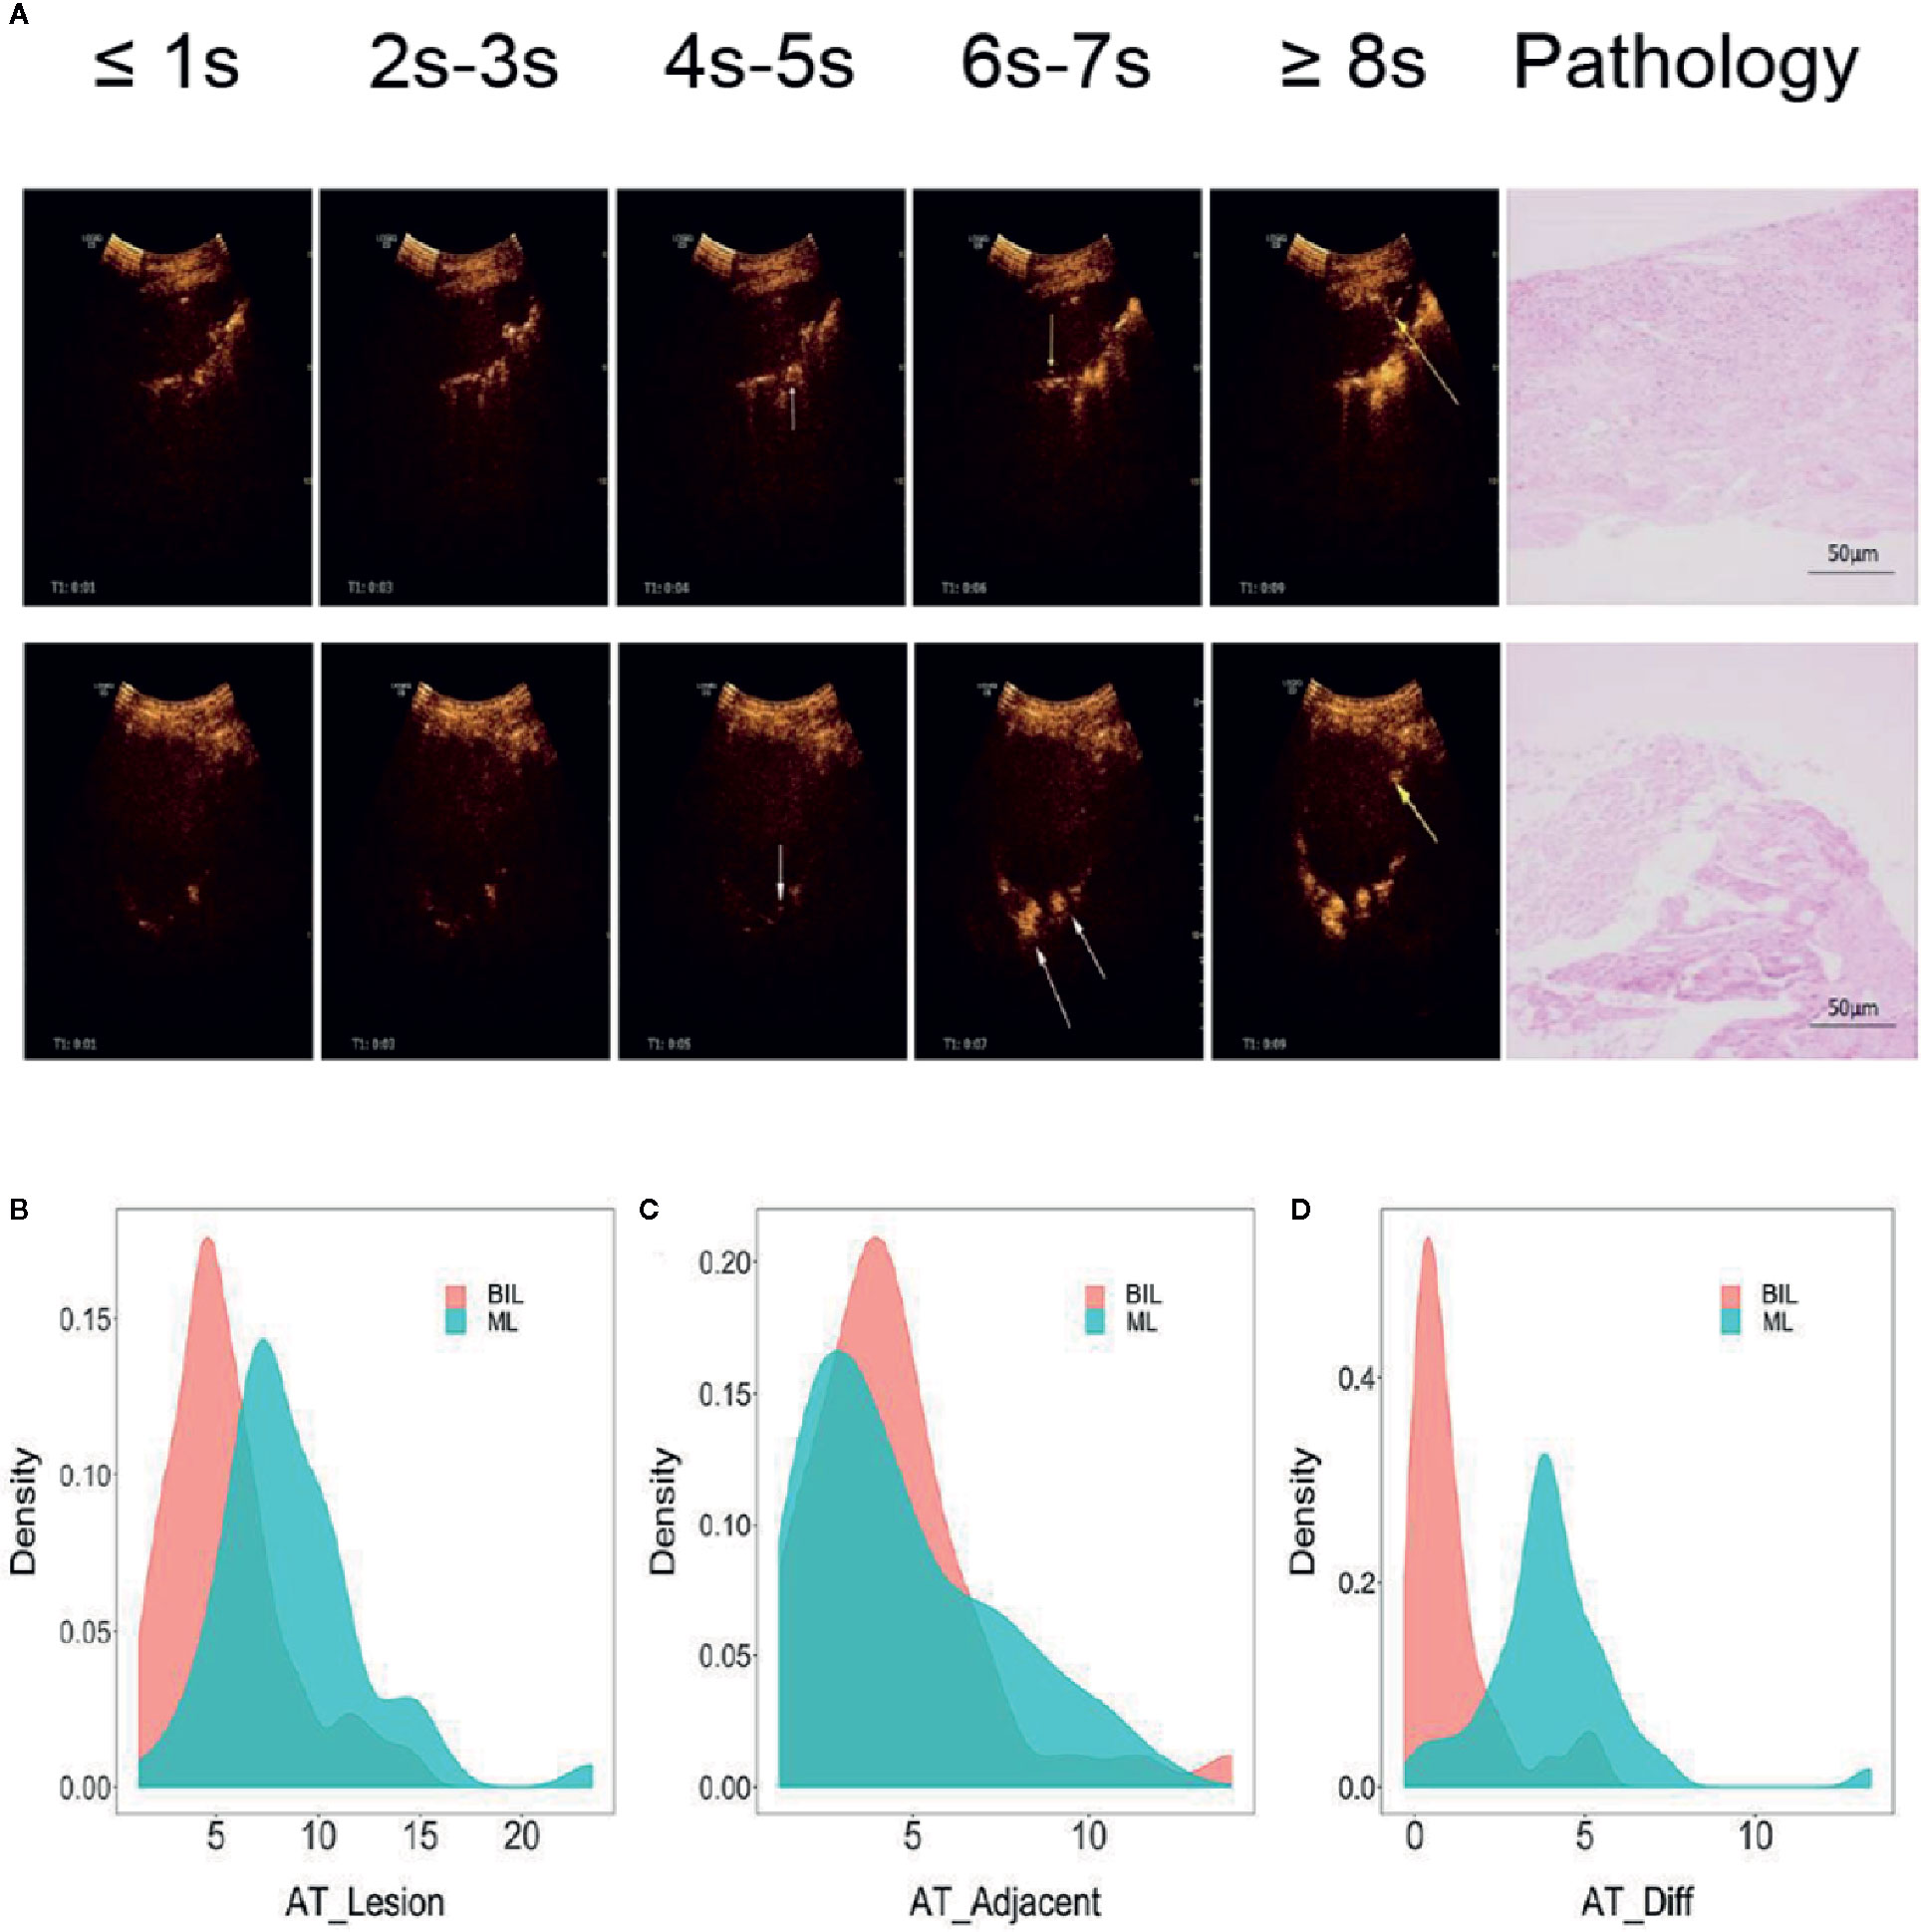
Figure 2 Typical images of contrast agent emerging and pathology of lung cancer and pneumonia. (A) The two left-most rows without arrows indicated that neither the lesion nor adjacent lung tissue is contrast-free. White arrows indicated that adjacent lung tissues begin to appear contrast agent, while yellow arrows indicated that the lesions appear contrast agent. The two right-most pictures were typical pathological images of various types. (B–D) Distribution of lesion AT, adjacent lung tissue AT, and time difference of arrival grouped by pathologic types. Benign inflammation lesions group (N = 45), malignant lesions group (N = 51), Student’s t-test. BIL, benign inflammation lesions; ML, malignant lesions; AT, arrival time; Diff, difference.
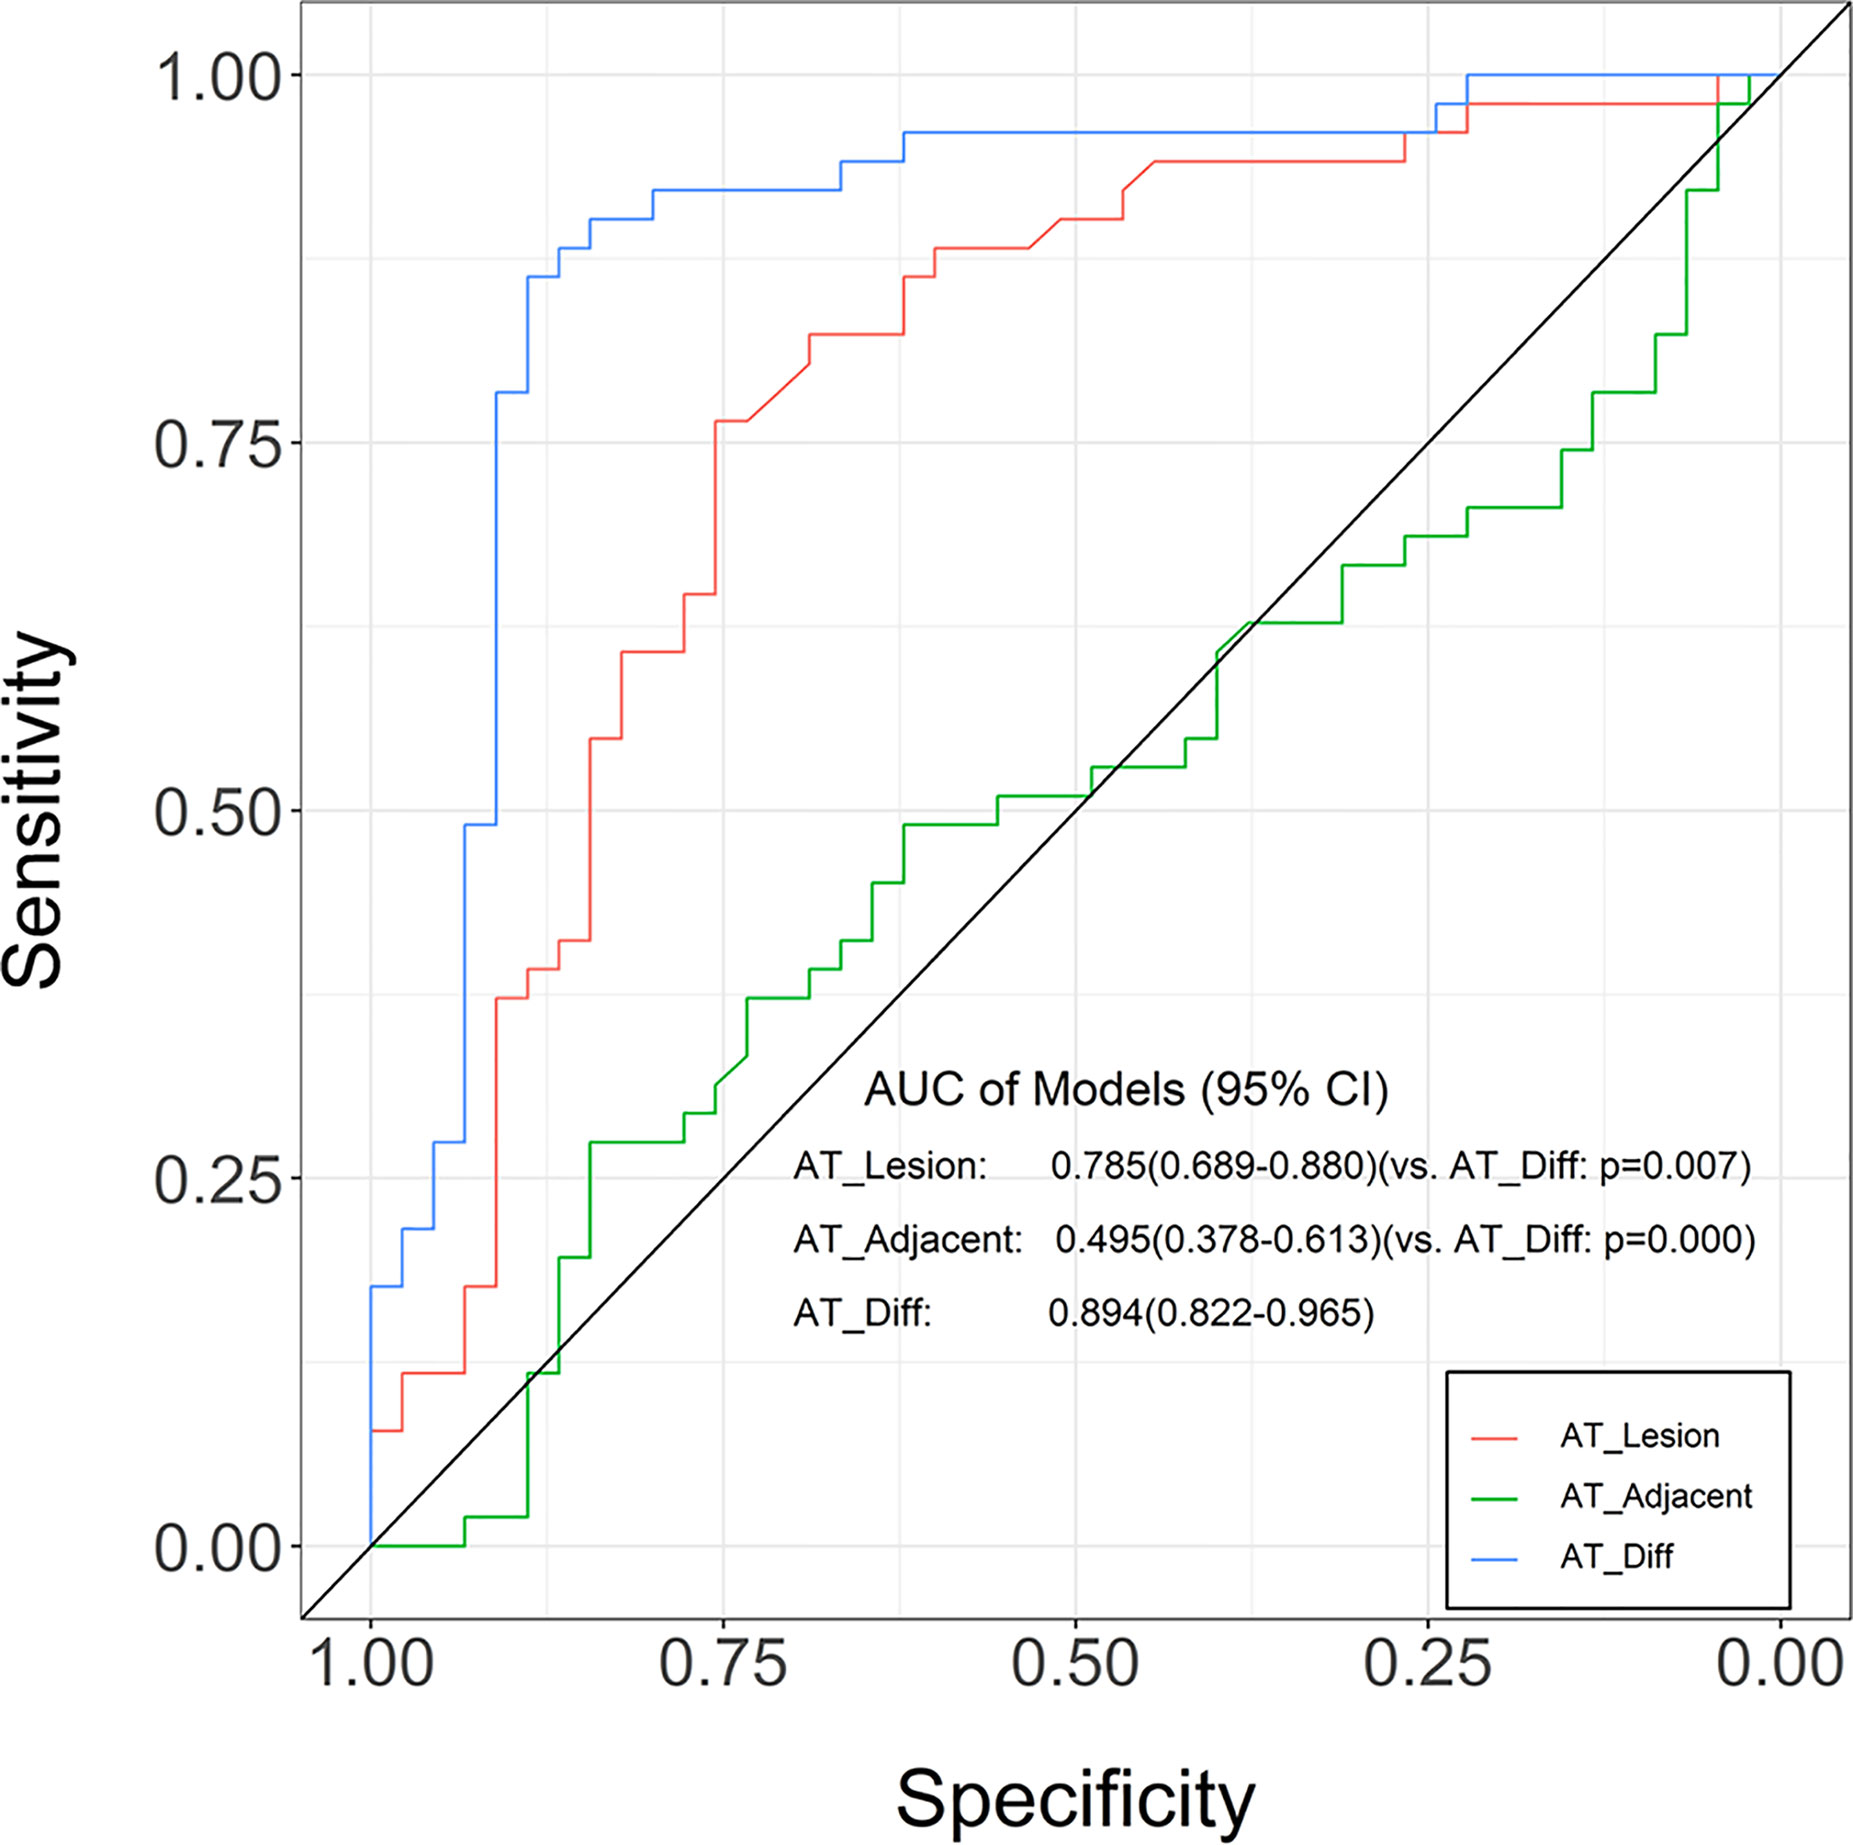
Figure 3 Receiver operating characteristic (ROC) curves for the lung tissue AT, lesion AT, and time difference of arrival in distinguishing between benign inflammation and malignant lesions. Compared with adjacent lung tissue AT and lesion AT, the time difference of arrival was greater in AUC. The ROC curve is expressed by diagnostic sensitivity and specificity. AT, arrival time; Diff, difference.
Table 3 Diagnostic performance of lesion AT, adjacent lung tissue AT, and time difference of arrival in benign inflammation lesions and malignant lesions group.
ROC Curve of TDOA Adjusted by the Index of Patients
To evaluate whether other CEUS parameters or clinical information affected the prediction performance of TDOA, we used different indicators to adjust the ROC curve. The adjusted ROC curve showed that other indicators such as age or TTP did not affect the diagnostic performance of TDOA (Figure 4 and Figure S2). Next, we investigated the role of AT in the subgroup analysis. The results showed that the lesion AT and adjacent lung tissue AT could not distinguish between non-specific and specific inflammation. Significantly, TDOA could differentiate between the two groups well (Figure S3). However, all AT parameters did not distinguish between squamous cell carcinoma and adenocarcinoma (Figure S4).
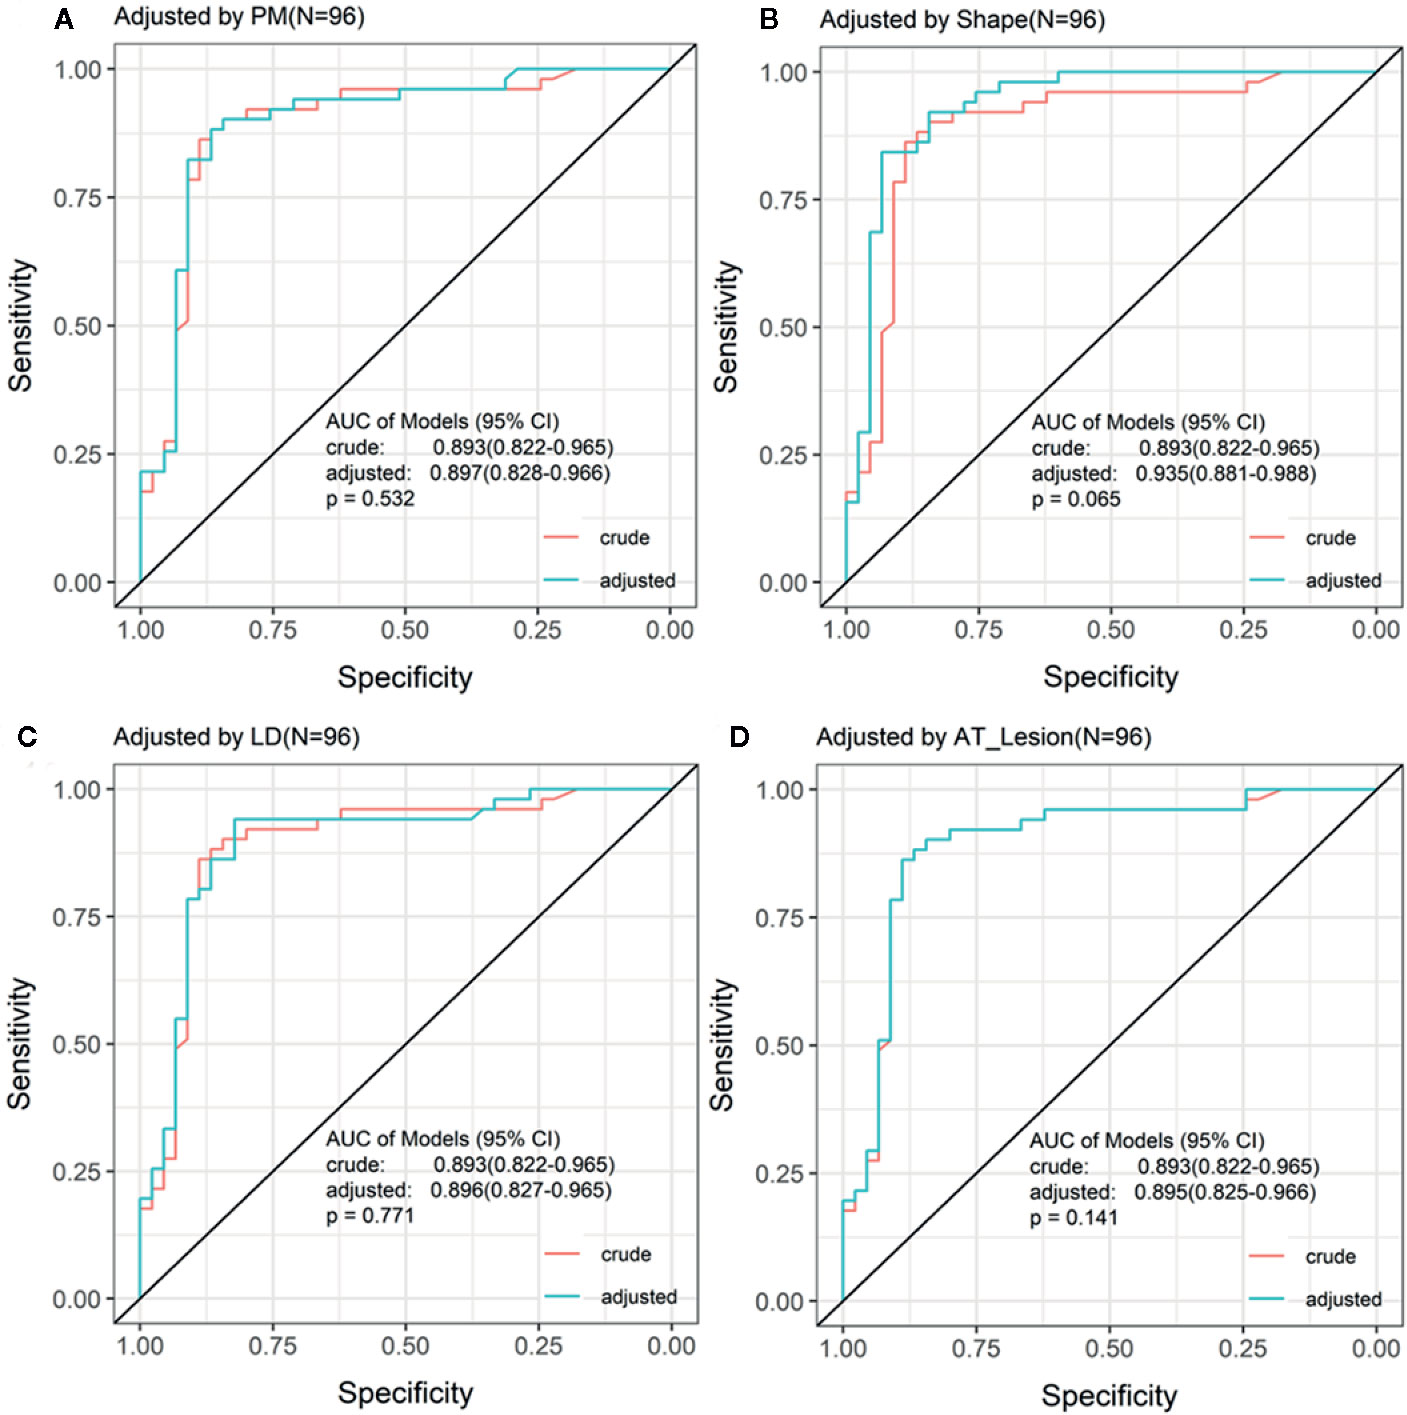
Figure 4 Receiving operating characteristic (ROC) curve adjusted by the indices of patients. The ROC curve adjusted by the top four different indices for patients. There was no significant difference between crude ROC and adjusted ROC curve. AT, arrival time; PM, perfusion method.
Discussion
Although many imaging technologies have been used to diagnose the PPLs, there are considerable limitations, especially in terms of diagnostic capability (17), cost (13), and radiation exposure (12), which pose challenges to PPLs diagnosis. In this study, we identified a novel method for the differential diagnosis of benign inflammation and malignant PPLs using TDOA produced by CEUS. Our results showed that the TDOA was significantly increased in the malignant lesions group than the benign inflammation lesions group. Notably, conventional diagnostic parameters did not affect the diagnostic performance of TDOA.
Previous study has indicated that CEUS divides the arterial phases into pulmonary and bronchial in the PPLs, and the pulmonary artery phase is slightly earlier than the bronchial artery phase (27). In this study, we found that the TDOA of the malignant lesions group (4.03 s) was significantly longer than the benign inflammation lesions group (1.09 s). This finding is supported by previous studies that showed that the blood supply of malignant tumors mainly originates from the bronchial artery, while the blood supply of non-neoplastic pulmonary lesions comes from the pulmonary and bronchial arteries (28).
A large body of evidence has debated the value of CEUS in diagnosing lung diseases (29, 30). We found that TDOA produced by CEUS could well distinguish between benign inflammation and malignant lesions (AUC: 0.894). In addition, compared to the lesion AT, the TDOA excluded the influence of the patient’s heart function (31), blood supply status of the lesion area, and injection rate of the contrast agent (26). In our study, the TDOA had a higher sensitivity and specificity than the lesion AT and the adjacent lung tissue AT. Based on TIC analysis, we generated many parameters such as TTP. No significant differences were found between the benign inflammation and malignant lesions group (Table 2). Our findings are distinct from previously reported data on the role of TTP (26). These results suggested that the diagnostic performance of TDOA was better than the conventional parameters. Furthermore, our results showed that there was no significant difference between the crude and adjusted ROC curve, indicating that other indicators did not affect the diagnostic performance of TDOA.
Our study has some limitations. First, it was a single-center study and the number of patients was relatively small. Second, the major type of benign lesions were inflammation. More pathologic types of benign lesions are required to validate the applicability of TDOA. Last, it was a retrospective study.
Conclusions
We systemically analyzed and validated TDOA produced by CEUS to distinguish between benign inflammation and malignant PPLs with high diagnostic accuracy. These findings showed that the TDOA could be a feasible, sensitive, and specific method to diagnose PPLs.
Data Availability Statement
The raw data supporting the conclusions of this article will be made available by the authors, without undue reservation.
Ethics Statement
The study was approved by the Ethics Committee of Dazhou Central Hospital (IRB00000003-19008). The Ethics Committee waived the need for patients to sign informed consent.
Author Contributions
FXZ designed the study, revised the manuscript, and the figure. MT analyzed the CEUS parameters. QX drafted the manuscript and analyzed the data. JW analyzed the data. XYZ and JC revised the manuscript. HL collected the clinical characteristics and information. XXZ collected the clinical characteristics and information. GW analyzed the TICs. YT analyzed the TICs. FWZ organized the basic data. YC revised the manuscript and organized the basic data. JS recruited patients with PPLs and collected the clinical characteristics and information. All authors contributed to the article and approved the submitted version.
Funding
This study was funded by the National Natural Science Foundation of China (81902861), “Xinglin Scholars” Scientific Research Project Fund of Chengdu university of traditional Chinese medicine (YYZX2019012), the Scientific Research Fund of Technology Bureau in Dazhou (17YYJC0004, 17YYJC0001), Key Research and Development Project Fund of Science and Technology Bureau in Dazhou, Sichuan Province (20ZDYF0001).
Conflict of Interest
The authors declare that the research was conducted in the absence of any commercial or financial relationships that could be construed as a potential conflict of interest.
Supplementary Material
The Supplementary Material for this article can be found online at: https://www.frontiersin.org/articles/10.3389/fonc.2020.578884/full#supplementary-material
References
1. Bray F, Ferlay J, Soerjomataram I, Siegel RL, Torre LA, Jemal A. Global cancer statistics 2018: GLOBOCAN estimates of incidence and mortality worldwide for 36 cancers in 185 countries. CA Cancer J Clin (2018) 68:394–424. doi: 10.3322/caac.21492
2. Akata S, Yoshimura M, Nishio R, Park J, Saito K, Uchida O, et al. High-resolution computed tomographic findings of small peripherally located squamous cell carcinoma. Clin Imaging (2008) 32:259–63. doi: 10.1016/j.clinimag.2007.10.002
3. Shah R, Sabanathan S, Richardson J, Mearns AJ, Goulden C. Results of surgical treatment of stage I and II lung cancer. J Cardiovasc Surg (Torino) (1996) 37:169–72.
4. Nesbitt JC, PJ Jr., Walsh GL, Roth JA, Mountain CF. Survival in early-stage non-small cell lung cancer. Ann Thorac Surg (1995) 60:466–72. doi: 10.1016/0003-4975(95)00169-L
5. Goldstraw P, Rami-Porta R, Asamura H, Ball D, Beer DG, Beyruti R, et al. The IASLC Lung Cancer Staging Project: Methodology and Validation Used in the Development of Proposals for Revision of the Stage Classification of NSCLC in the Forthcoming (Eighth) Edition of the TNM Classification of Lung Cancer. J Thorac Oncol (2016) 11:1433–46.
6. Mountain CF. Revisions in the International System for Staging Lung Cancer. Chest (1997) 111:1710–7. doi: 10.1378/chest.111.6.1710
7. Kono R, Fujimoto K, Terasaki H, Muller NL, Kato S, Sadohara J, et al. Dynamic MRI of solitary pulmonary nodules: comparison of enhancement patterns of malignant and benign small peripheral lung lesions. AJR Am J Roentgenol (2007) 188:26–36. doi: 10.2214/AJR.05.1446
8. Chu ZG, Sheng B, Liu MQ, Lv FJ, Li Q, Ouyang Y. Differential Diagnosis of Solitary Pulmonary Inflammatory Lesions and Peripheral Lung Cancers with Contrast-enhanced Computed Tomography. Clinics (Sao Paulo) (2016) 71:555–61. doi: 10.6061/clinics/2016(10)01
9. Dietrich CF, Kratzer W, Strobe D, Danse E, Fessl R, Bunk A, et al. Assessment of metastatic liver disease in patients with primary extrahepatic tumors by contrast-enhanced sonography versus CT and MRI. World J Gastroenterol (2006) 12:1699–705. doi: 10.3748/wjg.v12.i11.1699
10. National Lung Screening Trial Research T, Aberle DR, Adams AM, Berg CD, Black WC, Clapp JD, et al. Reduced lung-cancer mortality with low-dose computed tomographic screening. N Engl J Med (2011) 365:395–409. doi: 10.1056/NEJMoa1102873
11. Greenhill SR, Kovitz KL. Flexible Bronchoscopy. 3rd ed. The United States of America: Wiley-Blackwell (2012).
12. Salminen E, Niiniviita H, Järvinen H, Heinävaara SJAR. Cancer Death Risk Related to Radiation Exposure from Computed Tomography Scanning Among Testicular Cancer Patients. Anticancer Res (2017) 37:831–4. doi: 10.21873/anticanres.11385
13. Nordin AB, Sales S, Nielsen JW, Adler B, Bates DG, Kenney B. Standardized ultrasound templates for diagnosing appendicitis reduce annual imaging costs. J Surg Res (2018) 221:77–83. doi: 10.1016/j.jss.2017.07.002
14. Meier-Schroers M, Homsi R, Gieseke J, Schild HH, Thomas D. Lung cancer screening with MRI: Evaluation of MRI for lung cancer screening by comparison of LDCT- and MRI-derived Lung-RADS categories in the first two screening rounds. Eur Radiol (2019) 29:898–905. doi: 10.1007/s00330-018-5607-8
15. Pinsky PF, Bellinger CR, Miller DP. False-positive screens and lung cancer risk in the National Lung Screening Trial: Implications for shared decision-making. J Med Screen (2017) 25:110–2. doi: 10.1177/0969141317727771
16. Shen H. Low-dose CT for lung cancer screening: opportunities and challenges. Front Med (2017) 12:116–21. doi: 10.1007/s11684-017-0600-1
17. Baaklini WA, Reinoso MA, Gorin AB, Sharafkaneh A, Manian P. Diagnostic yield of fiberoptic bronchoscopy in evaluating solitary pulmonary nodules. Chest (2000) 117:1049–54. doi: 10.1378/chest.117.4.1049
18. Schreiber G, McCrory DC. Performance characteristics of different modalities for diagnosis of suspected lung cancer: summary of published evidence. Chest (2003) 123:115S–28S. doi: 10.1378/chest.123.1_suppl.115S
19. Dhillon SS, Harris K. Bronchoscopy for the diagnosis of peripheral lung lesions. J Thorac Dis (2017) 9:S1047–58. doi: 10.21037/jtd.2017.05.48
20. Schneider A, Johnson L, Goodwin M, Schelleman A, Bellomo R. Bench-to-bedside review: contrast enhanced ultrasonography–a promising technique to assess renal perfusion in the ICU. Crit Care (2011) 15:157. doi: 10.1186/cc10058
21. Correas JM, Bridal L, Lesavre A, Mejean A, Claudon M, Helenon O. Ultrasound contrast agents: properties, principles of action, tolerance, and artifacts. Eur Radiol (2001) 11:1316–28. doi: 10.1007/s003300100940
22. Steinl DC, Xu L, Khanicheh E, Ellertsdottir E, Ochoa-Espinosa A, Mitterhuber M, et al. Noninvasive Contrast-Enhanced Ultrasound Molecular Imaging Detects Myocardial Inflammatory Response in Autoimmune Myocarditis. Circ Cardiovasc Imaging (2016) 9:e004720. doi: 10.1161/CIRCIMAGING.116.004720
23. St Clair JR, Ramirez D, Passman S, Benninger RKP. Contrast-enhanced ultrasound measurement of pancreatic blood flow dynamics predicts type 1 diabetes progression in preclinical models. Nat Commun (2018) 9:1742. doi: 10.1038/s41467-018-03953-y
24. Nakamura J, Nakamura T, Deyama J, Fujioka D, Kawabata K, Obata JE, et al. Assessment of carotid plaque neovascularization using quantitative analysis of contrast-enhanced ultrasound imaging is useful for risk stratification in patients with coronary artery disease. Int J Cardiol (2015) 195:113–9. doi: 10.1016/j.ijcard.2015.05.107
25. Cao W, Cui S, Yang L, Wu C, Liu J, Yang F, et al. Contrast-Enhanced Ultrasound for Assessing Renal Perfusion Impairment and Predicting Acute Kidney Injury to Chronic Kidney Disease Progression. Antioxid Redox Signal (2017) 27:1397–411. doi: 10.1089/ars.2017.7006
26. Qureshi NR, Hintze C, Risse F, Kopp-Schneider A, Eberhardt R, Kauczor HU, et al. The feasibility of low mechanical index contrast enhanced ultrasound (CEUS) in distinguishing malignant from benign thoracic lesions. Ultrasound Med Biol (2011) 37:1747–54. doi: 10.1016/j.ultrasmedbio.2011.08.003
27. Hong-Xia Z, Wen H, Ling-Gang C, Wen-Jia C, Shuo L, Li-Juan D, et al. New Method for Discriminating between Bronchial and Pulmonary Arterial Phases using Contrast-Enhanced Ultrasound. Ultrasound Med Biol (2016) 42:1441–9. doi: 10.1016/j.ultrasmedbio.2016.01.029
28. Eldridge L, Moldobaeva A, Zhong Q, Jenkins J, Snyder M, Brown RH, et al. Bronchial Artery Angiogenesis Drives Lung Tumor Growth. Cancer Res (2016) 76:5962–9. doi: 10.1158/0008-5472.CAN-16-1131
29. Yin S, Cui Q, Wang S, Fan Z, Yan K. Analysis of Contrast-Enhanced Ultrasound Perfusion Patterns and Time-Intensity Curves for Metastatic Lymph Nodes From Lung Cancer: Preliminary Results. J Ultrasound Med (2018) 37:385–95. doi: 10.1002/jum.14345
30. Sperandeo M, Rea G, Grimaldi MA, Trovato F, Dimitri LM, Carnevale V. Contrast-enhanced ultrasound does not discriminate between community acquired pneumonia and lung cancer. Thorax (2017) 72:178–80. doi: 10.1136/thoraxjnl-2016-208913
Keywords: contrast-enhanced ultrasound, peripheral pulmonary lesions, time difference of arrival, benign inflammation lesions, malignant lesions
Citation: Tang M, Xie Q, Wang J, Zhai X, Lin H, Zheng X, Wei G, Tang Y, Zeng F, Chu Y, Song J, Cai J and Zeng F (2020) Time Difference of Arrival on Contrast-Enhanced Ultrasound in Distinguishing Benign Inflammation From Malignant Peripheral Pulmonary Lesions. Front. Oncol. 10:578884. doi: 10.3389/fonc.2020.578884
Received: 01 July 2020; Accepted: 15 October 2020;
Published: 12 November 2020.
Edited by:
Lu Yang, Sichuan University, ChinaReviewed by:
Shandong Yu, Capital Medical University, ChinaHanxue Zhao, Capital Medical University, China
Copyright © 2020 Tang, Xie, Wang, Zhai, Lin, Zheng, Wei, Tang, Zeng, Chu, Song, Cai and Zeng. This is an open-access article distributed under the terms of the Creative Commons Attribution License (CC BY). The use, distribution or reproduction in other forums is permitted, provided the original author(s) and the copyright owner(s) are credited and that the original publication in this journal is cited, in accordance with accepted academic practice. No use, distribution or reproduction is permitted which does not comply with these terms.
*Correspondence: Jianqiong Song, 2695521198@qq.com; Jianqiang Cai, caijianqiang188@sina.com; Fanxin Zeng, zengfx@pku.edu.cn
†These authors have contributed equally to this work